Embed Size (px)
Citation preview

Lecture 12: Effective Population Size and Gene Flow
February 21, 2014

Midterm Survey Results Not TOOO painful More in-class problems Better integration with lab Improve lab lectures and orientation Improve lab environment Mixed results on “active learning” activities
in lecture Reading and discussing current papers: next
year for grad students

Last Time
Interactions of drift and selection
Effective population size

Today
Effective population size calculations
Historical importance of drift: shifting balance or noise?
Population structure

Factors Reducing Effective Population Size
Unequal number of breeding males and females
Unequal reproductive success
Changes in population size through time
Bottlenecks
Founder Effects

Table courtesy of K. Ritland
Effective Population Size: Effects of Different Numbers of Males and Females
See Hedrick (2011) page 213 for derivation

Elephant Seals Practice extreme polygyny: one
male has a harem with many females
Examined reproductive success of males using paternity analysis on Falkland Islands
Results:
7 harems with 334 females
32 mating males detected
What is Ne?
What if sneaky males were unsuccessful?
Assumptions?
Fabiani et al. 2004: Behavioural Ecology 6: 961

Small population size in one generation can cause drastic reduction in diversity for many future generations
Effect is approximated by harmonic mean
Variation of population size in different generations
i
e
N
tN
1
te NNNNtN
1...
11111
321
See Hedrick (2011) page 219 for derivation

Example: Effect of Varying Population Size Through Time: Golden Lion Tamarins (Leontopithecus rosalia)
Native to coastal Brazilian Rainforests
Estimated Population Censuses:
1940: 10,000
1970: 200
2000: 2,000
What is current effective population size?
i
e
N
tN
1
http://en.wikipedia.org
http://nationalzoo.si.edu

How will genetic diversity be affected in populations that have experienced
bottlenecks and/or founder effects?

Time for an Allele to Become Fixed
Using the Diffusion Approximation to model drift
Assume ‘random walk’ of allele frequencies behaves like directional diffusion: heat through a metal rod
Yields simple and intuitive equation for predicting time to fixation:
p
ppNpT
)1ln()1(4)(
Time to fixation is linear function of population size and inversely associated with allele frequency

Drift and Heterozygosity
Heterozygosity declines over time in subpopulations
Change is inversely proportional to population size
02
11 H
NH
t
t
Expressing previous equation in terms of heterozygosity:
tt f
Nf
1
2
111 1
Remembering:
pq
Hf
21
tt fNN
f
2
11
2
11
p and q are stable through time across subpopulations, so 2pq is the same on both sides of equation: cancels

Effective population size is drastically reduced
Effect persists for a very long time
Low-frequency alleles go extinct quickly and take a long time to become fixed
Reduced heterozygosity
Genetic Implications of Bottlenecks and Founder Effects
0)2
11( H
NH t
et
q
qqNqT e )1ln()1(4
)(
For small q
Populations Recovering from Founder Effects and Bottlenecks Have Elevated Heterozygosity
Heterozygosity recovers more quickly following bottleneck/founding event than number of alleles
Rare alleles are preferentially lost, but these don’t affect heterozygosity much
Bottleneck/founding event yields heterozygosity excess when taking number of alleles into account
Founder effect also causes enhanced genetic distance from source population
Calculated using Bottleneck program
(http://www1.montpellier.inra.fr/URLB/bottleneck/bottleneck.html)

Historical View on Drift Fisher
Importance of selection in determining variation
Selection should quickly homogenize populations (Classical view)
Genetic drift is noise that obscures effects of selection
Wright
Focused more on processes of genetic drift and gene flow
Argued that diversity was likely to be quite high (Balance view)

Genotype Space and Fitness Surfaces All combinations of alleles at a locus is genotype space
Each combination has an associated fitness
A1
A2
A3
A4
A5
A1 A2 A3 A4 A5
A1A1 A1A2 A1A3 A1A4 A1A5
A1A2 A2A2 A2A3 A2A4 A2A5
A1A3 A2A3 A3A3 A3A4 A3A5
A1A4 A2A4 A3A4 A4A4 A4A5
A1A5 A2A5 A3A5 A4A5 A5A5

Fisherian View Fisher's fundamental theorem:
The rate of change in fitness of a population is proportional to the genetic variation present
Ultimate outcome of strong directional selection is no genetic variation
Most selection is directional
Variation should be minimal in natural populations

Wright's Adaptive Landscape
Representation of two sets of alleles along X and Y axis
Vertical dimension is relative fitness of combined genotype

Wright's Shifting Balance Theory
Genetic drift within 'demes' to allow descent into fitness valleys
Mass selection to climb new adaptive peak
Interdeme selection allows spread of superior demes across landscape
Sewall WrightBeebe and Rowe 2004

Can the shifting balance theory apply to real species?
How can you have demes with a widespread, abundant species?

What Controls Genetic Diversity Within Populations?
4 major evolutionary forces
Diversity
Mutation+
Drift-
Selection
+/-
Migration
+
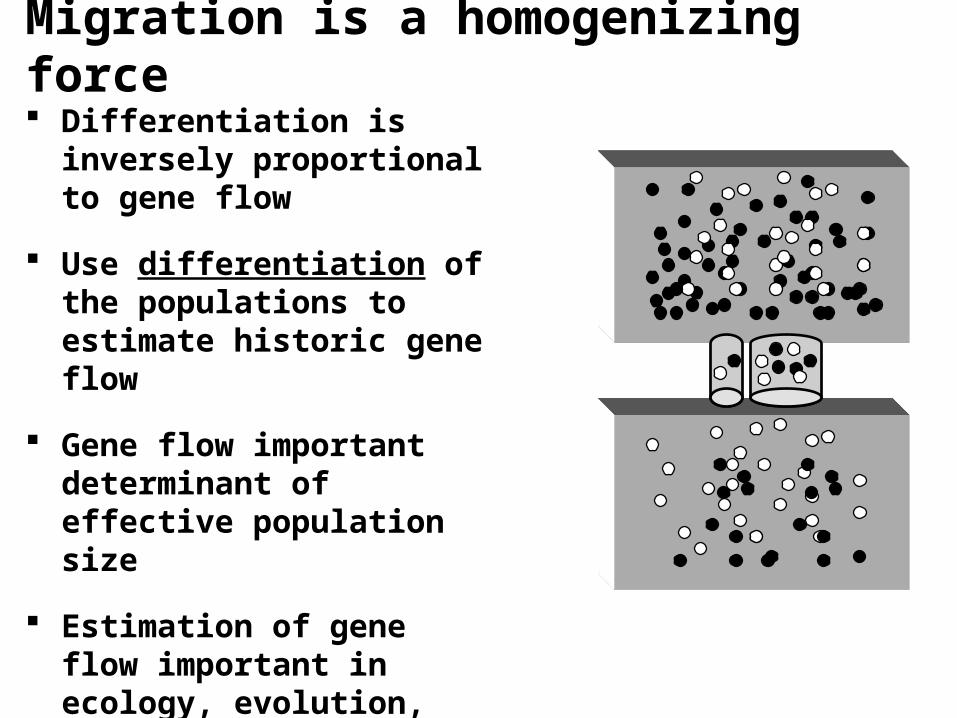
Migration is a homogenizing force Differentiation is inversely
proportional to gene flow
Use differentiation of the populations to estimate historic gene flow
Gene flow important determinant of effective population size
Estimation of gene flow important in ecology, evolution, conservation biology, and forensics

Isolation by Distance Simulation
Random Mating: Neighborhood = 99 x 99
Isolation by Distance: Neighborhood = 3x3
Each square is a diploid with color determined by codominant, two-allele locuus
Random mating within “neighborhood”
Run for 200 generations
(from Hamilton 2009 text)

Wahlund Effect
Separate Subpopulations:
HE = 2pq = 2(1)(0) = 2(0)(1) = 0
HE depends on how you define populations
HE ALWAYS exceeds HO when randomly-mating, differentiated subpopulations are
merged: Wahlund Effect
ONLY if merged population is not randomly mating as a whole!
Merged Subpopulations:
HE = 2pq = 2(0.5)(0.5) = 0.5