Embed Size (px)
Citation preview

Lecture -- 10 -- Start

Outline
1. Science, Method & Measurement
2. On Building An Index
3. Correlation & Causality
4. Probability & Statistics
5. Samples & Surveys
6. Experimental & Quasi-experimental Designs
7. Conceptual Models
8. Quantitative Models
9. Complexity & Chaos
10. Recapitulation - Envoi

Outline
1. Science, Method & Measurement
2. On Building An Index
3. Correlation & Causality
4. Probability & Statistics
5. Samples & Surveys
6. Experimental & Quasi-experimental Designs
7. Conceptual Models
8. Quantitative Models
9. Complexity & Chaos
10. Recapitulation - Envoi

Quantitative Techniques for Social Science Research
Ismail Serageldin Alexandria
2012
Lecture # 10:
Recapitulation – Envoi

Recapitulation

This Course Is About How to Think
about Social Science Research

What is Social Science?
• Social science is the field of study concerned with society and human behaviors.
• "Social science" is commonly used as an umbrella term to refer to a plurality of fields outside of the natural sciences. These include: anthropology, archaeology, criminology, economics, education, history, linguistics, communication studies, political science and international relations, sociology, geography, law, and psychology.

Outline
1. Science, Method & Measurement
2. On Building An Index
3. Correlation & Causality
4. Probability & Statistics
5. Samples & Surveys
6. Experimental & Quasi-experimental Designs
7. Conceptual Models
8. Quantitative Models
9. Complexity & Chaos
10. Recapitulation - Envoi

The Method of Science OBSERVATION: Sense specific physical realities or events.
HYPOTHESIS: Create a statement about the general REVISED
nature of the phenomenon observed. HYPOTHESIS
PREDICTION: Forecast a future occurrence PREDICTION
consistent with the hypotheses.
EXPERIMENT: Carry out a test to see if predicted EXPERIMENT
event occurs.
If results DO If results DO NOT
match prediction, match prediction RECYCLE hypothesis is
supported.

The Method of Science
Observation
Hypothesis
Prediction
Experiment
Interpretation
0.0
2.0
4.0
6.0
8.0
10.0
10.0 8.0 6.0 4.0 2.0 0.0 12.0
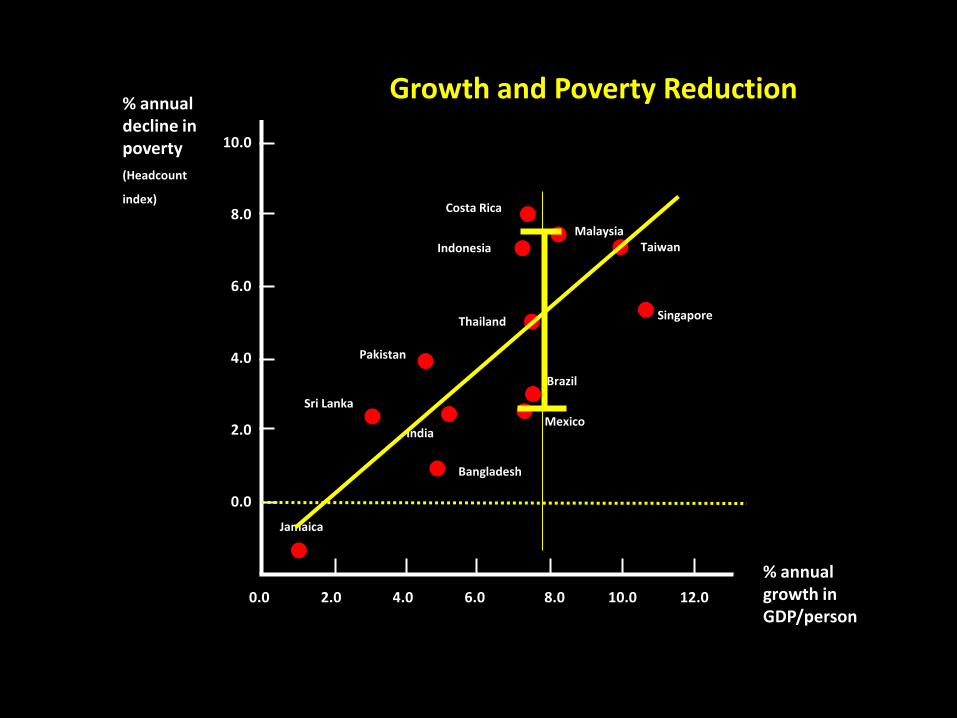
% annual growth in GDP/person
% annual decline in poverty
(Headcount
index)
Jamaica
Costa Rica
India
Malaysia
Indonesia
Singapore Thailand
Taiwan
Sri Lanka
Mexico
Brazil
Bangladesh
Pakistan
Growth and Poverty Reduction

Four Kinds (Types) of Scales
• Nominal
• Ordinal
• Interval
• Ratio

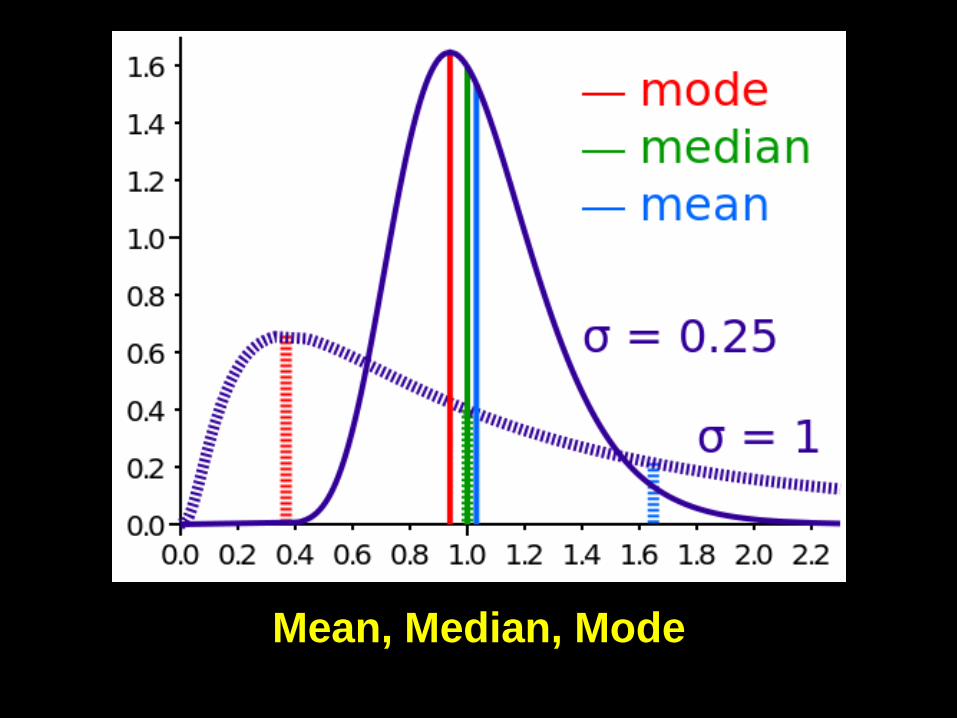
Average?
• Mean: usually add up the values for all the
observations and divide them by the
number of observations
• Median: the number at which half the
observations are smaller and the other
half are bigger
• Mode: the number that appears most
frequently in the distribution of
observations.

Mean, Median, Mode

Outline
1. Science, Method & Measurement
2. On Building An Index
3. Correlation & Causality
4. Probability & Statistics
5. Samples & Surveys
6. Experimental & Quasi-experimental Designs
7. Conceptual Models
8. Quantitative Models
9. Complexity & Chaos
10. Recapitulation - Envoi

An Index is
• A composite measure, usually
involving ratio(s), intended to simplify
the interpretation of a situation
• Examples: Price index, inflation rate,
poverty index, success rate in an
examination, etc.
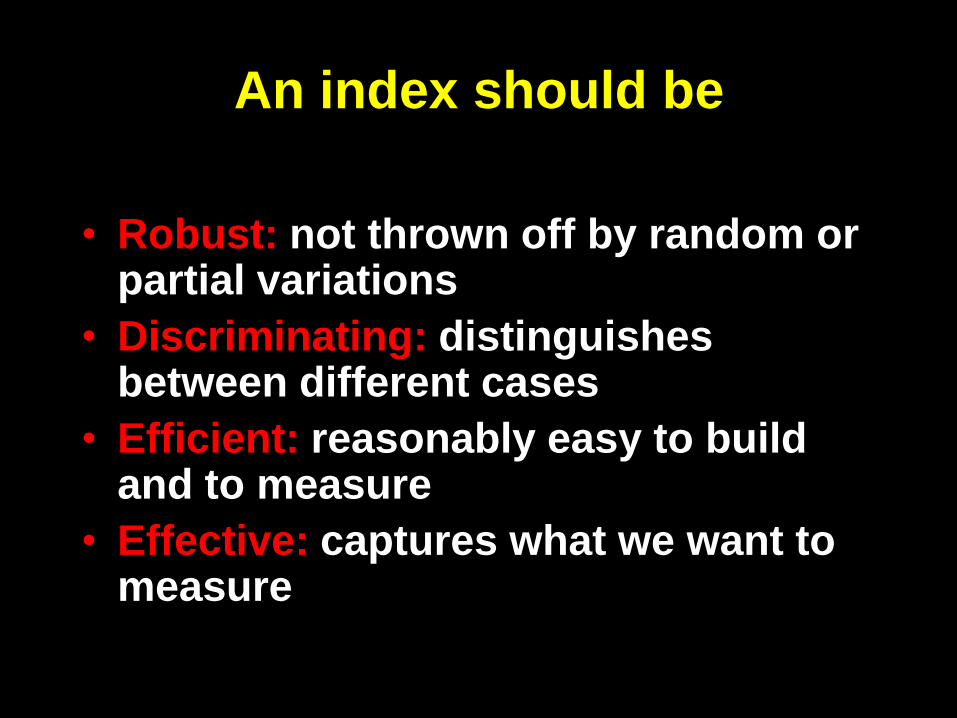
An index should be
• Robust: not thrown off by random or partial variations
• Discriminating: distinguishes between different cases
• Efficient: reasonably easy to build and to measure
• Effective: captures what we want to measure
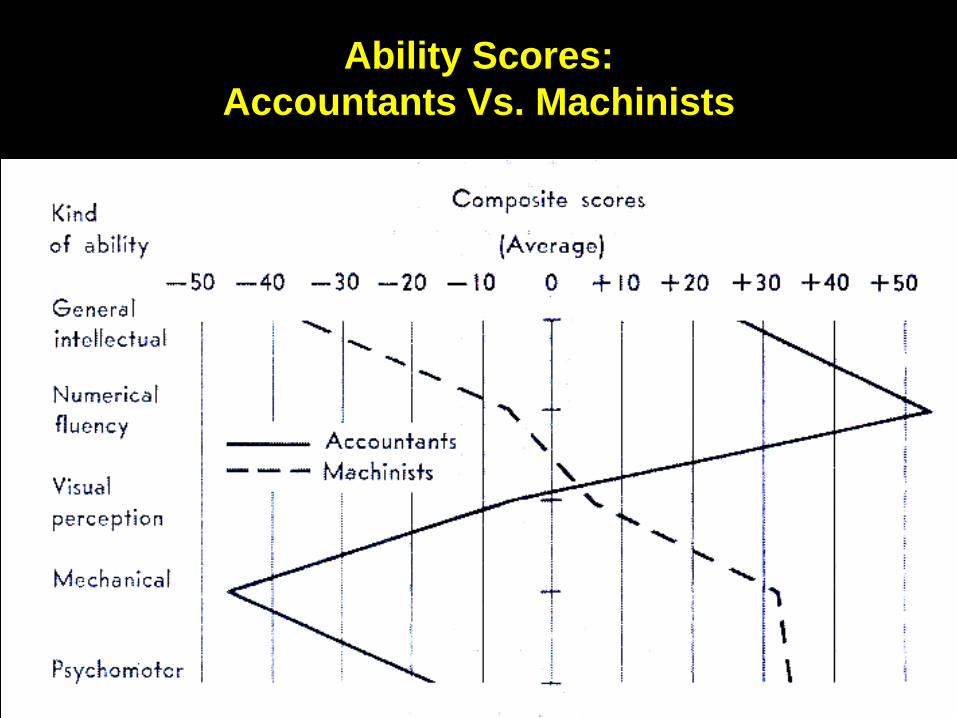
Ability Scores:
Accountants Vs. Machinists

I.Q. measures
• I.Q. is an index constructed by dividing the score of an individual (child) of a certain age on a specific test over the average score that a person should have at that age.
• If the person matches that average score, the I.Q. = 100
• It is sometimes expressed as mental age over biological age
• It says nothing more than what you would say of a child being somewhat tall or somewhat short, for his age,

The multiple intelligences
1. Logical-mathematical
2. Spatial
3. Linguistic
4. Bodily-kinesthetic
5. Musical
6. Interpersonal
7. Intrapersonal
8. Naturalistic
9. Existential

Misreading the index
• History is full of examples of people
misreading the index
• Some even wanted to use it for racist
purposes and argued for Eugenics
• In the USA, where race is a big issue,
there was a recent case of the Book
called “The Bell Curve”

IQ, Nature and Nurture

Many alternative theories of
Intelligence
• Cattell–Horn–Carroll theory
• Fluid and crystallized intelligence
• Theory of multiple intelligences
• Three stratum theory
• Triarchic theory of intelligence
• PASS theory of intelligence


q
i
i
z
yz
nP
1
1
Pα is the weighted mean over the poor population
) (poor for 1 zyz
yi
i
)(poor nonfor 0 zyi
The measure =
=
Understanding Pα

A better statement about Pα
• If = 0 P0 = Amount of poverty
• If = 1 P1 = Depth of Poverty
• If = 2 P2 = Severity of Poverty
(usually associated with hunger)


Outline
1. Science, Method & Measurement
2. On Building An Index
3. Correlation & Causality
4. Probability & Statistics
5. Samples & Surveys
6. Experimental & Quasi-experimental Designs
7. Conceptual Models
8. Quantitative Models
9. Complexity & Chaos
10. Recapitulation - Envoi

Chi Square

Chi-Square
• Chi-square is a statistical test commonly
used to compare observed data (o) with data
we would expect (e) to obtain according to a
specific hypothesis.
• For example, based on Mendel’s laws, we
expect that in a cross between pure green
(dominant) and pure yellow (recessive) peas
the proportion of green to yellow offspring
would be 3:1

Example:
Green and Yellow Peas
+
Theoretical Outcomes: 3 Green :1 Yellow

Correlation & Causation:
Five Possibilities
• A may be the cause of B.
• B may be the cause of A.
• Some unknown third factor C may actually be the cause of both A and B.
A B
• There may be a combination of the above three relationships.

Correlation & Causation:
Five Possibilities
• A may be the cause of B.
• B may be the cause of A.
• Some unknown third factor C may actually be the cause of both A and B.
A B
• There may be a combination of the above three relationships.
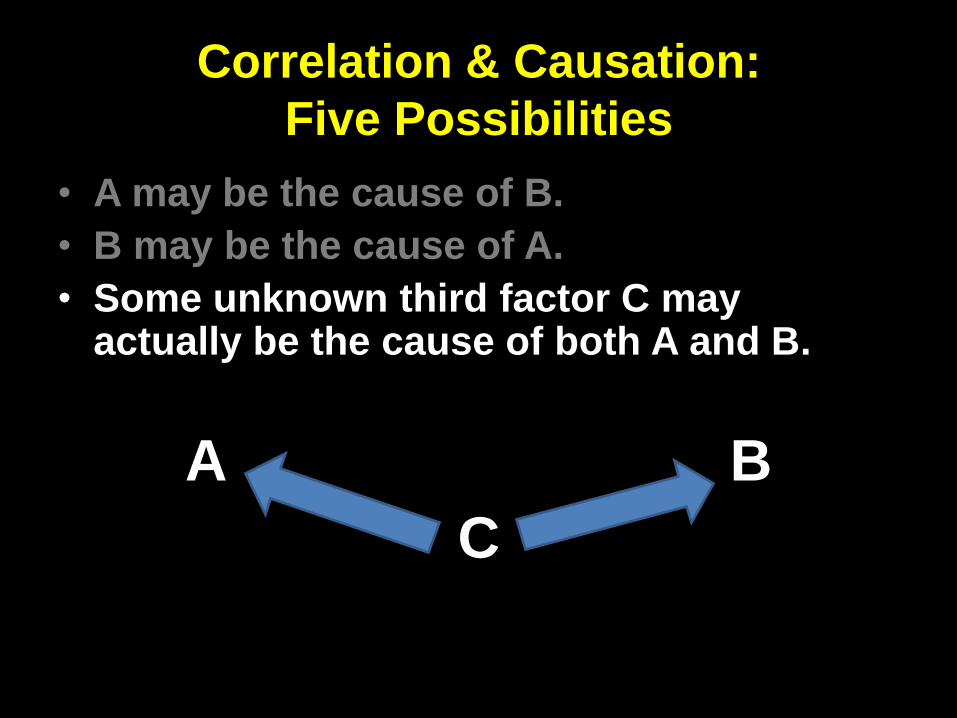
Correlation & Causation:
Five Possibilities
• A may be the cause of B.
• B may be the cause of A.
• Some unknown third factor C may actually be the cause of both A and B.
A B
C • There may be a combination of the above
three relationships.

Correlation & Causation:
Five Possibilities
• A may be the cause of B.
• B may be the cause of A.
• Some unknown third factor C may actually be the cause of both A and B.
A B
C • There may be a combination of the above
three relationships.

Correlation & Causation:
Five Possibilities
• A may be the cause of B.
• B may be the cause of A.
• Some unknown third factor C may
actually be the cause of both A and B.
• There may be a combination of the
above three relationships.
• Fifth: It is just a coincidence!

Pirates and Global Warming

Interpreting Causality:
Possible Explanations

Causation
• On the other hand, causation is a one-way direction, one is dependent and the other one is independent.
– A only goes to B.
– B cannot go to A.
– Therefore, the occurrence of B depends on A.
– A is a predictor to B.
• Every causation always has got a strong correlation, but not all strong correlation is a causation.

Life Expectancy versus Per Capita GNP
Best Fit Relation by Decade
(Thousands)
Per Capita GNP (1980 US$)
Lif
e E
xp
ec
tan
cy
1987 1980
1970
1950
1961
20
30
40
50
60
70
80
0 2 4 6 8 10 12 14 16 18 20
Policy
Counts!

Outline
1. Science, Method & Measurement
2. On Building An Index
3. Correlation & Causality
4. Probability & Statistics
5. Samples & Surveys
6. Experimental & Quasi-experimental Designs
7. Conceptual Models
8. Quantitative Models
9. Complexity & Chaos
10. Recapitulation - Envoi

The Properties of the Gaussian Distribution
• 68% of the values lie within 1 standard deviation of the mean;
• 95% lie within 2 standard deviations; and
• 99.7% lie within 3 standard deviations.

Three Coins Problem

Three coins problem: Solution
• List all possible outcomes (call that A).
• Then ask: In how many ways can three heads appear? (call that B)
• Probability of that outcome is B/A
• Likewise: What is the probability of obtaining a head and two tails?
• Ask In how many ways can a head and two tails appear? (call that C)
• Probability of that outcome is C/A

Three coins solution
(cont’d) • So : List all possible outcomes A = 8
hhh, thh, hth, hht, tth, tht, htt, ttt
• Only one possible way in which we get 3
heads. So B=1
• So the probability that all three coins will
come up heads is B/A = 1/8
• In how many ways can a head and two tails
appear? So C=3
• So the probability of obtaining a head and
two tails is C/A = 3/8
The Birthday problem

So…
• The probability of having a match with someone’s birthday in a group of :
• just 23 people is over 50% !!!
• For 57 people it is 99%
• There are variants to this problem statement. Let’s discuss those

FYI
• The probability of large number of
observations of independent events will
generally map out as a normal distribution
(the bell curve, the Gaussian distribution).
• The hump or high point will always be the
mode
• If and only if the curve is symmetrical, that
will also be the mean and the median.

The Gaussian Distribution
• As the figure above illustrates, 68% of the values lie within 1 standard deviation of the mean; 95% lie within 2 standard deviations; and 99.7% lie within 3 standard deviations.

Outline
1. Science, Method & Measurement
2. On Building An Index
3. Correlation & Causality
4. Probability & Statistics
5. Samples & Surveys
6. Experimental & Quasi-experimental Designs
7. Conceptual Models
8. Quantitative Models
9. Complexity & Chaos
10. Recapitulation - Envoi

We want to know something about the Population
so we study a small sample of the Population (making sure that the sample is representative)
Source: Statistics, Cliffs Quick Review, Wiley, NY, 2001

Transitions can be cut up in discrete
states
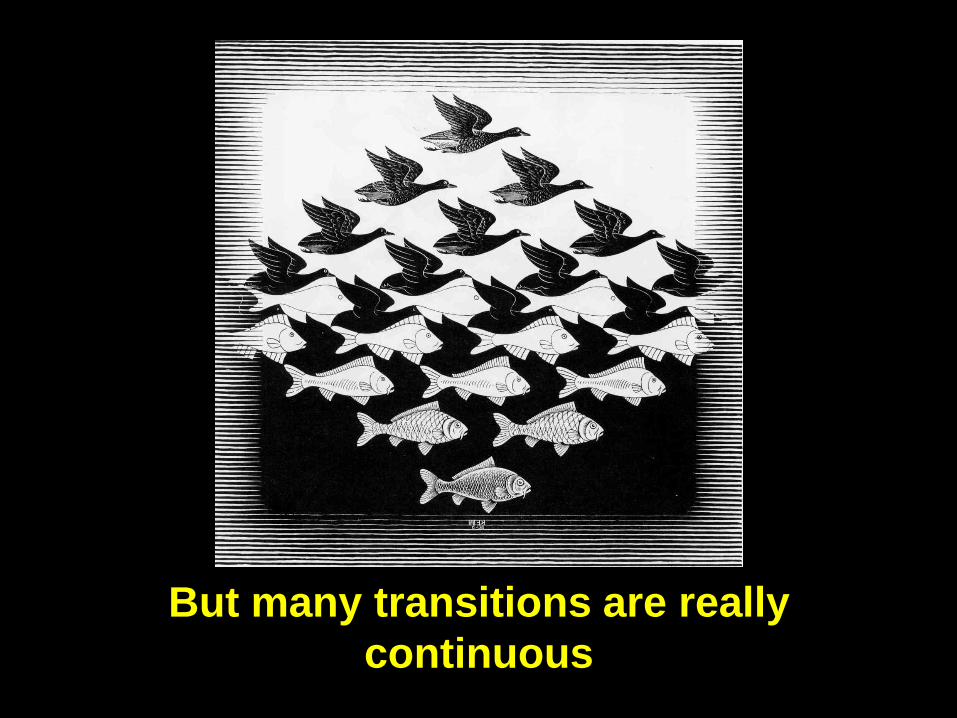
But many transitions are really
continuous

Example:
Students leaving school and
entering the Labor Market


Example Of Population Parameter vs.
Sample Statistic
• Example. We want to know the percentage of voters that favor a new tax.
– The actual percentage of all the voters is a population parameter.
– The estimate of that percentage, based on sample data, is a sample statistic.
• The quality of a sample statistic (i.e., accuracy, precision, representativeness) is strongly affected by the way that sample observations are chosen; that is, by the sampling method.
Source: http://stattrek.com/statistics/data-collection-methods.aspx?Tutorial=AP

Bad Surveys make for bad
estimates

Estimates of the front runners
in the Egyptian Presidential
Election 2012 • Before the first
Round:
1. Abdel Moneim
Aboulfotouh
2. Amr Moussa
3. Mohamed Morsi
4. Hamdein Sabahi
5. Ahmed Shafik
• After the first
Round:
1. Mohamed Morsi
2. Ahmed Shafik
3. Hamdein Sabahi
4. Abdel Moneim
Aboulfotouh
5. Amr Moussa

The US 1948 Presidential
Election:
Truman vs. Dewey

Sampling Methods
• Non-probability samples. We do not know
the probability that each population
element will be chosen, and/or we cannot
be sure that each population element has
a non-zero chance of being chosen.
• Probability samples. Each population
element has a known (non-zero) chance of
being chosen for the sample.
Source: http://stattrek.com/statistics/data-collection-methods.aspx?Tutorial=AP

Two of the main types of non-
probability sampling methods • Voluntary sample. People who self-select into the
survey. Often, these folks have a strong interest in
the main topic of the survey. E.g. those who call in to
talk show, or participate in an on-line poll. This would
be a volunteer sample.
• Convenience sample. A convenience sample is made
up of people who are easy to reach. E.g. interviewing
my students or my employees or shoppers at a local
mall, If the group or the location was chosen
because it was a convenient this would be a
convenience sample.
• Note: Neither allows generalization to the population.
Source: http://stattrek.com/statistics/data-collection-methods.aspx?Tutorial=AP

Non-probability Sample Surveys
• Surveys that are not based on probability sampling have no way of measuring their bias or sampling error.
• Surveys based on non-probability samples are not externally valid. You cannot generalize from them to the general population. They can only be said to be representative of the people that have actually completed the survey.

Non-Probability Samples
• The relationship between the target population and the survey sample is immeasurable and potential bias is unknowable.
• Sophisticated users of non-probability survey samples tend to view the survey as an experimental condition, rather than a tool for population measurement
• Analysts examine the results for internally consistent relationships.

Examples Of Non-Probability Samples
• Judgment Samples: A researcher decides which population members to include in the sample based on his or her judgment. The researcher may provide some alternative justification for the representativeness of the sample.
• Snowball Samples: Often used when a target population is rare, members of the target population recruit other members of the population for the survey.

Examples Of Non-Probability Samples
• Quota Samples: The sample is designed to include a designated number of people with certain specified characteristics. For example, 100 coffee drinkers. This type of sampling is common in non-probability market research surveys.
• Convenience Samples: The sample is composed of whatever persons can be most easily accessed to fill out the survey.

Random Samples

Probability Samples are representative
• The key benefit of all these probability
sampling methods is that they
guarantee that the sample chosen is
representative of the population. This
ensures that the statistical conclusions
will be valid.
Source: http://stattrek.com/statistics/data-collection-methods.aspx?Tutorial=AP
Hence the conclusions are generalizable

Simple Random sampling
• The population consists of N objects.
• The sample consists of n objects.
• If all possible samples of n objects are
equally likely to occur, the sampling method
is called simple random sampling.
• Selection is done by a lottery method or
using a table of random number or a
computerized random number generator.
Source: http://stattrek.com/statistics/data-collection-methods.aspx?Tutorial=AP
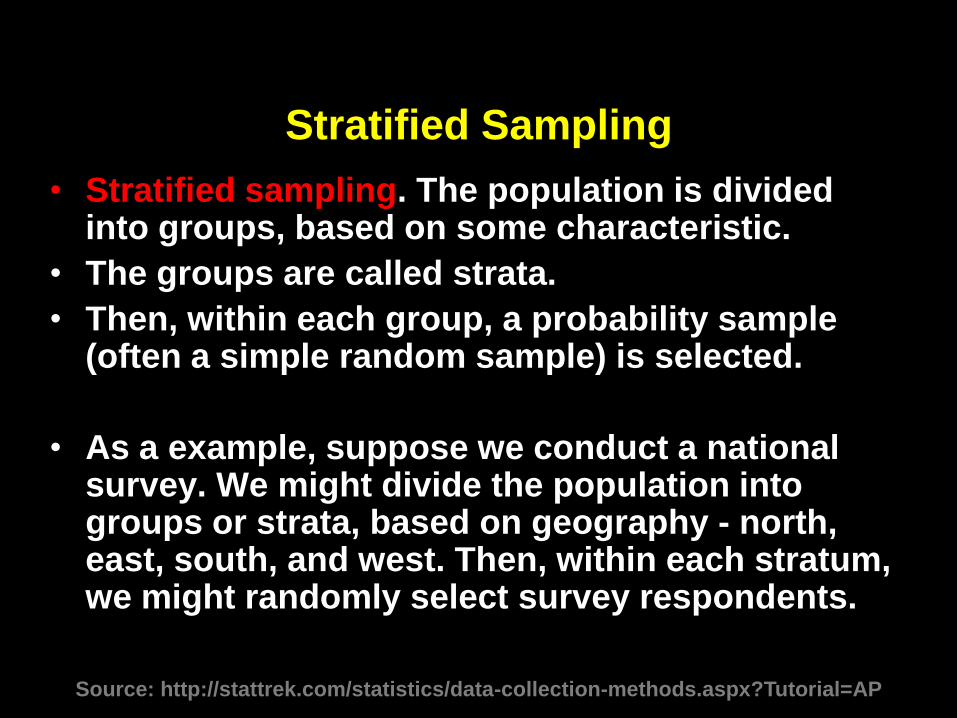
Stratified Sampling
• Stratified sampling. The population is divided into groups, based on some characteristic.
• The groups are called strata.
• Then, within each group, a probability sample (often a simple random sample) is selected.
• As a example, suppose we conduct a national survey. We might divide the population into groups or strata, based on geography - north, east, south, and west. Then, within each stratum, we might randomly select survey respondents.
Source: http://stattrek.com/statistics/data-collection-methods.aspx?Tutorial=AP
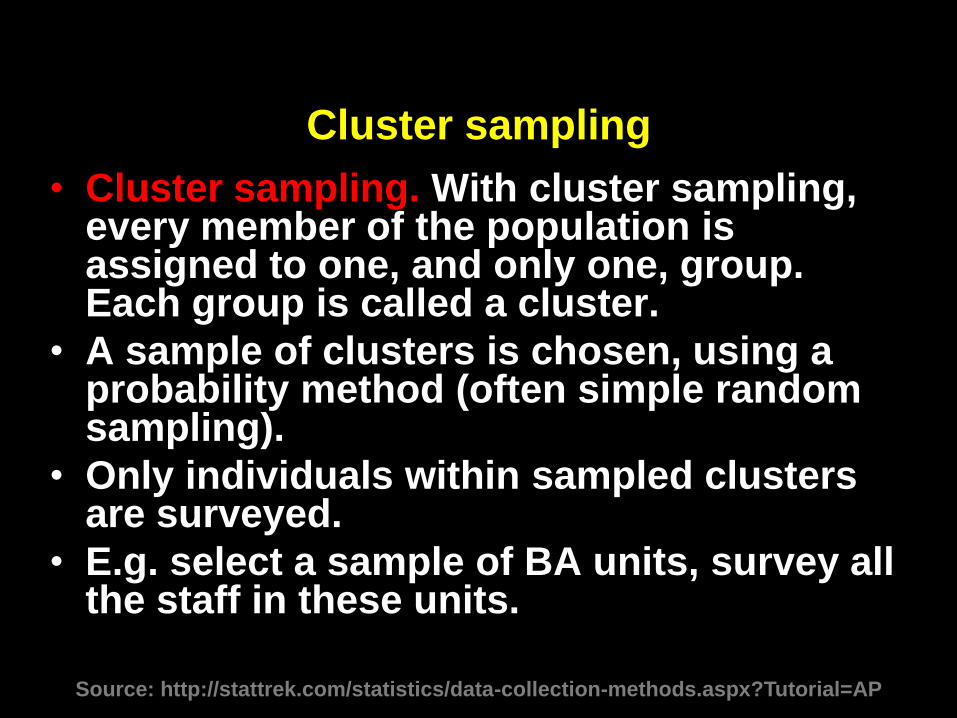
Cluster sampling
• Cluster sampling. With cluster sampling, every member of the population is assigned to one, and only one, group. Each group is called a cluster.
• A sample of clusters is chosen, using a probability method (often simple random sampling).
• Only individuals within sampled clusters are surveyed.
• E.g. select a sample of BA units, survey all the staff in these units.
Source: http://stattrek.com/statistics/data-collection-methods.aspx?Tutorial=AP

Multistage sampling.
• Multistage sampling. With multistage sampling, we select a sample by using combinations of different sampling methods.
• For example, in Stage 1, we might use cluster sampling to choose clusters from a population. Then, in Stage 2, we might use simple random sampling to select a subset of elements from each chosen cluster for the final sample.
Source: http://stattrek.com/statistics/data-collection-methods.aspx?Tutorial=AP

Systematic random sampling.
• Systematic random sampling. With systematic random sampling, we create a list of every member of the population. From the list, we randomly select the first sample element from the first k elements on the population list. Thereafter, we select every kth element on the list.
• This method is different from simple random sampling since every possible sample of n elements is not equally likely.
Source: http://stattrek.com/statistics/data-collection-methods.aspx?Tutorial=AP

How to select a probability
sample

Probability Sampling
• A probability-based survey sample is created by constructing a list of the target population, called the sample frame, a randomized process for selecting units from the sample frame, called a selection procedure, and a method of contacting selected units to and enabling them complete the survey, called a data collection method or mode.

Probability Sampling: Step 1
• Construct a Sample frame: A probability-based survey sample is created by constructing a list of the target population, called the sample frame.
• For some target populations this process may be easy, for example, sampling the employees of a company by using payroll list.
• However, in large, disorganized populations simply constructing a suitable sample frame is often a complex and expensive task.
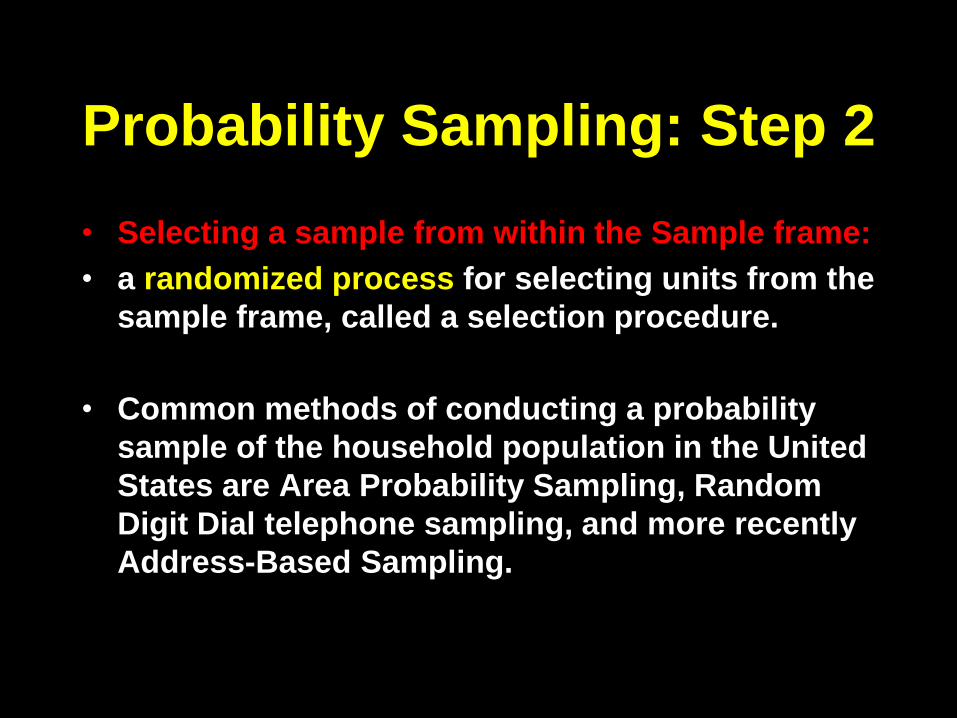
Probability Sampling: Step 2
• Selecting a sample from within the Sample frame:
• a randomized process for selecting units from the
sample frame, called a selection procedure.
• Common methods of conducting a probability
sample of the household population in the United
States are Area Probability Sampling, Random
Digit Dial telephone sampling, and more recently
Address-Based Sampling.

Specialized Techniques Of
Probability Sampling
• Within probability sampling there are
specialized techniques such as:
– stratified sampling &
– cluster sampling
• These techniques improve the precision
or efficiency of the sampling process
without altering the fundamental
principles of probability sampling.

Probability Sampling: Step 3
• Collecting the Data:
• There must be a method of
contacting selected units to and
enabling them complete the survey,
called a data collection method or
mode.

Major Types of Bias In
Surveys • Non-response bias
• Coverage bias
• Selection bias

But how you select your sample
is only one of the issues in doing
survey research

Bias Due to Measurement Error
• In survey research, the measurement process includes the environment in which the survey is conducted, the way that questions are asked, and the state of the survey respondent.
• Response bias refers to the bias that results from problems in the measurement process. Some examples of response bias:
Source: http://stattrek.com/statistics/data-collection-methods.aspx?Tutorial=AP

Examples of Response Bias (Due to error in the Measurement process)
• Leading questions. The wording of the question may be loaded in some way to unduly favor one response over another. For example, a satisfaction survey may ask the respondent to indicate where she is satisfied, dissatisfied, or very dissatisfied.
• By giving the respondent one response option to express satisfaction and two response options to express dissatisfaction, this survey question is biased toward getting a dissatisfied response.
Source: http://stattrek.com/statistics/data-collection-methods.aspx?Tutorial=AP

Examples of Response Bias – Cont’d (Due to error in the Measurement process)
• Social desirability. Most people like to
present themselves in a favorable light,
so they will be reluctant to admit to
unsavory attitudes or illegal activities in
a survey, particularly if survey results
are not confidential. Instead, their
responses may be biased toward what
they believe is socially desirable.
Source: http://stattrek.com/statistics/data-collection-methods.aspx?Tutorial=AP
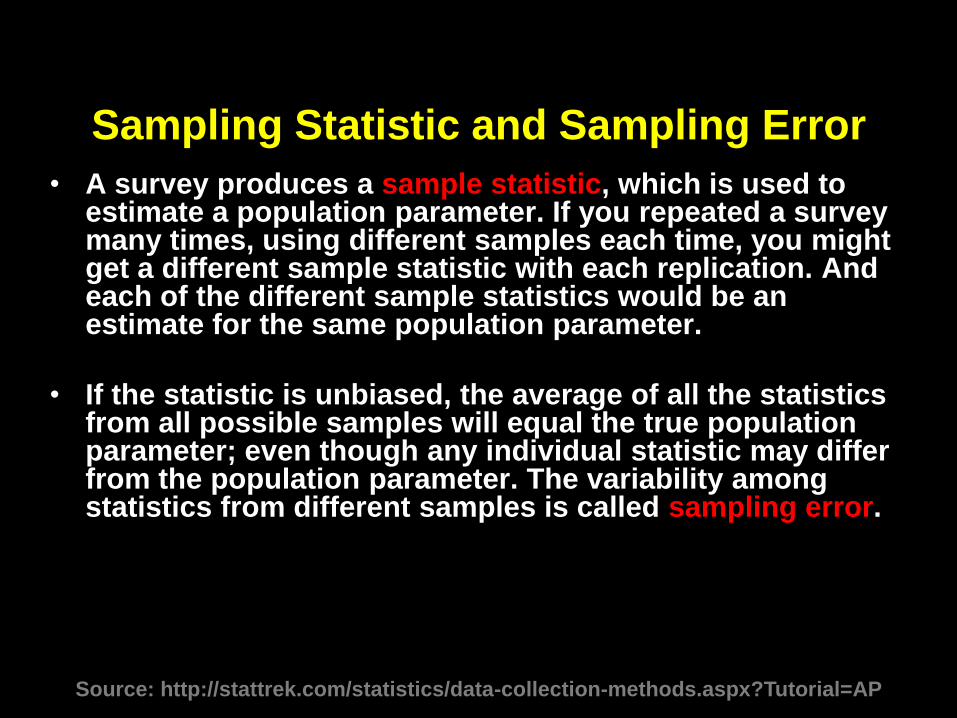
Sampling Statistic and Sampling Error
• A survey produces a sample statistic, which is used to estimate a population parameter. If you repeated a survey many times, using different samples each time, you might get a different sample statistic with each replication. And each of the different sample statistics would be an estimate for the same population parameter.
• If the statistic is unbiased, the average of all the statistics from all possible samples will equal the true population parameter; even though any individual statistic may differ from the population parameter. The variability among statistics from different samples is called sampling error.
Source: http://stattrek.com/statistics/data-collection-methods.aspx?Tutorial=AP

Increasing The Sample size:
Reduces Sampling Error but NOT Survey
Bias • Increasing the sample size tends to reduce the sampling error; that is, it makes the sample statistic less variable. However, increasing sample size does not affect survey bias.
• A large sample size cannot correct for the methodological problems (undercoverage, nonresponse bias, etc.) that produce survey bias.
• Example: The Literary Digest Survey sample size was very large - over 2 million surveys were completed; but the large sample size could not overcome problems with the sample - undercoverage and nonresponse bias.
Source: http://stattrek.com/statistics/data-collection-methods.aspx?Tutorial=AP
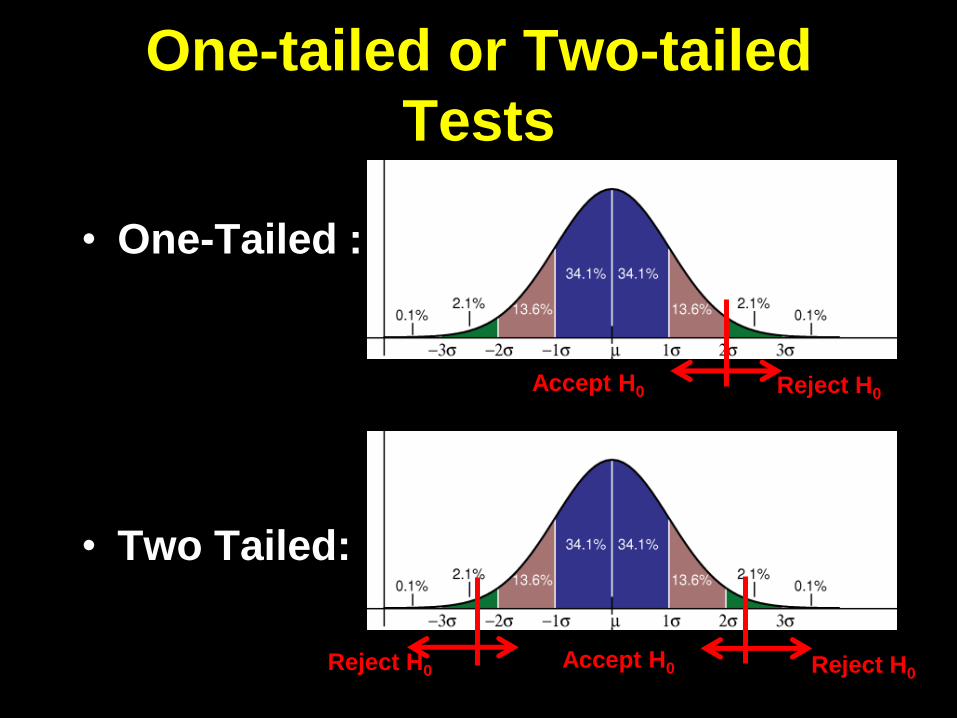
One-tailed or Two-tailed
Tests
• One-Tailed :
• Two Tailed:
Accept H0
Reject H0
Reject H0 Reject H0
Accept H0

Usually:
No directionality: use two-tailed
test
Directionality: use one-tailed test

Type I & Type II Error
Source: Statistics, Cliffs Quick Review, Wiley, NY, 2001

The standard deviation defines how
“spread out” the distribution is:

Outline
1. Science, Method & Measurement
2. On Building An Index
3. Correlation & Causality
4. Probability & Statistics
5. Samples & Surveys
6. Experimental & Quasi-experimental Designs
7. Conceptual Models
8. Quantitative Models
9. Complexity & Chaos
10. Recapitulation - Envoi

Internal & External Validity
• Internal Validity question: Is the data I
have collected interpretable? Can I say
what I want to say about this data and my
statement would be valid?
• External Validity question: Are these
(valid) findings generalizable beyond this
experiment? To what populations,
settings, treatments, and measurable
variables can the recorded effect be
generalized?

So what affects
Internal Validity?

Internal Sources of
Invalidity • History
• Maturation
• Testing
• Instrumentation
• Regression
• Selection
• Mortality
• Interaction of selection and others
Source: Donald Campbell and Julian Stanley, Experimental and quasi-experimental
designs for Research, Wadsworth Publishing; 1 edition (July 13, 1963)

And what affects
External Validity?

External Sources of
Invalidity
• Interaction of Testing and X
• Interaction of selection and X
• Reactive arrangements
• Multiple X interference
Source: Donald Campbell and Julian Stanley, Experimental and quasi-experimental
designs for Research, Wadsworth Publishing; 1 edition (July 13, 1963)


1. One Shot Case Study
X O

2. One-Group Pretest-Posttest
Design
O X O

This is a really BAD design • Internal invalidity that can explain O1 – O2 difference:
– History: many other things could have happened
between O1 & O2 . In social science you cannot
have experimental isolation as in the natural
sciences labs.
– Maturation: between O1 & O2 students could have
grown older, hungrier, more tired, etc.
– Testing: that is the effect is the effect of the
pretest O1 not the treatment X
– Instrumentation (decay) The observers themselves
can get tired, etc. accounting for a part if not all of
the O1 – O2 change

Further problems with
design 2 • Again applies only to the group being
tested (no generalizability), plus
There is also regression towards the mean…

Regression towards the
mean

Prediction Prediction
From Homogeneous
Pretest Groups
To Mean
Posttest
To Mean
Posttest
From Homogeneous
Posttest Groups
13 13
7
Fig. 1b. Fig. 1c.
Fig. 1. Regression in the Prediction of Posttest Scores from Pretest,
and Vice Versa
7
8
9
10
11
12
11
10
9
12
8

3. Static group Comparison
X O
-----------------
O

4. Pretest-Posttest Control
Group Design
R O X O
R O O

5. Solomon Four-Group Design
R O1 X O2
R O3 O4
R X O5
R O6

6. Posttest-Only Control Group
Design
R X O
R O

7. Time Series
O O O O X O O O O

Introduction of an
experimental variable at
point X into a time
series of
measurements, O1 – O8
Some possible outcome
patterns
• Except for D , which is
flat, the gain O4 – O5
is the same in all the
time series
O1 O2 O3 O4 O5 O6 O7 O8
X
X
A
B
C
D
E
F
G
H
Source: Donald Campbell and Julian Stanley, Experimental
and quasi-experimental designs for Research, Wadsworth
Publishing; 1 edition (July 13, 1963)

Introduction of an
experimental variable at
point X into a time
series of
measurements, O1 – O8
Some possible outcome
patterns
• Now Add Context:
• The legitimacy of
inferring an effect
varies widely:
– Strongest in A and B
– Possible in C, D and E
– Totally unjustified in F,
G and H.
O1 O2 O3 O4 O5 O6 O7 O8
X
X
A
B
C
D
E
F
G
H
Source: Donald Campbell and Julian Stanley, Experimental
and quasi-experimental designs for Research, Wadsworth
Publishing; 1 edition (July 13, 1963)

8. Equivalent Time Samples
Design
X1O X0O X1O X0O, etc.

What is happening here…
• This is repeated testing and observation of a group
• The real test X1 is introduced intermittently followed by an observation, with other (non) tests X0 being introduced before other observations
• This can work if the effect of the X is transient
• Example telling students that “this is a test” and then doing it every week, but not telling them which ones of these tests will count for the final grade! Controls factors such as anxiety of respondents (students).

9. Equivalent Materials
Samples Design
MaX1O MbX0O McX1O MdX0O, etc.
This design changes some things in the materials used for the test itself in addition to the previous design which is interwoven with
it. Internally valid, but again externally not valid

10. Nonequivalent Control
Group Design
O X O
----------------------------------
O O

Why would we use this
design? • Because you frequently cannot randomize,
and have to use equivalent convenience samples, e.g. class rooms in schools or schools in a district, or production units in an institution and test all the people in that class, school or production unit.
• Accordingly, we cannot control interaction of selection and maturation etc.
• Again, external validity (i.e. generalizability) is questionable.

11. Counterbalanced Designs
X1O X2O X3O X4O
----------------------------------
X2O X4O X1O X3O
----------------------------------
X3O X1O X4O X2O
----------------------------------
X4O X3O X2O X1O

Why this complicated design?
• To enter each respondent (or respondent
group) into each type of treatment once.
• The design is orthogonal (each
combination of Xi and Ot occurs once).
• Good for multiple treatment testing.
• PS: the design is also called a Latin-
square design.

Orthogonal:
you can change the columns and /or rows in
the table(s)
X1O X2O X3O X4O
----------------------------------
X2O X4O X1O X3O
----------------------------------
X3O X1O X4O X2O
----------------------------------
X4O X3O X2O X1O
T1O T2O T3 T4O X1O X2O X3O X4O
T1O T2O T3O T4O
----------------------------------
T2O T4O T1O T3O
----------------------------------
T3O T1O T4O T2O
----------------------------------
T4O T3O T2O T1O
A
------
B
------
C
-------
D
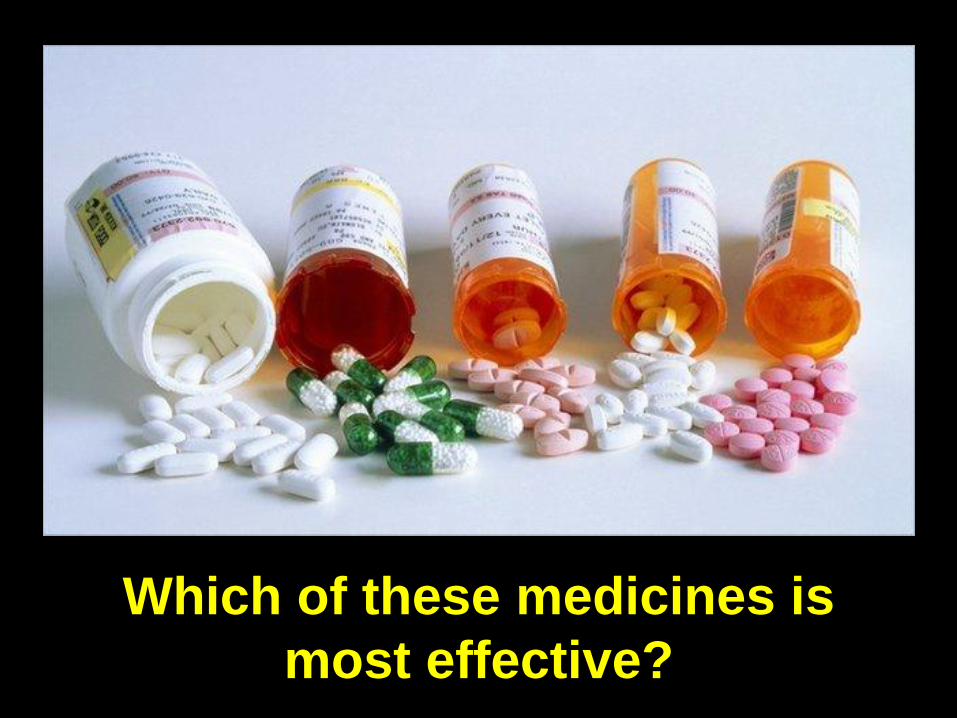
Which of these medicines is
most effective?

12. Separate-Sample Pretest-
Posttest Design
R O (X)
R X O

When to use this Design?
• When the X has to be administered to all,
and we cannot control who gets it and
who does not, but we want to test for its
effect
• Thus we rely on the randomization to
establish the representativity of the pre-
test and the post-test.
• It is much stronger than Design 2 and
should not be confused with it.

12a. Separate-Sample Pretest-
Posttest Design
R O (X)
R X O
----------------------------------------
R O (X)
R X O

12b. Separate-Sample Pretest-
Posttest Design
R O1 (X)
R O2 (X)
R X O3
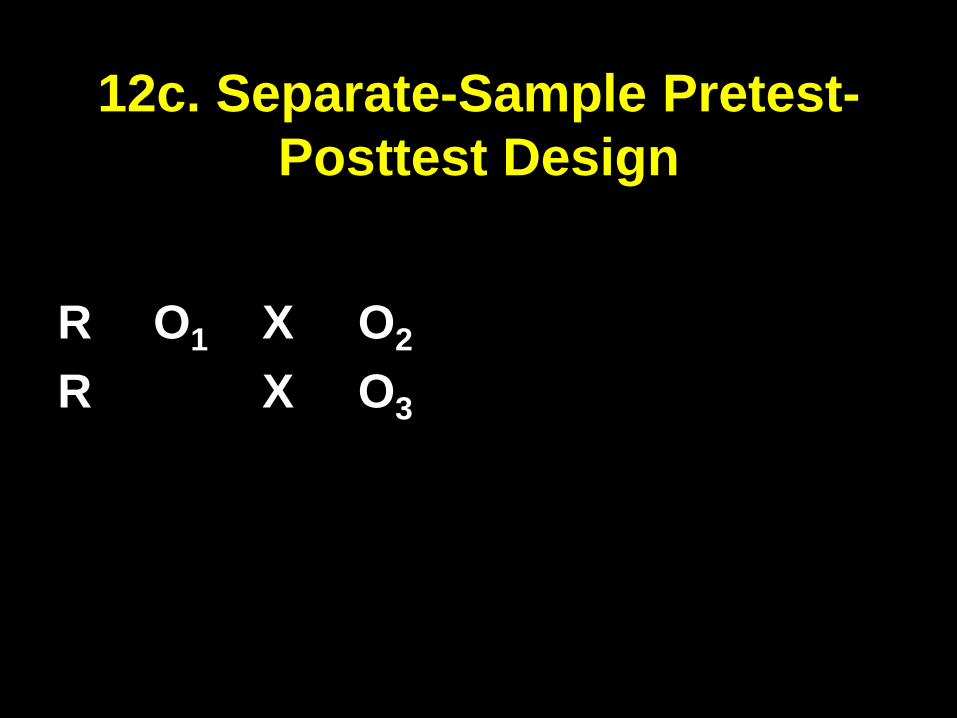
12c. Separate-Sample Pretest-
Posttest Design
R O1 X O2
R X O3

13. Separate-Sample Pretest-
Posttest Control Group Design
R O (X)
R X O
-------------------------
R O
R O

If we can add a control group where X is not
given, then we can transform design 12 to
Design 13.

13a.
Separate-Sample
Pretest-Posttest
Control Group
Design
R O (X) R X O --------------------------
R O (X) R X O --------------------------
R O (X)
R X O
R
R O R X O ------------------------
R O R X O ------------------------
R O
R O
R

14. Multiple Time-Series
O O O X O O O
--------------------------
O O O X O O O

15. Institutional Cycle Design
Class A X O1
Class B1 R O2 X O3 Class B2 R X) O4
Class C R O5
X
O2<O1
O5<O4
O2<O3
O2<O4
O6=O7
O2y=O2o
------------------------------------------------
------------------------------------------------
------------------------------------------------
A complicated patch-up ex-post design.
Let’s just ignore it for now.

A complicated patch-up ex-post design.
Let’s just ignore it for now.

16. Regression
• It is used when experimental studies are
impossible and only pre-existing data are
available, (usually the case in economics).
• It relates independent variable(s) to a
dependent variable and usually assumes
causation by the independent variable(s).
• Regression analysis is widely used for
prediction and forecasting, and fits in our
discussion under quantitative models
rather than here.

Typical linear regression

A famous Case Study:
Hormone Replacement Therapy (HRT)
and Heart Attacks in Women

Hormone Therapy and Heart Attacks
• In a widely studied example, numerous epidemiological studies showed that women who were taking combined hormone replacement therapy (HRT) also had a lower-than-average incidence of coronary heart disease (CHD), leading doctors to propose that HRT was protective against CHD.
Source: Lawlor DA, Davey Smith G, Ebrahim S (June 2004). "Commentary: the hormone
replacement-coronary heart disease conundrum: is this the death of observational
epidemiology?". Int J Epidemiol 33 (3): 464–7. doi:10.1093/ije/dyh124. PMID 15166201.

So, Should I take HRT as a
preventative against Heart
Attacks?

BUT….

Hormone Therapy and Heart Attacks
• But randomized controlled trials
showed that HRT caused a small but
statistically significant increase in risk
of CHD.
• So: How come?
Source: Lawlor DA, Davey Smith G, Ebrahim S (June 2004). "Commentary: the hormone
replacement-coronary heart disease conundrum: is this the death of observational
epidemiology?". Int J Epidemiol 33 (3): 464–7. doi:10.1093/ije/dyh124. PMID 15166201.

Hormone Therapy and Heart Attacks
• Re-analysis of the data from the epidemiological studies showed that women undertaking HRT were more likely to be from higher socio-economic groups.
• These wealthier women also had better than average diet and exercise regimens.
• The use of HRT and decreased incidence of coronary heart disease were coincident effects of a third and separate cause (i.e. the benefits associated with a higher socioeconomic status).
• They were not cause and effect, as had been supposed.
Source: Lawlor DA, Davey Smith G, Ebrahim S (June 2004). "Commentary: the hormone replacement-coronary
heart disease conundrum: is this the death of observational epidemiology?". Int J Epidemiol 33 (3): 464–7.
doi:10.1093/ije/dyh124. PMID 15166201.

Outline
1. Science, Method & Measurement
2. On Building An Index
3. Correlation & Causality
4. Probability & Statistics
5. Samples & Surveys
6. Experimental & Quasi-experimental Designs
7. Conceptual Models
8. Quantitative Models
9. Complexity & Chaos
10. Recapitulation - Envoi
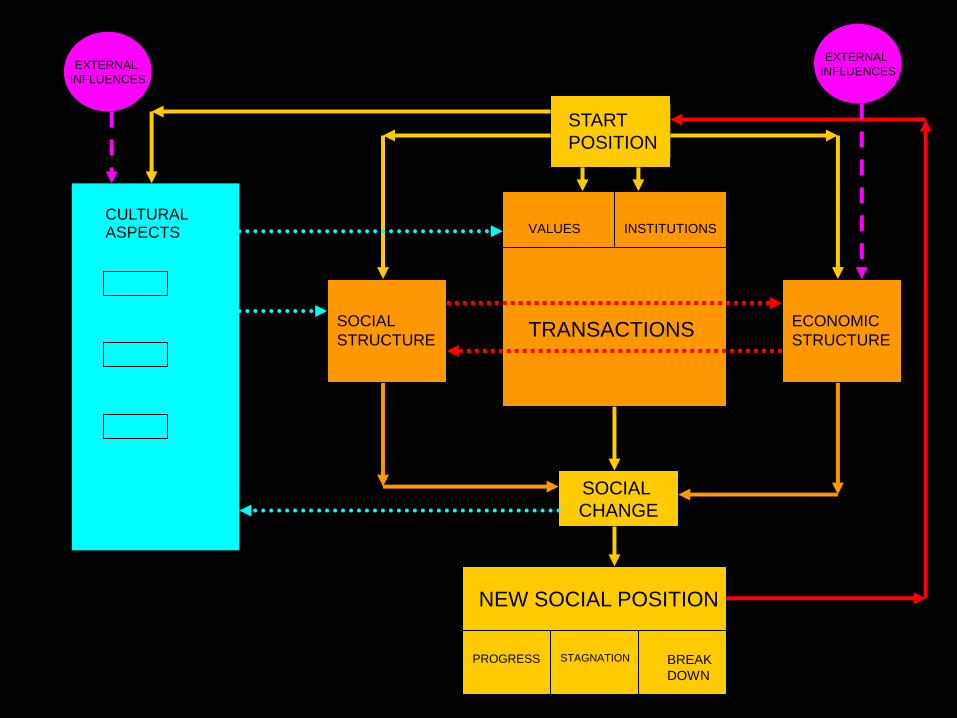
CULTURAL ASPECTS
SOCIAL
STRUCTURE
ECONOMIC
STRUCTURE
PROGRESS STAGNATION BREAK
DOWN
NEW SOCIAL POSITION
SOCIAL
CHANGE
VALUES INSTITUTIONS
START
POSITION
TRANSACTIONS
EXTERNAL
INFLUENCES
EXTERNAL
INFLUENCES

Theoretical
Ethics
Practical
Ethics
Social
Praxis
Social
Values
Individual
Behavior
Intellectual
Domain
Perceptual
Domain
Physical
Domain
Quran
Sunna of the Prophet
Greek and Latin influences
Local Influences
New Ideas
Mass
Media
Education
Modernizing
Influences
Physical
Change

Exchange with Promise to Pay
g + s
Pa
A B Time 1
g + s
Pa
A B Time 2

Exchange with promise of a
Central Bank
g + s g + s
g + s g + s
A Central
Bank
E
B D
C
Pa Pa
Pa Pa
Pa Pa
Pb Pd

Role of Party Machine in
Political Exchange
Legislation
Votes for
reelection
Votes for
legislators
Money
and jobs
Legislation
Money
Machine
Voters
Business Legislators

Transaction involving voters,
TV, interest groups and
legislative candidates
Voters
Interest groups
Television
Legislative candidates
Performers
Entertainment
Attention
of voters Money
Promises
Votes
Money
Attention
of voters
Entertainment
Access
Promises Money

Cultural Transactions


Outline
1. Science, Method & Measurement
2. On Building An Index
3. Correlation & Causality
4. Probability & Statistics
5. Samples & Surveys
6. Experimental & Quasi-experimental Designs
7. Conceptual Models
8. Quantitative Models
9. Complexity & Chaos
10. Recapitulation - Envoi

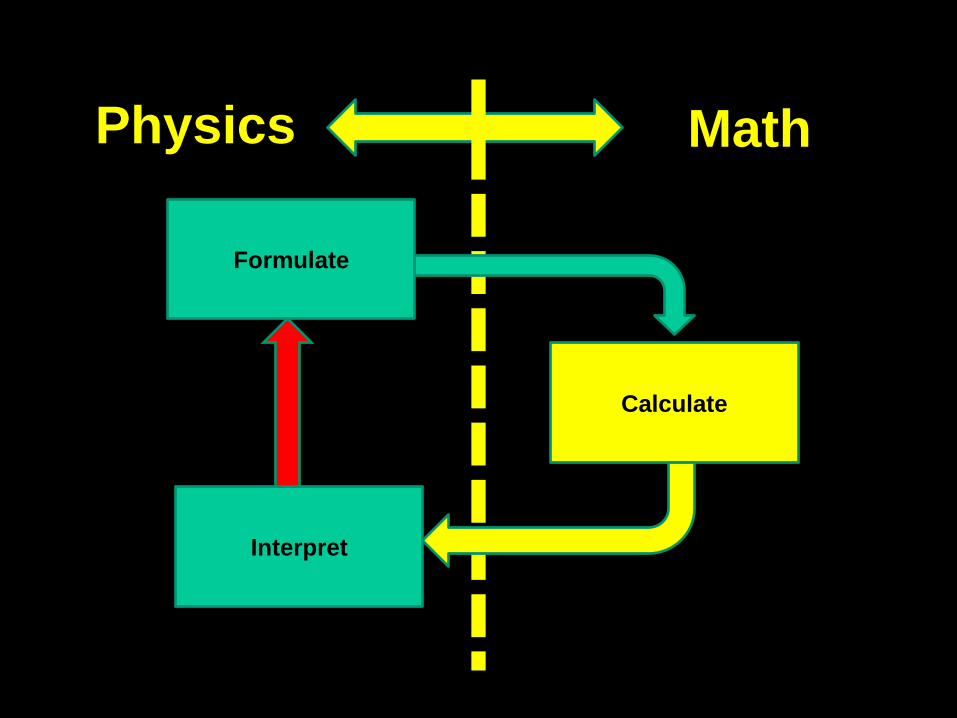
Physics
Formulate
Calculate
Math

Physics
Formulate
Calculate
Interpret
Math
Physics
Formulate
Calculate
Interpret
Math

Example (Cont’d)
P1 = 100 2 (error term = 2%)
P2 = 102 2 (error term = 2%)
P2 P1 = 202 4 (error term 2%)
P2 P1 = 2 2 (error term 100%)

Errors in Models
Complexity of Model
Error
E
Em
Es

Errors in Models
Complexity of Model
Error
Better Data
E
E* Em
E*m
Es

Seven Rules for Building
Models
• Avoid inter-correlated variables
• Add whenever possible
• If not possible then multiply or divide
• Avoid subtraction and exponentials
• Avoid models that proceed in chains
• Simpler partial models can be more robust
than one complex models
• Always report predictable error (essential
for cases of asymmetrical costs)

The steps to building a model:
• Simplification
• Building a decision model
• Testing the model (calibration on historical
data)
• Using the model to find the solution:
• A good Model can be used again and again
for similar problems or can be modified.
Source: Source: http://home.ubalt.edu/ntsbarsh/Business-stat/opre504.htm#rapplIndexnu,p.9

Why the Modeling exercise is useful
• It is a simplified representation of the actual situation
• It need not be complete or exact in all respects
• It concentrates on the most essential relationships and ignores the less essential ones.
• It is more easily understood than the empirical (i.e., observed) situation, and hence permits the problem to be solved more readily with minimum time and effort.
Source: http://home.ubalt.edu/ntsbarsh/Business-stat/opre504.htm#rapplIndexnu,p.12-13

Examples of Applications of Modeling
in Business & Management • An auditor can use random sampling techniques to
audit the accounts receivable for clients.
• A plant manager can use statistical quality control techniques to assure the quality of his production with a minimum of testing or inspection.
• A financial analyst may use regression and correlation to help understand the relationship of a financial ratio to a set of other variables in business.
• A market researcher may use test of significance to accept or reject the hypotheses about a group of buyers to which the firm wishes to sell a particular product.
• A sales manager may use statistical techniques to forecast sales for the coming year.
Source: http://home.ubalt.edu/ntsbarsh/Business-stat/opre504.htm#rapplIndexnu,p.9


ACE Modeling:
The Culture Dish Analogy
Source: http://www.econ.iastate.edu/tesfatsi/aceconstruct.pdf

Conventional (von Neumann)
Computers are
• Good at:
– Fast arithmetic
– Doing precisely what the programmer
programs them to do
• Not so good at:
– Interacting with noisy data or data from the
environment
– Massive parallelism
– Fault tolerance
– Adapting to circumstances

Neural Networks
• Based on the parallel architecture of
animal brains.
• A form of multiprocessor computer
system, with
– Simple processing elements
– A high degree of interconnection
– Simple (scalar) messages
– Adaptive interaction between elements

Neurons can have 10,000 connections providing inputs and
send signals to 1000s of other neurons. Neurons are wired
up in a 3-dimensional pattern.

Outline
1. Science, Method & Measurement
2. On Building An Index
3. Correlation & Causality
4. Probability & Statistics
5. Samples & Surveys
6. Experimental & Quasi-experimental Designs
7. Conceptual Models
8. Quantitative Models
9. Complexity & Chaos
10. Recapitulation - Envoi

Weather Phenomena

Does the Flutter of a Butterfly’s
Wings in Rio Cause a
Hurricane in Texas?

Minute Initial Differences Make Large
Variations in Forecast

Minute Initial Differences Make Large
Variations in Forecast

0 10 20 30 40 50 t
1.0
0.8
0.6
0.4
0.2
0
nex
t
For a = 3.99


Outline
1. Science, Method & Measurement
2. On Building An Index
3. Correlation & Causality
4. Probability & Statistics
5. Samples & Surveys
6. Experimental & Quasi-experimental Designs
7. Conceptual Models
8. Quantitative Models
9. Complexity & Chaos
10. Recapitulation - Envoi

Which is where we now are…

I hope that this course made you

THINK

Now let’s see how we present
findings to the public…

Table Chi-Square Distribution
Source: R.A. Fisher and F. Yates, Statistical Tables for Biological Agricultural and Medical Research, 6th ed., Table IV, Oliver
& Boyd, Ltd., Edinburgh
Degrees
of
Freedo
m
(df)
Probability (p)
0.95 0.90 0.80 0.70 0.50 0.30 0.20 0.10 0.05 0.01 0.001
1 0.004 0.02 0.06 0.15 0.46 1.07 1.64 2.71 3.84 6.64 10.83
2 0.10 0.21 0.45 0.71 1.39 2.41 3.22 4.60 5.99 9.21 13.82
3 0.35 0.58 1.01 1.42 2.37 3.66 4.64 6.25 7.82 11.34 16.27
4 0.71 1.06 1.65 2.20 3.36 4.88 5.99 7.78 9.49 13.28 18.47
5 1.14 1.61 2.34 3.00 4.35 6.06 7.29 9.24 11.07 15.09 20.52
6 1.63 2.20 3.07 3.83 5.35 7.23 8.56 10.64 12.59 16.81 22.46
7 2.17 2.83 3.82 4.67 6.35 8.38 9.80 12.02 14.07 18.48 24.32
8 2.73 3.49 4.59 5.53 7.34 9.52 11.03 13.36 15.51 20.09 26.12
9 3.32 4.17 5.38 6.39 8.34 10.66 12.24 14.68 16.92 21.67 27.88
10 3.94 4.86 6.18 7.27 9.34 11.78 13.44 15.99 18.31 23.21 29.59
Nonsignificant Significant
Mean, Median, Mode

Equations
194

Sales
Egypt 44.5%
United States 23.5%
Pie Charts Usage of BA websites by Country
April 2010 – March 2011
Saudi Arabia

Graphs

Now get set to fly with the masters

Start Gapminder 1

Start Gapminder 2

That was just great…

Now, you too shall go and do
quantitative research
AND
present your findings as beautifully
as that…

Go… Soar Like An Eagle…

Envoi

Research Studies can have major
impacts on the life of a nation and a
society

Example:
Race, Education and the USA: The Coleman Report and its aftermath

James Samuel Coleman (May 12, 1926 – March 25, 1995)


So, your studies could one day have a
major impact…
Now think:
whether it is through modeling, or
surveys, or through experimental designs
to test new treatments…
What could you do to make this a better
world?

Now each group shall prepare
a study proposal and submit it
in one week.

How can you produce useful,
international publication-level
studies?

Questions you must ask as you start
preparing for a study
• What? (subject matter)
• Where? (location, scale in both space and time)
• Why? (purpose of the study: establish, explain, refute…)
• For Whom? (decision-maker, scientists)
• How? (methodology)
• How much? (effort, money, time, detail, etc.)
• When? How much time? (when start, when end?)
• How? (presentation of findings: book, report, article, presentation at seminar, etc.)
• So What?

Let’s review the steps for a Study
1. Objectives or Hypotheses:
• What are the objectives of the study or the
questions to be answered?
• What is the population to which the
investigators intend to refer their findings?
Source: Source: http://home.ubalt.edu/ntsbarsh/Business-stat/opre504.htm#rapplIndexnu,p.9

2. Research Design: • Is the study a planned experiment (i.e., primary data),
or an analysis of records ( i.e., secondary data)?
• How is the sample to be selected?
• Are there possible sources of selection, which would make the sample atypical or non-representative?
• If so, what provision is to be made to deal with this bias?
• What is the nature of the control group, standard of comparison, or cost?
• Remember that research design or statistical modeling means thinking first: reflections before actions.
Source: Source: http://home.ubalt.edu/ntsbarsh/Business-stat/opre504.htm#rapplIndexnu,p.9

3. Observations: • Are there clear definitions of variables, including
classifications, measurements (and/or counting), and the outcomes?
• Is the method of classification or of measurement consistent for all the subjects and relevant to the problem being studied?
• Are there possible biases in measurement (and/or counting)?
• If so, what provisions must be made to deal with them?
• Are the observations reliable and replicable (to defend your finding)?
Source: Source: http://home.ubalt.edu/ntsbarsh/Business-stat/opre504.htm#rapplIndexnu,p.9

4. Analysis & Conclusions:
• Are the data sufficient and worthy of statistical
analysis?
• If so, are the necessary conditions of the
methods of statistical analysis appropriate to the
source and nature of the data? (The analysis
must be correctly performed and interpreted).
• Which conclusions are justifiable by the
findings? Which are not?
• Are the conclusions relevant to the questions
posed at the start of the study?
Source: Source: http://home.ubalt.edu/ntsbarsh/Business-stat/opre504.htm#rapplIndexnu,p.9

5. Presenting the Findings: • The findings must be represented clearly,
objectively, in sufficient but non-technical terms and detail to enable the decision-maker (e.g., a manager) to understand and judge them for himself. How do we do that?
• Are the findings internally consistent; i.e., do the numbers added up properly?
• Can the different results be reconciled?
• What is the significance of your findings?
Source: Source: http://home.ubalt.edu/ntsbarsh/Business-stat/opre504.htm#rapplIndexnu,p.9
6. Final (Summary) Presentation
of Findings
• Who is the target audience now? General public? Manager at BA? Political decision-maker? Scientific colleagues?
• Format of presentations (more than one is possible): book? Article? PowerPoint presentation? Technical report? Publication ina scientific journal?
• Especially when addressing decision-makers, make sure that your findings and recommendation(s) are clearly put, Otherwise, you will have wasted the time, money, etc. for nothing.
Source: Source: http://home.ubalt.edu/ntsbarsh/Business-stat/opre504.htm#rapplIndexnu,p.9

Now each group shall prepare
a study proposal and submit it
in one week.

## 220
Envoi

Sound Development Policies Need
Thoughtful Social Research Inputs

In a time of remarkable dynamic
change, volatility and instability,
some new tools may be needed

Natural and social scientists Of
the developing world must master
the quantitative techniques that
have become essential parts of
contemporary research…

YOU Have to rise to the challenge!

Thus it is not just a matter of
publishing learned papers or
recognizing past individual
achievements…
it is very much a matter of
incubating a revolution!

Thus it is not just a matter of
publishing learned papers or
recognizing past individual
achievements…
it is very much a matter of
incubating a revolution!

I know that this is very challenging

But I have confidence in you…

We may be small
Limited size, limited resources

The Competition
Large size, unlimited resources

But we will surprise the World!

Thank You

The images used in this
presentation are strictly for the
educational purpose of this
lecture. Any use by anyone for
any other purpose should be after
consulting the copyright owners
of these pictures


![[PPT]OCCUPATIONAL HEALTH - University of Pittsburghsuper7/13011-14001/13471.ppt · Web viewGOALS To reduce industrial accidents. To prevent occupational hazards/ diseases. To achieve](https://img.dokumen.tips/doc/110x75/5acfe1977f8b9ac1478d56f8/pptoccupational-health-university-of-super713011-1400113471pptweb-viewgoals.jpg)


![[PPT]PowerPoint Presentation - University of Pittsburghsuper7/6011-7001/6991.ppt · Web viewProf. Joshua Lederberg Raymond and Beverly Sackler Foundation Scholar Suite 400 (Founders](https://img.dokumen.tips/doc/110x75/5b24bb7a7f8b9a625c8b4c29/pptpowerpoint-presentation-university-of-super76011-70016991ppt-web-viewprof.jpg)


