Embed Size (px)
Citation preview
Lecture 1:Measuring ageing
Antoine Bozio
Introduction
I. Measuringageing
Demography
Age structure
Life tables
Past trends
Projections
II. Theories ofpopulation ageing
Malthusian model
Demographictransition
Baby boom
Ageing by the top
Limit to human life
III. Ageing as ahealth process
Ageing is becomingyounger
Morbidity vs mortality
Measuring health
Indicators of healthyageing
References
Lecture 1: Measuring ageing
Antoine Bozio
Paris School of Economics (PSE)
Ecole des hautes etudes en sciences sociales (EHESS)
Master PPDParis – January 2018
1 / 109

Lecture 1:Measuring ageing
Antoine Bozio
Introduction
I. Measuringageing
Demography
Age structure
Life tables
Past trends
Projections
II. Theories ofpopulation ageing
Malthusian model
Demographictransition
Baby boom
Ageing by the top
Limit to human life
III. Ageing as ahealth process
Ageing is becomingyounger
Morbidity vs mortality
Measuring health
Indicators of healthyageing
References
Measuring ageing
1 What is ageing ?• Ageing : to age, process of adding years of life,
growing older• Ageing : process of declining functionalities, and
declining productivity
2 Demography, biology, economics• Measuring ageing as the demographic process• Measuring ageing as the change in health• Measuring ageing as the change in productivity
2 / 109

Lecture 1:Measuring ageing
Antoine Bozio
Introduction
I. Measuringageing
Demography
Age structure
Life tables
Past trends
Projections
II. Theories ofpopulation ageing
Malthusian model
Demographictransition
Baby boom
Ageing by the top
Limit to human life
III. Ageing as ahealth process
Ageing is becomingyounger
Morbidity vs mortality
Measuring health
Indicators of healthyageing
References
Outline of the lecture
I. Measuring demographic ageing
II. Theories of population ageing
III. Ageing as a health process
3 / 109

Lecture 1:Measuring ageing
Antoine Bozio
Introduction
I. Measuringageing
Demography
Age structure
Life tables
Past trends
Projections
II. Theories ofpopulation ageing
Malthusian model
Demographictransition
Baby boom
Ageing by the top
Limit to human life
III. Ageing as ahealth process
Ageing is becomingyounger
Morbidity vs mortality
Measuring health
Indicators of healthyageing
References
I. Measuring demographic ageing
1 Short history of demography
2 Representing age structure of population
3 Life tables
4 Ageing in long-term perspective
5 Projections
4 / 109
Lecture 1:Measuring ageing
Antoine Bozio
Introduction
I. Measuringageing
Demography
Age structure
Life tables
Past trends
Projections
II. Theories ofpopulation ageing
Malthusian model
Demographictransition
Baby boom
Ageing by the top
Limit to human life
III. Ageing as ahealth process
Ageing is becomingyounger
Morbidity vs mortality
Measuring health
Indicators of healthyageing
References
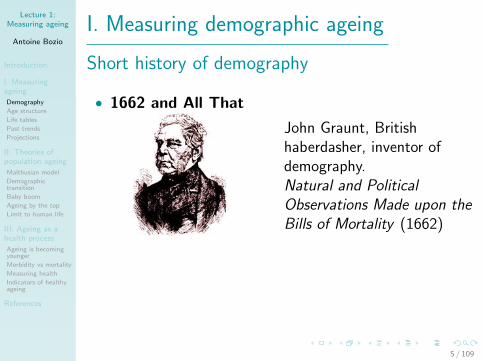
I. Measuring demographic ageing
Short history of demography
• 1662 and All That
John Graunt, Britishhaberdasher, inventor ofdemography.Natural and PoliticalObservations Made upon theBills of Mortality (1662)
• Data : bills of mortality• Mortality rolls in London parishes to warn against
bubonic plague
5 / 109

Lecture 1:Measuring ageing
Antoine Bozio
Introduction
I. Measuringageing
Demography
Age structure
Life tables
Past trends
Projections
II. Theories ofpopulation ageing
Malthusian model
Demographictransition
Baby boom
Ageing by the top
Limit to human life
III. Ageing as ahealth process
Ageing is becomingyounger
Morbidity vs mortality
Measuring health
Indicators of healthyageing
References
I. Measuring demographic ageing
Short history of demography
• 1662 and All That
John Graunt, Britishhaberdasher, inventor ofdemography.Natural and PoliticalObservations Made upon theBills of Mortality (1662)
• Data : bills of mortality• Mortality rolls in London parishes to warn against
bubonic plague
5 / 109
Lecture 1:Measuring ageing
Antoine Bozio
Introduction
I. Measuringageing
Demography
Age structure
Life tables
Past trends
Projections
II. Theories ofpopulation ageing
Malthusian model
Demographictransition
Baby boom
Ageing by the top
Limit to human life
III. Ageing as ahealth process
Ageing is becomingyounger
Morbidity vs mortality
Measuring health
Indicators of healthyageing
References
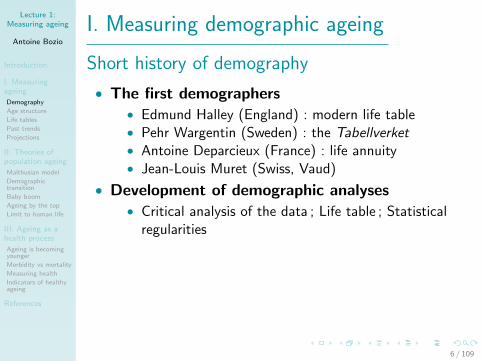
I. Measuring demographic ageing
Short history of demography
• The first demographers• Edmund Halley (England) : modern life table• Pehr Wargentin (Sweden) : the Tabellverket• Antoine Deparcieux (France) : life annuity• Jean-Louis Muret (Swiss, Vaud)
• Development of demographic analyses• Critical analysis of the data ; Life table ; Statistical
regularities
• The rise of census• Early modern census : Sweden (1755)• Prussia, Austria, France, Russia, Netherlands and
Belgium in early 19th century
6 / 109
Lecture 1:Measuring ageing
Antoine Bozio
Introduction
I. Measuringageing
Demography
Age structure
Life tables
Past trends
Projections
II. Theories ofpopulation ageing
Malthusian model
Demographictransition
Baby boom
Ageing by the top
Limit to human life
III. Ageing as ahealth process
Ageing is becomingyounger
Morbidity vs mortality
Measuring health
Indicators of healthyageing
References
I. Measuring demographic ageing
Short history of demography
• The first demographers• Edmund Halley (England) : modern life table• Pehr Wargentin (Sweden) : the Tabellverket• Antoine Deparcieux (France) : life annuity• Jean-Louis Muret (Swiss, Vaud)
• Development of demographic analyses• Critical analysis of the data ; Life table ; Statistical
regularities
• The rise of census• Early modern census : Sweden (1755)• Prussia, Austria, France, Russia, Netherlands and
Belgium in early 19th century
6 / 109

Lecture 1:Measuring ageing
Antoine Bozio
Introduction
I. Measuringageing
Demography
Age structure
Life tables
Past trends
Projections
II. Theories ofpopulation ageing
Malthusian model
Demographictransition
Baby boom
Ageing by the top
Limit to human life
III. Ageing as ahealth process
Ageing is becomingyounger
Morbidity vs mortality
Measuring health
Indicators of healthyageing
References
I. Measuring demographic ageing
Age structure
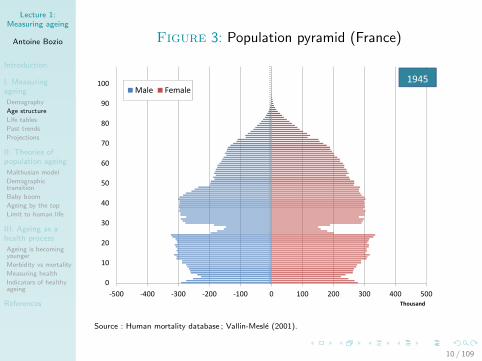
• Population pyramid• Histogram by age and sex of current population• Detailed view of age structure• Clear impact of historical accidents
• No longer pyramids...• Historically, large bases, thin top• Drop in mortality and fertility led to other forms
(mushrooms, pear, etc.)
7 / 109

Lecture 1:Measuring ageing
Antoine Bozio
Introduction
I. Measuringageing
Demography
Age structure
Life tables
Past trends
Projections
II. Theories ofpopulation ageing
Malthusian model
Demographictransition
Baby boom
Ageing by the top
Limit to human life
III. Ageing as ahealth process
Ageing is becomingyounger
Morbidity vs mortality
Measuring health
Indicators of healthyageing
References
I. Measuring demographic ageing
Age structure
• Population pyramid• Histogram by age and sex of current population• Detailed view of age structure• Clear impact of historical accidents
• No longer pyramids...• Historically, large bases, thin top• Drop in mortality and fertility led to other forms
(mushrooms, pear, etc.)
7 / 109

Lecture 1:Measuring ageing
Antoine Bozio
Introduction
I. Measuringageing
Demography
Age structure
Life tables
Past trends
Projections
II. Theories ofpopulation ageing
Malthusian model
Demographictransition
Baby boom
Ageing by the top
Limit to human life
III. Ageing as ahealth process
Ageing is becomingyounger
Morbidity vs mortality
Measuring health
Indicators of healthyageing
References
Figure 1: Population pyramid (France)
-500 -400 -300 -200 -100 0 100 200 300 400 500
0
10
20
30
40
50
60
70
80
90
100
Thousand
Male Female
1816
Source : Human mortality database ; Vallin-Mesle (2001).
8 / 109

Lecture 1:Measuring ageing
Antoine Bozio
Introduction
I. Measuringageing
Demography
Age structure
Life tables
Past trends
Projections
II. Theories ofpopulation ageing
Malthusian model
Demographictransition
Baby boom
Ageing by the top
Limit to human life
III. Ageing as ahealth process
Ageing is becomingyounger
Morbidity vs mortality
Measuring health
Indicators of healthyageing
References
Figure 2: Population pyramid (France)
-500 -400 -300 -200 -100 0 100 200 300 400 500
0
10
20
30
40
50
60
70
80
90
100
Thousand
Male Female
1900
Source : Human mortality database ; Vallin-Mesle (2001).
9 / 109
Lecture 1:Measuring ageing
Antoine Bozio
Introduction
I. Measuringageing
Demography
Age structure
Life tables
Past trends
Projections
II. Theories ofpopulation ageing
Malthusian model
Demographictransition
Baby boom
Ageing by the top
Limit to human life
III. Ageing as ahealth process
Ageing is becomingyounger
Morbidity vs mortality
Measuring health
Indicators of healthyageing
References
Figure 3: Population pyramid (France)
-500 -400 -300 -200 -100 0 100 200 300 400 500
0
10
20
30
40
50
60
70
80
90
100
Thousand
Male Female
1945
Source : Human mortality database ; Vallin-Mesle (2001).
10 / 109

Lecture 1:Measuring ageing
Antoine Bozio
Introduction
I. Measuringageing
Demography
Age structure
Life tables
Past trends
Projections
II. Theories ofpopulation ageing
Malthusian model
Demographictransition
Baby boom
Ageing by the top
Limit to human life
III. Ageing as ahealth process
Ageing is becomingyounger
Morbidity vs mortality
Measuring health
Indicators of healthyageing
References
Figure 4: Population pyramid (France)
-500 -400 -300 -200 -100 0 100 200 300 400 500
0
10
20
30
40
50
60
70
80
90
100
Thousand
Male Female
1978
Source : Human mortality database ; Vallin-Mesle (2001).
11 / 109

Lecture 1:Measuring ageing
Antoine Bozio
Introduction
I. Measuringageing
Demography
Age structure
Life tables
Past trends
Projections
II. Theories ofpopulation ageing
Malthusian model
Demographictransition
Baby boom
Ageing by the top
Limit to human life
III. Ageing as ahealth process
Ageing is becomingyounger
Morbidity vs mortality
Measuring health
Indicators of healthyageing
References
Figure 5: Population pyramid (France)
-500 -400 -300 -200 -100 0 100 200 300 400 500
0
10
20
30
40
50
60
70
80
90
100
Thousand
Male Female
2016
Source : Insee projections.
12 / 109

Lecture 1:Measuring ageing
Antoine Bozio
Introduction
I. Measuringageing
Demography
Age structure
Life tables
Past trends
Projections
II. Theories ofpopulation ageing
Malthusian model
Demographictransition
Baby boom
Ageing by the top
Limit to human life
III. Ageing as ahealth process
Ageing is becomingyounger
Morbidity vs mortality
Measuring health
Indicators of healthyageing
References
I. Measuring demographic ageing
Age structure
• Demographic ratios• Pa−b : population aged a to b• Child dependency ratio :
dc =P0−14
P15−64
• Old-age dependency ratio :
do =P+65
P15−64
• Total dependency ratio : d = dc + do
13 / 109

Lecture 1:Measuring ageing
Antoine Bozio
Introduction
I. Measuringageing
Demography
Age structure
Life tables
Past trends
Projections
II. Theories ofpopulation ageing
Malthusian model
Demographictransition
Baby boom
Ageing by the top
Limit to human life
III. Ageing as ahealth process
Ageing is becomingyounger
Morbidity vs mortality
Measuring health
Indicators of healthyageing
References
Figure 6: Dependency ratios (France, 1816-2014)
0
10
20
30
40
50
60
70
1816 1836 1856 1876 1896 1916 1936 1956 1976 1996 2016
Total dependency ratio
Child dependency ratio
Old-aged dependency ratio (65+)
Source : Human mortality database ; Vallin-Mesle (2001).
14 / 109
Lecture 1:Measuring ageing
Antoine Bozio
Introduction
I. Measuringageing
Demography
Age structure
Life tables
Past trends
Projections
II. Theories ofpopulation ageing
Malthusian model
Demographictransition
Baby boom
Ageing by the top
Limit to human life
III. Ageing as ahealth process
Ageing is becomingyounger
Morbidity vs mortality
Measuring health
Indicators of healthyageing
References
I. Measuring demographic ageing
Life tables
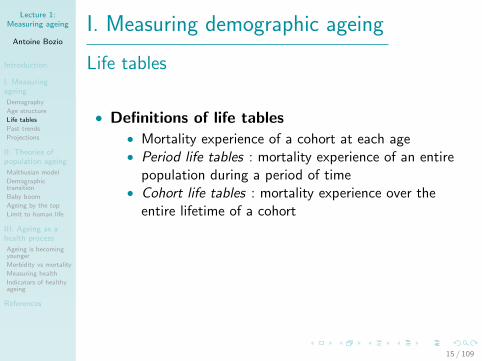
• Definitions of life tables• Mortality experience of a cohort at each age• Period life tables : mortality experience of an entire
population during a period of time• Cohort life tables : mortality experience over the
entire lifetime of a cohort
• Death rates qx by age x• Raw information for life table is death rates qx
• qx : probability of death between age x and x + 1
15 / 109

Lecture 1:Measuring ageing
Antoine Bozio
Introduction
I. Measuringageing
Demography
Age structure
Life tables
Past trends
Projections
II. Theories ofpopulation ageing
Malthusian model
Demographictransition
Baby boom
Ageing by the top
Limit to human life
III. Ageing as ahealth process
Ageing is becomingyounger
Morbidity vs mortality
Measuring health
Indicators of healthyageing
References
I. Measuring demographic ageing
Life tables
• Definitions of life tables• Mortality experience of a cohort at each age• Period life tables : mortality experience of an entire
population during a period of time• Cohort life tables : mortality experience over the
entire lifetime of a cohort
• Death rates qx by age x• Raw information for life table is death rates qx
• qx : probability of death between age x and x + 1
15 / 109
Lecture 1:Measuring ageing
Antoine Bozio
Introduction
I. Measuringageing
Demography
Age structure
Life tables
Past trends
Projections
II. Theories ofpopulation ageing
Malthusian model
Demographictransition
Baby boom
Ageing by the top
Limit to human life
III. Ageing as ahealth process
Ageing is becomingyounger
Morbidity vs mortality
Measuring health
Indicators of healthyageing
References
I. Measuring demographic ageing
Life tables
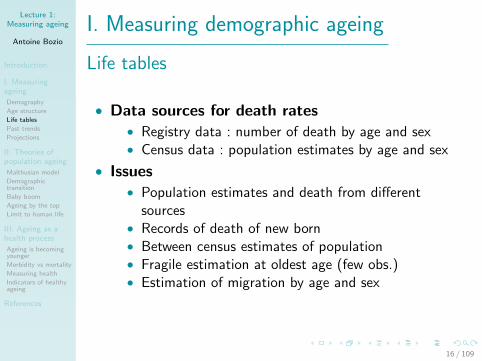
• Data sources for death rates• Registry data : number of death by age and sex• Census data : population estimates by age and sex
• Issues• Population estimates and death from different
sources• Records of death of new born• Between census estimates of population• Fragile estimation at oldest age (few obs.)• Estimation of migration by age and sex
16 / 109
Lecture 1:Measuring ageing
Antoine Bozio
Introduction
I. Measuringageing
Demography
Age structure
Life tables
Past trends
Projections
II. Theories ofpopulation ageing
Malthusian model
Demographictransition
Baby boom
Ageing by the top
Limit to human life
III. Ageing as ahealth process
Ageing is becomingyounger
Morbidity vs mortality
Measuring health
Indicators of healthyageing
References
I. Measuring demographic ageing
Life tables
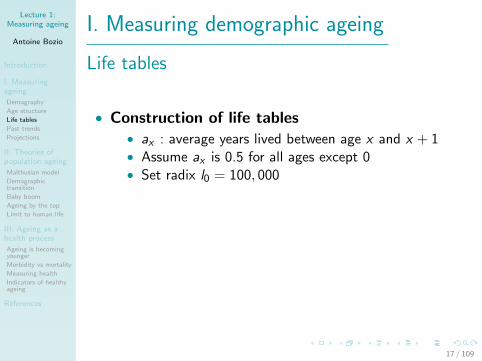
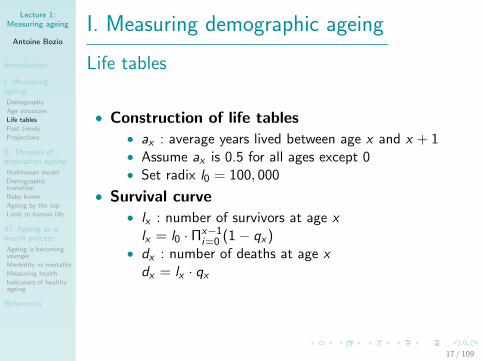
• Construction of life tables• ax : average years lived between age x and x + 1• Assume ax is 0.5 for all ages except 0• Set radix l0 = 100, 000
• Survival curve• lx : number of survivors at age x
lx = l0 · Πx−1i=0 (1 − qx )
• dx : number of deaths at age xdx = lx · qx
17 / 109
Lecture 1:Measuring ageing
Antoine Bozio
Introduction
I. Measuringageing
Demography
Age structure
Life tables
Past trends
Projections
II. Theories ofpopulation ageing
Malthusian model
Demographictransition
Baby boom
Ageing by the top
Limit to human life
III. Ageing as ahealth process
Ageing is becomingyounger
Morbidity vs mortality
Measuring health
Indicators of healthyageing
References
I. Measuring demographic ageing
Life tables
• Construction of life tables• ax : average years lived between age x and x + 1• Assume ax is 0.5 for all ages except 0• Set radix l0 = 100, 000
• Survival curve• lx : number of survivors at age x
lx = l0 · Πx−1i=0 (1 − qx )
• dx : number of deaths at age xdx = lx · qx
17 / 109

Lecture 1:Measuring ageing
Antoine Bozio
Introduction
I. Measuringageing
Demography
Age structure
Life tables
Past trends
Projections
II. Theories ofpopulation ageing
Malthusian model
Demographictransition
Baby boom
Ageing by the top
Limit to human life
III. Ageing as ahealth process
Ageing is becomingyounger
Morbidity vs mortality
Measuring health
Indicators of healthyageing
References
I. Measuring demographic ageing
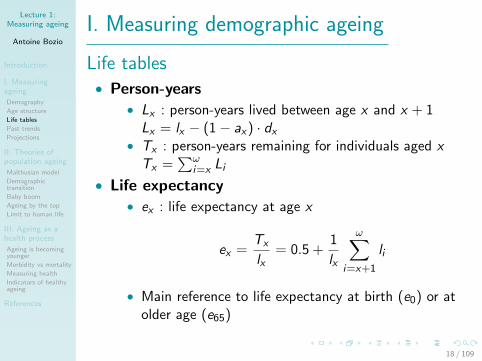
Life tables• Person-years
• Lx : person-years lived between age x and x + 1Lx = lx − (1 − ax ) · dx
• Tx : person-years remaining for individuals aged xTx =
∑ωi=x Li
• Life expectancy• ex : life expectancy at age x
ex =Tx
lx= 0.5 +
1
lx
ω∑i=x+1
li
• Main reference to life expectancy at birth (e0) or atolder age (e65)
18 / 109
Lecture 1:Measuring ageing
Antoine Bozio
Introduction
I. Measuringageing
Demography
Age structure
Life tables
Past trends
Projections
II. Theories ofpopulation ageing
Malthusian model
Demographictransition
Baby boom
Ageing by the top
Limit to human life
III. Ageing as ahealth process
Ageing is becomingyounger
Morbidity vs mortality
Measuring health
Indicators of healthyageing
References
I. Measuring demographic ageing
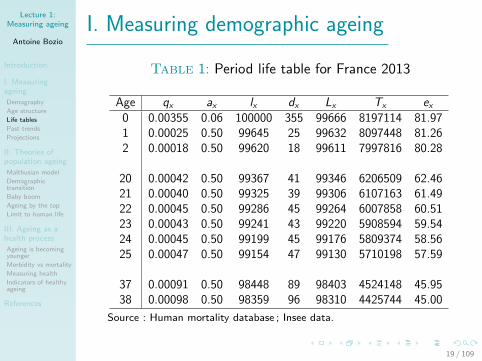
Table 1: Period life table for France 2013
Age qx ax lx dx Lx Tx ex
0 0.00355 0.06 100000 355 99666 8197114 81.971 0.00025 0.50 99645 25 99632 8097448 81.262 0.00018 0.50 99620 18 99611 7997816 80.28
20 0.00042 0.50 99367 41 99346 6206509 62.4621 0.00040 0.50 99325 39 99306 6107163 61.4922 0.00045 0.50 99286 45 99264 6007858 60.5123 0.00043 0.50 99241 43 99220 5908594 59.5424 0.00045 0.50 99199 45 99176 5809374 58.5625 0.00047 0.50 99154 47 99130 5710198 57.59
37 0.00091 0.50 98448 89 98403 4524148 45.9538 0.00098 0.50 98359 96 98310 4425744 45.00
Source : Human mortality database ; Insee data.
19 / 109

Lecture 1:Measuring ageing
Antoine Bozio
Introduction
I. Measuringageing
Demography
Age structure
Life tables
Past trends
Projections
II. Theories ofpopulation ageing
Malthusian model
Demographictransition
Baby boom
Ageing by the top
Limit to human life
III. Ageing as ahealth process
Ageing is becomingyounger
Morbidity vs mortality
Measuring health
Indicators of healthyageing
References
Figure 7: Death rates (France 2013)
0,01
0,1
1
10
100
1000
0 10 20 30 40 50 60 70 80 90 100 110+
De
ath
ra
te (
pe
r 1
00
0,
log
sca
le)
Age
Male
Female
Source : Human mortality database.
20 / 109

Lecture 1:Measuring ageing
Antoine Bozio
Introduction
I. Measuringageing
Demography
Age structure
Life tables
Past trends
Projections
II. Theories ofpopulation ageing
Malthusian model
Demographictransition
Baby boom
Ageing by the top
Limit to human life
III. Ageing as ahealth process
Ageing is becomingyounger
Morbidity vs mortality
Measuring health
Indicators of healthyageing
References
Figure 8: Survival curve (France 2013)
0
10
20
30
40
50
60
70
80
90
100
0 10 20 30 40 50 60 70 80 90 100 110+
Thousand
Age
Male
Female
Source : Human mortality database.
21 / 109
Lecture 1:Measuring ageing
Antoine Bozio
Introduction
I. Measuringageing
Demography
Age structure
Life tables
Past trends
Projections
II. Theories ofpopulation ageing
Malthusian model
Demographictransition
Baby boom
Ageing by the top
Limit to human life
III. Ageing as ahealth process
Ageing is becomingyounger
Morbidity vs mortality
Measuring health
Indicators of healthyageing
References
I. Measuring demographic ageing
Long-term history of ageing
• Historical demography• A field in development since the 1960s• Demographic analysis based on ancient documents• Often partial coverage/information• Debate on the reliability of the estimates
• Sample of the best studies
1 England 1541-1800 (Wrigley and Schofield, 1981)2 Geneva 16-17th c. (Perrenoud, 1978)3 France 18th c. (Blayo, 1975)4 Roman Egypt (Bagnall and Frier, 1994)5 Neolithic (Biraben, 1988 ; Masset 2002)
22 / 109

Lecture 1:Measuring ageing
Antoine Bozio
Introduction
I. Measuringageing
Demography
Age structure
Life tables
Past trends
Projections
II. Theories ofpopulation ageing
Malthusian model
Demographictransition
Baby boom
Ageing by the top
Limit to human life
III. Ageing as ahealth process
Ageing is becomingyounger
Morbidity vs mortality
Measuring health
Indicators of healthyageing
References
I. Measuring demographic ageing
Sources for historical demography
• Census during Antiquity• For tax or military purposes• Census in Ancient China since 2000 BC• Roman census since 200 BC
• Parish registry in Western Europe• Church registry of baptisms, marriage and death• Emergence in 16th c., generalization in 17th c.
• Modern State registry• Sweden frontrunner in 1755• French revolution transferred Church registry to the
State : etat civil (1792)• Most European states followed in the 19th c.
23 / 109
Lecture 1:Measuring ageing
Antoine Bozio
Introduction
I. Measuringageing
Demography
Age structure
Life tables
Past trends
Projections
II. Theories ofpopulation ageing
Malthusian model
Demographictransition
Baby boom
Ageing by the top
Limit to human life
III. Ageing as ahealth process
Ageing is becomingyounger
Morbidity vs mortality
Measuring health
Indicators of healthyageing
References
I. Measuring demographic ageing
Sources for historical demography
• England 1541-1871• Cambridge group (Wrigley and Schofield, 1981)• Anglican parish registers in England since 1538• Record baptisms, burials and marriages
• Geneva 16th-17th c.• Protestant parish registry since 1550 (Perrenoud,
1978)• Detailed information on age, socio-occupational
status
• France 18th c.• Catholic registry since 17th• Enquete INED Louis Henry (Blayo, 1975)
24 / 109

Lecture 1:Measuring ageing
Antoine Bozio
Introduction
I. Measuringageing
Demography
Age structure
Life tables
Past trends
Projections
II. Theories ofpopulation ageing
Malthusian model
Demographictransition
Baby boom
Ageing by the top
Limit to human life
III. Ageing as ahealth process
Ageing is becomingyounger
Morbidity vs mortality
Measuring health
Indicators of healthyageing
References
Figure 9: Death rate by age (Geneva, 17th-18th c.)
0
100
200
300
400
500
600
700
800
900
1000
0 10 20 30 40 50 60 70 80 90
De
ath
ra
te (
pe
r 1
00
0)
Age
1625-1649
1675-1699
1725-1744
1770-1790
1800-1820
Source : Perrenoud (1978), tableau 2, p. 219.
25 / 109
Lecture 1:Measuring ageing
Antoine Bozio
Introduction
I. Measuringageing
Demography
Age structure
Life tables
Past trends
Projections
II. Theories ofpopulation ageing
Malthusian model
Demographictransition
Baby boom
Ageing by the top
Limit to human life
III. Ageing as ahealth process
Ageing is becomingyounger
Morbidity vs mortality
Measuring health
Indicators of healthyageing
References
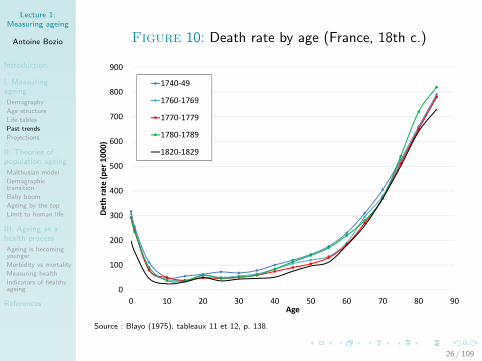
Figure 10: Death rate by age (France, 18th c.)
0
100
200
300
400
500
600
700
800
900
0 10 20 30 40 50 60 70 80 90
De
th r
ate
(p
er
10
00
)
Age
1740-49
1760-1769
1770-1779
1780-1789
1820-1829
Source : Blayo (1975), tableaux 11 et 12, p. 138.
26 / 109
Lecture 1:Measuring ageing
Antoine Bozio
Introduction
I. Measuringageing
Demography
Age structure
Life tables
Past trends
Projections
II. Theories ofpopulation ageing
Malthusian model
Demographictransition
Baby boom
Ageing by the top
Limit to human life
III. Ageing as ahealth process
Ageing is becomingyounger
Morbidity vs mortality
Measuring health
Indicators of healthyageing
References
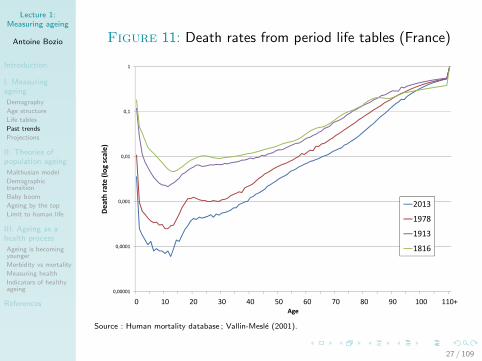
Figure 11: Death rates from period life tables (France)
0,00001
0,0001
0,001
0,01
0,1
1
0 10 20 30 40 50 60 70 80 90 100 110+
De
ath
ra
te (
log
sca
le)
Age
2013
1978
1913
1816
Source : Human mortality database ; Vallin-Mesle (2001).
27 / 109

Lecture 1:Measuring ageing
Antoine Bozio
Introduction
I. Measuringageing
Demography
Age structure
Life tables
Past trends
Projections
II. Theories ofpopulation ageing
Malthusian model
Demographictransition
Baby boom
Ageing by the top
Limit to human life
III. Ageing as ahealth process
Ageing is becomingyounger
Morbidity vs mortality
Measuring health
Indicators of healthyageing
References
I. Measuring demographic ageing
Ageing in Antiquity
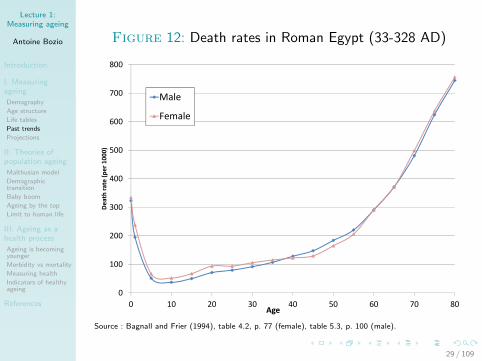
• Bagnall and Frier (1994)• Set of papyri from Roman Egypt• Use census information and demographic model fill
gaps
• Roman Census• Census carried over from AD 12 to AD 259• Information on age, sex, status
• Findings• High infant mortality• Mortality rates similar to that of 18th c.• Still large uncertainties (large selection bias possible)
28 / 109
Lecture 1:Measuring ageing
Antoine Bozio
Introduction
I. Measuringageing
Demography
Age structure
Life tables
Past trends
Projections
II. Theories ofpopulation ageing
Malthusian model
Demographictransition
Baby boom
Ageing by the top
Limit to human life
III. Ageing as ahealth process
Ageing is becomingyounger
Morbidity vs mortality
Measuring health
Indicators of healthyageing
References
Figure 12: Death rates in Roman Egypt (33-328 AD)
0
100
200
300
400
500
600
700
800
0 10 20 30 40 50 60 70 80
De
ath
ra
te (
pe
r 1
00
0)
Age
Male
Female
Source : Bagnall and Frier (1994), table 4.2, p. 77 (female), table 5.3, p. 100 (male).
29 / 109

Lecture 1:Measuring ageing
Antoine Bozio
Introduction
I. Measuringageing
Demography
Age structure
Life tables
Past trends
Projections
II. Theories ofpopulation ageing
Malthusian model
Demographictransition
Baby boom
Ageing by the top
Limit to human life
III. Ageing as ahealth process
Ageing is becomingyounger
Morbidity vs mortality
Measuring health
Indicators of healthyageing
References
Figure 13: Death rate by age before 18th century
0
100
200
300
400
500
600
700
800
900
0 10 20 30 40 50 60 70 80
De
ath
ra
te (
pe
r 1
00
0)
Age
Roman Egypt 33-258 AD
Geneva 1650
France 1740
Geneva 1740
Source : Bagnall and Frier (1994) ; Perrenoud (1978) ; Blayo (1975)
30 / 109
Lecture 1:Measuring ageing
Antoine Bozio
Introduction
I. Measuringageing
Demography
Age structure
Life tables
Past trends
Projections
II. Theories ofpopulation ageing
Malthusian model
Demographictransition
Baby boom
Ageing by the top
Limit to human life
III. Ageing as ahealth process
Ageing is becomingyounger
Morbidity vs mortality
Measuring health
Indicators of healthyageing
References
I. Measuring demographic ageing
Ageing in prehistoric times• Paleodemography
• A field in development since the 1950s• Skeletal analysis on large burial sites
• Early findings• Large mortality rates, no individuals above age 50• Very large infant mortality• Much lower life expectancy than 16-17th c. data
• Controversies• Stark criticisms from French researchers (Masset,
1971) : mortality estimates so high that reproductionwould be impossible
• Controversies within the field (Buchet and Seguy,2002)
31 / 109

Lecture 1:Measuring ageing
Antoine Bozio
Introduction
I. Measuringageing
Demography
Age structure
Life tables
Past trends
Projections
II. Theories ofpopulation ageing
Malthusian model
Demographictransition
Baby boom
Ageing by the top
Limit to human life
III. Ageing as ahealth process
Ageing is becomingyounger
Morbidity vs mortality
Measuring health
Indicators of healthyageing
References
Figure 14: Death rates from archeology, ethnology anddemography
Source : Buchet and Seguy (2002), Fig. 1.
32 / 109
Lecture 1:Measuring ageing
Antoine Bozio
Introduction
I. Measuringageing
Demography
Age structure
Life tables
Past trends
Projections
II. Theories ofpopulation ageing
Malthusian model
Demographictransition
Baby boom
Ageing by the top
Limit to human life
III. Ageing as ahealth process
Ageing is becomingyounger
Morbidity vs mortality
Measuring health
Indicators of healthyageing
References
I. Measuring demographic ageing
Ageing in prehistoric times• Bones can be misleading
• Large s.e. around age estimates• Infants bones not well preserved• Systematic underestimation of female age• Selection bias in buried individuals
• Recent methodological advances• Estimator techniques (Boquet-Appel and Masset,
1996)
• Results• Mortality rates and life expectancy similar to those
found in 16-17th c. (Masset, 2002)• Neolithic demographic transition : increase in
population growth (Bocquet-Appel, 2008)
33 / 109

Lecture 1:Measuring ageing
Antoine Bozio
Introduction
I. Measuringageing
Demography
Age structure
Life tables
Past trends
Projections
II. Theories ofpopulation ageing
Malthusian model
Demographictransition
Baby boom
Ageing by the top
Limit to human life
III. Ageing as ahealth process
Ageing is becomingyounger
Morbidity vs mortality
Measuring health
Indicators of healthyageing
References
I. Measuring demographic ageing
Figure 15: Human population (65,000 BC – 2’000 AD)
Source : J.N. Biraben, Population et Societes, no. 394, Oct. 2003.
34 / 109
Lecture 1:Measuring ageing
Antoine Bozio
Introduction
I. Measuringageing
Demography
Age structure
Life tables
Past trends
Projections
II. Theories ofpopulation ageing
Malthusian model
Demographictransition
Baby boom
Ageing by the top
Limit to human life
III. Ageing as ahealth process
Ageing is becomingyounger
Morbidity vs mortality
Measuring health
Indicators of healthyageing
References
I. Measuring demographic ageing
Long-term history of ageing : Recap
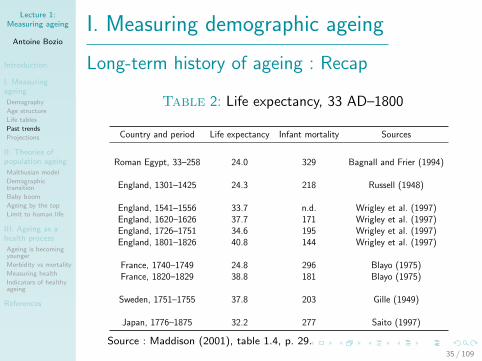
Table 2: Life expectancy, 33 AD–1800
Country and period Life expectancy Infant mortality Sources
Roman Egypt, 33–258 24.0 329 Bagnall and Frier (1994)
England, 1301–1425 24.3 218 Russell (1948)
England, 1541–1556 33.7 n.d. Wrigley et al. (1997)England, 1620–1626 37.7 171 Wrigley et al. (1997)England, 1726–1751 34.6 195 Wrigley et al. (1997)England, 1801–1826 40.8 144 Wrigley et al. (1997)
France, 1740–1749 24.8 296 Blayo (1975)France, 1820–1829 38.8 181 Blayo (1975)
Sweden, 1751–1755 37.8 203 Gille (1949)
Japan, 1776–1875 32.2 277 Saito (1997)
Source : Maddison (2001), table 1.4, p. 29.35 / 109

Lecture 1:Measuring ageing
Antoine Bozio
Introduction
I. Measuringageing
Demography
Age structure
Life tables
Past trends
Projections
II. Theories ofpopulation ageing
Malthusian model
Demographictransition
Baby boom
Ageing by the top
Limit to human life
III. Ageing as ahealth process
Ageing is becomingyounger
Morbidity vs mortality
Measuring health
Indicators of healthyageing
References
Figure 16: Life expectancy at birth (France)
20
30
40
50
60
70
80
90
1818 1833 1848 1863 1878 1893 1908 1923 1938 1953 1968 1983 1998 2013
Male
Female
Source : Human mortality database ; Vallin-Mesle (2001).
36 / 109

Lecture 1:Measuring ageing
Antoine Bozio
Introduction
I. Measuringageing
Demography
Age structure
Life tables
Past trends
Projections
II. Theories ofpopulation ageing
Malthusian model
Demographictransition
Baby boom
Ageing by the top
Limit to human life
III. Ageing as ahealth process
Ageing is becomingyounger
Morbidity vs mortality
Measuring health
Indicators of healthyageing
References
Figure 17: Life expectancy at birth (1550-2014)
15
25
35
45
55
65
75
85
1550 1600 1650 1700 1750 1800 1850 1900 1950 2000
Age
England
Sweden
France
Source : Blayo (1975) for France in the 18th c. ; Wrigley and Schofield (1981) for England ; Humanmortality database.
37 / 109

Lecture 1:Measuring ageing
Antoine Bozio
Introduction
I. Measuringageing
Demography
Age structure
Life tables
Past trends
Projections
II. Theories ofpopulation ageing
Malthusian model
Demographictransition
Baby boom
Ageing by the top
Limit to human life
III. Ageing as ahealth process
Ageing is becomingyounger
Morbidity vs mortality
Measuring health
Indicators of healthyageing
References
Figure 18: Life expectancy at age 65 (France)
8
10
12
14
16
18
20
22
24
1818 1833 1848 1863 1878 1893 1908 1923 1938 1953 1968 1983 1998 2013
Male
Female
Source : Human mortality database ; Vallin-Mesle (2001).
38 / 109
Lecture 1:Measuring ageing
Antoine Bozio
Introduction
I. Measuringageing
Demography
Age structure
Life tables
Past trends
Projections
II. Theories ofpopulation ageing
Malthusian model
Demographictransition
Baby boom
Ageing by the top
Limit to human life
III. Ageing as ahealth process
Ageing is becomingyounger
Morbidity vs mortality
Measuring health
Indicators of healthyageing
References
I. Measuring demographic ageing
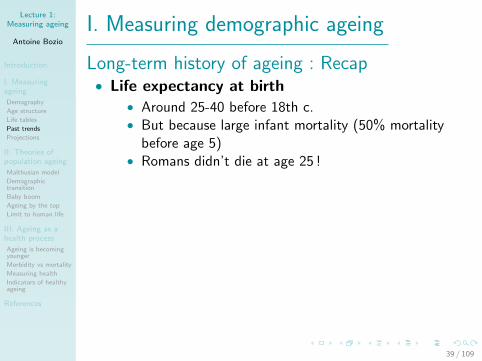
Long-term history of ageing : Recap• Life expectancy at birth
• Around 25-40 before 18th c.• But because large infant mortality (50% mortality
before age 5)• Romans didn’t die at age 25 !
• Similar mortality experience before 18th c.• Death rates pattern similar from Neolithic to 17th c.• There were old people in the past• Cicero “old age starts at 60”
• Major change since 17th-18th c.• Drop in infant mortality since 17th c.• Drop in mortality at older age much more recent
(after 1945)
39 / 109

Lecture 1:Measuring ageing
Antoine Bozio
Introduction
I. Measuringageing
Demography
Age structure
Life tables
Past trends
Projections
II. Theories ofpopulation ageing
Malthusian model
Demographictransition
Baby boom
Ageing by the top
Limit to human life
III. Ageing as ahealth process
Ageing is becomingyounger
Morbidity vs mortality
Measuring health
Indicators of healthyageing
References
I. Measuring demographic ageing
Long-term history of ageing : Recap• Life expectancy at birth
• Around 25-40 before 18th c.• But because large infant mortality (50% mortality
before age 5)• Romans didn’t die at age 25 !
• Similar mortality experience before 18th c.• Death rates pattern similar from Neolithic to 17th c.• There were old people in the past• Cicero “old age starts at 60”
• Major change since 17th-18th c.• Drop in infant mortality since 17th c.• Drop in mortality at older age much more recent
(after 1945)
39 / 109
Lecture 1:Measuring ageing
Antoine Bozio
Introduction
I. Measuringageing
Demography
Age structure
Life tables
Past trends
Projections
II. Theories ofpopulation ageing
Malthusian model
Demographictransition
Baby boom
Ageing by the top
Limit to human life
III. Ageing as ahealth process
Ageing is becomingyounger
Morbidity vs mortality
Measuring health
Indicators of healthyageing
References
I. Measuring demographic ageing
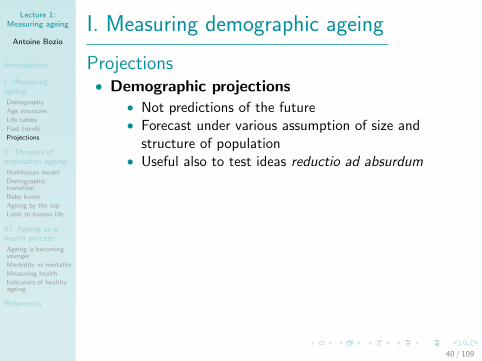
Projections• Demographic projections
• Not predictions of the future• Forecast under various assumption of size and
structure of population• Useful also to test ideas reductio ad absurdum
• The component method• Old method (Leslie, 1945)• Also named macrosimulation• Used with matrix algebra, hence the “Leslie matrix”
• Principles• Population Pt at time t, split by age and sex• Population Pt+1 is Pt aged by one year : affected by
mortality rates, births, and migration
40 / 109

Lecture 1:Measuring ageing
Antoine Bozio
Introduction
I. Measuringageing
Demography
Age structure
Life tables
Past trends
Projections
II. Theories ofpopulation ageing
Malthusian model
Demographictransition
Baby boom
Ageing by the top
Limit to human life
III. Ageing as ahealth process
Ageing is becomingyounger
Morbidity vs mortality
Measuring health
Indicators of healthyageing
References
I. Measuring demographic ageing
Projections
• Notations• Pa,t : population age a at time t• qa,t : age specific mortality rates• fa,t : age specific fertility rates• Nt : births at time t• Ma,t : migration by age a at time t
• Recurrence equation
Pa,t = Pa−1,t−1(1 − qa,t)
P0,1 = Nt =50∑
a=15
fa,tPa,t
41 / 109
Lecture 1:Measuring ageing
Antoine Bozio
Introduction
I. Measuringageing
Demography
Age structure
Life tables
Past trends
Projections
II. Theories ofpopulation ageing
Malthusian model
Demographictransition
Baby boom
Ageing by the top
Limit to human life
III. Ageing as ahealth process
Ageing is becomingyounger
Morbidity vs mortality
Measuring health
Indicators of healthyageing
References
I. Measuring demographic ageing
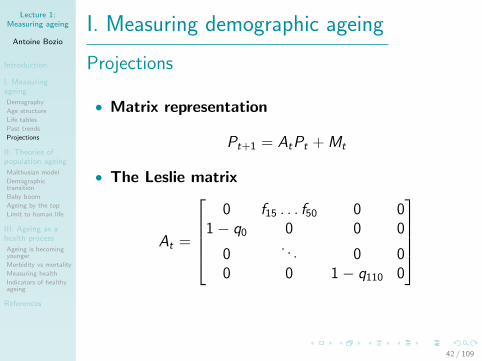
Projections
• Matrix representation
Pt+1 = AtPt + Mt
• The Leslie matrix
At =
0 f15 . . . f50 0 0
1 − q0 0 0 0
0. . . 0 0
0 0 1 − q110 0
42 / 109

Lecture 1:Measuring ageing
Antoine Bozio
Introduction
I. Measuringageing
Demography
Age structure
Life tables
Past trends
Projections
II. Theories ofpopulation ageing
Malthusian model
Demographictransition
Baby boom
Ageing by the top
Limit to human life
III. Ageing as ahealth process
Ageing is becomingyounger
Morbidity vs mortality
Measuring health
Indicators of healthyageing
References
I. Measuring demographic ageing
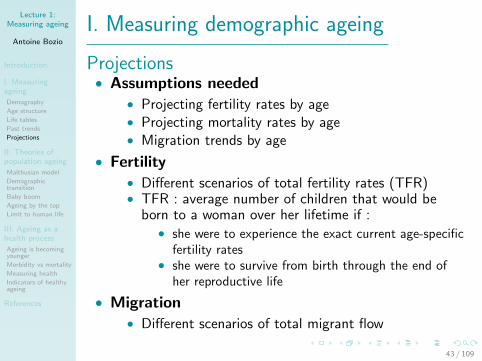
Projections• Assumptions needed
• Projecting fertility rates by age• Projecting mortality rates by age• Migration trends by age
• Fertility• Different scenarios of total fertility rates (TFR)• TFR : average number of children that would be
born to a woman over her lifetime if :• she were to experience the exact current age-specific
fertility rates• she were to survive from birth through the end of
her reproductive life
• Migration• Different scenarios of total migrant flow
43 / 109

Lecture 1:Measuring ageing
Antoine Bozio
Introduction
I. Measuringageing
Demography
Age structure
Life tables
Past trends
Projections
II. Theories ofpopulation ageing
Malthusian model
Demographictransition
Baby boom
Ageing by the top
Limit to human life
III. Ageing as ahealth process
Ageing is becomingyounger
Morbidity vs mortality
Measuring health
Indicators of healthyageing
References
I. Measuring demographic ageing
Projections• Assumptions needed
• Projecting fertility rates by age• Projecting mortality rates by age• Migration trends by age
• Fertility• Different scenarios of total fertility rates (TFR)• TFR : average number of children that would be
born to a woman over her lifetime if :• she were to experience the exact current age-specific
fertility rates• she were to survive from birth through the end of
her reproductive life
• Migration• Different scenarios of total migrant flow
43 / 109
Lecture 1:Measuring ageing
Antoine Bozio
Introduction
I. Measuringageing
Demography
Age structure
Life tables
Past trends
Projections
II. Theories ofpopulation ageing
Malthusian model
Demographictransition
Baby boom
Ageing by the top
Limit to human life
III. Ageing as ahealth process
Ageing is becomingyounger
Morbidity vs mortality
Measuring health
Indicators of healthyageing
References
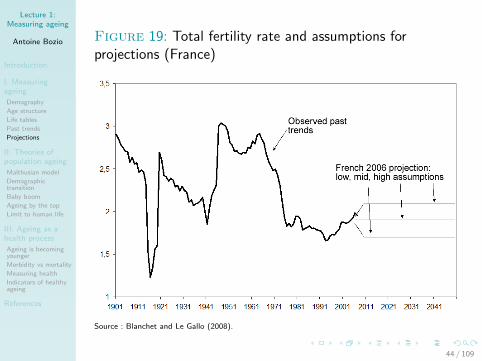
Figure 19: Total fertility rate and assumptions forprojections (France)
Source : Blanchet and Le Gallo (2008).
44 / 109
Lecture 1:Measuring ageing
Antoine Bozio
Introduction
I. Measuringageing
Demography
Age structure
Life tables
Past trends
Projections
II. Theories ofpopulation ageing
Malthusian model
Demographictransition
Baby boom
Ageing by the top
Limit to human life
III. Ageing as ahealth process
Ageing is becomingyounger
Morbidity vs mortality
Measuring health
Indicators of healthyageing
References
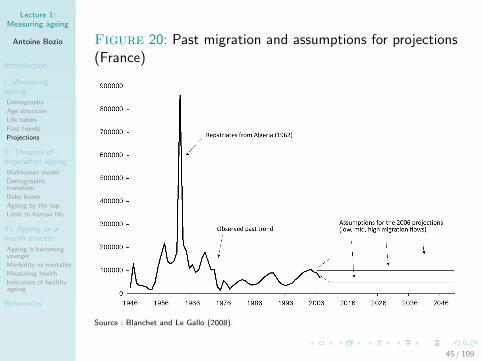
Figure 20: Past migration and assumptions for projections(France)
Source : Blanchet and Le Gallo (2008).
45 / 109

Lecture 1:Measuring ageing
Antoine Bozio
Introduction
I. Measuringageing
Demography
Age structure
Life tables
Past trends
Projections
II. Theories ofpopulation ageing
Malthusian model
Demographictransition
Baby boom
Ageing by the top
Limit to human life
III. Ageing as ahealth process
Ageing is becomingyounger
Morbidity vs mortality
Measuring health
Indicators of healthyageing
References
I. Measuring demographic ageing
Projections
• Methods for mortality forecasts
1 Using life expectancy targets2 Using past trends to extrapolate3 Using epidemiological explanations
• Targeting• Set target of life table• Use expert judgement for path to target• Useful for predicting changes in mortality when other
population experience provide good target• Past experience show very large errors
46 / 109

Lecture 1:Measuring ageing
Antoine Bozio
Introduction
I. Measuringageing
Demography
Age structure
Life tables
Past trends
Projections
II. Theories ofpopulation ageing
Malthusian model
Demographictransition
Baby boom
Ageing by the top
Limit to human life
III. Ageing as ahealth process
Ageing is becomingyounger
Morbidity vs mortality
Measuring health
Indicators of healthyageing
References
I. Measuring demographic ageing
Projections
• Extrapolation• Extrapolation methods from past trends• Component methods, APC, etc.• Lee-Carter model• Most popular forecasting methods
• Epidemiological explanations• Epidemiological models• Little use so far in mortality forecasting
47 / 109
Lecture 1:Measuring ageing
Antoine Bozio
Introduction
I. Measuringageing
Demography
Age structure
Life tables
Past trends
Projections
II. Theories ofpopulation ageing
Malthusian model
Demographictransition
Baby boom
Ageing by the top
Limit to human life
III. Ageing as ahealth process
Ageing is becomingyounger
Morbidity vs mortality
Measuring health
Indicators of healthyageing
References
I. Measuring demographic ageing
Projections
• United Nations projections• World coverage, updated every two years• Estimates provided since 1950s• Assessment of past accuracy is possible
• Main facts• Increase in world population from 7 to 11 billion by
2100• Large increase in the share of older group
• 60+ : from 0.7 to 3 bn• 80+ : from 0.1 to 0.9 bn
• Large heterogeneity in the timing of ageing acrossregions
48 / 109
Lecture 1:Measuring ageing
Antoine Bozio
Introduction
I. Measuringageing
Demography
Age structure
Life tables
Past trends
Projections
II. Theories ofpopulation ageing
Malthusian model
Demographictransition
Baby boom
Ageing by the top
Limit to human life
III. Ageing as ahealth process
Ageing is becomingyounger
Morbidity vs mortality
Measuring health
Indicators of healthyageing
References
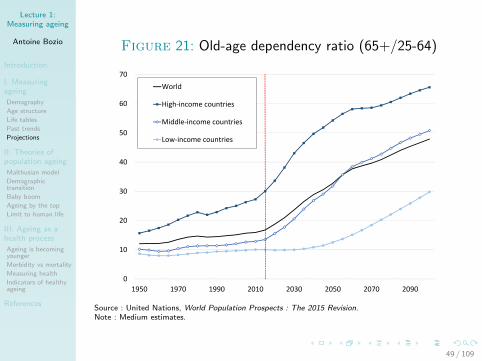
Figure 21: Old-age dependency ratio (65+/25-64)
0
10
20
30
40
50
60
70
1950 1970 1990 2010 2030 2050 2070 2090
World
High-income countries
Middle-income countries
Low-income countries
Source : United Nations, World Population Prospects : The 2015 Revision.Note : Medium estimates.
49 / 109

Lecture 1:Measuring ageing
Antoine Bozio
Introduction
I. Measuringageing
Demography
Age structure
Life tables
Past trends
Projections
II. Theories ofpopulation ageing
Malthusian model
Demographictransition
Baby boom
Ageing by the top
Limit to human life
III. Ageing as ahealth process
Ageing is becomingyounger
Morbidity vs mortality
Measuring health
Indicators of healthyageing
References
Figure 22: Old-age dependency ratio (65+/25-64)
0
10
20
30
40
50
60
70
80
90
100
1950 1970 1990 2010 2030 2050 2070 2090
Africa
Asia
Europe
Latin America
Northern America
China
India
Japan
Source : United Nations, World Population Prospects : The 2015 Revision.Note : Medium estimates.
50 / 109
Lecture 1:Measuring ageing
Antoine Bozio
Introduction
I. Measuringageing
Demography
Age structure
Life tables
Past trends
Projections
II. Theories ofpopulation ageing
Malthusian model
Demographictransition
Baby boom
Ageing by the top
Limit to human life
III. Ageing as ahealth process
Ageing is becomingyounger
Morbidity vs mortality
Measuring health
Indicators of healthyageing
References
I. Measuring demographic ageing
Projections
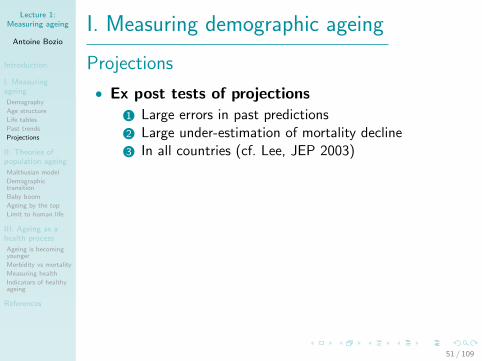
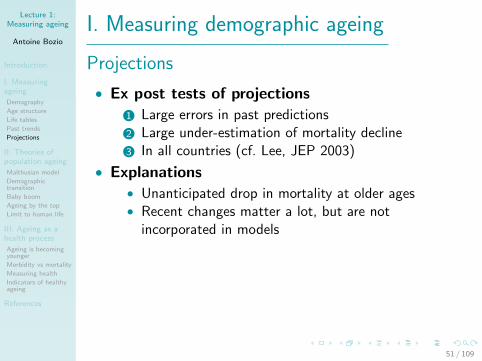
• Ex post tests of projections
1 Large errors in past predictions2 Large under-estimation of mortality decline3 In all countries (cf. Lee, JEP 2003)
• Explanations• Unanticipated drop in mortality at older ages• Recent changes matter a lot, but are not
incorporated in models
• How to deal with uncertainty• Be explicit about the level of uncertainty (cf.
Blanchet and Le Gallo, 2008)• Use variants of scenarios or stochastic projections
51 / 109
Lecture 1:Measuring ageing
Antoine Bozio
Introduction
I. Measuringageing
Demography
Age structure
Life tables
Past trends
Projections
II. Theories ofpopulation ageing
Malthusian model
Demographictransition
Baby boom
Ageing by the top
Limit to human life
III. Ageing as ahealth process
Ageing is becomingyounger
Morbidity vs mortality
Measuring health
Indicators of healthyageing
References
I. Measuring demographic ageing
Projections
• Ex post tests of projections
1 Large errors in past predictions2 Large under-estimation of mortality decline3 In all countries (cf. Lee, JEP 2003)
• Explanations• Unanticipated drop in mortality at older ages• Recent changes matter a lot, but are not
incorporated in models
• How to deal with uncertainty• Be explicit about the level of uncertainty (cf.
Blanchet and Le Gallo, 2008)• Use variants of scenarios or stochastic projections
51 / 109
Lecture 1:Measuring ageing
Antoine Bozio
Introduction
I. Measuringageing
Demography
Age structure
Life tables
Past trends
Projections
II. Theories ofpopulation ageing
Malthusian model
Demographictransition
Baby boom
Ageing by the top
Limit to human life
III. Ageing as ahealth process
Ageing is becomingyounger
Morbidity vs mortality
Measuring health
Indicators of healthyageing
References
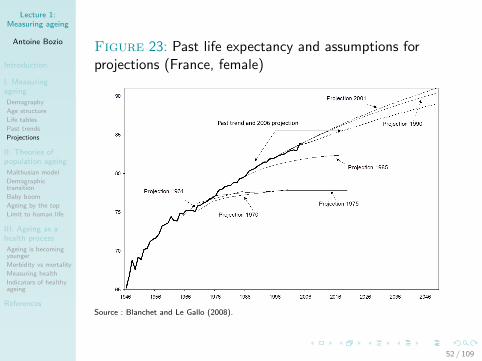
Figure 23: Past life expectancy and assumptions forprojections (France, female)
Source : Blanchet and Le Gallo (2008).
52 / 109

Lecture 1:Measuring ageing
Antoine Bozio
Introduction
I. Measuringageing
Demography
Age structure
Life tables
Past trends
Projections
II. Theories ofpopulation ageing
Malthusian model
Demographictransition
Baby boom
Ageing by the top
Limit to human life
III. Ageing as ahealth process
Ageing is becomingyounger
Morbidity vs mortality
Measuring health
Indicators of healthyageing
References
Figure 24: Past life expectancy and assumptions forprojections (France, male)
Source : Blanchet and Le Gallo (2008).
53 / 109

Lecture 1:Measuring ageing
Antoine Bozio
Introduction
I. Measuringageing
Demography
Age structure
Life tables
Past trends
Projections
II. Theories ofpopulation ageing
Malthusian model
Demographictransition
Baby boom
Ageing by the top
Limit to human life
III. Ageing as ahealth process
Ageing is becomingyounger
Morbidity vs mortality
Measuring health
Indicators of healthyageing
References
Figure 25: Old-age dependency ratio (60+/15-59) (France)
Source : Blanchet and Le Gallo (2008).
54 / 109

Lecture 1:Measuring ageing
Antoine Bozio
Introduction
I. Measuringageing
Demography
Age structure
Life tables
Past trends
Projections
II. Theories ofpopulation ageing
Malthusian model
Demographictransition
Baby boom
Ageing by the top
Limit to human life
III. Ageing as ahealth process
Ageing is becomingyounger
Morbidity vs mortality
Measuring health
Indicators of healthyageing
References
Figure 26: World old-age dependency ratio with fertilityvariants
0
10
20
30
40
50
60
70
1950 1970 1990 2010 2030 2050 2070 2090
Low fertility variant
Medium fertility variant
High fertility variant
Source : United Nations, World Population Prospects : The 2015 Revision.Note : Medium estimates.
55 / 109

Lecture 1:Measuring ageing
Antoine Bozio
Introduction
I. Measuringageing
Demography
Age structure
Life tables
Past trends
Projections
II. Theories ofpopulation ageing
Malthusian model
Demographictransition
Baby boom
Ageing by the top
Limit to human life
III. Ageing as ahealth process
Ageing is becomingyounger
Morbidity vs mortality
Measuring health
Indicators of healthyageing
References
II. Theories of population ageing
1 Malthusian model
2 Demographic transition
3 Baby-boom and papy-boom
4 Ageing by the top
5 Which limit to human life ?
56 / 109
Lecture 1:Measuring ageing
Antoine Bozio
Introduction
I. Measuringageing
Demography
Age structure
Life tables
Past trends
Projections
II. Theories ofpopulation ageing
Malthusian model
Demographictransition
Baby boom
Ageing by the top
Limit to human life
III. Ageing as ahealth process
Ageing is becomingyounger
Morbidity vs mortality
Measuring health
Indicators of healthyageing
References
II. Theories of population ageing
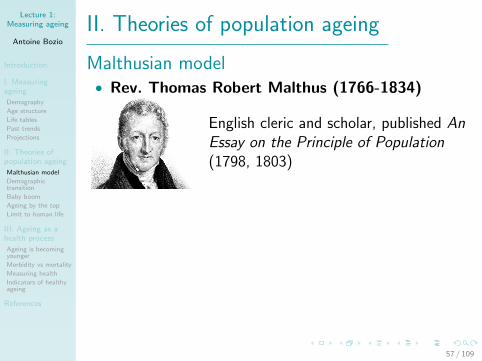
Malthusian model• Rev. Thomas Robert Malthus (1766-1834)
English cleric and scholar, published AnEssay on the Principle of Population(1798, 1803)
• “Principes of population”• Population growth expands in period of plenty• Population growth leads to lower wages• Lower wages lead to poverty
• “positive and preventive checks”• “positive checks” : higher mortality• “preventive checks” : lower fertility
57 / 109

Lecture 1:Measuring ageing
Antoine Bozio
Introduction
I. Measuringageing
Demography
Age structure
Life tables
Past trends
Projections
II. Theories ofpopulation ageing
Malthusian model
Demographictransition
Baby boom
Ageing by the top
Limit to human life
III. Ageing as ahealth process
Ageing is becomingyounger
Morbidity vs mortality
Measuring health
Indicators of healthyageing
References
II. Theories of population ageing
Figure 27: Malthusian model
Source : Lee (1997), fig. 1.
58 / 109

Lecture 1:Measuring ageing
Antoine Bozio
Introduction
I. Measuringageing
Demography
Age structure
Life tables
Past trends
Projections
II. Theories ofpopulation ageing
Malthusian model
Demographictransition
Baby boom
Ageing by the top
Limit to human life
III. Ageing as ahealth process
Ageing is becomingyounger
Morbidity vs mortality
Measuring health
Indicators of healthyageing
References
II. Theories of population ageing
Malthusian model• Popularity of the malthusian model
• Biological model (Darwin) ; anthropologists ;
• Was the pre-industrial world malthusian ?• Evidence of “malthusian trap” : little gains in
standard of living before 1800• Some empirical support for malthusian model (Lee,
1997 ; Lee and Anderson, 2002)• Wages reacted strongly to changes in population
(e.g. Black Death in 1348)• But weak tests for the “positive checks”
• Debate around series for England• England has uniquely good wage and price history• Debate among economic historians• Controversy around G. Clark Farewell to Alms
59 / 109

Lecture 1:Measuring ageing
Antoine Bozio
Introduction
I. Measuringageing
Demography
Age structure
Life tables
Past trends
Projections
II. Theories ofpopulation ageing
Malthusian model
Demographictransition
Baby boom
Ageing by the top
Limit to human life
III. Ageing as ahealth process
Ageing is becomingyounger
Morbidity vs mortality
Measuring health
Indicators of healthyageing
References
Figure 28: Two real wages series for England (1200-1870)
Sources : Clark (2005), fig. 4, PBH : Phelps, Brown and Hopkins (1981), table A2 ; New : Clark (2005).
60 / 109
Lecture 1:Measuring ageing
Antoine Bozio
Introduction
I. Measuringageing
Demography
Age structure
Life tables
Past trends
Projections
II. Theories ofpopulation ageing
Malthusian model
Demographictransition
Baby boom
Ageing by the top
Limit to human life
III. Ageing as ahealth process
Ageing is becomingyounger
Morbidity vs mortality
Measuring health
Indicators of healthyageing
References
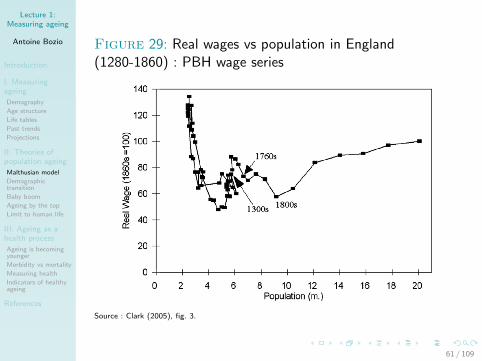
Figure 29: Real wages vs population in England(1280-1860) : PBH wage series
Source : Clark (2005), fig. 3.
61 / 109

Lecture 1:Measuring ageing
Antoine Bozio
Introduction
I. Measuringageing
Demography
Age structure
Life tables
Past trends
Projections
II. Theories ofpopulation ageing
Malthusian model
Demographictransition
Baby boom
Ageing by the top
Limit to human life
III. Ageing as ahealth process
Ageing is becomingyounger
Morbidity vs mortality
Measuring health
Indicators of healthyageing
References
Figure 30: Real wages vs population in England(1280-1860) : Clark wage series
Source : Clark (2005), fig. 5.
62 / 109
Lecture 1:Measuring ageing
Antoine Bozio
Introduction
I. Measuringageing
Demography
Age structure
Life tables
Past trends
Projections
II. Theories ofpopulation ageing
Malthusian model
Demographictransition
Baby boom
Ageing by the top
Limit to human life
III. Ageing as ahealth process
Ageing is becomingyounger
Morbidity vs mortality
Measuring health
Indicators of healthyageing
References
II. Theories of population ageing
Demographic transition
• The concept of “demographic transition”• US Warren Thompson (1929)• French Adolphe Landry (1934) : revolution
demographique• US scholars, Davis (1945) and Notestein (1945)
coined the phrase• See survey by Vallin (2006)
• Basic model
1 Phase 1 : high mortality, high fertility, no growth2 Phase 2 : drop in mortality, high fertility, growth3 Phase 3 : drop in fertility, no growth
63 / 109

Lecture 1:Measuring ageing
Antoine Bozio
Introduction
I. Measuringageing
Demography
Age structure
Life tables
Past trends
Projections
II. Theories ofpopulation ageing
Malthusian model
Demographictransition
Baby boom
Ageing by the top
Limit to human life
III. Ageing as ahealth process
Ageing is becomingyounger
Morbidity vs mortality
Measuring health
Indicators of healthyageing
References
II. Theories of population ageing
Demographic transition
Figure 31: Demographic transition model
Source : courtesy of Didier Blanchet.
64 / 109

Lecture 1:Measuring ageing
Antoine Bozio
Introduction
I. Measuringageing
Demography
Age structure
Life tables
Past trends
Projections
II. Theories ofpopulation ageing
Malthusian model
Demographictransition
Baby boom
Ageing by the top
Limit to human life
III. Ageing as ahealth process
Ageing is becomingyounger
Morbidity vs mortality
Measuring health
Indicators of healthyageing
References
II. Theories of population ageing
Demographic transition• Health transition in Europe (1800-1940)
• Order of magnitude : from 4-5% to 1-1.5%• Reductions in infectious diseases• Reductions in famine mortality
• Determinants of decline in mortality• See Cutler, Deaton and Lleras-Munet (JEP, 2006)
1 Improved nutrition (Fogel, 1997) : improvement instorage, transportation, market integrations
2 Public health (Preston, 1975) : sanitation systems,draining swamps, personal hygiene
3 Vaccination : smallpox vaccine (Jenner, 1798) ;germ theory of disease (Pasteur, 1860s)
4 Medical treatments : antibiotics (1930s, 1940s)
65 / 109
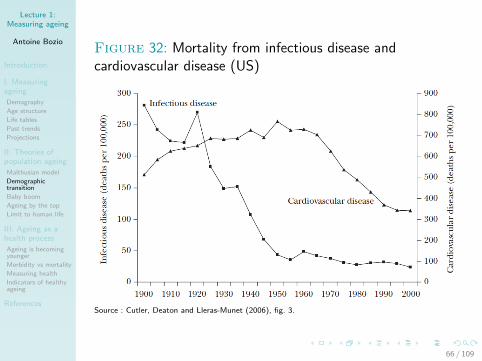
Lecture 1:Measuring ageing
Antoine Bozio
Introduction
I. Measuringageing
Demography
Age structure
Life tables
Past trends
Projections
II. Theories ofpopulation ageing
Malthusian model
Demographictransition
Baby boom
Ageing by the top
Limit to human life
III. Ageing as ahealth process
Ageing is becomingyounger
Morbidity vs mortality
Measuring health
Indicators of healthyageing
References
Figure 32: Mortality from infectious disease andcardiovascular disease (US)
Source : Cutler, Deaton and Lleras-Munet (2006), fig. 3.
66 / 109

Lecture 1:Measuring ageing
Antoine Bozio
Introduction
I. Measuringageing
Demography
Age structure
Life tables
Past trends
Projections
II. Theories ofpopulation ageing
Malthusian model
Demographictransition
Baby boom
Ageing by the top
Limit to human life
III. Ageing as ahealth process
Ageing is becomingyounger
Morbidity vs mortality
Measuring health
Indicators of healthyageing
References
II. Theories of population ageing
Demographic transition• Fertility transition in Europe (1800-1940)
• Cohort fertility rate declined from 4-5 in 19 c. to2-2.5 after mid-20 c.
• Different timing of fertility reduction• French fertility dropped earlier in the 19c.
• Determinants of decline in fertility• Still debated : see Guinnane (JEP, 2011)
1 Decline in infant mortality : but France and USoutliers (fertility declined before)
2 Contraception : coitus interruptus and abstinence3 Costs/returns to having children : housing costs,
child-labour law, better work opportunities forwomen, education, social-insurance systems
67 / 109

Lecture 1:Measuring ageing
Antoine Bozio
Introduction
I. Measuringageing
Demography
Age structure
Life tables
Past trends
Projections
II. Theories ofpopulation ageing
Malthusian model
Demographictransition
Baby boom
Ageing by the top
Limit to human life
III. Ageing as ahealth process
Ageing is becomingyounger
Morbidity vs mortality
Measuring health
Indicators of healthyageing
References
Figure 33: Death and fertility in Sweden (1740–2014)
1020
3040
50C
rude
dea
th/b
irth
rate
(per
100
0)
1750 1800 1850 1900 1950 2000Year
Crude birth rate
Crude death rate
Source : Human mortality database, own computations.Note : crude death rates and fertility rates for both sexes, per 1000 individuals.
68 / 109

Lecture 1:Measuring ageing
Antoine Bozio
Introduction
I. Measuringageing
Demography
Age structure
Life tables
Past trends
Projections
II. Theories ofpopulation ageing
Malthusian model
Demographictransition
Baby boom
Ageing by the top
Limit to human life
III. Ageing as ahealth process
Ageing is becomingyounger
Morbidity vs mortality
Measuring health
Indicators of healthyageing
References
Figure 34: Crude birth rates, 1820-1970
Source : Guinnane, JEP 2011, fig. 1.69 / 109

Lecture 1:Measuring ageing
Antoine Bozio
Introduction
I. Measuringageing
Demography
Age structure
Life tables
Past trends
Projections
II. Theories ofpopulation ageing
Malthusian model
Demographictransition
Baby boom
Ageing by the top
Limit to human life
III. Ageing as ahealth process
Ageing is becomingyounger
Morbidity vs mortality
Measuring health
Indicators of healthyageing
References
Figure 35: Cohort fertility rates, 1820-1970
Source : Guinnane, JEP 2011, fig. 3.Note : cohort fertility rate is the mean number of children born to women belonging to the birth cohorton the horizontal axis.
70 / 109
Lecture 1:Measuring ageing
Antoine Bozio
Introduction
I. Measuringageing
Demography
Age structure
Life tables
Past trends
Projections
II. Theories ofpopulation ageing
Malthusian model
Demographictransition
Baby boom
Ageing by the top
Limit to human life
III. Ageing as ahealth process
Ageing is becomingyounger
Morbidity vs mortality
Measuring health
Indicators of healthyageing
References
II. Theories of population ageing
Baby-boom• Increase in fertility in the US and Europe (1946-1970)
• Modeling baby-booms• Higher population growth• First younger population, increase in child
dependency ratio• Then, more active population, reduction in old-age
dependency ratio• With ageing of babyboomers, back to previous trend• Baby-boom : U-shaped old-age dependency ratio,
rather than hump-shaped
• Baby-bust• A baby bust followed the baby boom• Hump-shaped old-age dependency ratio
71 / 109
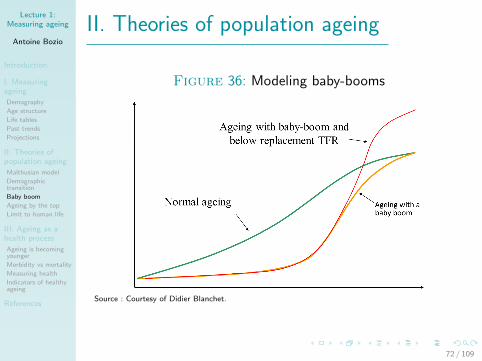
Lecture 1:Measuring ageing
Antoine Bozio
Introduction
I. Measuringageing
Demography
Age structure
Life tables
Past trends
Projections
II. Theories ofpopulation ageing
Malthusian model
Demographictransition
Baby boom
Ageing by the top
Limit to human life
III. Ageing as ahealth process
Ageing is becomingyounger
Morbidity vs mortality
Measuring health
Indicators of healthyageing
References
II. Theories of population ageing
Figure 36: Modeling baby-booms
Source : Courtesy of Didier Blanchet.
72 / 109

Lecture 1:Measuring ageing
Antoine Bozio
Introduction
I. Measuringageing
Demography
Age structure
Life tables
Past trends
Projections
II. Theories ofpopulation ageing
Malthusian model
Demographictransition
Baby boom
Ageing by the top
Limit to human life
III. Ageing as ahealth process
Ageing is becomingyounger
Morbidity vs mortality
Measuring health
Indicators of healthyageing
References
II. Theories of population ageing
Figure 37: Decomposing ageing in France (old-agedependency ratio)
Source : Blanchet and Le Gallo, Insee Analyses, Sept. 2013.
73 / 109

Lecture 1:Measuring ageing
Antoine Bozio
Introduction
I. Measuringageing
Demography
Age structure
Life tables
Past trends
Projections
II. Theories ofpopulation ageing
Malthusian model
Demographictransition
Baby boom
Ageing by the top
Limit to human life
III. Ageing as ahealth process
Ageing is becomingyounger
Morbidity vs mortality
Measuring health
Indicators of healthyageing
References
II. Theories of population ageing
Ageing by the bottom
• Ageing by the bottom• Ageing driven by fertility decrease : reductions in
number of youths or prime aged individuals• Historically decline in infant mortality led to increase
in the share of the 60+
• French debate in late 19th c. (Bourdelais, 1993)• Jacques Bertillon of Alliance pour l’accroissement de
la population francaise), a pro-natality lobbydeplored low fertility as the cause of an aged andfeeble population
• Alfred Sauvy (1928), a French demographer, usedthe term “population ageing”, establishing thescientific explanations for ageing by the bottom
74 / 109

Lecture 1:Measuring ageing
Antoine Bozio
Introduction
I. Measuringageing
Demography
Age structure
Life tables
Past trends
Projections
II. Theories ofpopulation ageing
Malthusian model
Demographictransition
Baby boom
Ageing by the top
Limit to human life
III. Ageing as ahealth process
Ageing is becomingyounger
Morbidity vs mortality
Measuring health
Indicators of healthyageing
References
II. Theories of population ageing
Ageing by the top
• A prolonged view despite demographic change• Ageing by the bottom became the prevailing
orthodoxy in demography after WWII• Debate in the 1990s on ageing, with focus on low
fertility rate (Blanchet and Le Gallo, 2008)• Pension debate concentrated on need to increase
fertility or favour immigration
• Ageing by the top• More recent realisation that recent ageing process is
essentially ageing by the top• Recent gains in life expectancy come from gains at
older ages• Variety of experience at international level
75 / 109
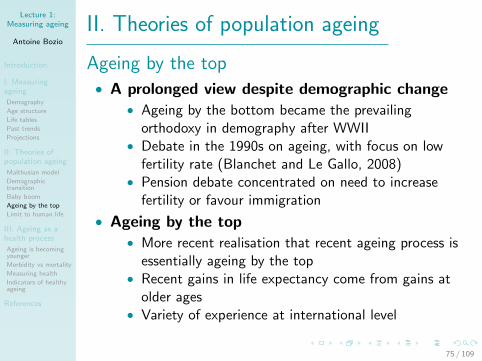
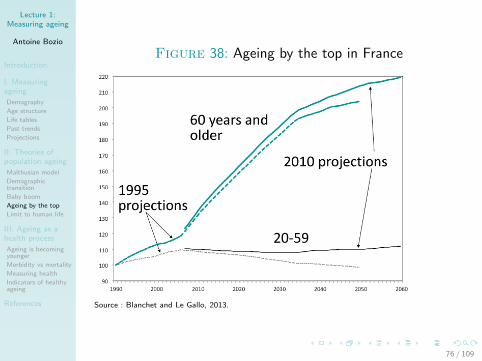
Lecture 1:Measuring ageing
Antoine Bozio
Introduction
I. Measuringageing
Demography
Age structure
Life tables
Past trends
Projections
II. Theories ofpopulation ageing
Malthusian model
Demographictransition
Baby boom
Ageing by the top
Limit to human life
III. Ageing as ahealth process
Ageing is becomingyounger
Morbidity vs mortality
Measuring health
Indicators of healthyageing
References
Figure 38: Ageing by the top in France
Source : Blanchet and Le Gallo, 2013.
76 / 109

Lecture 1:Measuring ageing
Antoine Bozio
Introduction
I. Measuringageing
Demography
Age structure
Life tables
Past trends
Projections
II. Theories ofpopulation ageing
Malthusian model
Demographictransition
Baby boom
Ageing by the top
Limit to human life
III. Ageing as ahealth process
Ageing is becomingyounger
Morbidity vs mortality
Measuring health
Indicators of healthyageing
References
Figure 39: Ageing by the top in the EU (2014-2080)
1,00 0,75 0,50 0,25 0,00 0,25 0,50 0,75 1,00
0
10
20
30
40
50
60
70
80
90
100+
Age
Men (2080)
Men (2014)
Women (2080)
Women (2014)
Source : Eurostat People in the EU : who are we and how do we live ? (June 2015).
77 / 109

Lecture 1:Measuring ageing
Antoine Bozio
Introduction
I. Measuringageing
Demography
Age structure
Life tables
Past trends
Projections
II. Theories ofpopulation ageing
Malthusian model
Demographictransition
Baby boom
Ageing by the top
Limit to human life
III. Ageing as ahealth process
Ageing is becomingyounger
Morbidity vs mortality
Measuring health
Indicators of healthyageing
References
Figure 40: Relative growth of 15-64 vs 65 + (EU 27)
Source : Eurostat.
78 / 109

Lecture 1:Measuring ageing
Antoine Bozio
Introduction
I. Measuringageing
Demography
Age structure
Life tables
Past trends
Projections
II. Theories ofpopulation ageing
Malthusian model
Demographictransition
Baby boom
Ageing by the top
Limit to human life
III. Ageing as ahealth process
Ageing is becomingyounger
Morbidity vs mortality
Measuring health
Indicators of healthyageing
References
II. Theories of population ageing
Ageing by the top• New demographic transition
• Eggleston and Fuchs (JEP 2012)• Ageing at older ages change the demographic
dynamics
• Traditional demographic transition• Decrease in mortality rates at productive ages• No change in the likelihood to end up in retirement• Debate around “demographic dividend” (Bloom,
Canning and Sevilla, 2003)
• Longevity transition• Decrease in mortality at older “unproductive” ages• Potential negative impact on labour force
participation, innovation, public finances, etc.
79 / 109
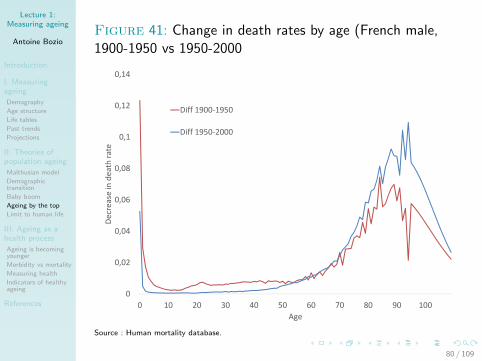
Lecture 1:Measuring ageing
Antoine Bozio
Introduction
I. Measuringageing
Demography
Age structure
Life tables
Past trends
Projections
II. Theories ofpopulation ageing
Malthusian model
Demographictransition
Baby boom
Ageing by the top
Limit to human life
III. Ageing as ahealth process
Ageing is becomingyounger
Morbidity vs mortality
Measuring health
Indicators of healthyageing
References
Figure 41: Change in death rates by age (French male,1900-1950 vs 1950-2000
0
0,02
0,04
0,06
0,08
0,1
0,12
0,14
0 10 20 30 40 50 60 70 80 90 100
De
cre
ase
in
de
ath
ra
te
Age
Diff 1900-1950
Diff 1950-2000
Source : Human mortality database.
80 / 109

Lecture 1:Measuring ageing
Antoine Bozio
Introduction
I. Measuringageing
Demography
Age structure
Life tables
Past trends
Projections
II. Theories ofpopulation ageing
Malthusian model
Demographictransition
Baby boom
Ageing by the top
Limit to human life
III. Ageing as ahealth process
Ageing is becomingyounger
Morbidity vs mortality
Measuring health
Indicators of healthyageing
References
Figure 42: U.S. expected labour force participation as ashare of life expectancy
Source : Eggleston and Fuchs, JEP 2012, fig. 4B.
81 / 109

Lecture 1:Measuring ageing
Antoine Bozio
Introduction
I. Measuringageing
Demography
Age structure
Life tables
Past trends
Projections
II. Theories ofpopulation ageing
Malthusian model
Demographictransition
Baby boom
Ageing by the top
Limit to human life
III. Ageing as ahealth process
Ageing is becomingyounger
Morbidity vs mortality
Measuring health
Indicators of healthyageing
References
II. Theories of population ageing
Which limit to human life ?
• Biological limit• Idea of biological limit to human lifespan (Fries,
1980)• But leaves open further gains to this limit• Implies a rectangularisation of the survival curve an
compression of morbidity
• Rectangularisation of the survival curve• Evidence is mixed : rectangularisation up to 1970s• But still gains in maximum life expectancy• Inequality in life expectancy limits rectangularisation
of the survival curve
82 / 109

Lecture 1:Measuring ageing
Antoine Bozio
Introduction
I. Measuringageing
Demography
Age structure
Life tables
Past trends
Projections
II. Theories ofpopulation ageing
Malthusian model
Demographictransition
Baby boom
Ageing by the top
Limit to human life
III. Ageing as ahealth process
Ageing is becomingyounger
Morbidity vs mortality
Measuring health
Indicators of healthyageing
References
Figure 43: French female survival curve (1850-2014)
020
040
060
080
010
00S
urvi
val r
ate
0 10 20 30 40 50 60 70 80 90 100 110 120Age
1850
1870
1900
1920
1945
1950
1960
1970
1980
1990
2014
Source : Human mortality database.
83 / 109

Lecture 1:Measuring ageing
Antoine Bozio
Introduction
I. Measuringageing
Demography
Age structure
Life tables
Past trends
Projections
II. Theories ofpopulation ageing
Malthusian model
Demographictransition
Baby boom
Ageing by the top
Limit to human life
III. Ageing as ahealth process
Ageing is becomingyounger
Morbidity vs mortality
Measuring health
Indicators of healthyageing
References
II. Theories of population ageing
Which limit to human life ?• Maximum life expectancy : past predictions
• Dublin (1928) : 65 years• Bourgeois-Pichat (1952) : 75-78 years• Olshanski et al. (1990) : 85 years• UN forecasts have repeatedly failed
• Oeppen and Vauper (Science, 2002)• Linear increase in highest life expectancy since 1880• According to trend : 109 years by 2100 ?• But not over the long term, growth of highest life
expectancy not so linear (Vallin and Mesle, 2010)
• Is there a limit ?• Slowdown of mortality rates at older ages• Roy Walford (1984) : 150 years with calorie
restriction
84 / 109

Lecture 1:Measuring ageing
Antoine Bozio
Introduction
I. Measuringageing
Demography
Age structure
Life tables
Past trends
Projections
II. Theories ofpopulation ageing
Malthusian model
Demographictransition
Baby boom
Ageing by the top
Limit to human life
III. Ageing as ahealth process
Ageing is becomingyounger
Morbidity vs mortality
Measuring health
Indicators of healthyageing
References
Figure 44: Record female life expectancy (1840-2001)
Source : Oeppen and Vaugel (2002), fig. 1.Notes : The linear-regression trend is depicted by a bold black line and the extrapolated trend by a dashedgray line. The horizontal black lines show asserted ceilings on life expectancy, with a short vertical lineindicating the year of publication. The dashed red lines denote projections of female life expectancy inJapan published by the United Nations in 1986, 1999, and 2001.
85 / 109
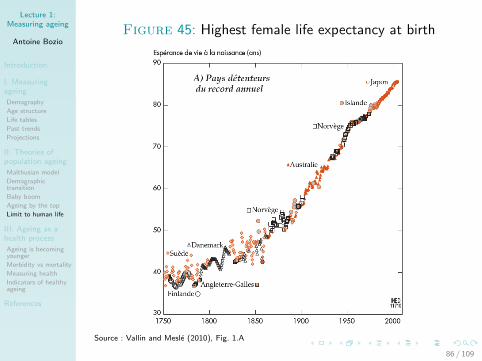
Lecture 1:Measuring ageing
Antoine Bozio
Introduction
I. Measuringageing
Demography
Age structure
Life tables
Past trends
Projections
II. Theories ofpopulation ageing
Malthusian model
Demographictransition
Baby boom
Ageing by the top
Limit to human life
III. Ageing as ahealth process
Ageing is becomingyounger
Morbidity vs mortality
Measuring health
Indicators of healthyageing
References
Figure 45: Highest female life expectancy at birth
Source : Vallin and Mesle (2010), Fig. 1.A
86 / 109

Lecture 1:Measuring ageing
Antoine Bozio
Introduction
I. Measuringageing
Demography
Age structure
Life tables
Past trends
Projections
II. Theories ofpopulation ageing
Malthusian model
Demographictransition
Baby boom
Ageing by the top
Limit to human life
III. Ageing as ahealth process
Ageing is becomingyounger
Morbidity vs mortality
Measuring health
Indicators of healthyageing
References
Figure 46: Growth of highest female life expectancy
Source : Vallin and Mesle (2010), Fig. 1.B
87 / 109

Lecture 1:Measuring ageing
Antoine Bozio
Introduction
I. Measuringageing
Demography
Age structure
Life tables
Past trends
Projections
II. Theories ofpopulation ageing
Malthusian model
Demographictransition
Baby boom
Ageing by the top
Limit to human life
III. Ageing as ahealth process
Ageing is becomingyounger
Morbidity vs mortality
Measuring health
Indicators of healthyageing
References
Figure 47: Growth of highest female life expectancy (atbirth, 40 and 60)
Source : Vallin and Mesle (2010), Fig. 288 / 109
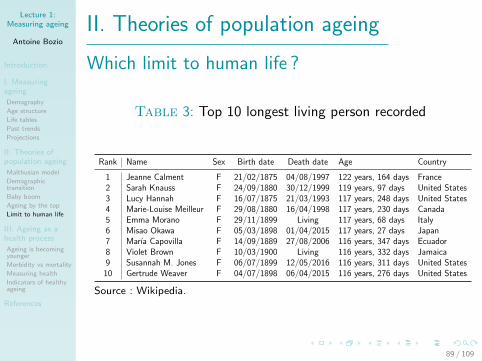
Lecture 1:Measuring ageing
Antoine Bozio
Introduction
I. Measuringageing
Demography
Age structure
Life tables
Past trends
Projections
II. Theories ofpopulation ageing
Malthusian model
Demographictransition
Baby boom
Ageing by the top
Limit to human life
III. Ageing as ahealth process
Ageing is becomingyounger
Morbidity vs mortality
Measuring health
Indicators of healthyageing
References
II. Theories of population ageing
Which limit to human life ?
Table 3: Top 10 longest living person recorded
Rank Name Sex Birth date Death date Age Country
1 Jeanne Calment F 21/02/1875 04/08/1997 122 years, 164 days France2 Sarah Knauss F 24/09/1880 30/12/1999 119 years, 97 days United States3 Lucy Hannah F 16/07/1875 21/03/1993 117 years, 248 days United States4 Marie-Louise Meilleur F 29/08/1880 16/04/1998 117 years, 230 days Canada5 Emma Morano F 29/11/1899 Living 117 years, 68 days Italy6 Misao Okawa F 05/03/1898 01/04/2015 117 years, 27 days Japan7 Marıa Capovilla F 14/09/1889 27/08/2006 116 years, 347 days Ecuador8 Violet Brown F 10/03/1900 Living 116 years, 332 days Jamaica9 Susannah M. Jones F 06/07/1899 12/05/2016 116 years, 311 days United States
10 Gertrude Weaver F 04/07/1898 06/04/2015 116 years, 276 days United States
Source : Wikipedia.
89 / 109

Lecture 1:Measuring ageing
Antoine Bozio
Introduction
I. Measuringageing
Demography
Age structure
Life tables
Past trends
Projections
II. Theories ofpopulation ageing
Malthusian model
Demographictransition
Baby boom
Ageing by the top
Limit to human life
III. Ageing as ahealth process
Ageing is becomingyounger
Morbidity vs mortality
Measuring health
Indicators of healthyageing
References
III. Ageing as a health process
1 Ageing is becoming younger
2 Morbidity vs mortality
3 Measuring health
4 Indicators of healthy ageing
90 / 109

Lecture 1:Measuring ageing
Antoine Bozio
Introduction
I. Measuringageing
Demography
Age structure
Life tables
Past trends
Projections
II. Theories ofpopulation ageing
Malthusian model
Demographictransition
Baby boom
Ageing by the top
Limit to human life
III. Ageing as ahealth process
Ageing is becomingyounger
Morbidity vs mortality
Measuring health
Indicators of healthyageing
References
III. Ageing as a health process
Is ageing an obsolete notion ?
• Ageing, a misleading concept• Standard reference to a fixed age (e.g., 60 or 65)• Reference determined in late 18th c.• Health and social position of the 60+ have
dramatically changed
• Ageing as health detetoriation• Reduction in death rates is an improvement in health• Population ageing is connoted negatively
(deterioration of health of population)• Reduction in death rates means being younger at a
given age
91 / 109

Lecture 1:Measuring ageing
Antoine Bozio
Introduction
I. Measuringageing
Demography
Age structure
Life tables
Past trends
Projections
II. Theories ofpopulation ageing
Malthusian model
Demographictransition
Baby boom
Ageing by the top
Limit to human life
III. Ageing as ahealth process
Ageing is becomingyounger
Morbidity vs mortality
Measuring health
Indicators of healthyageing
References
III. Ageing as a health process
Ageing is becoming younger
• Redefining age ?• New Age thinking (Shoven, 2010)• Age should be defined as “remaining life expectancy”• Cultural evolution of ageing : 40s are the new 30s• But mortality is not morbidity
• Measuring age of old-age• Patrice Boudelais L’age de la vieillesse (1993)• Synthetic indicator for the age of old age
– age 10 years left to live– 5-y survival prob at 65 (ref. 1985 for men)
• Old-age is at ever older age
92 / 109

Lecture 1:Measuring ageing
Antoine Bozio
Introduction
I. Measuringageing
Demography
Age structure
Life tables
Past trends
Projections
II. Theories ofpopulation ageing
Malthusian model
Demographictransition
Baby boom
Ageing by the top
Limit to human life
III. Ageing as ahealth process
Ageing is becomingyounger
Morbidity vs mortality
Measuring health
Indicators of healthyageing
References
Figure 48: The age of old age in France (Bourdelais, 1993)
58
60
62
64
66
68
70
72
74
76
1820 1840 1860 1880 1900 1920 1940 1960 1980 2000
Men
Women
Source : Bourdelais (1993), Table 7.3, p. 231
93 / 109
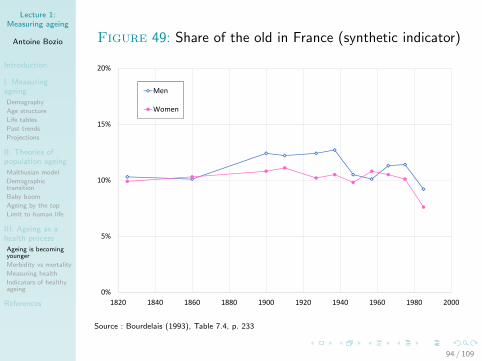
Lecture 1:Measuring ageing
Antoine Bozio
Introduction
I. Measuringageing
Demography
Age structure
Life tables
Past trends
Projections
II. Theories ofpopulation ageing
Malthusian model
Demographictransition
Baby boom
Ageing by the top
Limit to human life
III. Ageing as ahealth process
Ageing is becomingyounger
Morbidity vs mortality
Measuring health
Indicators of healthyageing
References
Figure 49: Share of the old in France (synthetic indicator)
0%
5%
10%
15%
20%
1820 1840 1860 1880 1900 1920 1940 1960 1980 2000
Men
Women
Source : Bourdelais (1993), Table 7.4, p. 233
94 / 109
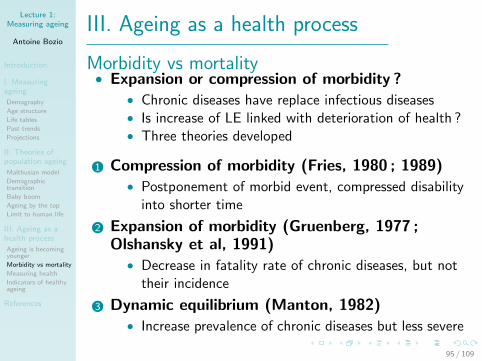
Lecture 1:Measuring ageing
Antoine Bozio
Introduction
I. Measuringageing
Demography
Age structure
Life tables
Past trends
Projections
II. Theories ofpopulation ageing
Malthusian model
Demographictransition
Baby boom
Ageing by the top
Limit to human life
III. Ageing as ahealth process
Ageing is becomingyounger
Morbidity vs mortality
Measuring health
Indicators of healthyageing
References
III. Ageing as a health process
Morbidity vs mortality• Expansion or compression of morbidity ?
• Chronic diseases have replace infectious diseases• Is increase of LE linked with deterioration of health ?• Three theories developed
1 Compression of morbidity (Fries, 1980 ; 1989)• Postponement of morbid event, compressed disability
into shorter time
2 Expansion of morbidity (Gruenberg, 1977 ;Olshansky et al, 1991)
• Decrease in fatality rate of chronic diseases, but nottheir incidence
3 Dynamic equilibrium (Manton, 1982)• Increase prevalence of chronic diseases but less severe
95 / 109

Lecture 1:Measuring ageing
Antoine Bozio
Introduction
I. Measuringageing
Demography
Age structure
Life tables
Past trends
Projections
II. Theories ofpopulation ageing
Malthusian model
Demographictransition
Baby boom
Ageing by the top
Limit to human life
III. Ageing as ahealth process
Ageing is becomingyounger
Morbidity vs mortality
Measuring health
Indicators of healthyageing
References
III. Ageing as a health process
Measuring health declines
• Three approaches to health measurement
1 Medical assessment of diseases2 Functional model : incapacities3 Self-perceived health, quality of life
• Medical approach• Surveys of medical professions• Surveys of population with medical tests• Surveys of population with self-assessment
96 / 109
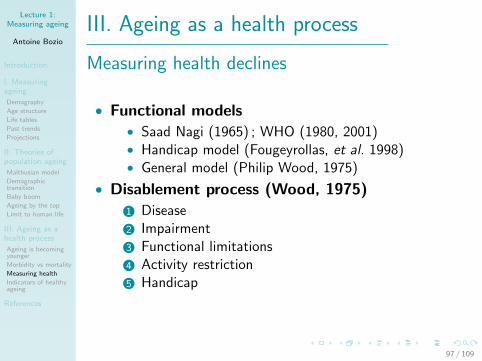
Lecture 1:Measuring ageing
Antoine Bozio
Introduction
I. Measuringageing
Demography
Age structure
Life tables
Past trends
Projections
II. Theories ofpopulation ageing
Malthusian model
Demographictransition
Baby boom
Ageing by the top
Limit to human life
III. Ageing as ahealth process
Ageing is becomingyounger
Morbidity vs mortality
Measuring health
Indicators of healthyageing
References
III. Ageing as a health process
Measuring health declines
• Functional models• Saad Nagi (1965) ; WHO (1980, 2001)• Handicap model (Fougeyrollas, et al. 1998)• General model (Philip Wood, 1975)
• Disablement process (Wood, 1975)
1 Disease2 Impairment3 Functional limitations4 Activity restriction5 Handicap
97 / 109

Lecture 1:Measuring ageing
Antoine Bozio
Introduction
I. Measuringageing
Demography
Age structure
Life tables
Past trends
Projections
II. Theories ofpopulation ageing
Malthusian model
Demographictransition
Baby boom
Ageing by the top
Limit to human life
III. Ageing as ahealth process
Ageing is becomingyounger
Morbidity vs mortality
Measuring health
Indicators of healthyageing
References
III. Ageing as a health process
Indicators of healthy ageing• See survey by Robine and Jagger (2005)
• Health state life expectancies• Measure different years of live with different levels of
health• Life expectancy without diseases : e.g. without
dementia• Life expectancy without impairment• Life expectancy without activity restrictions• Life expectancy in good perceived health
• Health-adjusted life expectancies• Life expectancies weighted by the social value given
by different states of health• Disability adjusted life life-year (DALY)• Quality-adjusted life-year (QALY)
98 / 109

Lecture 1:Measuring ageing
Antoine Bozio
Introduction
I. Measuringageing
Demography
Age structure
Life tables
Past trends
Projections
II. Theories ofpopulation ageing
Malthusian model
Demographictransition
Baby boom
Ageing by the top
Limit to human life
III. Ageing as ahealth process
Ageing is becomingyounger
Morbidity vs mortality
Measuring health
Indicators of healthyageing
References
III. Ageing as a health process
Indicators of healthy ageing
• Disability free life expectancy (DFLE)• Functional approach : disability as a robust
comparison point• Severe disability even less prone to interpretation
• Active life expectancy (ALE)• Life expectancy free of problems of Activities in daily
living (ADL)• ADL are ability to accomplish without help basic
activities
99 / 109

Lecture 1:Measuring ageing
Antoine Bozio
Introduction
I. Measuringageing
Demography
Age structure
Life tables
Past trends
Projections
II. Theories ofpopulation ageing
Malthusian model
Demographictransition
Baby boom
Ageing by the top
Limit to human life
III. Ageing as ahealth process
Ageing is becomingyounger
Morbidity vs mortality
Measuring health
Indicators of healthyageing
References
Figure 50: Life expectancy and disability-free LE
Source : Robine and Jagger (2005), fig. 80-6.
100 / 109
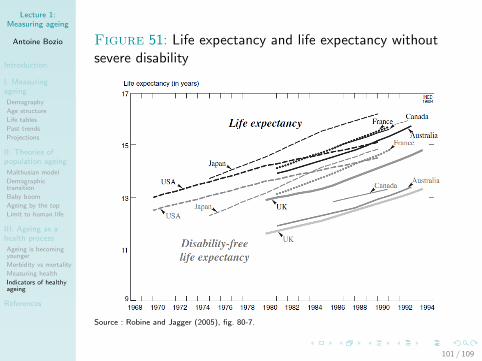
Lecture 1:Measuring ageing
Antoine Bozio
Introduction
I. Measuringageing
Demography
Age structure
Life tables
Past trends
Projections
II. Theories ofpopulation ageing
Malthusian model
Demographictransition
Baby boom
Ageing by the top
Limit to human life
III. Ageing as ahealth process
Ageing is becomingyounger
Morbidity vs mortality
Measuring health
Indicators of healthyageing
References
Figure 51: Life expectancy and life expectancy withoutsevere disability
Source : Robine and Jagger (2005), fig. 80-7.
101 / 109

Lecture 1:Measuring ageing
Antoine Bozio
Introduction
I. Measuringageing
Demography
Age structure
Life tables
Past trends
Projections
II. Theories ofpopulation ageing
Malthusian model
Demographictransition
Baby boom
Ageing by the top
Limit to human life
III. Ageing as ahealth process
Ageing is becomingyounger
Morbidity vs mortality
Measuring health
Indicators of healthyageing
References
Figure 52: Survival without disease or disability (Frenchfemale)
Source : Robine and Jagger (2005), fig. 80-8.
102 / 109

Lecture 1:Measuring ageing
Antoine Bozio
Introduction
I. Measuringageing
Demography
Age structure
Life tables
Past trends
Projections
II. Theories ofpopulation ageing
Malthusian model
Demographictransition
Baby boom
Ageing by the top
Limit to human life
III. Ageing as ahealth process
Ageing is becomingyounger
Morbidity vs mortality
Measuring health
Indicators of healthyageing
References
References– Allen, R. (2008), “A Review of Gregory Clark’s A Farewell to Alms : A Brief Economic History of
the World”, Journal of Economic Literature 46, no. 4 : 946–73.
– Bagnall, R. and Frier, B. (1994), The Demography of Roman Egypt, Cambridge University Press.
– Bardet, Jean-Pierre, et Jacques Dupaquier (1997) Histoire des populations de l’Europe, 3 vol.Fayard.
– Bell, F., A. Wade, and S. Goss (1992) “Life Tables for the United States Social Security Area’,Actuarial Study 116 : 1900–2100.
– Biraben, J.-N. (1979), “Essai sur l’evolution du nombre des hommes”, Population, Vol. 34, no. 1pp. 3–25.
– Biraben, J.-N. (1988) “Prehistoire” In Histoire de la population francaise. 1. Des origines a laRenaissance, Dupaquier, J. (ed.), pp. 19-64.
– Blanchet, D. (2002) “Evolutions demographiques et retraites ? : quinze ans de debat’, Population etSociete, no. 383.
– Blanchet, D. (2001) “L’impact des changements demographiques sur la croissance et le marche dutravail ? : faits, theories et incertitudes’, Revue d’economie politique 111, no. 4 : 511.
– Blanchet, D. and F. Le Gallo (2008), “Les projections demographiques : Principaux mecanismes etretour sur l’experience francaise”, Revue economique 59, no. 5 : 893.
– Blayo, Y. (1975) “La mortalite en France de 1740 a 1829”, Population 30, n ? 1 : 123–42.
– Bloom, D., Canning, D., and Sevilla, J. (2003) The Demographic Dividend : A New Perspective onthe Economic Consequences of Population Change. RAND Corporation.
– Bloom, D. and Luca, D. (2016), “The Global Demography of Aging : Facts, Explanations, Future”,in Piggott and Woodland (eds.), Handbook of the Economics of Population Aging, Vol. 1.A,chap. 1.
– Bocquet-Appel, J.-P. and Masset, C. (1996), “Paleodemography : Expectancy and False Hope”,American Journal of Physical Anthropology, 99, pp. 571–583.
– Bocquet-Appel, J.-P. (2008), La paleodemographie. 99,99% de l’histoire demographique deshommes ou la demographie de la Prehistoire, Editions Errance, Paris.
– Bourdelais, P. (1998) “The ageing of population. Relevant question or obsolete notion”, in Old Agefrom Antiquity to Post-Modernity, edite par Paul Johnson et Pat Thane, pp. 110–31. Routledge.
– Bourdelais, P. (1993) Le nouvel age de la vieillesse. Histoire du vieillissement de la population.Editions Odile Jacob. Paris.
103 / 109

Lecture 1:Measuring ageing
Antoine Bozio
Introduction
I. Measuringageing
Demography
Age structure
Life tables
Past trends
Projections
II. Theories ofpopulation ageing
Malthusian model
Demographictransition
Baby boom
Ageing by the top
Limit to human life
III. Ageing as ahealth process
Ageing is becomingyounger
Morbidity vs mortality
Measuring health
Indicators of healthyageing
References
References– Bourgeois-Pichat, J. (1952), “Essai sur la mortalite biologique de l’homme”, Population, vol. 7, No.
3, pp. 381–394.
– Buchet, L. and Seguy, I. (2002) “Paleodemographie : bilan et perspectives”. Annales dedemographie historique, n ? 103 : 161–212.
– Clark, G. (2005), “The Condition of the Working Class in England, 1209–2004”, Journal of PoliticalEconomy 113, no. 6 : 1307–40.
– Costa, D. (2005), “Causes of Improving Health and Longevity at Older Ages : A Review of theExplanations”, Genus, 21–38.
– Cutler, D., Deaton, A. and Lleras-Muney, A. (2006) “The Determinants of Mortality’, Journal ofEconomic Perspectives, Vol. 20, No. 3, pp. 97–120.
– Cutler, D. and Meara, E. (2004) “Changes in the age distribution of mortality over the 20thcentury” in Wise, D. (ed.), Perspectives on the Economics of Aging, University of Chicago Press,Chicago, pp.
– Cutler, D., Ghosh, K. and Landrum, M. (2013) “Evidence for significant compression of morbidity inthe elderly U.S. population”, NBER Working Paper No. 19268.
– Davis, K. (1945) “The World Demographic Transition”, The Annals of the American Academy ofPolitical and Social Science, 237, pp. 1–11.
– Dublin, L. (1928) Health and Wealth, New York, Harper.
– Dupaquier, J. (1988) Histoire de la population francaise, 4 vol. Paris : Presses Universitaires deFrance.
– Eggleston, K. and Fuchs, V. (2012) “The New Demographic Transition : Most Gains in LifeExpectancy Now Realized Late in Life’, Journal of Economic Perspectives, Vol. 26, No. 3,pp. 137–56.
– Fogel, R. (1997) “New Findings on Secular Trends in Nutrition and Mortality : Some Implicationsfor Population Theory”, in Handbook of Population and Family Economics. Mark R. Rosenzweigand Oded Stark, eds. New York : Elsevier Science, North Holland, pp. 433–81.
– Fougeyrollas P., Cloutier R., Bergeron H., Cote J., and St. Michel G. (1998) Classificationquebecoise : processus de production du handicap. Lac Saint Charles, Canada, RIPPH/SCCIDIH.
– Fries, J. (1980) “Aging, natural death, and the compression of morbidity”, New England Journal ofMedicine, vol. 303, n° 3, pp. 130–135.
104 / 109

Lecture 1:Measuring ageing
Antoine Bozio
Introduction
I. Measuringageing
Demography
Age structure
Life tables
Past trends
Projections
II. Theories ofpopulation ageing
Malthusian model
Demographictransition
Baby boom
Ageing by the top
Limit to human life
III. Ageing as ahealth process
Ageing is becomingyounger
Morbidity vs mortality
Measuring health
Indicators of healthyageing
References
References– Fries, J. (1989) “The compression of morbidity : near or far ?”, Milbank Memorial Fund Quarterly,
vol. 67, pp. 208–232.
– Gruenberg E. (1977) “The failures of success”, Milbank Memorial Fund Quarterly / Health andSociety, vol. 55, pp. 3–24.
– Guinnane, T. (2011) “The Historical Fertility Transition : A Guide for Economists”, Journal ofEconomic Literature, Vol. 49, No. 3, pp. 589–614.
– Lee, R. (2003), “The Demographic Transition : Three Centuries of Fundamental Change”, Journalof Economic Perspectives 17, no. 4 : 167–90.
– Lee, R. and Anderson, M. (2002), “Malthus in State Space : Macro Economic-DemographicRelations in English History, 1540 to 1870”, Journal of Population Economics 15, no. 2 : 195.
– Lee, R. (1997), “Population Dynamics : Equilibrium, Disequilibrium, and Consequences ofFluctuations’. In Handbook of Population and Family Economics, 1063–1115. Elsevier.
– Leslie, PH. (1945), “On the use of matrices in certain population dynamics”, Biometrika, Vol. 33,p. 183–212.
– Maddison, A. (2001), The World Economy : A Millennial Perspective, OECD.
– Manton K. G. (1982) Changing concepts of morbidity and mortality in the elderly population.Milbank Memorial Fund Quarterly/Health and Society, vol. 60, pp. 183–244.
– Masset, C. (1971), “Erreurs systematiques dans la determination de l’age par les suturescraniennes”, Bulletins et Memoires de la Societe d’Anthropologie de Paris, 7, 85–105.
– Masset, C. (2002) “A quel age mourraient nos ancetres ?” Population et Societes, no. 380.
– Notestein, F. (1945), “Population : the long view”, in Schultz T., (ed.) Food for the world. Chicago,Illinois, University of Chicago Press, 36–57
– Oeppen, J. and Vaupel, J. (2002) “Broken limits to life expectancy”, Science, 296 (5570),pp. 1029–1031.
– Olshansky J., Carnes B. A. and Christine, C. (1990), “In search of Mathusela : estimating the upperlimits to human longevity”, Science, vol. 250, p. 634–640.
– Olshansky J., Rudberg M. A., Carnes B. A., Cassel C. K., and Brody J. A., (1991) “Trading offlonger life for worsening health : the expansion of morbidity hypothesis”, Journal of Aging andHealth, Vol. 3, pp. 194–216.
105 / 109
Lecture 1:Measuring ageing
Antoine Bozio
Introduction
I. Measuringageing
Demography
Age structure
Life tables
Past trends
Projections
II. Theories ofpopulation ageing
Malthusian model
Demographictransition
Baby boom
Ageing by the top
Limit to human life
III. Ageing as ahealth process
Ageing is becomingyounger
Morbidity vs mortality
Measuring health
Indicators of healthyageing
References
References– Olshansky, S., Carnes, B. and Desesquelles, A. (2001), “Demography : prospects for human
longevity”, Science, 291 (5508), pp. 1491–1492.
– Olshansky, S., Passaro, D., Hershow, R., Layden, J., Carnes, B., Brody, J., et al. (2005) “Apotential decline in life expectancy in the United States in the 21st century” N. Engl. J. Med. 352(11), pp. 1138–1145.
– Perrenoud, A. (1978) “La mortalite a Geneve de 1625 a 1825”, Annales de demographie historique1978 (1) : pp. 209–33.
– Phelps Brown, H. and Hopkins, S. (1981), A Perspective of Wages and Prices. London : Methuen.
– Preston, S. (1975) “The Changing Relation Between Mortality and Level of EconomicDevelopment”, Population Studies, July, 29 :2, pp. 231–48.
– Robine, J.-M. and Jagger C. (2005) “Lengthening of Life and the Population Health Status”, InDemography : Analysis and Synthesis, Graziella Caselli, Jacques Vallin, and Guillaume Wunsch(eds.), Academic Press, pp. 285–303.
– Sanderson, W. and S. Scherbov (2007), “A New Perspective on Population Aging’. DemographicResearch 16 : 27–58.
– Sauvy, A. (1928) “La population francaise jusqu’en 1956, essai de prevision demographique”,Journal de la Societe de Statistique de Paris, No. 12.
– Shoven, J. (2010) “New Age Thinking : Alternative Ways of Measuring Age, Their Relationship toLabor Force Participation, Government Policies and GDP”, in Wise, D. (ed.) Research Findings inthe Economics of Aging, NBER, University of Chicago Press, pp. 17–36.
– Steckel, Richard H (2008), “Biological Measures of the Standard of Living’, Journal of EconomicPerspectives 22, no. 1 : 129–52.
– Vallin, J. (2006), “La transition demographique europeenne : 1740–1940’. In Demographie : Analyseet Synthese, edited by Graziella Caselli, Jacques Vallin, and Guillaume Wunsch, Vol. V, pp. 71–116.Editions de l’Ined.
– Vallin, J. and Berlinguer, G. (2006), “De la mortalite endogene aux limites de la vie humaine”, inDemographie : Analyse et Synthese, edited by Graziella Caselli, Jacques Vallin, and GuillaumeWunsch, Vol. III, pp. 169–204. Editions de l’Ined.
106 / 109

Lecture 1:Measuring ageing
Antoine Bozio
Introduction
I. Measuringageing
Demography
Age structure
Life tables
Past trends
Projections
II. Theories ofpopulation ageing
Malthusian model
Demographictransition
Baby boom
Ageing by the top
Limit to human life
III. Ageing as ahealth process
Ageing is becomingyounger
Morbidity vs mortality
Measuring health
Indicators of healthyageing
References
References
– Vallin, J. and Mesle, F. (2001), “Tables de mortalite francaises pour les XIXe et XXe siecles et
projections pour le XXIe siecle”. Donnees statistiques. Paris : Institut National d’EtudesDemographiques.
– Vallin, J. and Mesle, F. (2009), “The segmented trend line of highest life expectancies”, Populationand Development Review, Vol. 35, No. 1, pp. 159–187.
– Vallin, J. and Mesle, F. (2010) “Esperance de vie : peut-on gagner trois mois par an indefiniment ?”,Population & Societes, No. 473.
– Vilquin, E. (2004), “Les origines de la science demographique”, in Demographie : Analyse etSynthese, edited by Graziella Caselli, Jacques Vallin, and Guillaume Wunsch, VIII :507–26. Editionsde l’Ined.
– Voigtlander, N., and H.-J. Voth (2012), “The Three Horsemen of Riches : Plague, War, andUrbanization in Early Modern Europe’. Review of Economic Studies.
– Weil, D. (1993), “The Economics of Population Aging’. Handbook of Population and FamilyEconomics. Elsevier.
– Vallin, J. (2006), “La transition demographique europeenne ? : 1740-1940”, in Demographie ? :analyse et synthese, edite par Graziella Caselli, Jacques Vallin, et Guillaume Wunsch, V :71–116.Editions de l’Ined.
– Walford, R. (1983), Maximum Life Span, New York : W.W. Norton & Co.
– Wrigley, E. and Schofield, R. (1981), The Population History of England 1541-1871, CambridgeUniversity Press.
– Wood, P. (1975) “Classification of Impairments and Handicaps”, World Health Organization.
107 / 109

Lecture 1:Measuring ageing
Antoine Bozio
Introduction
I. Measuringageing
Demography
Age structure
Life tables
Past trends
Projections
II. Theories ofpopulation ageing
Malthusian model
Demographictransition
Baby boom
Ageing by the top
Limit to human life
III. Ageing as ahealth process
Ageing is becomingyounger
Morbidity vs mortality
Measuring health
Indicators of healthyageing
References
English-French glossary
– Life table = table de mortalite
– Period life table= table du moment
– cohort life table = table de la generation
– Death rate = quotient de mortalite
– Old-age dependency ratio = ratio demographique
– AD 12 = 12 apres J.C.
– Haberdasher = mercier
108 / 109

Lecture 1:Measuring ageing
Antoine Bozio
Introduction
I. Measuringageing
Demography
Age structure
Life tables
Past trends
Projections
II. Theories ofpopulation ageing
Malthusian model
Demographictransition
Baby boom
Ageing by the top
Limit to human life
III. Ageing as ahealth process
Ageing is becomingyounger
Morbidity vs mortality
Measuring health
Indicators of healthyageing
References
Lecture 1: Measuring ageing
Antoine Bozio
Paris School of Economics (PSE)
Ecole des hautes etudes en sciences sociales (EHESS)
Master PPDParis – January 2018
109 / 109