Embed Size (px)
Citation preview

Lecture 08: Map Transformation
Geography 128
Analytical and Computer Cartography
Spring 2007
Department of Geography
University of California, Santa Barbara

Review of the transformational view of Cartography
Transformations– Map scale – Dimension – Symbolic content
– Data structures
Why Transform?– We may wish to compare maps collected at different scales. – We may wish to convert the geometry of the map base.
– We may wish or need to change the map data structure.

Robinson's Classification

Robinson's Classification (cnt.)
Robinson's Classification was based on dimension and level of measurement
Dimension of measurement– Zero dimensional– One dimensional – Two dimensional– Three dimensional ?
Level of measurement idea is from Stevens (1946)– Nominal data assume only existance and type. An example is a text
label on a map. – Ordinal data assume only ranking. Relations are like "greater than". – Interval data have an arbitrary numerical value, with relative value.
Example: Elevation. – Ratio data have an absolute zero and scale.

Transformations as Stages in Map Production
Transformation of level can be shown in making a choropleth map.
This transformation is not invertible, but can be error measured and minimized.
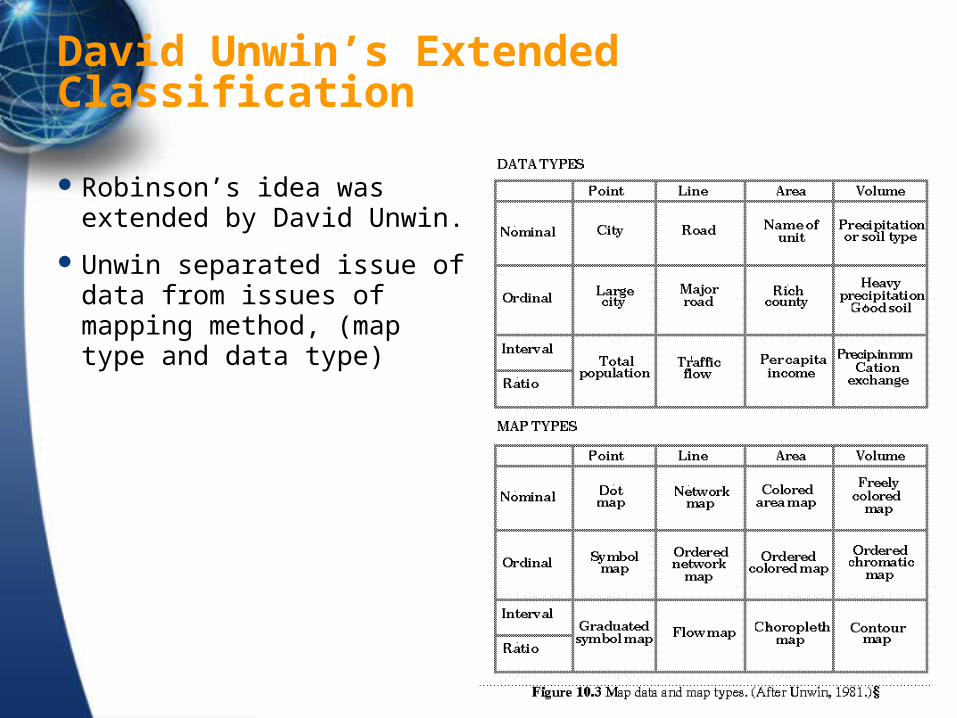
David Unwin’s Extended Classification
Robinson’s idea was extended by David Unwin.
Unwin separated issue of data from issues of mapping method, (map type and data type)

State Changes and Transformations
Cartographers are interested in the full set of state transformation.
Each map has an optimal path through the set.
Design cartography primarily concentrates on the last, or symbolization transformation.
Four types of transformations shape the mapping process: – Geocoding (transforming entities to objects: levels, dimension,
data structure) – Map Scale – Locational Attributes or Map Base
– Symbolization

Scale Transformations
Some transformations "collapse" space: e.g. area to point.
Map scales of interest to cartography are 1:1,000 to 1:400M.
Transformations from larger to smaller scale by the process of generalization.
At the minimum, generalization involves simplification, elimination, combination and displacement.

Some Generalization Problems
Length
Shape
Topology

Map Generalization and Enhancement
These steps are conducted under specified and consistent rules.
An example is the set of algorithms for point elimination along a line.
The inverse of this adds points along a line: enhancement

Transformations and Algorithms
In mathematics, transformations are expressed as equations.
Solutions, inversion as so forth are by algebra, calculus etc.
In computer science, a set of transformations defining a process is called an algorithm.
Any process that can be reduced to a set of steps can be automated by an algorithm
data structures + transformational algorithms = maps
+ =

Transformations and Algorithms (cnt.)

Transformations of Object Dimension
The four dimensions of dimension, data can be represented at any one in one state
Transformations can move data between states
Full set of state zero to state one transformations is then 16 possible transformations
Dimensional transformation are only one type
When dimension collapses to "none" result is a measurement

Map Transformation Algebra
Transformations map closely onto Matrix algebra
Almost all spatial data can be placed into an (n x m) or (n x p) matrix
Transformations can then be by convolution (iteration of a matrix over an array OR
By selecting a small matrix (2 x 2) or (3 x 3) for multiplication
Complex transformations can be compounded

Transformations as Multiple Steps (Dimensional Transforms)

Map Transformation Algebra (cnt.)
Matrices have inverses, which reverse effect of multiplication to yield the identity matrix
Error creep in when inversion does not result in identity matrix

Map Projection Transformations
Map projections represent many different types of transformation
Perfectly invertible (one-to-one)
One-to-many
Many-to-one
Undefined (non-invertible) Imperfectly invertible, e.g.
on ellipsoid and geoid, computational error, rounding etc.
Some transformations use iterative methods i.e. algorithms, not formulas

Geographic Coordinate Transformation

Equatorial Mercator Transformation

Planar Geometry vs. Spherical Geometry
Rule of Sines – Distance between points

Planar Map Transformations on Points- Length of a line
Repetitive application of point-to-point distance calculation
For n points, algorithm/formula uses n-1 segments

Planar Map Transformations on Points- Centroids
Multiple point or line or area to be transformed to single point
Point can be "real" or representative
Mean center simple to compute but may fall outside point cluster or polygon
Can use point-in-polygon to test for inclusion

Planar Map Transformations on Points- Standard Distance
Just as centroid is an indication of representative location, standard distance is mean dispersion
Equivalent of standard deviation for an attribute, mean variation from mean
Around centroid, makes a "radius" tracing a circle

Planar Map Transformations on Points- Nearest Neighbor Statistic
NNS is a single dimensionless scalar that measures the pattern of a set of point (point-> scalar)
Computes nearest point-to-point separation as a ratio of expected given the area
Highly sensitive to the area chosen

Planar Map Transformations Based on Lines- Intersection of two lines
Absolutely fundamental to many mapping operations, such as overlay and clipping.
In raster mode it can be solved by layer overlay.
In vector mode it must be solved geometrically.
Lines (2) to point transformation

Planar Map Transformations Based on Lines- Intersection of two lines (cnt.)
•When using this algorithm, a problem exists when b2 - b1 = 0 (divide by zero)
•Special case solutions or tests must be used
•These can increase computation time greatly
•Computation time can be reduced by pre-testing, e.g. based on bounding box.

Planar Map Transformations Based on Lines- Distance from a Point to a Line

Planar Map Transformations Based on Areas
Computing the area of a vector polygon (closed)
Manually, many methods are used, e.g. cell counts, point grid.
For a raster, simply count the interior pixels
Vector Mode more complex

Planar Map Transformations Based on Areas

Planar Map Transformations Based on Areas - Point-in-Polygon
Again, a basic and fundamental test, used in many algorithms.
For raster mode, use overlay.
For vector mode, many solutions.
Most commonly used is the Jordan Arc Theorem
Tests every segment for line intersection.
Test point selected to be outside polygon.

Planar Map Transformations Based on Areas - Theissen Polygons
Often called proximal regions or voronoi diagrams
Often used for contouring terrain, climate, interpolation, etc
http://en.wiki.mcneel.com/default.aspx/McNeel/PointsetReconstruction.html
Affine Transformations
These are transformation of the fundamental geometric attributes, i.e. location.
Influence absolute location, not relative or topological
Necessary for many operations, e.g. digitizing, scanning, geo-registration, and display
Affine Transformations take place in three steps (TRS) in order
– Translation– Rotation– Scaling

Affine Transformations- Translation
Movement of the origin between coordinate systems

Affine Transformations- Rotation
Rotation of axes by an angle theta

Affine Transformations- Scaling
The numbers along the axes are scaled to represent the new space scale

Affine Transformations
Possible to use matrix algebra to combine the whole transformation into one matrix multiplication.
Step must then be applied to every point

Statistical Space Transformations- Rubber Sheeting
Select points in two geometries that match
Suitable points are targets, e.g. road intersections, runways etc
Use least squares transformation to fit image to map
Involves tolerance and error distribution
[x y] = T [u v] then applied to all pixels
May require resampling to higher or lower density

http://tabacco.blog-city.com/red_vs_blue_big_lie_maps__cartograms_of_2004_presidential_el.htm
Statistical Space Transformations- Cartograms
also known as value-by-area maps and varivalent projections (Tobler, 1986)
Deliberate distortion of geometry to new "space"
Type of non-invertible map projection

Symbolization Transformations
Screen coordinates are often reduced to a "satndard" device – Normalization Transformation
Standard Device display dimensions are (0,0) to (1,1)
World Coordinates-> Normalized Device Coordinates > Device Coordinates
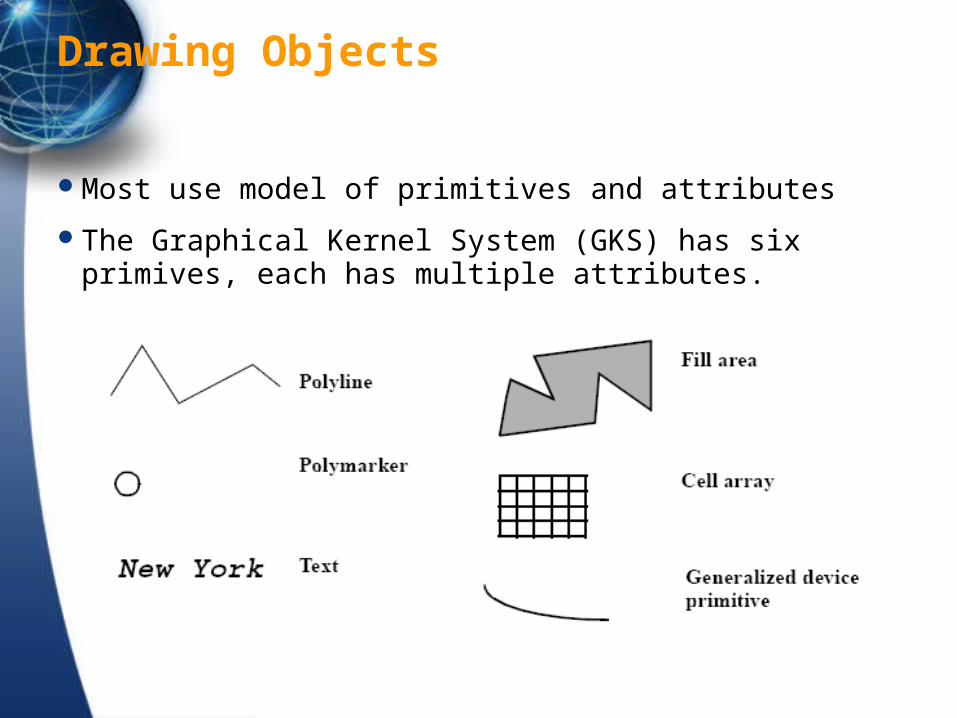
Drawing Objects
Most use model of primitives and attributes
The Graphical Kernel System (GKS) has six primives, each has multiple attributes.

Next Lecture
Data Structure Transformation