Embed Size (px)
DESCRIPTION
The lecture notes reference the 15.075 course textbook: Statistics and Data Analysis from Elementary to Intermediate by Ajit C. Tamhane and Dorothy D. Dunlop, Prentice Hall, 2000. They also occasionally refer to: Casella, George, and Roger L. Berger. Statistical Inference. Belmont, CA: Duxbury Press, 1990.Some slides were prepared by or based on slides by: Prof. Roy Welsch (MIT), Prof. Gordon Kaufman (MIT), Prof. Jacqueline Telford (Johns Hopkins University), and Prof. Ramón León (University of Tennessee). These contributions have been acknowledged on the first slide of each lecture.
Citation preview

Logistic Regression
References: Applied Linear Statistical Models, Neter et al.
Categorical Data Analysis, Agresti
Slides prepared by Elizabeth Newton (MIT)

Logistic Regression• Nonlinear regression model when response
variable is qualitative.• 2 possible outcomes, success or failure,
diseased or not diseased, present or absent• Examples: CAD (y/n) as a function of age,
weight, gender, smoking history, blood pressure• Smoker or non-smoker as a function of family
history, peer group behavior, income, age• Purchase an auto this year as a function of
income, age of current car, age
E Newton 2

Response Function for Binary Outcome
iii
iiii
ii
ii
ii
iii
XYEYEYPYP
XYEXY
πββπππ
ππ
ββεββ
=+==−+=
−====
+=
++=
10
10
10
}{)1(0)(1}{
1)0()1(
}{
E Newton 3

Special Problems when Response is Binary
Constraints on Response Function0 ≤ E{Y} = π = ≤ 1
Non-normal Error TermsWhen Yi=1: εi = 1-β0-β1Xi
When Yi=0: εi = -β0-β1Xi
Non-constant error varianceVar{Yi} = Var{εi} = πi(1-πi)
E Newton 4

Logistic Response Function
X
X
XXXXXXX
XXYE
10
10
10
1010
1010
1010
10
10
1log
)exp(1
)exp()1()exp()exp()exp()exp()exp())exp(1(
)exp(1)exp(}{
ββπ
π
ββπ
πββππ
ββπββπββββππββββπ
ββββπ
+=⎟⎠⎞
⎜⎝⎛
−
+=−
+−=
+−+=
+=++
+=++
+++
==
E Newton 5
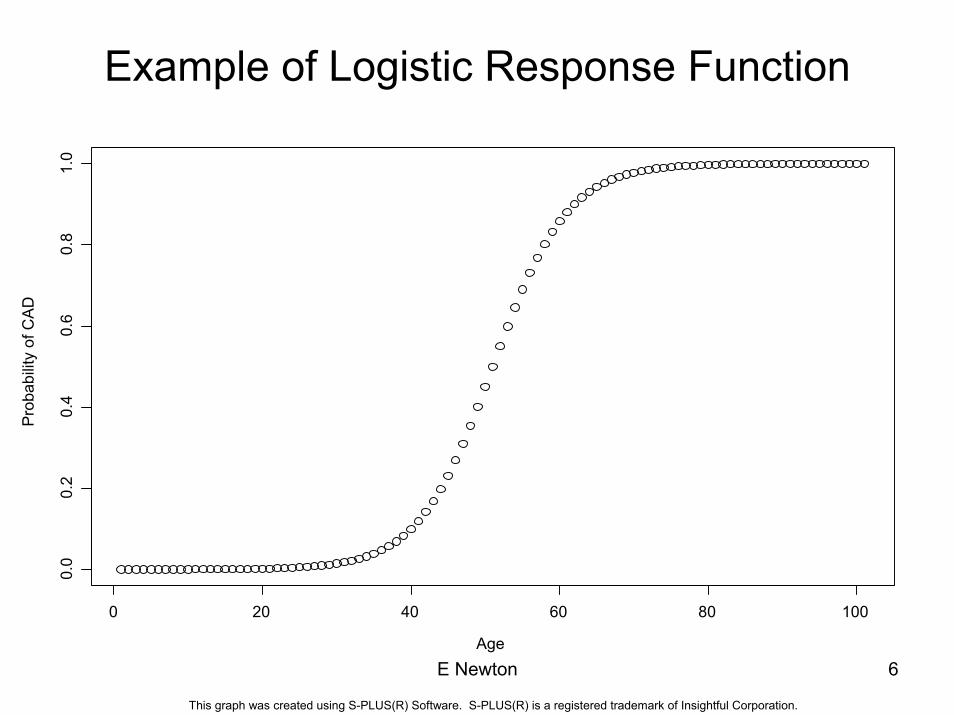
Example of Logistic Response Function
Age
Pro
babi
lity
of C
AD
0 20 40 60 80 100
0.0
0.2
0.4
0.6
0.8
1.0
E Newton 6
This graph was created using S-PLUS(R) Software. S-PLUS(R) is a registered trademark of Insightful Corporation.
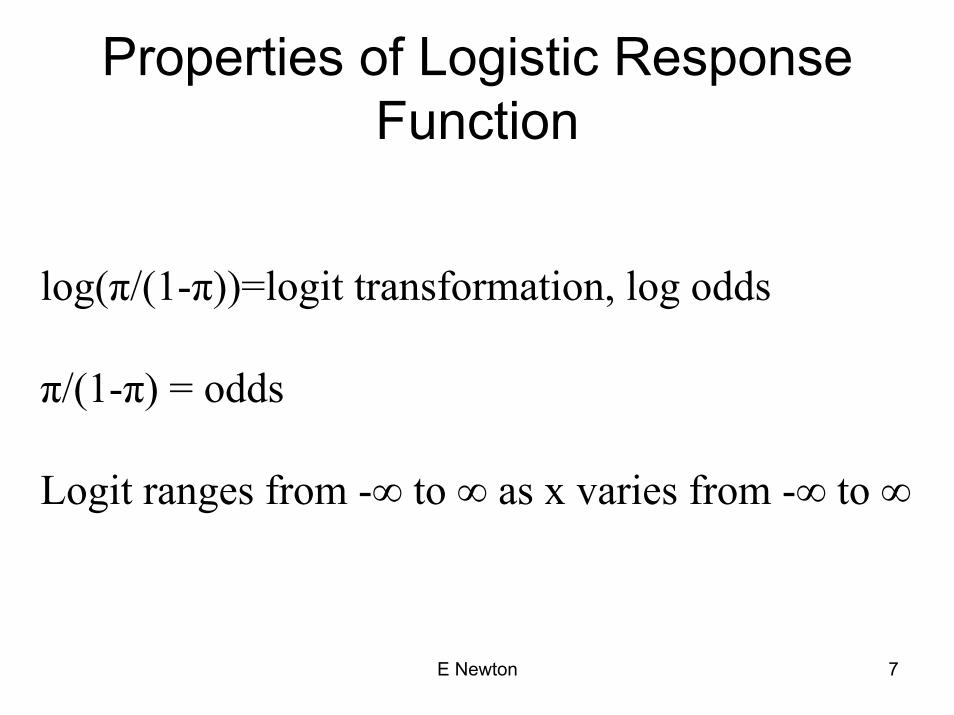
Properties of Logistic Response Function
log(π/(1-π))=logit transformation, log odds
π/(1-π) = odds
Logit ranges from -∞ to ∞ as x varies from -∞ to ∞
E Newton 7

Likelihood Function
)1log()]1
log([)...g(Y log
)1()()...g(Y
is; pdf joint t,independen re YSince1,2...ni ;1,0 Y,)1()(:
1)0()1(
11i
111i
i
i1
i
n
i
n
i i
iin
Yi
Yi
niii
nin
Yi
Yiii
ii
ii
YY
YfY
aYfpdf
YPYP
ii
ii
ππ
πππ
ππ
ππ
−+−
=
−Π=Π=
==−=
−====
∑∑==
−==
−
E Newton 8

Likelihood Function (continued)
)]exp(1log[)(),(log
)exp(111
)-1
log(
1 1101010
10
10
∑ ∑= =
++−+=
++=−
+=
n
i
n
iiii
ii
ii
i
XXYL
X
X
ββββββ
ββπ
ββππ
E Newton 9

Likelihood for Multiple Logistic Regression
yXyX
xx
xxxy
x
xxxyL
xXyL
iki
i
jijj
jijj
iik
iiki
jijj
jijj
iik
iiki
k
i jijj
ijiji
j
ˆ''
ˆ])exp(1
)exp([ :Equations Likelihood
])exp(1
)exp([
)]exp(1log[)()(log
=
=+
=
+−=
∂∂
+−=
∑∑∑
∑∑
∑∑
∑∑
∑ ∑∑∑
πβ
β
β
β
β
βββ
E Newton 10
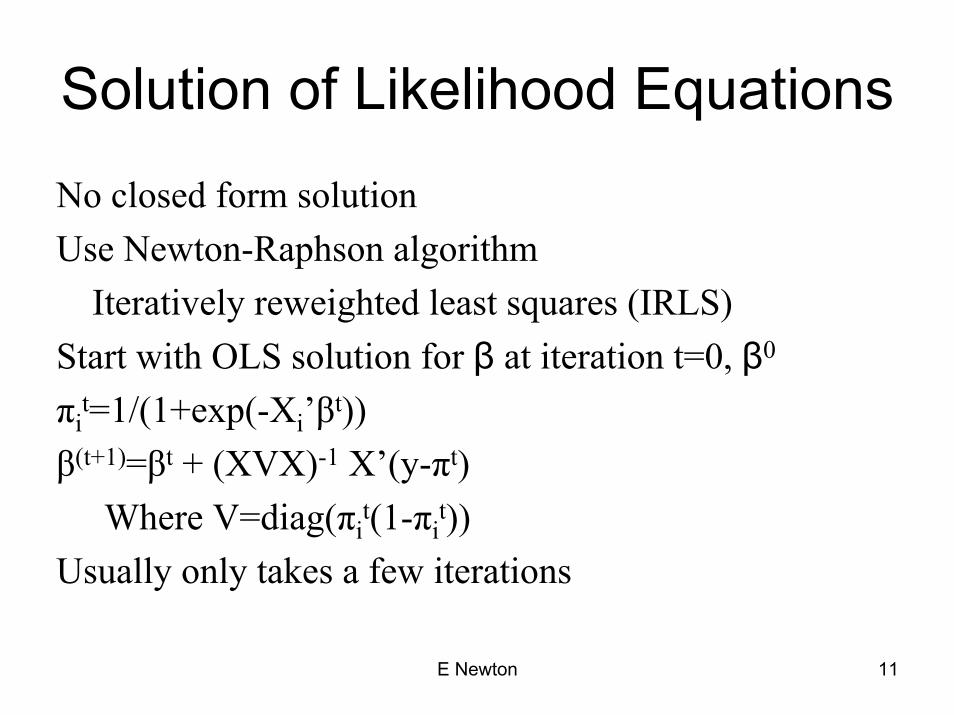
Solution of Likelihood Equations
No closed form solutionUse Newton-Raphson algorithm
Iteratively reweighted least squares (IRLS)Start with OLS solution for β at iteration t=0, β0
πit=1/(1+exp(-Xi’βt))
β(t+1)=βt + (XVX)-1 X’(y-πt)Where V=diag(πi
t(1-πit))
Usually only takes a few iterations
E Newton 11
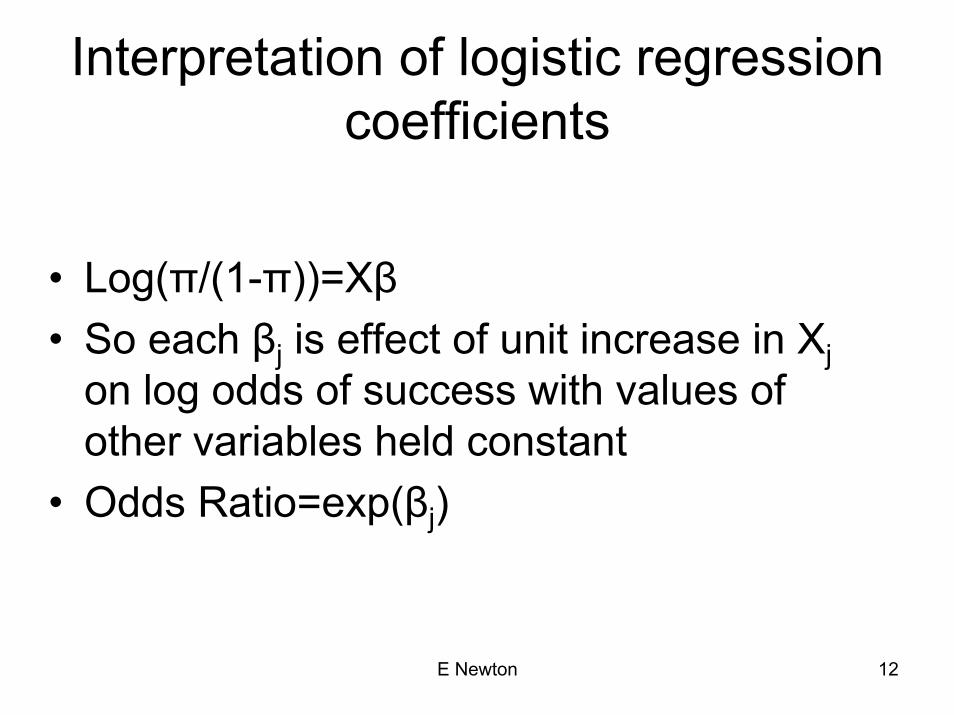
Interpretation of logistic regression coefficients
• Log(π/(1-π))=Xβ• So each βj is effect of unit increase in Xj
on log odds of success with values of other variables held constant
• Odds Ratio=exp(βj)
E Newton 12

Example: Spinal Disease in Children Data SUMMARY: The kyphosis data frame has 81 rows representing data on 81 children
who have had corrective spinal surgery. The outcome Kyphosis is a binary variable, the other three variables (columns) are numeric.
ARGUMENTS: Kyphosis
a factor telling whether a postoperative deformity (kyphosis) is "present" or "absent" .
Agethe age of the child in months.
Numberthe number of vertebrae involved in the operation.
Startthe beginning of the range of vertebrae involved in the operation.
SOURCE: John M. Chambers and Trevor J. Hastie, Statistical Models in S,
Wadsworth and Brooks, Pacific Grove, CA 1992, pg. 200.
E Newton 13
This output was created using S-PLUS(R) Software. S-PLUS(R) is a registered trademark of Insightful Corporation.

Observations 1:16 of kyphosis data setkyphosis[1:16,]
Kyphosis Age Number Start 1 absent 71 3 52 absent 158 3 143 present 128 4 54 absent 2 5 15 absent 1 4 156 absent 1 2 167 absent 61 2 178 absent 37 3 169 absent 113 2 1610 present 59 6 1211 present 82 5 1412 absent 148 3 1613 absent 18 5 214 absent 1 4 1216 absent 168 3 18
E Newton 14
This code was created using S-PLUS(R) Software. S-PLUS(R) is a registered trademark of Insightful Corporation.
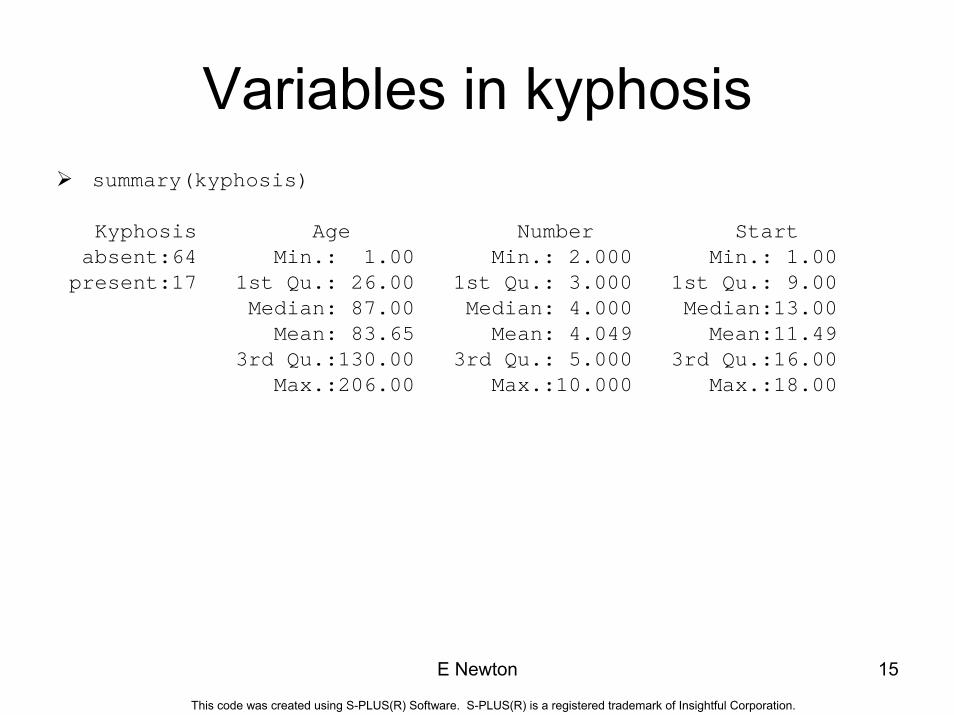
Variables in kyphosissummary(kyphosis)
Kyphosis Age Number Start absent:64 Min.: 1.00 Min.: 2.000 Min.: 1.00 present:17 1st Qu.: 26.00 1st Qu.: 3.000 1st Qu.: 9.00
Median: 87.00 Median: 4.000 Median:13.00 Mean: 83.65 Mean: 4.049 Mean:11.49
3rd Qu.:130.00 3rd Qu.: 5.000 3rd Qu.:16.00 Max.:206.00 Max.:10.000 Max.:18.00
E Newton 15
This code was created using S-PLUS(R) Software. S-PLUS(R) is a registered trademark of Insightful Corporation.
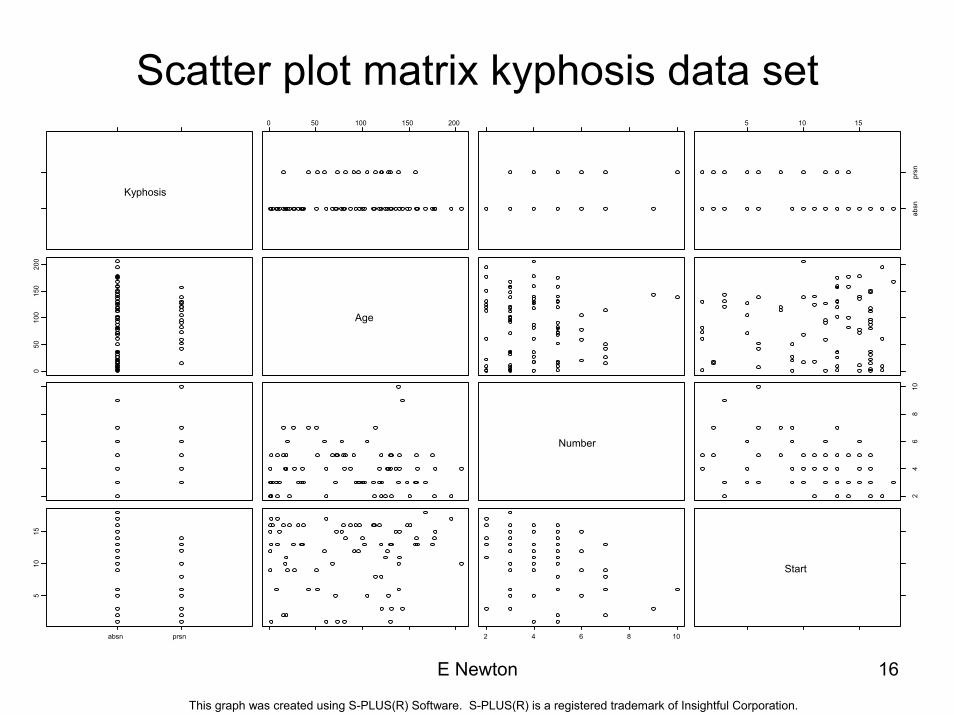
Scatter plot matrix kyphosis data set
Kyphosis
0 50 100 150 200 5 10 15
absn
prsn
050
100
150
200
Age
Number
24
68
10
absn prsn
510
15
2 4 6 8 10
Start
E Newton 16
This graph was created using S-PLUS(R) Software. S-PLUS(R) is a registered trademark of Insightful Corporation.

Boxplots of predictors vs. kyphosis0
5010
015
020
0
Age
absent present
Kyphosis
24
68
10
Num
ber
absent present
Kyphosis
510
15
Star
t
absent present
Kyphosis
E Newton 17
This graph was created using S-PLUS(R) Software. S-PLUS(R) is a registered trademark of Insightful Corporation.

Smoothing spline fits, df=3
jitter(age)
kyp
0 50 100 150 200
1.0
1.2
1.4
1.6
1.8
2.0
jitter(num)
kyp
2 4 6 8 10
1.0
1.2
1.4
1.6
1.8
2.0
jitter(sta)
kyp
5 10 15
1.0
1.2
1.4
1.6
1.8
2.0
E Newton 18
This graph was created using S-PLUS(R) Software. S-PLUS(R) is a registered trademark of Insightful Corporation.

Summary of glm fitCall: glm(formula = Kyphosis ~ Age + Number + Start,
family = binomial, data = kyphosis)
Deviance Residuals:Min 1Q Median 3Q Max
-2.312363 -0.5484308 -0.3631876 -0.1658653 2.16133
Coefficients:Value Std. Error t value
(Intercept) -2.03693225 1.44918287 -1.405573Age 0.01093048 0.00644419 1.696175
Number 0.41060098 0.22478659 1.826626Start -0.20651000 0.06768504 -3.051043
E Newton 19
This code was created using S-PLUS(R) Software. S-PLUS(R) is a registered trademark of Insightful Corporation.

Summary of glm fitNull Deviance: 83.23447 on 80 degrees of freedom
Residual Deviance: 61.37993 on 77 degrees of freedom
Number of Fisher Scoring Iterations: 5
Correlation of Coefficients:(Intercept) Age Number
Age -0.4633715 Number -0.8480574 0.2321004 Start -0.3784028 -0.2849547 0.1107516
E Newton 20
This code7 was created using S-PLUS(R) Software. S-PLUS(R) is a registered trademark of Insightful Corporation.

Residuals
• Response Residuals: yi-πi
• Pearson Residuals: (yi-πi)/sqrt(πi(1-πi))
• Deviance Residuals: sqrt(-2log(|1-yi-πi|))
E Newton 21
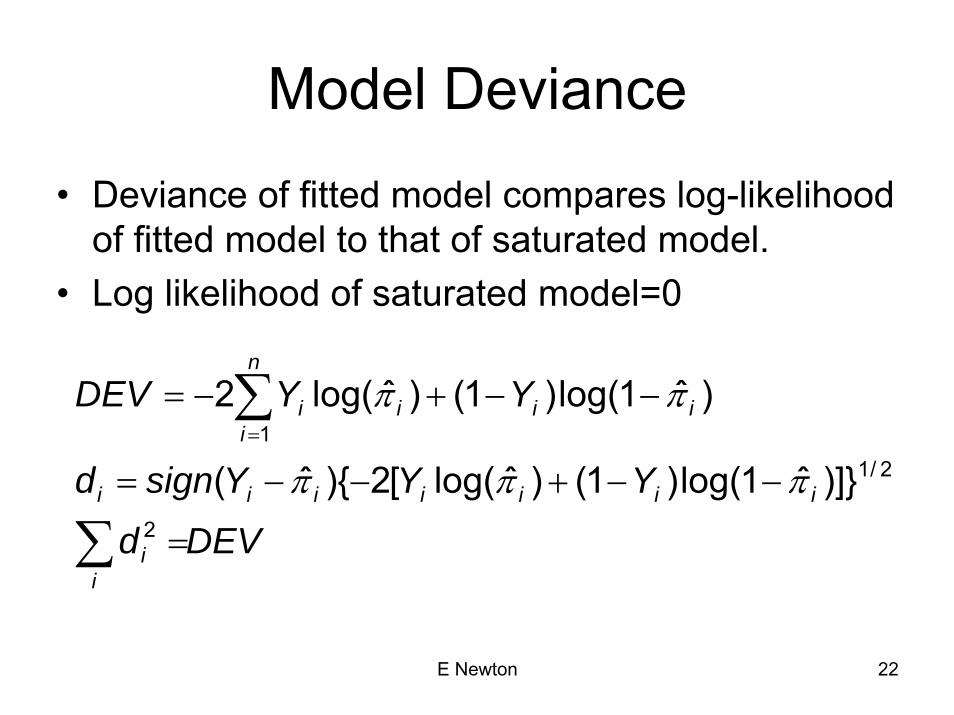
Model Deviance
• Deviance of fitted model compares log-likelihood of fitted model to that of saturated model.
• Log likelihood of saturated model=0
DEVd
YYYsignd
YYDEV
ii
iiiiiii
ii
n
iii
∑
∑
=
−−+−−=
−−+−==
2
2/11
)]}ˆ1log()1()ˆlog([2){ˆ(
)ˆ1log()1()ˆlog(2
πππ
ππ
E Newton 22

Covariance Matrix> x<-model.matrix(kyph.glm)
> xvx<-t(x)%*%diag(fi*(1-fi))%*%x
> xvx(Intercept) Age Number Start
(Intercept) 9.620342 907.8887 43.67401 86.49845Age 907.888726 114049.8308 3904.31350 9013.14464
Number 43.674014 3904.3135 219.95353 378.82849Start 86.498450 9013.1446 378.82849 1024.07328
> xvxi<-solve(xvx)> xvxi
(Intercept) Age Number Start (Intercept) 2.101402986 -0.00433216784 -0.2764670205 -0.0370950612
Age -0.004332168 0.00004155736 0.0003368969 -0.0001244665Number -0.276467020 0.00033689690 0.0505664221 0.0016809996Start -0.037095061 -0.00012446655 0.0016809996 0.0045833534
> sqrt(diag(xvxi))[1] 1.44962167 0.00644650 0.22486979 0.06770047
E Newton 23
This code was created using S-PLUS(R) Software. S-PLUS(R) is a registered trademark of Insightful Corporation.

Change in Deviance resulting from adding terms to model
> anova(kyph.glm)Analysis of Deviance Table
Binomial model
Response: Kyphosis
Terms added sequentially (first to last)Df Deviance Resid. Df Resid. Dev
NULL 80 83.23447Age 1 1.30198 79 81.93249
Number 1 10.30593 78 71.62656Start 1 10.24663 77 61.37993
E Newton 24
This code was created using S-PLUS(R) Software. S-PLUS(R) is a registered trademark of Insightful Corporation.

Summary for kyphosis model with age^2 added
Call: glm(formula = Kyphosis ~ poly(Age, 2) + Number + Start, family = binomial, data = kyphosis)
Deviance Residuals:Min 1Q Median 3Q Max
-2.235654 -0.5124374 -0.245114 -0.06111367 2.354818
Coefficients:Value Std. Error t value
(Intercept) -1.6502939 1.40171048 -1.177343poly(Age, 2)1 7.3182325 4.66933068 1.567298poly(Age, 2)2 -10.6509151 5.05858692 -2.105512
Number 0.4268172 0.23531689 1.813798Start -0.2038329 0.07047967 -2.892080
E Newton 25
This code was created using S-PLUS(R) Software. S-PLUS(R) is a registered trademark of Insightful Corporation.

Summary of fit with age^2 addedNull Deviance: 83.23447 on 80 degrees of freedom
Residual Deviance: 54.42776 on 76 degrees of freedom
Number of Fisher Scoring Iterations: 5
Correlation of Coefficients:(Intercept) poly(Age, 2)1 poly(Age,
2)2 Number poly(Age, 2)1 -0.2107783 poly(Age, 2)2 0.2497127 -0.0924834
Number -0.8403856 0.3070957 -0.0988896 Start -0.4918747 -0.2208804 0.0911896
0.0721616
E Newton 26
This code was created using S-PLUS(R) Software. S-PLUS(R) is a registered trademark of Insightful Corporation.

Analysis of Deviance> anova(kyph.glm2)Analysis of Deviance Table
Binomial model
Response: Kyphosis
Terms added sequentially (first to last)Df Deviance Resid. Df Resid. Dev
NULL 80 83.23447poly(Age, 2) 2 10.49589 78 72.73858
Number 1 8.87597 77 63.86261Start 1 9.43485 76 54.42776
E Newton 27
This code was created using S-PLUS(R) Software. S-PLUS(R) is a registered trademark of Insightful Corporation.

Kyphosis data, 16 obs, with fit and residuals
cbind(kyphosis,round(p,3),round(rr,3),round(rp,3),round(rd,3))[1:16,]Kyphosis Age Number Start fit rr rp rd
1 absent 71 3 5 0.257 -0.257 -0.588 -0.7712 absent 158 3 14 0.122 -0.122 -0.374 -0.5113 present 128 4 5 0.493 0.507 1.014 1.1894 absent 2 5 1 0.458 -0.458 -0.919 -1.1075 absent 1 4 15 0.030 -0.030 -0.175 -0.2466 absent 1 2 16 0.011 -0.011 -0.105 -0.1487 absent 61 2 17 0.017 -0.017 -0.131 -0.1858 absent 37 3 16 0.024 -0.024 -0.157 -0.2209 absent 113 2 16 0.036 -0.036 -0.193 -0.27110 present 59 6 12 0.197 0.803 2.020 1.80311 present 82 5 14 0.121 0.879 2.689 2.05312 absent 148 3 16 0.076 -0.076 -0.288 -0.39913 absent 18 5 2 0.450 -0.450 -0.905 -1.09414 absent 1 4 12 0.054 -0.054 -0.239 -0.33316 absent 168 3 18 0.064 -0.064 -0.261 -0.36317 absent 1 3 16 0.016 -0.016 -0.129 -0.181
E Newton 28
This code was created using S-PLUS(R) Software. S-PLUS(R) is a registered trademark of Insightful Corporation.

Plot of response residual vs. fit
fi
y - f
i
0.0 0.2 0.4 0.6 0.8
-1.0
-0.5
0.0
0.5
E Newton 29
This graph was created using S-PLUS(R) Software. S-PLUS(R) is a registered trademark of Insightful Corporation.

Plot of deviance residual vs. indexre
sid(
kyph
.glm
, typ
e =
"de.
...
0 20 40 60 80
-2-1
01
2
E Newton 30
This graph was created using S-PLUS(R) Software. S-PLUS(R) is a registered trademark of Insightful Corporation.

Plot of deviance residuals vs. fitted value
fitted(kyph.glm2)
resi
d(ky
ph.g
lm2,
type
= "d
....
0.0 0.2 0.4 0.6 0.8
-2-1
01
2
E Newton 31
This graph was created using S-PLUS(R) Software. S-PLUS(R) is a registered trademark of Insightful Corporation.

Summary of bootstrap for kyphosis model
E Newton 32
Call:bootstrap(data = kyphosis, statistic = coef(glm(Kyphosis ~
poly(Age, 2) + Number + Start, family = binomial,data = kyphosis)), trace = F)
Number of Replications: 1000
Summary Statistics:Observed Bias Mean SE
(Intercept) -1.6503 -0.85600 -2.5063 5.1675poly(Age, 2)1 7.3182 4.33814 11.6564 22.0166poly(Age, 2)2 -10.6509 -7.48557 -18.1365 37.6780
Number 0.4268 0.17785 0.6047 0.6823Start -0.2038 -0.07825 -0.2821 0.4593
Empirical Percentiles:2.5% 5% 95% 97.5%
(Intercept) -8.52922 -7.247145 1.1760 2.27636poly(Age, 2)1 -6.13910 -1.352143 27.1515 34.64701poly(Age, 2)2 -48.86864 -38.993192 -4.9585 -4.13232
Number -0.07539 -0.003433 1.4756 1.82754Start -0.58795 -0.470139 -0.1159 -0.08919
This code was created using S-PLUS(R) Software. S-PLUS(R) is a registered trademark of Insightful Corporation.

Summary of bootstrap (continued)BCa Confidence Limits:
2.5% 5% 95% 97.5% (Intercept) -6.4394 -5.3043 2.39707 3.56856
poly(Age, 2)1 -18.2205 -10.1003 18.34192 21.56654poly(Age, 2)2 -24.2382 -20.3911 -1.75701 -0.19269
Number -0.7653 -0.1694 1.14036 1.27858Start -0.3521 -0.3167 -0.03478 0.01461
Correlation of Replicates:(Intercept) poly(Age, 2)1 poly(Age, 2)2 Number Start
(Intercept) 1.0000 -0.4204 0.5082 -0.5676 -0.1839poly(Age, 2)1 -0.4204 1.0000 -0.8475 0.4368 -0.6478poly(Age, 2)2 0.5082 -0.8475 1.0000 -0.3739 0.5983
Number -0.5676 0.4368 -0.3739 1.0000 -0.4174Start -0.1839 -0.6478 0.5983 -0.4174 1.0000
E Newton 33
This code was created using S-PLUS(R) Software. S-PLUS(R) is a registered trademark of Insightful Corporation.

Histograms of coefficient estimates
-50 0 50
0.0
0.05
0.10
0.15
0.20
Value
Den
sity
(Intercept)
0 100 200 300 4000.
00.
010.
020.
030.
040.
05Value
Den
sity
poly(Age, 2)1
-600 -400 -200 0
0.0
0.01
0.03
0.05
Value
Den
sity
poly(Age, 2)2
0 2 4 6 8 10
0.0
0.2
0.4
0.6
0.8
1.0
1.2
Value
Den
sity
Number
-12 -10 -8 -6 -4 -2 0
01
23
4
Value
Den
sity
Start
E Newton 34
This graph was created using S-PLUS(R) Software. S-PLUS(R) is a registered trademark of Insightful Corporation.

QQ Plots of coefficient estimates
Quantiles of Standard Normal
Qua
ntile
s of
Rep
licat
es
-2 0 2
-50
050
(Intercept)
Quantiles of Standard Normal
Qua
ntile
s of
Rep
licat
es-2 0 2
010
020
030
040
0
poly(Age, 2)1
Quantiles of Standard Normal
Qua
ntile
s of
Rep
licat
es
-2 0 2
-600
-400
-200
0
poly(Age, 2)2
Quantiles of Standard Normal
Qua
ntile
s of
Rep
licat
es
-2 0 2
02
46
810
Number
Quantiles of Standard Normal
Qua
ntile
s of
Rep
licat
es
-2 0 2
-12
-10
-8-6
-4-2
0
Start
E Newton 35
This graph was created using S-PLUS(R) Software. S-PLUS(R) is a registered trademark of Insightful Corporation.