Embed Size (px)
Citation preview

Program: master
Banking and finance
“Leasing as an alternative source of financing”
Mavrogiannidou Maria
I.d. number: 1103100043
2011-2012
Supervisor:
Christos Grose
October 2012

Leasing as an alternative source of financing
1 Mavrogiannidou Maria

Leasing as an alternative source of financing
2 Mavrogiannidou Maria
Abstract
This thesis begins with a descriptive study of leasing types and how they are
represented in the financial position of the companies using accounting records. Then
we quote the advantages and disadvantages of leasing and, through a real example,
we show how a company can choose between leasing and traditional forms of finance.
Following there is a presentation of finance lease in Greek economy. In the last and
empirical part of the thesis, we attempt, with the use of linear regression using data
from 2005 to 2011, to predict the future leasing penetration in Greece using time as a
variable.
Acknowledgments
I would like to address special thanks to Bank of Cyprus and specifically the division of
Leasing of North Greece for the data that were provided to me and for the substantial
help during the development of this thesis. I would also like to state that by no means
the product of the following study reflects the opinion or beliefs of the organization.

Leasing as an alternative source of financing
3 Mavrogiannidou Maria
Table of Contents
1. Introduction .......................................................................................................................... 6
2. Literature review ................................................................................................................... 8
3 Leasing .................................................................................................................................. 9
3.1. History of leasing ........................................................................................................... 9
3.2. Introduction to the sense of Leasing .......................................................................... 10
3.3. Leasing characteristics ................................................................................................ 11
3.4. Types of leasing: .......................................................................................................... 11
3.4.1. Financial leasing .................................................................................................. 12
3.4.2. Operational leasing ............................................................................................. 16
3.4.3. Sale and lease back (leaseback) .......................................................................... 17
3.4.4. Vendor leasing .................................................................................................... 18
3.4.5. Leveraged leasing ................................................................................................ 19
3.5. Purpose of leasing ....................................................................................................... 19
3.6. Choosing between loan or lease ................................................................................. 21
3.7. Leasing developments and penetration in Greek economy ....................................... 24
4. Methodology ....................................................................................................................... 29
4.1 Numerical analysis and linear regression tests ............................................................... 30
4.1.1. Penetration of leasing in real estate 2005 to 2011 ............................................. 31
4.1.2. Penetration of leasing in real estate 2007 to 2011 ............................................. 32
4.2.1. Penetration of leasing in equipment from 2005 to 2011 ................................... 33
4.2.2. Penetration of leasing in equipment from 2007 to 2011. .................................. 34
4.3.1. Penetration of leasing in machinery 2005 to 2011. ............................................ 35
4.3.2. Penetration of leasing in machinery from 2007 to 2011. ................................... 37
4.4.1. Leasing penetration in professional vehicles from 2005 to 2011. ...................... 38
4.4.2. Penetration of leasing in professional vehicles from 2007 to 2011. .................. 39
4.5.1. Leasing penetration in personal vehicles from 2005 to 2011 ............................. 41
4.5.2. Leasing penetration in personal vehicle from 2007 to 2011. ............................. 42
3.6.1. Leasing penetration in other types of equipment leasing from 2005 to 2011. .. 43
3.6.2. Leasing penetration in other types of equipment from 2007 to 2011. .............. 44
4.7.1. Leasing penetration in all types of equipment from 2005 to 2011. ................... 46
4.7.2. Leasing penetration in all types of equipment from 2007 to 2011. ................... 47
4.8. Normalization of the above regression .................................................................. 48

Leasing as an alternative source of financing
4 Mavrogiannidou Maria
5. Conclusions ......................................................................................................................... 50
6. Bibliography ........................................................................................................................ 52
List of tables
Table 1 -- Lease table format pg.15
Table 2 -- Calculation of tax relief on WDAs if the asset is bought pg.22
Table 3 -- Cost of borrowing to buy pg.23
Table 4 -- Cost of leasing pg.23
Table 5 -- Values from linear regression of real estate pg.31
Table 6 -- Values from linear regression of real estate pg.22
Table 7 -- Values from linear regression of equipment pg.33
Table 8 -- Values from linear regression of equipment pg.34
Table 9 -- Values from linear regression of machinery pg.36
Table 10 -- Values from linear regression of machinery pg.37
Table 11 -- Values from linear regression of professional vehicles pg.38
Table 12 -- Values from linear regression model of professional vehicles pg.39
Table 13 -- Values from linear regression model for personal vehicles pg.41
Table 14 -- Values from linear regression model for personal vehicles pg. 42
Table 15 -- Values from linear regression of leasing in other types pg. 43
Table 16 -- Values from linear regression of other types of equipment pg.45
Table 17 -- Values from linear regression of leasing in all types of equipment pg.46
Table 18 -- Results from linear regression in all types of equipment pg.47
Table 19 -- Normalized regressions pg.49
Leasing as an alternative source of financing
5 Mavrogiannidou Maria
List of images
Image 1 -- Penetration of leasing in different types of investment pg.25
Image 2 -- Leasing in different types of professional activity pg.26
Image 3 -- Leasing penetration depending on the duration of the contract pg.27
Image 4 -- Leasing penetration according to geographical region pg.28
Image 5 -- Sample of data used in our regression model from: pg.29
Image 6 -- Graphical presentation of the predicted and actual data of real estate pg.31
Image 7 -- Graphical presentation of the predicted and actual data of real estate pg.32
Image 8 -- Graphical presentation of the predicted and actual data of equipment pg.34
Image 9 -- Graphical presentation of the predicted and actual data of equipment pg.35
Image 10 -- Graphical presentation of the predicted and actual data of machinery pg.36
Image 11 -- Graphical presentation of the predicted and actual data of machinery pg.37
Image 12 -- Graphical presentation of the predicted and actual data of profess vehicles pg.39
Image 13 -- Graphical presentation of the predicted and actual data of profess vehicles pg.40
Image 14 -- Graphical presentation of the predicted and actual data of personal vehicles pg. 41
Image 15 -- Graphical presentation of the predicted and actual data of personal vehicles pg. 42
Image 16 -- Graphical presentation of the predicted and actual data of others pg.44
Image 17 -- Graphical presentation of the predicted and actual data of others pg.45
Image 18 -- Graphical presentation of the predicted and actual data of all pg.46
Image 19 -- Graphical presentation of the predicted and actual data of all pg.47
List of abbreviations
NCA: non-current assets
MLPs: minimum lease payments
Dr: debit record
Cr: credit record
FL: finance lease
pa: per annum
WDA: written down allowances
ca: capital allowance
NPV: net present value
SFP: statement of financial position

Leasing as an alternative source of financing
6 Mavrogiannidou Maria
1. Introduction
In last few decades we witnessed major changes in the international capital markets, the
financial products that major financial institutions and banks provided, have been multiplied in
order to attract investors and satisfy the loanees. The major financial institutions have
expanded their activities offering new services and products. This was the main reason that
the worldwide economic crisis begun. Leasing was one of those new products that banks
offered in order to help businesses to renew or buy equipment such as real estate, machinery,
professional vehicles etc. Leasing was a product that market needed in order to solve a major
problem, this problem was that the business, without the use of leasing should cover a
major part of the total cost of the investment.
Many banks have successfully responded to the new conditions of the market and started
lending in order to expand their activities. Consequently banking sector has a major
contribution to a country’s development. Via banking institutions businesses cover a
wide range of their needs. Financing programs that are issued by banks are used to
cover the needs of various enterprises in order to proceed with their investment
activity or even support their productive activities. Banks adjust their long term lending
according to the need of the companies that invest in the acquirement or the renewal
of their fixed equipment. Concerning the needs that arise from the standard
production activity, banks also provide the appropriate funding adjusted to each
company. The question that arises at this point is how can a business decide which
type of financing is suitable for its needs?1 Leasing or loan?2 And if the choice is lease,
what type of lease would serves the best in the interest of the business? Through
accounting examples there will be a comparison between leasing and loan in the
financial statements of companies.
The past few years, banking system has suffered the consequences that have derived
from the economic crisis that occurs in the country. The alternative ways of funding
1 An Yan (2006), Leasing and Debt Financing: Substitutes or Complements? Journal of Financial an
Quantitative Analysis, vol. 41, No 3, September 2006
2 John R. Ezzell, Premal P. Vora (2001), Leasing versus purchasing: direct evidence on a corporations
motivations for leasing and consequences of leasing, The Quarterly Review of Economics and Finance,
Volume 41, issue 1, pg. 33-47

Leasing as an alternative source of financing
7 Mavrogiannidou Maria
that are considered to be more efficient than the traditional methods and are provided
by banking sector in Greece, have also been affected. In this uncertain environment, is
there any way for banks to predict their needs in the leasing market in order for them
to be better prepared? The most widespread of the alternative methods of financing
provided by banks is leasing, the concept of which will be analyzed throughout this
dissertation as well as the utility that it provides to a company as alternative way of
financing. We will also attempt to predict the future penetration of leasing in the
various fields of use, using linear regressions, something that could be of great interest
for banks’ executives and administration in order to redesign the structure of
institution and individual departments in order to be consistent with the commands of
the economic conditions.

Leasing as an alternative source of financing
8 Mavrogiannidou Maria
2. Literature review
As leasing begun to gain grain in the preferences of the entrepreneurs, GAAP (General
Accepted Accounting Principles) committee had to reform IAS17 (the international
standard for leases) several times since the original form in 1980, reaching to the final
revise in 2010, showing that leasing developments and affects have troubled
accountants as far as how to present lease in the financial statements of a company.
In order for the lessees to comply with the reforms, they are requested to proceed in
fundamental changes on how they account equipment leasing transactions and real
estate, given that they need to provide a more expansive financial statement then
before (Leonard, O’Brian 2010).
Additionally, leasing has been a significant topic in corporate financing behavior, since
it is involved in capital structure determination of firms listed in Athens Stock Exchange
and contributes to the variation of capital structure across firm classifications and over
time (Noulas, Genimakis 2011). Moreover, lease has been examined in relation to debt
financing in marginal financing costs of different firms, in order to see if the two types
supplement or complement each other, concluding that the degree of substitutability
between leases and debt is higher in firms that pay no dividends, have higher marginal
tax rates or the firms with more investment opportunities (An Yan 2006). Another
empirical approach on leasing is that of the application of Markov chains on the
management of leasing (Barua, Srinivasan G. 2011) showing that despite low
percentages of bad debt there could be a reduction in the return earned by the lessor
due to the delay in payments. Additionally the model could be used to evaluate
working capital needs arriving at the age distribution of accounts.

Leasing as an alternative source of financing
9 Mavrogiannidou Maria
3 Leasing
3.1. History of leasing3
Leasing procedures are traced back centuries ago. Ancient Sumerians produced
leases on clay tablets for agricultural tools, land, water rights and animals. Clay tablets
that were traced in the city of Ur and are predated 2000 BC are the oldest “hard
evidence” of leasing that exist. There is also a record of the Code of Hammurabi, which
presents a Babylonian leasing law, by King Hammurabi, dating back to 1700 BC.
According to manuscripts and historical data, ancient civilizations such as Greeks,
Romans, Egyptians and Phoenicians, used leasing as a financial tool to acquire access
to equipment, land and livestock. More specifically the Phoenicians used ship
chartering in order to obtain the use of crew and ship.
Moving on to the Medieval Ages we observe the lease of agricultural, industrial and
even military equipment with a striking example that of the two invasion fleets sent to
England by the Norwegians and the Normans in 1066 AD, that were both leased. With
the passing of the years, leasing was mainly used to horses and farming equipment. In
1284 AD in England the composition of the Statute of Wales dealt directly with the
leasing personal property and this matter was further dealt with in 1571 AD by a
statute that clarified who actually owned the leased equipment. In the United States
leasing was used in the 1700’s to finance horse drawn wagons, but it was latter on
with the start of Industrial Revolution in United Kingdom and in North America that
more opportunities regarding leasing appeared, especially in railroad sector and that
initiated the real growth of leasing. Banks or trust companies were set up therefore a
more organized procedure was adopted.
Although leasing has been used for thousands of years, it was evolved during the last
decades, when it was faced as a specialized financial service rather than a
manufacturer-selling technique, with the establishment of the first independent
3 D. VAsiliou, N. Ipirotis, (2008), Financial Management (Theory and Practice), Rosili publishing, pg.448-
463.

Leasing as an alternative source of financing
10 Mavrogiannidou Maria
leasing company in 1952 in the United States. In the 1960’s the industry extended in
Europe, Japan then Canada and since the mid 1970’s has been spreading to developing
countries. By the 1994 leasing had been established in over 80 countries with the
growth of independent financial companies of all sizes being significant in the recent
years.
3.2. Introduction in Leasing
The only common definition existing for lease, on a European level, is the one provided
by the international accounting standard for leases IAS17, where lease is defined as
“an agreement whereby the lessor conveys to the lessee, in return for a payment or
series of payments, the right to use an asset for an agreed period of time”4.
Leasing is an international term that is used to describe the transfer of the right to use
a fixed asset from the lessor to the lessee for a certain payment for a specific number
of years in the form of lease. Lessor is the owner of an asset that is leased under an
agreement, while the lessee is the person who rents the asset from the lessor and is
legally bounded towards the lessor to uphold specific obligations that are defined in
the leasing agreement and by the law. In general, leasing is a form of medium to long
term funding of businesses and professionals in order for them to acquire fixed assets
such as building and machinery that are of great significance to the continuing of their
professional activities. The institution of leasing has been introduced in the Greek
market in two stages. During the first stage, through the law 1665/86 was introduced
the portable property leasing, which covers the need to lease any mobile asset that
can be used for professional usage. During the second stage through the laws 2367/95
and 2682/99 the institution of leasing was expanded to the lease of real estate that is
also used for professional usage.
4 ACCA (2012), “Financial Reporting (FR)”, Kaplan publishing, pg.276

Leasing as an alternative source of financing
11 Mavrogiannidou Maria
3.3. Leasing characteristics5
General futures
The subject of leasing could be mobile or real estate or the two forms
combined. At the end of the leasing period, the lessor is given the right to buy
the asset or to renew the lease for a specific period of time. It is worth
mentioning that the purchase of the asset could be performed before the end
of the lease period, if this is agreed in the original contract.
The time period of leasing must be specific and cannot be agreed for less than 3
years for portable assets, 5 years for aircrafts and 10 years for real estate.
The parties have the discretion of unbinding the lease before the expiry of the
time that has been agreed given that certain reasons have come up.
Objects of financing
Business equipment
Industrial equipment
Businesses real estate
Transportation means
What is not financed:
Boats-floating crafts
Land
Consumables
Work
Maintenance
Services provided
3.4. Types of leasing6:
The IAS 17 effectively accounts for the economic substance of the two major types of
leasing that are:
5http://www.aglc.gr/index.php?option=com_content&view=category&layout=blog&id=13&Itemid=28&lang=en 6 ACCA, 2012, Financial Reporting (FR),Kaplan publishing, pg. 277-290

Leasing as an alternative source of financing
12 Mavrogiannidou Maria
Finance lease that transfers substantially all the risks and rewards incidental to
ownership of an asset with title that may or may not be transferred eventually.
Operating lease, that is a lease other than finance lease.
The first indication that proves weather a lease is finance or operating is to assess the
risk and rewards of ownership have been transferred to the lessee.
3.4.1. Financial leasing
In financial leasing, the lessor finances the total amount of the asset or equipment and
then the lessee, who requires the equipment or machinery, uses it in exchange of fixed
payments. This particular type of lease is also known as Full Payout Lease and there is a
full transfer of all the risks and rewards related to the asset from the lessor to the
lessee. The ownership of the asset gets transferred to the lessee at the end of its
economic life. It is common for the lease term to extend over the most of the
economic life of the asset. In this type of lease the lessor has only the role of the
financier. Big industrial equipment is a common example of finance lease. When the
contracted period reaches its end, there is often given the option of continuing the
lease at a reduced rate or even the purchase of the leased asset at a reduced price.
The IAS 17 states that a lease is probably a finance lease when one or more of the
following apply:
Ownership is transferred to the lessee at the end of the lease term as it
happens in hire-purchase transactions.
The lessee has the option to purchase the asset at a favorable price, such that
the option is almost certain to be exercised.
The lease term, that might even include a secondary term, is for the major part
of the economic life of the asset.
At the inception of the lease, the present value of the minimum lease payments
(MPLs), including any initial deposit, amounts to at least substantially all the fair
value of the asset (at least 90%).
The leased asset is of a specialized nature such that only the lessee is able to
use it without the need of major modifications.
The lessee will compensate the lessor if the lease is cancelled.

Leasing as an alternative source of financing
13 Mavrogiannidou Maria
Gains or losses from fluctuations in fair value of the asset are borne by the
lessee.
The lease is non-cancellable or only cancellable with a penalty to the lessee.
The lessee has the ability to continue the lease for a secondary period at a rent
that is substantially lower than market rent, for example at nominal rent.
If at any time the terms of the lease change resulting to a different classification at
inception of the lease, then the lease contract is canceled and the revised
agreement is considered as the new contract.
3.4.1.1. Accounting treatment for the lessee
A finance lease has to be reflected in the lessee’s statement of financial position both
as an asset and as an obligation to pay future lease payments.
The items recognized by the lessee in financial statements are as following:
1. Non-current asset (NCA) in statement of financial position (SFP)
2. Liability payable to lessor in SFP (it must be split between current and non-
current portions)
3. Depreciation expenses (charged in the income statement)
4. Finance cost (charged in the income statement)
At the commencement of the lease term, the asset and the liability for the future lease
payments are recognized in the statement of financial position at the same amounts
Dr NCA Asset held under finance lease x
Cr Finance lease liability x
The amount charged will be the lower of fair value to cash price of leased asset and
present value of MLPs.
The initial direct costs of the lessee such as the negotiating and securing leasing
arrangements are added to the cost of the asset

Leasing as an alternative source of financing
14 Mavrogiannidou Maria
Dr NCA x
Cr Bank x
As far as the initial deposit made by the lessee, if a deposit to the initial payment is
paid at the inception of the lease, it forms part of the MLPs and reduces the initial
finance lease liability
Dr Finance lease liability x
Cr Bank x
Subsequent recognition is reflected as following:
The leased asset is depreciated over the shorter of its useful life and the lease term
(including any secondary period)
The lease payments comprise both finance charge and capital repayment.
A capital repayment (for example a repayment of lease liability)
Dr Finance lease liability x
Cr Bank x
With the rental paid
A finance charge
Dr Interest expense x
Cr Finance lease liability x
With the interest expense equals finance charge
The total finance charges under the lease are:
Total MLPs x
Less: fair value of asset (x)
Total finance charges x
The total finance charge must be allocated to each period during the lease term using
the actuarial method:

Leasing as an alternative source of financing
15 Mavrogiannidou Maria
Interest is charged to each period at a constant rate (%) on the outstanding
liability using the interest rate implicit in the lease.
When it is not possible to use the actuarial method, the sum of digits is
normally a reasonable approximation.
Table 1 Lease table format
Rental payments in advance
Year B/fwd. Rental Capital o/s interest % C/fwd.
xxxx x (x) x x x
Rental payments in arrears
Year B/fwd Interest % Rental C/fwd
xxxx x x (x) x
3.4.1.2 Accounting treatment of the lessee
It could be said that it is the mirror image of the lessee accounting treatment. The
lessor does not have the control of the asset. The lessor derecognizes the asset and
recognizes a receivable.
Dr Net investment in FL x
Cr Asset x
Dr/Cr Profit/Loss on disposal x/ x
The carrying value of the receivable equals net investment in the lease, while the net
investment in lease equals the present value of minimum lease payments plus present
value of any unguaranteed residual value accruing to the lessor.
In practice, net investment is approximately the lessee’s lease liability. Lease receipts
comprise of principal and finance income.
Finance income
Dr Net investment in FL x
Cr Interest income x

Leasing as an alternative source of financing
16 Mavrogiannidou Maria
Repayment of principal
Dr Bank x
Cr Net investment in FL x
When the lessor has the role of manufacturer or dealer that offer finance lease then
the accounting treatment is that he should recognize separately normal selling profit
based on normal selling prices and finance income over the lease of term. Also the
revenue should be measured as the lower of the present value of the asset and the
present value of minimum lease payments (using market interest rates). Moving on to
the cost of sales, it should be measured as the cost of the asset (carrying amount if
lower) minus the present value of any unguaranteed residual value. Both
manufacturers and dealers should recognize costs incurred in negotiating the lease as
expenses.
3.4.2. Operational leasing
In operating lease the time limit is much shorter than the full economic life of the asset.
The lessee is not completely burdened with all the risk relevant to the investment and
is not liable for the financing of its full value but also does not acquire all the benefits
that are derived from the asset. The lessor carries the ownership along with all the
risks and rewards and depends on many different lessees to recover the cost of the
investment. In the type of lease, the lessor provides not only the financing but also any
other additional services that will be necessary during the use of the asset. This kind of
lease is vastly used from companies that need to update or replace their equipment
frequently such as music systems, vehicle fleets, aircraft fleets. The assets in operating
lease usually have a resale value.

Leasing as an alternative source of financing
17 Mavrogiannidou Maria
3.4.2.1. Accounting treatment of the lessee
As risks and rewards of ownership are not transferred to the lessee operating leases
are not capitalized. The asset leased is not recognized in the financial position of the
lessee. Also lease payments or rentals must be charged to the lessee’s income
statement (e.g. rent expense) on a straight-line basis over the term of the lease. In the
case that there is any difference between amounts charged and amounts paid, will be
treated as prepayments or accruals.
3.4.2.2. Accounting treatment of the lessor
When a lessor has an operating lease then he continues to recognize the leased asset.
The leased asset is recognized in the statement of financial position depreciated in the
normal way. The rental income is reflected in the income statement on a straight-line
basis over the term of the lease. In the case that a difference comes up between
amounts charged and amounts paid will be adjusted as receivables or deferred income.
In the case that the lessor is a manufacturer or dealer then selling profit should not be
recognized on entering into an operating lease because the risks and rewards are not
transferred to the lessee, it is not treated as it is a sale.
3.4.3. Sale and lease back (leaseback)
Leaseback is a form of lease arrangement where the owner of an asset sells it to
another party, usually a finance institution or leasing company, and then immediately
contracts to lease the asset from the byer for a specific period of time. The seller, while
loses the ownership of the asset, maintains the right to use it for the duration of the
agreed term of lease. On the other hand the byer has guaranteed immediate and long
term income on the property from the lease payments. This type of lease is commonly
used when an entrepreneur wants to acquire capital that had been tied up in long
term equipment. Leaseback is used as an alternative to loans when the cost of
payments is lower than the cost of a loan or even when a company wants to show less
debt on its balance sheet (off- balance-sheet financing). Leaseback transactions are
used frequently in commercial vehicles, commercial real estate and other types of
property.

Leasing as an alternative source of financing
18 Mavrogiannidou Maria
3.4.3.1. Sale and leaseback accounting treatment
Leaseback is classified to finance or operating lease with the normal criteria of IAS 17
discussed above.
The main characteristic of leaseback is that, it is a loan to the lessee, secured on the
asset. No actual sale is being performed. The lessee continues to recognize the original
asset less depreciation, while the sale proceeds are credited to a finance lease liability
account. Subsequently, lease payments are treated as usual; they split between
interest and principal.
If current value of assets is less then future value then
Dr Bank x
Cr Asset (CV) x
Cr Deferred Income x
Dr Asset (FV) x
Cr Finance lease liability x
Where the deferred income will be released in the income statement at the same rate
as the leased asset will be depreciated. The effect will be the same as in the case that
the asset was not leased. Practically the income statement will only have the impact of
finance cost.
If current value of asses equals future value then
Dr Bank x
Cr Finance lease liability x
3.4.4. Vendor leasing
Vendor leasing, also known as lease asset servicing, is a type of lease based on the
creation of an economic agreement between retail vendors that supply fixed and
mobile equipment and their clients- businesses. To do so, the retail vendor has to
establish a deal with a financing source such as a leasing company, so that the vendor
can offer leases to clients. By offering financing the vendor performs a cash sale while
receiving funding from the financial institution. As a result of vendor leasing, the

Leasing as an alternative source of financing
19 Mavrogiannidou Maria
supplier completely or partially substitutes the leasing company because he can be in
charge of signing contracts and collecting rents. Depending on the deal, the vendor
may also collect the leasing payments and turn them over to the financing institution
or the client may pay the finance company directly. The credit checking of the client
and the operational administration is usually handled by the financing company. Then
the vendor presents the finance option to the client, if he accepts it, the vendor
receives the cash from the financing institution. Through vendor leasing companies
are given the opportunity to fulfill their orders and get the necessary financing for it
without having to apply for a bank loan in advance. There is a vast variety of
equipment that can be used under vendor leasing such as trucks, cars, computers,
forklifts, medical-printers and there is also given the possibility to sign or repo under
warranty from the vendor. Vendor leasing gives helps stimulate vendor sales while
builds a more solid vendor-client relationship. The accounting treatment of lessee and
lessor depend on the classification of the leasing, if it is finance or operational lease.
3.4.5. Leveraged leasing
In this form of lease the lessor borrows an amount of the financing necessary for the
purchase of the asset. Unlike the other types of lease, where there are two parties
involved (the lessor and the lessee), in leveraged leasing there is another party. The
third party has the role of the lender, who helps in the financing necessary for the
acquisition of the asset that will be leased. The lessor has the same role as in the
previous types of lease mentioned. The loan is collateralized with a mortgage over the
asset as well as the legal transfer of the lease and the payments. Additionally the lessor
can guarantee for the dept. In some lease terms the lessee issues bills of exchange that
are guaranteed from the lessor. This guaranty reduces the risk in which the byers of
the bills of exchange (borrowers) are exposed reducing therefore the cost of borrowing.
3.5. Purpose of leasing
Leasing constitutes an alternative and flexible way of financing businesses activity
compared to the traditional ways of medium-long term bank loans. Therefore, leasing
constitutes a mechanism that provides the business the chance to acquire, complete,
renew or expand its productive equipment avoiding the usage of the company’s capital.

Leasing as an alternative source of financing
20 Mavrogiannidou Maria
Advantages deriving from the use of leasing7
Leasing as a form of finance has advantages for the lessor, the lessee and for the
national economy as well. The lessee is being financed with the total amount of the
investment from the leasing company without the need of disbursement and the
participation of the lessor. The procedures are quick and simple while the tax and
other motives that the investor has been able to achieve through the various
development laws are not jeopardized. Leasing does not require additional safeguards
such as mortgages or prenotations. As the time schedule of payments is concerned it is
appeared to be very flexible, something which is very important especially for the
businesses that present seasonality in cash flows. A very important aspect for the
company is the tax deduction of the total amount of the lease that is combined to the
shorter duration of the contract from the useful life of the equipment. Moreover the
business is protected from the technological depreciation of the equipment while the
liquidity of the lessee gets increased with the use of sale and lease-back possibility.
Through leasing procedure the lessee is able to obtain capital equipment without
charging the credit limit that is preserved in the banks and without the use of own
equity. Also the lessee is given the possibility of preserving his liquidity as he does not
have to use his own capital in order to acquire the asset.
Disadvantages deriving from the use of leasing8
According to international experience the cost of leasing is usually slightly higher than
the cost of the equivalent banking lending. Therefore the choice between leasing or
using bank loan should be based in analyzing each case separately, as data (cost of
capital, depreciation e.c.t) differ in each case. The interest rate used differs between
leasing companies and between time periods. Additionally, interest rate changes
according to the conditions that exist in the market consequently having an effect on
7 John R.Ezzell, Premal P. Vora (2001), Leasing versus purchasing: direct evidence on a corporations
motivations for leasing and consequences of leasing, The Quarterly Review of Economics and Finance,
Volume 41, issue 1, pg. 33-47
8 D. Vasiliou Ν.Ipirotis (2008) Financial Management (Theory & Practice), pg. 448-463

Leasing as an alternative source of financing
21 Mavrogiannidou Maria
the lease payments. Therefore the lease payment is not stable or independent from
the changes in bank interest rates.
As the financial institution (lessor) is concerned, has to face less danger than the issue
of a loan, given the fact that the lessor preserves the ownership of the fixed asset as
opposed to the lessee, who in case of danger has to deal with the cost and delay in
order to acquire the possession of the assets that has financed. Therefore, leasing
company obtains insurance of tangible nature due to the right of high ownership,
which provides a high mean of protection and in the same time a significant advantage
over the rest of the collateral types. Leasing as a new mean of finance has expanded
the banking clientele and is offering new chances of business activities.
3.6. Choosing between loan or lease9
When a company has to acquire an asset, a very significant question is how the
acquisition must be financed, should the company lease or apply for a loan in order to
buy the asset. In order for this decision to be made there are two methods that are
used10. In the first method the decision is based on whether the asset is worth
acquiring calculating the present value of operational costs and benefits from its usage.
Then the net present value of both financing alternatives is calculated and the one
with the highest outcome is selected. In the second method of selection the choice is
made by choosing the cheapest method of financing.
In order to demonstrate how the methods are used in order to make the decision of
lease or buy, follows a real arithmetic example of company that needs a new machine
to neutralize the toxic sewage that are produced its refining plant. The machine is
expected to cost 6, 4 million euros and is expected to have an economic life of five
years. For this investment the company can dispose capital allowances of 25% per
annum on a reducing balance basis. Taxation of 30% is payable on operating cash flows,
one year in arrears. For the acquirement of the equipment the company has two
9 Leasing versus purchasing: direct evidence on a corporations motivations for leasing and consequences
of leasing, John R.Ezzell, Premal P. Vora, The Quarterly Review of Economics and Finance, Volume 41,
issue 1, spring 2001, pg. 33-47
10 Kaplan ACCA (2011), “Financial Management (FM)

Leasing as an alternative source of financing
22 Mavrogiannidou Maria
alternatives, the first one is to finance the investment by using a five-year fixed
interest loan at a pre-tax cost of 11,40 % per annum with principal payable in five years’
time. The second alternative is to acquire the equipment using a finance lease over five
years at 1, 42 million euros payable in advance. Given the fact that the scrap value of
the machine will be zero in both alternatives the following tables present the
calculations that are made in order to decide the method of finance.
Table 2 Calculation of tax relief on WDAs if the asset is bought
YEAR NARRATIVE WRITTEN
DOWN VALUE
TAX SAVED/EXTRA
TAX PAID AT 30%
TIMING OF
TAX FLOW
million euro million euro
0 Cost 6,400
1 CA 1,600 0,480 2
4,800
2 CA 1,200 0,360 3
3,600
3 CA 0,900 0,270 4
2,700
4 CA 0,675 0,203 5
2,025
5 disposal proceeds 0,000
balancing allowance 2,025 0,608 6

Leasing as an alternative source of financing
23 Mavrogiannidou Maria
Table 3 Cost of borrowing to buy
Time 0 1 2 3 4 5 6
Million
euros
Million
euros
Million
euros
Million
euros
Million
euros
Million
euros
Million
euros
Asset [6,400]
Tax relief on
CAs 0,480 0,360 0,270 0,203 0,608
[6,400] 0 0,4800 0,3600 0,270 0,203 0,608
(W1) PV
factor at 8% 1,000 0,926 0,857 0,794 0,735 0,681 0,630
(W2) PV [6,400] 0 0,411 0,286 0,198 0,138 0,383
NPV=[4,984]
mil.euros
Table 4 Cost of leasing
timing narrative Cash flow DF at 8% PV
Million
euros
Million
euros
0-4 Lease payments [1,420] 1+3,312 [6,123]
2 6 Tax savings 0,426 3,993*0,926 1,575
NPV
[4,548]
The choice between leasing and loan is based upon the comparison between the two NPVs
calculated above. In this example the cost of leasing is lower than the cost of buying the
asset therefore the company should acquire the asset under a finance lease.

Leasing as an alternative source of financing
24 Mavrogiannidou Maria
3.7. Leasing developments and penetration in Greek economy11
In Greek market, the asset finance and equipment leasing are controlled by the
banking sector, since banks are in charge of leasing companies and there are no
captive lessors. Every bank that has a leasing department is a member of the
Association of Greek Leasing Companies (AGLC) which in turn is a member association
of Leaseurope. Marine vessels are not included under Greek leasing legislation,
although shipping is a major sector in Greek economy. The past few years’ Greek
economy has been severely stroked by the global economic crisis, leading banking
system under pressure and major rearrangements that will inevitably lead to fewer
leasing companies. Up until 2002 leasing was mainly used in financing movable
equipment of all types, with the exception of marine vessels but including aircrafts. In
2002 legislation changed in order to include real estate, from that point and until 2007
Greek leasing market experienced a continuing growth but it was when the first signs
of the upcoming crisis appeared.
During the years 2007 and 2011, new business decreased each year but during 2009 to
2010 leasing companies were still supported by their parent banks. During 2008, when
the economic crisis was obvious in the United States and in Europe, financial leasing
marked in Greece was not severely affected, in years 2009 and 2010 deterioration
made its appearance but it was in 2011 that financial leasing market had a major
decrease. The continuing uncertainty and instability in Greek economy has a negative
effect in investment initiatives from both the lessors and lessees. These conditions are
expected to change for the best after the recapitalization of banks, something that is
expected to provide liquidity in their leasing subsidiaries that in their turn will drain it
to the market helping the economy to progress. In order to demonstrate the course of
leasing penetration in Greek market, for the years 2005 to 2011, we have used the
data provided to us from Bank of Cyprus and the Association of Greek Leasing
Companies (AGLC), and produced graphs presented in tables 5, 6, 7 and 8 following.
11 Nigel Carne (2012), Greece asset and auto finance survey, White Clarke Group http://www.whiteclarkegroup.com/downloads/view/global_leasing_report_2012

Leasing as an alternative source of financing
25 Mavrogiannidou Maria
Image 1 Penetration of leasing in different types of investment
As observed in the table 5, in Greece leasing is particularly preferred in financing real estate,
since it presents the highest amounts since 2005 that are followed by a very steep decrease
from 2007 until 2011; a detailed analysis will be presented in section 4 of the dissertation.
Machinery, having much less volume than real estate, comes in second place, also having
decreasing trend from 2006 until 2011, with a small increase in 2008. Professional and
private vehicles have almost the same amounts in 2005 while after 2006 there is an increase
in the professional vehicles lease followed by a decrease after 2008 in contrary to private
vehicles lease that has a decreasing trend since 2006. The percentages of equipment and
other types of leasing are not very widespread in Greece, since they are presenting the
lowest figures since 2005 with a small increase in 2008 that is followed by a decrease until
2011.
0,00
200000,00
400000,00
600000,00
800000,00
1000000,00
1200000,00
1400000,00
1600000,00
1800000,00
2000000,00
2004,00 2005,00 2006,00 2007,00 2008,00 2009,00 2010,00 2011,00
real etsate
equipment
proffesionalvehicles
private vehicles
others
machinery

Leasing as an alternative source of financing
26 Mavrogiannidou Maria
Image 2 Leasing in different types of professional activity
From the graphical presentation in table 6, it is clear that leasing has the highest penetration
in services with an upward trend from 2005 until 2007 followed by a reducing trend until
2009 when it seems to have stable preference until 2010 when it begins to decrease in a
dramatic percentage. The penetration of leasing in commerce has steadily high percentages
from 2005 to 2006 having a small down curve in 2007. In 2008 there is a great increase in
usage of leasing in commerce which is followed by a decrease up until 2011. In industry the
percentages of penetration of leasing begun to rise from 2005 until 2006, that presented the
highest percentage, following a decrease that continued until 2011. In all the other activities
leasing started to gain grain from 2005 reaching its peak in 2007, outreaching the
percentages of leasing in commerce and industry, from 2007 until 2011, leasing in other
activities has a downward trend until 2011 that reaches almost the same levels as industry.
As we can observe from the graph the percentages of leasing in all types of professional
activity, have extreme deterioration in 2011.
0
200000
400000
600000
800000
1000000
1200000
2004 2005 2006 2007 2008 2009 2010 2011 2012
industry
commerce
services
other activities

Leasing as an alternative source of financing
27 Mavrogiannidou Maria
Image 3 Leasing penetration depending on the duration of the contract
As it is observed in table 7, the most popular duration for leasing contracts in Greece, is the
one that exceeds ten years. From the year 2005 until 2006 the contracts of leasing that
exceeded ten years had an increase that was followed by a steady preference until 2007,
after when the percentages begun to decrease. Second in the preferences as the timeline is
concerned is leasing contracts that have a four to five years durance, that present a small
increase in 2006 that is followed by a small decrease in 2007 and a significant increase in
2008 from where we observe a decreasing trend until 2011. The leasing duration of zero to
three years and six to nine years, come last at the preferences of the lessors, having almost
the same figures from 2008 and after, while from 2005 to 2007 the zero to three year
contracts have higher ranking. As we can observe in leasing penetration based on the
duration of the contract, in 2011 all durations present the smallest amounts.
0
200000
400000
600000
800000
1000000
1200000
1400000
1600000
1800000
2004 2005 2006 2007 2008 2009 2010 2011 2012
0-3years
4-5 years
6-9 years
10 < years

Leasing as an alternative source of financing
28 Mavrogiannidou Maria
Image 4 leasing penetration according to geographical region
As it is obvious from the graphical presentation in table 8, the highest percentages in leasing
are allocated in Attica, having an upward trend from 2005 to 2007 followed by a steep
decrease until 2011. The other entire geographical regions in Greece present low
percentages in leasing as a financing mean. South Greece and rest of the Greece present
almost the same percentages that follow a decreasing course from 2005 to 2011, while
Central Greece having the lowest percentages also following a decreasing trend from 2005
to 2011. As in the previous graphs, we observe that in year 2011 the amounts of leasing
geographically present their lowest in 2011.
0
500000
1000000
1500000
2000000
2500000
2004 2005 2006 2007 2008 2009 2010 2011 2012
Attiki
south Greece
Central Greece
rest of Greece
Leasing as an alternative source of financing
29 Mavrogiannidou Maria
4. Methodology
As contemplating on other papers mentioned above, we believe that there is a linear
relation between some factors such as profitability, growth rate, profit volatility etc.,
and the total leasing activity. The data we were able to collect were the percentages of
leasing for each type of equipment for every year. We will work with the data available
in order to find if there is any connection in how the total economic condition has
affected the leasing penetration throughout the years examined.
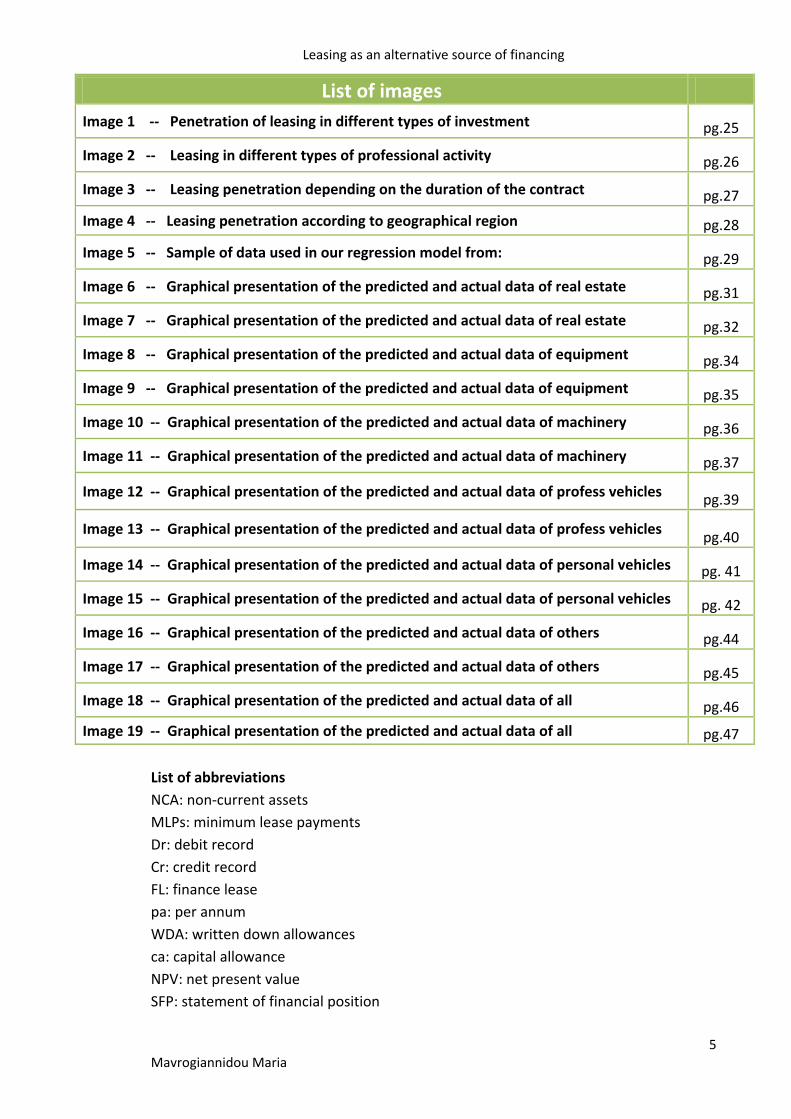
The data that you have available and were provided to us from Bank of Cyprus for
years 2005 to 2011 and the association of Greek Leasing companies (AGLC) for the
same period, and represent the percentages of leasing activity of each bank
categorized by equipment type, business activity, contract period and geographical
region. With the data available, we decided to conduct a linear regression to prove
that there is linear relation between the amounts of economic activity concerning
leasing penetration in Greece.
Image 5 Sample of data used in our regression model from:
http://www.aglc.gr/images/stories/publish/statistics/STATISTICS_%202011.pdf

Leasing as an alternative source of financing
30 Mavrogiannidou Maria
We imported data into excel spreadsheets so as to provide an analysis of the derived
data set. More specifically our analysis included a linear regression, the novelty of the
thesis, to the best of our knowledge, is that there is no other work having applied
linear regression on Greek leasing activity provided by Greek banks for the years
before and after the crisis. Our inspiration is that, although Greek economy is
struggling in an unstable and uncertain economic environment, we will be able to
provide banking sector with a tool that predicts the future needs for leasing in the
different fields of use, in order for them to be prepared for the market needs. Linear
models are based on the relation y=ax + b, where y is the predicted values and x are
the independent variables, b is the steady term which shows the starting point of the
graphical presentation and is directly connected to the magnitude of each model. For
example we expected the b coefficient for real estate leasing to be greater than the b
term of machinery leasing because the money spent for real estate leasing is greater
than the money spent for machinery leasing. The a term is the coefficient of the
independent variable and shows the rate that the data increase or decrease. Indicator
of the quality of the fit of the regression is the residuals for every predicted value. We
can also examine the quality of the regression from the plots of predicted and real
values. The linear regression is better when the examined data present none or very
small curve.
4.1 Numerical analysis and linear regression tests
We performed a series of linear regressions on the data received from the association of
Greek leasing companies and the Bank of Cyprus leasing department, from 2005 to 2011 in
order to see if we could find any linear mathematical model. Our purpose was to examine if
we could predict the future behavior for companies that use leasing. We conducted the tests
in six different categories obtained from the association above, using linear regression. From
our primary results we saw that all the regressions from 2005 had a pick around 2007-2008
and after that presented an almost linear decrease. This behavior prompts us to conduct a
new regression starting from 2007 up to 2011. Indeed those results show remarkable fit.

Leasing as an alternative source of financing
31 Mavrogiannidou Maria
4.1.1. Penetration of leasing in real estate 2005 to 2011
The results from the regression as listed in table 9 indicate that the linear regression
model we used cannot fit satisfactory the real data. From the table below we observe
that the residuals for the predicted values are not so small indicating that we cannot
use this model to predict the behavior of real estate in future years.
Table 5 Values from linear regression of real estate
Observation(year) Predicted Y Residuals
1 (2005) 1705407,143 -516353,1429
2 (2006) 1512523,286 167238,7143
3 (2007) 1319639,429 335862,5714
4 (2008) 1126755,571 236181,4286
5 (2009) 933871,7143 104231,2857
6 (2010) 740987,8571 1468,142857
7 (2011) 548104 -328629
Image 6 Graphical presentation of the predicted and actual data of real estate
We observe from the plot of real data that the cause of the inadequate fitting of the
data is due to the impact of the economic crisis that took place during the period of
0,00
200000,00
400000,00
600000,00
800000,00
1000000,00
1200000,00
1400000,00
1600000,00
1800000,00
2004 2005 2006 2007 2008 2009 2010 2011 2012
Y
X Variable 1
Y
Predicted Y

Leasing as an alternative source of financing
32 Mavrogiannidou Maria
the collected sample. As we can observe from the curve of the plot the starting point
of the crisis was after 2007, which is the highest point of our plot meaning that until
then the economy had been in growth.
As we believe that the cause of the inadequate fitting is the presence of the crisis
during the collection of data, we conducted the same tests from the starting point of
the crisis until 2011 to see if we could describe the evolution with a linear model.
4.1.2. Penetration of leasing in real estate 2007 to 2011
The results from the regression as listed in table10 indicate that the linear model
achieves an almost perfect fit for the years 2007 up 2011.
Table 6 Values from linear regression of real estate
Observation(year) Predicted Y Residuals
1 (2007) 1702201,6 -46699,6
2 (2008) 1352948,1 9988,9
3 (2009) 1003694,6 34408,4
4 (2010) 654441,1 88014,9
5 (2011) 305187,6 -85712,6
Image 7 Graphical presentation of the predicted and actual data of real estate
0,00
200000,00
400000,00
600000,00
800000,00
1000000,00
1200000,00
1400000,00
1600000,00
1800000,00
2005 2006 2007 2008 2009 2010 2011
Y
Y
Predicted Y

Leasing as an alternative source of financing
33 Mavrogiannidou Maria
We observe from the plot of the lines of the predicted and the actual data almost
coincide. This means that we have an almost linear relation of the economic activity of
real estate market that uses leasing from 2007 to 2011. Based on those results we can
predict the 2012 activity from the exported model which is
For year 2012, based on the model above we predict that leasing in real estate will be
almost zero (the model predicts negative number which is impossible, because there
will be some active contracts that will be in use for future years. This means that our
model needs to be refined with more variables, cause of lack of any further data we
are not able to improve it).
4.2.1. Penetration of leasing in equipment from 2005 to 2011
As we can observe from the results of the regression that are listed in table 11, we
reach the conclusion that the linear regression we have used does not adapt the real
data in a satisfactory level. The prices of the residuals that are listed in the third
column of the table are quite large, indicating that the model cannot be used in order
to predict the behavior of leasing in equipment in future years.
Table 7 Values from linear regression of equipment
Observation(year) Predicted Y Residuals
1 (2005) 116158,1429 -16985,14286
2 (2006) 105318,7143 -6237,714286
3 (2007) 94479,28571 13763,71429
4 (2008) 83639,85714 35648,14286
5 (2009) 72800,42857 -8141,428571
6 (2010) 61961 -12617
7 (2011) 51121,57143 -5430,571429
y= 702653976, 1 -349253, 5*x
y=the predicted value of real estate leasing
x=the forthcoming years

Leasing as an alternative source of financing
34 Mavrogiannidou Maria
Image 8 Graphical presentation of the predicted and actual data of equipment
Observing the plot of real data above, we understand that the cause of inadequate fit
of data is a result of the impact that the economic crisis has on the selected data. As
we can observe from the curve in the plot above, the highest point is located in 2008
that is the starting point of the economic crisis.
In order to prove our theory that the cause of the inadequate fit of data is a result of
the impact of crisis on the collected sample of data, we conduct the same test for the
that the crisis begun to appear until 2011, to show if we can describe the future
penetration of leasing in equipment with a linear model.
4.2.2. Penetration of leasing in equipment from 2007 to 2011.
Observing the values of the residuals listed in table 12, we can see that the model has
a very good fit to the data for the years 2007 to 2011.
Table 8 values from linear regression of equipment
Observation (year) Predicted Y Residuals
1 (2007) 116454,6 -8211,6
2 (2008) 96949,8 22338,2
3 (2009) 77445 -12786
4 (2010) 57940,2 -8596,2
5 (2011) 38435,4 7255,6
0,00
20000,00
40000,00
60000,00
80000,00
100000,00
120000,00
140000,00
2004 2005 2006 2007 2008 2009 2010 2011 2012
Y Y
Predicted Y

Leasing as an alternative source of financing
35 Mavrogiannidou Maria
Image 9 Graphical presentation of the predicted and actual data of equipment
As we can see from the plot lines above, the predicted and actual data almost coincide,
indicating that there is an almost linear relation in the economic activity of the use of
lease in equipment from 2007 to 2011. Based on these results we can predict the
penetration of leasing in equipment in 2012 based on the exported model which is
For year 2012, based on the model above we predict that leasing in equipment will be
18930, 6 million euros.
4.3.1. Penetration of leasing in machinery 2005 to 2011.
Observing the results of the regression as listed in table 13, we conclude that the linear
regression model that we have used does not fit the real data in an adequate way. As
we can see the values of the residuals for the predicted values are not so small
0,00
20000,00
40000,00
60000,00
80000,00
100000,00
120000,00
140000,00
2006 2007 2008 2009 2010 2011 2012
Y Y
Predicted Y
y= 39262588, 2-19504, 8*x
y=the predicted value of equipment leasing
x=the forthcoming years

Leasing as an alternative source of financing
36 Mavrogiannidou Maria
indicating that the model we have used cannot predict the future penetration behavior
of leasing in machinery.
Table 9 Values from linear regression of machinery
Observation(year) Predicted Y Residuals
1 (2005) 538513,6429 -117903,6429
2 (2006) 476328,4286 32078,57143
3 (2007) 414143,2143 38852,78571
4 (2008) 351958 132909
5 (2009) 289772,7857 17806,21429
6 (2010) 227587,5714 -42721,57143
7 (2011) 165402,3571 -61021,35714
Image 10 Graphical presentation of the predicted and actual data of machinery
As we can observe from the plot of real data, the inadaptability of the regression we
have used is a result of the impact of the economic crisis that occurred during the
selection of the examined data. Interpreting the curve of the plot we can understand
that the highest point is located in 2008 that is when economic crisis begun to have
impact on the economy.
0,00
100000,00
200000,00
300000,00
400000,00
500000,00
600000,00
2004 2005 2006 2007 2008 2009 2010 2011 2012
Y Y
Predicted Y

Leasing as an alternative source of financing
37 Mavrogiannidou Maria
In an attempt to prove that the model is affected by the presence of the crisis, we
conduct the same tests for the period 2007 to 2011.
4.3.2. Penetration of leasing in machinery from 2007 to 2011.
Observing the values of the residuals listed in table 14, we can see that the model has
an almost perfect fit to the data for the years 2007 to 2011.
Table 10 values from linear regression of machinery
Observation(year) Predicted Y Residuals
1 (2007) 506384 -53388
2 (2008) 406660,9 78206,1
3 (2009) 306937,8 641,2
4 (2010) 207214,7 -22348,7
5 (2011) 107491,6 -3110,6
Image 11 Graphical presentation of the predicted and actual data of machinery
Considering that the plot lines above showing that the actual and the predicted data
almost coincide, we can conclude that there is almost a linear relation in the use of
machinery lease in the examined period of 2007 to 2011.
0,00
100000,00
200000,00
300000,00
400000,00
500000,00
600000,00
2006 2007 2008 2009 2010 2011
Y Y
Predicted Y

Leasing as an alternative source of financing
38 Mavrogiannidou Maria
Based on these results we can predict the penetration of leasing in machinery in 2012
based on the exported model which is
Based on the model above we expect the machinery leasing for year 2012 to be 7768,
5 million euros.
4.4.1. Leasing penetration in professional vehicles from 2005 to 2011.
As we can observe from the results of the regression that are shown in the table below,
we observe that the linear regression model that we have used does not fit the data
satisfactory. The values from the residuals for the predicted values are quite high
indicating that the model we have used cannot predict the future penetration of
leasing in professional vehicles.
Table 11 values from linear regression of professional vehicles
Observation(year) Predicted Y Residuals
1 (2005) 318807,9286 -66422,92857
2 (2006) 277196 -13102
3 (2007) 235584,0714 71916,92857
4 (2008) 193972,1429 81199,85714
5 (2009) 152360,2143 -21103,21429
6 (2010) 110748,2857 -25013,28571
7 (2011) 69136,35714 -27475,35714
y= 200650645, 7-99723, 1*x
y=the predicted value of machinery leasing
x=the forthcoming years

Leasing as an alternative source of financing
39 Mavrogiannidou Maria
Image 12 Graphical presentation of predicted and actual data of professional vehicles
From the plot of real data above, we can observe that the inadequate fit of the data to
our regression is a result of the impact of the economic crisis that occurred during the
years of the data collection. As we can see from the plot curve, we understand that the
highest point is in 2008, which is the launch of the economic crisis.
In order to demonstrate the effect of the economic crisis to the fit of the model that
we use, we conduct the same tests for the period from 2007 to 2011.
4.4.2. Penetration of leasing in professional vehicles from 2007 to 2011.
As we can see from the residual values listed in the table below, we conclude that the
model used has an almost perfect fit for the data concerning the period 2007 to 2011.
Table 12 Values from linear regression model of professional vehicles.
Observation(year) Predicted Y Residuals
1 (2007) 312488,6 -4987,6
2 (2008) 240376,9 34795,1
3 (2009) 168265,2 -37008,2
4 (2010) 96153,5 -10418,5
5 (2011) 24041,8 17619,2
0,00
50000,00
100000,00
150000,00
200000,00
250000,00
300000,00
350000,00
2004 2005 2006 2007 2008 2009 2010 2011 2012
Y Y
Predicted Y

Leasing as an alternative source of financing
40 Mavrogiannidou Maria
Image 13 Graphical presentation of predicted and actual data of professional vehicles
As we can see from the plot lines above the actual and predicted data almost coincide
indicating that there is almost a linear relationship in the use of leasing in professional
vehicles during the period 2007 to 2011.Based on these results we can predict the
penetration of leasing in professional vehicles in 2012 based on the exported model
which is
Based on the model above leasing penetration in 2012 is expected to be close to zero
(the model predicts negative number which is impossible since even if the reduction is
vast, there will be still active contracts from previous years. This means that our model
needs to be refined with more variables, cause of lack of any further data we are not
able to improve it).
0,00
50000,00
100000,00
150000,00
200000,00
250000,00
300000,00
350000,00
2006 2007 2008 2009 2010 2011
Y Y
Predicted Y
y= 145040670, 5-72111, 7*x
y=the predicted value of professional vehicles
x=the forthcoming years

Leasing as an alternative source of financing
41 Mavrogiannidou Maria
4.5.1. Leasing penetration in personal vehicles from 2005 to 2011
Observing the data listed in the table presented below, we can understand that the
linear regression model that we applied does not fit the data accurately enough. We
notice that the residual values have high prices, indicating that model is not able to
predict the future penetration of leasing in personal vehicles accurately.
Table 13Values from linear regression model for personal vehicles
Observation(year) Predicted Y Residuals
1 (2005) 295039,2857 -20065,28571
2 (2006) 248953,1429 13668,85714
3 (2007) 202867 15725
4 (2008) 156780,8571 10479,14286
5 (2009) 110694,7143 -14224,71429
6 (2010) 64608,57143 -13840,57143
7 (2011) 18522,42857 8257,571429
Image 14 Graphical presentation of predicted and actual data for personal vehicles
As we can see from the plot of actual and predicted data almost coincide, showing that
the economic crisis den not have a major impact on the fit of the data to our
regression. However in order to examine if the fit of the model can be further
0,00
50000,00
100000,00
150000,00
200000,00
250000,00
300000,00
350000,00
2004 2005 2006 2007 2008 2009 2010 2011 2012
Y Y
Predicted Y

Leasing as an alternative source of financing
42 Mavrogiannidou Maria
improved and if the effect of the economic crisis on the penetration of leasing in
personal vehicle we conduct the same tests for the period 2007 to 2011.
4.5.2. Leasing penetration in personal vehicle from 2007 to 2011.
As we can conclude from the values of the residuals listed in the table below, the
linear regression has an almost perfect fit for the period 2007 to 2011.
Table 14 Values from linear regression model for personal vehicles
Observation(year) Predicted Y Residuals
1 (2007) 211997,2 6594,8
2 (2008) 161985,6 5274,4
3 (2009) 111974 -15504
4 (2010) 61962,4 -11194,4
5 (2011) 11950,8 14829,2
Image 15 Graphical presentation of predicted and actual data for personal vehicles
The plot lines of actual and real data that are shown above coincide indicating that
there is a linear relationship in the use of leasing in personal vehicles during the period
2007 to 2011. Based on the results above we are able to predict the leasing
penetration of personal vehicles for 2012 using the following exported model
0,00
50000,00
100000,00
150000,00
200000,00
250000,00
2006 2007 2008 2009 2010 2011 2012
Y
Y
Predicted Y

Leasing as an alternative source of financing
43 Mavrogiannidou Maria
Based on the model above, the leasing penetration in personal vehicles for 2012 will
be close to zero (the model predicts negative number, which is not possible, indicating
that the model must be refined with more variables, cause of lack of further data we
are not able to improve it).
3.6.1. Leasing penetration in other types of equipment leasing from 2005 to 2011.
As we can observe from the results of the regression as presented in the table below
the linear regression we have used does not fit the real data in a satisfactory way. The
residual values present quite high values indicating that the specific model cannot be
used for the prediction of penetration of leasing in the other types of equipment in
future years.
Table 15 Values from linear regression of leasing in other types.
Observation(year) Predicted Y Residuals
1 (2005) 121415,1429 -32426,14286
2 (2006) 113037,4286 -13249,42857
3 (2007) 104659,7143 21440,28571
4 (2008) 96282 58975
5 (2009) 87904,28571 928,7142857
6 (2010) 79526,57143 -3739,571429
7 (2011) 71148,85714 -31928,85714
y= 100585278, 4-50011, 6
y=the predicted value of personal vehicles
x=the forthcoming years

Leasing as an alternative source of financing
44 Mavrogiannidou Maria
Image 16 Graphical presentation of predicted and actual data for the other types of
equipment
From the plot of real data we can observe that the cause of the inadequate fitting is
the impact of the economic crisis that took place during the examined period. As we
can see the curve of the plot reaches its highest point in 2008, which is the launch of
the economic crisis in Greece.
In order to prove the theory that the cause of the inadequate fit of our model is the
presence of the economic crisis, we conducted the same tests from the starting point
of crisis until 2011, to see if we could describe future penetration of leasing in other
equipment using a linear regression model.
3.6.2. Leasing penetration in other types of equipment from 2007 to 2011.
As we can see from the results of the regression that are listed in the table presented
below, the linear model that we have used achieves an almost perfect fit for the
examined period
0,00
20000,00
40000,00
60000,00
80000,00
100000,00
120000,00
140000,00
160000,00
180000,00
2004 2005 2006 2007 2008 2009 2010 2011 2012
Y Y
Predicted Y

Leasing as an alternative source of financing
45 Mavrogiannidou Maria
.
Table 16 Values from linear regression of other types of equipment
Observation(year) Predicted Y Residuals
1 (2007) 147685,4 -21585,4
2 (2008) 122362,4 32894,6
3 (2009) 97039,4 -8206,4
4 (2010) 71716,4 4070,6
5(2011) 46393,4 -7173,4
Image 17 Graphical presentation of the predicted and actual data of other types of
equipment
Observing the plot lines of the predicted and actual data we can see that they almost
coincide, meaning that there is an almost linear relation of the economic activity of the
other equipment lease from 2007 to 2011. Based on the results above we can predict
the 2012 leasing penetration in the other types of leasing from the exported model
which is
0,00
20000,00
40000,00
60000,00
80000,00
100000,00
120000,00
140000,00
160000,00
180000,00
2006 2007 2008 2009 2010 2011 2012
Y Y
Predicted Y
y= 50970946, 4-25323*x
y=the predicted value of other equipment leasing
x=the forthcoming years

Leasing as an alternative source of financing
46 Mavrogiannidou Maria
Based on the model above, we can estimate that the leasing penetration for 2012 will
be 21070, 4 million euros.
4.7.1. Leasing penetration in all types of equipment from 2005 to 2011.
Observing the results of the regression listed in the table below, we can understand
that the linear regression that we have used does not fit the data in a satisfactory level.
The values of the residuals are high, indicating that the model we have used cannot
predict the future penetration of leasing in all types of equipment in future years.
Table 17 Values from linear regression of leasing in all types of equipment.
Observation(year) Predicted Y Residuals
1 (2005) 3095341,286 -770156,2857
2 (2006) 2733357 180397
3 (2007) 2371372,714 497561,2857
4 (2008) 2009388,429 555392,5714
5 (2009) 1647404,143 79496,85714
6 (2010) 1285419,857 -96463,85714
7 (2011) 923435,5714 -446227,5714
Image 18 Graphical presentation of predicted and actual data in all types of leasing
0,00
500000,00
1000000,00
1500000,00
2000000,00
2500000,00
3000000,00
3500000,00
2004 2005 2006 2007 2008 2009 2010 2011 2012
Y Y
Predicted Y
Leasing as an alternative source of financing
47 Mavrogiannidou Maria
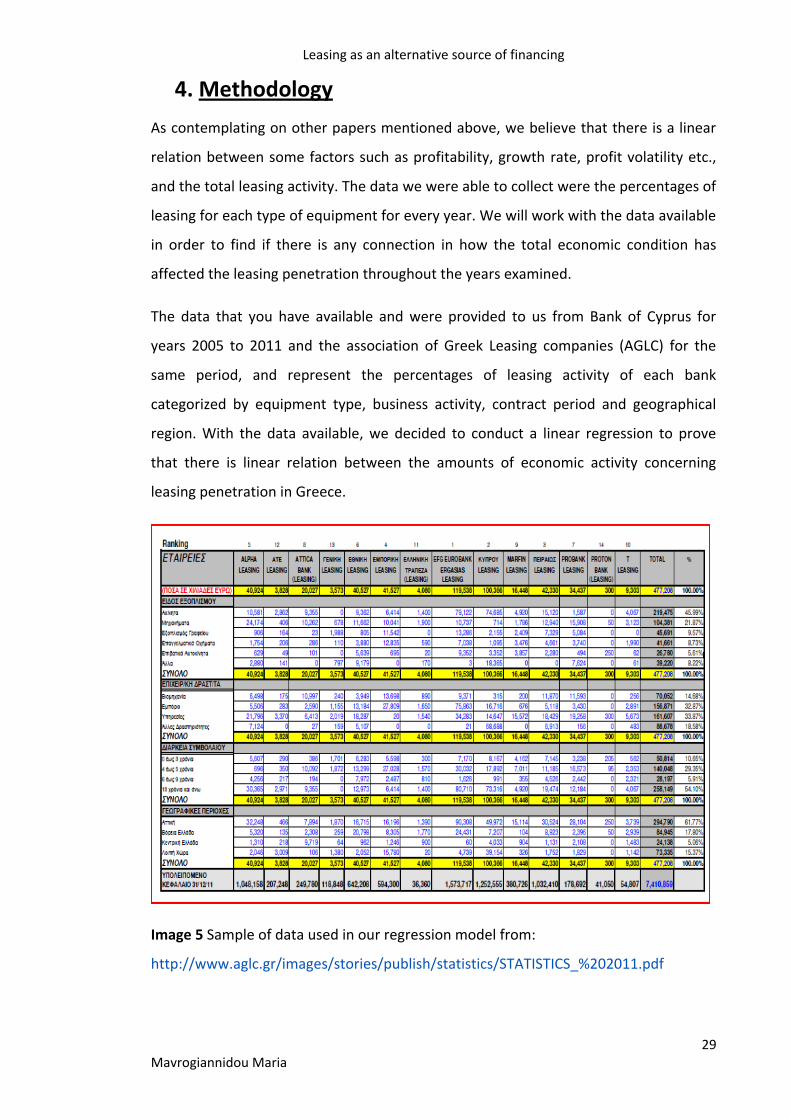
As we can observe from the plot of real data above, the bad fit of the regression is the
effect of the economic crisis to the sample of the collected data. It is obvious from the
curve of the plot that the plot reaches the highest points during 2007 and 2008, which
is the beginning of the economic crisis.
In an attempt to prove that the cause of unsatisfactory fit of the model to our data is
due to the economic crisis, we conduct the same tests from the starting point of crisis
until 2011, in order to check if we could describe future penetration of all types of
leasing using a linear regression model.
4.7.2. Leasing penetration in all types of equipment from 2007 to 2011.
Observing the results of the regression as listed in the table below, the linear
regression model that we have used presents a very good fit to the data.
Table 18Results from linear regression in all types of equipment
Observation(year) Predicted Y Residuals
1(2007) 2997211,4 -128277,4
2(2008) 2381283,7 183497,3
3(2009) 1765356 -38455
4(2010) 1149428,3 39527,7
5(2011) 533500,6 -56292,6
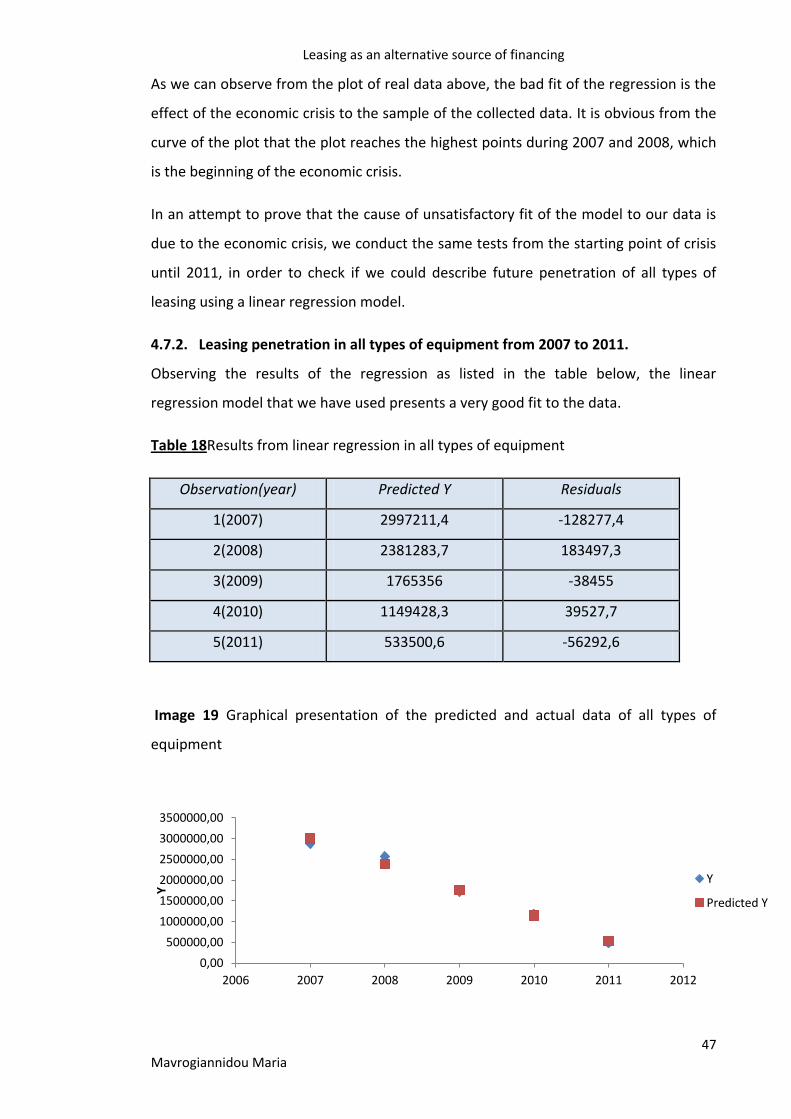
Image 19 Graphical presentation of the predicted and actual data of all types of
equipment
0,00
500000,00
1000000,00
1500000,00
2000000,00
2500000,00
3000000,00
3500000,00
2006 2007 2008 2009 2010 2011 2012
Y Y
Predicted Y

Leasing as an alternative source of financing
48 Mavrogiannidou Maria
As we can observe from the plot lines of predicted and actual data above they coincide,
meaning that there is a linear relation of economic activity of all equipment lease from
2007 to 2011. Therefore we are able to predict the leasing penatration in all
equipment for 2012 based on the following model
Based on the model above, we can estimate that the leasing penetration for 2012 will
be almost zero (the model predicts negative number which is impossible because
contracts that have been issued in previous years will still be active. This means that
our model needs to be refined with more variables, cause of lack of any further data
we are not able to improve it).
4.8. Normalization of the above regressions
In order to have a complete image for the quality of the regression, we thought that
we could normalize all the linear regressions. Consequently, to have a common base,
we selected the regression of equipment for two reasons firstly because it presents the
smallest amount of activity and secondly because it presents satisfying fit between the
actual and predicted data. Our purpose at this point is to compere the magnitude of
the change. We could estimate the change from the graphical presentation of each
individual regression but given the fact that we have different amounts of leasing
activity presented in million euros, we downgrade all the models to the same level as
the equipment regression. From the coefficient b we are able to compare the degree
of decrease of the economic activity concerning leasing. In table 23 we present the
results of the normalization of the regressions, in the left side of the table we present
the normalized regressions and in the right side of the table we indicate which type of
equipment lease the regression refers to. From the exported regressions we can see
y= 1239164105 -615927, 7*x
y=the predicted value of all equipment leasing
x=the forthcoming years

Leasing as an alternative source of financing
49 Mavrogiannidou Maria
that the biggest inclination is observed in private used cars followed by professional
vehicles, totals, real estate office equipment and others respectively. Another
conclusion is that all the type of equipment has almost the same decrease from year to
year. As the independent variable x represents the year and especially the complete
economic activity, our regression uses this as a variable extracting results that can be
used for future prediction as well as an indicator for quality analysis. The total
economic conditions of Greek market effects equally each portion of the leasing sector.
Table 19 Normalized regressions
Regression model – estimated
normalized Type of equipment
y=39262588,2-x*19515,43 real estate
y=39262588,2-x*19504,8
machinery
y=39262588,2-x*19513,45
equipment
y=39262588,2-x*19520,68
proffesional vehicles
y=39262588,2-x*19521,59
private used cars
y=39262588,2-x*19506,14
Others
y=39262588,2-x*19515,51 Totals

Leasing as an alternative source of financing
50 Mavrogiannidou Maria
5. Conclusions
In Greece the entrance of leasing activity took place later on than the rest of the
European community, but the growth rates for the years 2001 to 2008 were even
higher than the rates in Germany and Great Britain. This can be explained by the huge
expand of lease in the real estate sector and the reliefs in transfer taxes that were
provided.
Greece has been suffering for almost three years now, from an economic crisis that
affects every prospect of economic activity. As a result leasing activity has also been
affected. We believe that the decrease of the leasing percentages in the market
reflects equally the total shrunk of Greek economy. In the third chapter of our thesis,
we try to provide the information necessary for an entrepreneur in order for him to
decide if leasing is the appropriate way of financing of his business. In the fourth
chapter of our thesis we examine with the data available from Bank of Cyprus and
from Association of Greek Leasing Companies (AGLC), and with the tools of linear
regression, to see if there is any connection between the total economic activity of the
country for each year and the amount of money concerning leasing sector in the
country. Linear regression is a simple model to predict future behavior of the market.
The preciseness and value of the model itself has a direct connection with the number
of independent variables of the model and the quality characteristics of them.
Our single independent variable, which was the previous years, represents the total
economic activity in leasing sector and we demonstrate that there is good fit using the
data for the years 2007 to 2011, having linear relation with a decreasing trend. The
results we present are decreased as expected and comply with the total economic
conditions in Greece. There are also other tools in order to examine and work with the
available data, such as Markov chains (Barua, Srinivasn. 2011). Another very useful tool
commonly used in this area from leasing companies in order to estimate the risk of
loses for an investment using leasing is the simplex method with tables. These two
methods need data with various quality data. Adding more variables in the model and
refining it for further accuracy could be a future work. We could say that results that
derive from regressions as the one we have used can help banks and financial

Leasing as an alternative source of financing
51 Mavrogiannidou Maria
institutions to better reorganize and structure their leasing departments in order to
keep up with the demands of the market.
We strongly believe that for the year 2012 the leasing market will continue to shrink
down to minimum level as companies will have neither the sufficient funds to continue
the leasing nor the need to expand their activities. This will affect the market with a
decrease of the prices in equipment (including real estate) which will trigger actions
from investors to lease again equipment in new lower prices. Consequently this state
of the market will set the minimum level of leasing activity for every sector. In some
cases, as we saw in machinery leasing, this can be predicted.
Finally we believe that these conditions could be reversed by giving motivation in
entrepreneurs of other sectors of the Greek economy such as ship owners, third party
financing, technology performance financing and energy service companies, the last is
expected to have great growth in the next few years.

Leasing as an alternative source of financing
52 Mavrogiannidou Maria
6. Bibliography
ACCA (2012), Financial Reporting (FR) Kaplan publishing
ACCA (2011), Financial Management (FM) Kaplan publishing
Nigel Carne (2012),White Clark Group, Greece Asset and Auto Finance Country
survey, White Clark Group, available in
http://www.whiteclarkegroup.com/downloads/view/global_leasing_report_2012
Barua Samir K., Srinivasan G.(2011), Application of Markov Chains to
Management of Leasing, Federal Reserve Bank of St. Luis
A. Noulas, G. Genimakis (2011) The determinants of capital structure choice:
Evidence from Greek listed companies, Applied Financial Economics 21,pg.
379–387
An Yan (2006), Leasing and Debt Financing: Substitutes or Complements?
Journal of Financial an Quantitative Analysis, vol. 41, No 3
Josh Leonard, Robert T. O’brien (2012), The Proposed Lease Accounting
Standards, Wharton Real Estate Review
John R.Ezzell, Premal P. Vora (2001), Leasing versus purchasing: direct evidence
on a corporations motivations for leasing and consequences of leasing, The
Quarterly Review of Economics and Finance, Volume 41, issue 1, pg. 33-47
D. Vasiliou, N. Ipirotis (2008), Financial Management (Theory and Practice),
Rosili publishing.
Kontos G. (2007) Accounting of Banks and leasing and factoring companies,
Athens
Spiridakis I.S. (2007) Leasing publishing Ant. N.Sacoula
Chatzipavlou P., Gontica V.,(1982), Theory and practice of leasing, Papazisi
publications
Mitsiopoulos G., (1992), Financial Leasing, a modern form of finance, Sbilias
publishing
Higson, C. (2003). The economic role of asset finance. In C. Boobyer, Leasing
and Asset Finance (pp.11-21). Euromoney Books.

Leasing as an alternative source of financing
53 Mavrogiannidou Maria
Lasaridis G. (2001), New forms of financing, Leasing, factoring, forfaiting,
venture capital, new banking products, issue 1, second edition
Delleen L., Dupleich M., Othieno L., Wakelin O., Berold R.,(2003) Leasing for
small and micro enterprises, a guide for designing and managing leasing
schemes in developing countries
Boobyer C,Barclays asset finance, Leasing and asset finance, fourth edition
websites
http://www.leaseurope.org/
http://www.aglc.gr/index.php?option=com_aicontactsafe&view=message&lay
out=message&pf=1&Itemid=20&lang=en
http://www.whiteclarkegroup.com/downloads/view/global_leasing_report_20
12
http://www.bankofgreece.gr/Pages/el/Supervision/LegalF/debitinstitutions/leasing.as
px