Embed Size (px)
Citation preview

�
Learning with the xos

�
�
Learning with the xosThe impact of the Ceibal Plan
Mery FerrandoAlina MachadoIvone PerazzoAdriana VernengoWith the collaboration of Carmen Haretche
›››››

�
Learning with the XOs: The impact of the Ceibal PlanUnited Nations Children’s Fund, unicef UruguayUniversity of the Republic
This research was carried out with funds from a project submitted to the Sectoral Commission for Scientific Research of the University of the Republic (csic-UdelaR), within the framework of the �008 Call for Research Projects Aimed at Social Inclusion. The project received additional financial support from unicef Uruguay. It would not have been possible without the coordinated and collaborative effort of the Division of Research, Evaluation and Educational Statistics of the National Administration of Public Education.
Chief researcher: Alina MachadoAssociate researchers: Mery Ferrando, Ivone Perazzo, Adriana Vernengo and Carmen Haretche (colla-boration)Field chief: Cecilia ToledoField supervision: Carina ViejoData entry supervision and revision of forms’ consistency: Leonardo CuelloField survey: Julio Álvarez, Cynthia Buffa, María Jimena Castillo, Paola Cazulo, Gonzalo Garat, Alexis Gerschuni, Ana Victoria González, Gabriela Lacurcia, Sebastián Prado, Etelvina Rodríguez, Mariana Te-nenbaum, Victoria Terán, Lil Vera, Cecilia Vide, Andrea WaiterMatching Montevideo and Canelones schools with schools in the interior and selection of control group: Juan José Goyeneche and Guillermo Zoppolo (Institute of Statistics, Faculty of Economics and Administration, UdelaR)Design of questionnaires for children, families and teachers: Mery Ferrando, Alina Machado, Ivone Perazzo and Adriana VernengoDirector’s list and survey manual: Alina Machado
Proofreading in Spanish: Susana Aliano CasalesTranslation in English: Victoria De NegriProofreading in English: Soledad Bervejillo
Editorial Graphic Design: Taller de Comunicación
First edition in Spanish: September �0��First edition in English: October �0��
unicef UruguayBulevar Artigas �659, ��th floorMontevideo, UruguayTel.: (598) �� 0� 0�08Fax: (598) �� 00 69�9E-mail: [email protected]/uruguay/spanish
Reproduction of all or part of the texts published here is authorized provided the source is mentioned and they are not altered nor used for commercial purposes.
5
The authors wish to thank the valuable comments received
from Verónica Amarante, Andrea Vigorito and other research-
ers from the Institute of Economics; Andrés Peri and team
members of the Division of Educational Research, Evaluation
and Statistics (anep); Alejandro Retamoso and other members
of unicef; Juan José Goyeneche y Guillermo Zoppolo (Insti-
tute of Statistics), Guillermo Cruces (cedlas), Martín Pérez,
Ana Laura Martínez and team members of the Ceibal Plan
Educational and Social Monitoring Unit.
Errors or omissions are the sole responsibility of the authors. They
can be contacted at: [email protected], [email protected].
edu.uy or [email protected].

6

�
Abstract This document assess the impact of the Ceibal Plan in school performance of stu-dents who attend public institutions in Uruguay. The effects of the Plan on student motivation and on parent and teacher perception about how the availability of computers affects children’s attitudes to learning and to school life in general are also analyzed. Also, this study analyzes teacher commitment to the Plan.
Although the impact of information and communication technologies on learning has been debated and a unanimous conclusion has not been reached, this research shows that in the geographic areas studied, the Ceibal Plan had a positive impact on student performance in mathematics and no impact on read-ing. These are the results obtained after applying different specifications to the analysis model, when all students in the panel are assessed and when the analysis is limited to sixth grade students. In mathematics, the incremental effect estimated amounts to approximately one fifth standard deviations.
Keywords: impact evaluation, learning, computers, Ceibal Plan.JEL Codes: H�5, I��, I�8.
Resumen En esta investigación se evalúa el impacto del Plan Ceibal en el desempeño escolar de los alumnos de las escuelas públicas del país. Se analiza el efecto del Plan en la motivación de los niños y la percepción de sus padres y maestros sobre cómo la dis-ponibilidad de computadoras afecta la actitud de los alumnos hacia el aprendizaje y la vida escolar en general, y también el compromiso de los maestros con el Plan.
Si bien los efectos de las tecnologías de la información y la comunicación so-bre el aprendizaje han sido debatidos y no se ha arribado a una conclusión un-ánime, en las zonas del país analizadas, se observa que el Plan Ceibal tuvo un impacto positivo en el desempeño de los niños en Matemática y no tuvo impacto en Lectura. Este resultado se verifica luego de aplicar distintas especificaciones en el modelo de análisis: cuando se evalúa a todos los niños del panel y cuando el análisis se restringe a los niños de sexto grado. La estimación del efecto incremen-tal en Matemática es de aproximadamente un quinto desvío estándar.
Palabras clave: evaluación de impacto, aprendizaje, computadoras, Plan Ceibal.Códigos JEL: H�5, I��, I�8.

8

9
Contents
Foreward ��I. Introduction ��II. Justification and programme description ��III. Conceptual framework �6 III.� The concept of learning and main determinants �6 III. � Indicators �9IV. Background �0V. Empirical strategy �� V.� Data sources �� V.� Selecting treatment and control groups �� V.� Assessing the impact of the Ceibal Plan in learning �6VI. Results �9 VI.� Differences between treatment and control prior to intervention �9 VI.� Panel attrition �� VI.� Indicators used as control variables �� VI.� Impact analysis with the student panel �5 VI.5 Impact channels ��VII. Final comments ��VIII. References ��IX. Annexes �� IX.� Annex �: Description of students from schools selected and not selected for the study �� IX.� Annex �: Propensity Score �6 IX.� Annex �: Treatment and control group learning trends �6 IX.� Annex �: Methodologies used for index construction: �8 Multiple Correspondence Analysis and Rasch Model �8

�0

��
Foreward
The right to education not only means that the State should ensure a univer-sal access to education for children and adolescents, but also that all education should be quality education that enables the development of skills and abilities. States take on the responsibility for developing public policies and allocating as many funds as they find possible, so that all children and adolescents can access a quality education and complete all school levels, in order that they can make the most of future opportunities and continue learning throughout their lives.
Nowadays, our societies are facing a particularly complex and new challen-ge: ensuring access to education for all children and adolescents where new information and communication technologies have come to play a crucial role in our societies. In this context, the universalization of the right to education means an equal access to and the development of the ability for a reasoned use of these new technologies which should be ensured by the State through its public policies.
Since early �00� Uruguay has been carrying out the Education Connectivity of Basic Computing for On-Line Learning Project (Ceibal Plan), which represents a good instance of such state efforts. Two have been the main objectives of this project, headed by the Office of the President and executed by the Preschool and Primary Education Council (ceip) and the Uruguay Technology Laboratory (latu). First, to ensure a universal and free access to a computer and an Internet connection for all public primary school students and teachers, to close the «di-gital gap» in the use and knowledge of information and communication tech-nologies. Second, to give children the possibility of developing their abilities, to widen their knowledge and to encourage learning.
After the first computers were distributed in �00�, the Ceibal Plan underwent a rapid expansion and by �009 all public schools in Uruguay were taking part of the project. Later that year, all public school first to sixth graders (around �00,000 children in �,�00 schools) and their teachers (around �8,000) already had an xo. That achieved, one of the challenges now faced by the Ceibal Plan, currently con-solidating as an education and political policy for digital inclusion, is fostering its contribution to learning and to developing school competencies.
Scholars can and should contribute to the evaluation of the impact of such education policies as the Ceibal Plan. Thus, unicef has supported this study by researchers from the Institute of Economics at the School of Economics and Ad-ministration of the University of the Republic. We hope that the findings and conclusions shown prove a useful way of fostering the strengths of the Ceibal Plan that may bring about further progress in the effective protection of the right to education of the Uruguayan children and adolescents.
Egidio Crottiunicef Representative for Uruguay

��

��
I. Introduction
This research was carried out within framework of the �008 Call for Research Projects Aimed at Social Inclusion of the Sectoral Commission for Scientific Re-search of the University of the Republic (csic-UdelaR in Spanish). The project was funded by csic and it received additional support from unicef. The Division of Research, Evaluation and Educational Statistics of the National Administration of Public Education (anep in Spanish) provided valuable technical assistance. Juan José Goyeneche and Guillermo Zoppolo, from the Institute of Statistics of the School of Economics and Administration, UdelaR, selected the control group.
The study assesses the impact of the Ceibal Plan on school performance of public school students. It also analyzes the effects of the Plan on student motiva-tion and on parent and teacher perception about how the availability of com-puters affects children’s attitudes to learning and to school life in general. Two of the main objectives of the Ceibal Plan are thus studied, as expressed in its official website: “To contribute to the improvement of education quality through the integration of technology in the classroom, school and family” and “to develop a culture of collaboration on four lines: student-student, student-teacher, teacher-teacher and student-family-school.”
In light of the numerous studies that have revealed a regressive pattern in Uruguayan access to learning, the impact evaluation of a public policy in the field of education has critical importance. Moreover, several studies have shown that differences in school performance are one of the main variables that account for social exclusion of school-age children.
The input for this assessment is the performance of a panel of students in two learning evaluations conducted in �006 and �009. The first are the results obtained from the Second Regional Comparative and Explanatory Study (serce in Spanish) for Uruguay, carried out in Latin America and the Caribbean in �006. With the support of the Division of Research, Evaluation and Educational Statistics of anep, a reading and mathematics evaluation was carried out in �009 with students who had participated in serce, in the seven Uruguayan departments (local government subdivisions) with the highest exposure to the Ceibal Plan (treatment group) and in Montevideo and Canelones (control group). The fieldwork was conducted in May and June �009: by then, the Plan had been running for between �� and �� months in the seven selected departments, and had not yet been implemented in Monte-video and Canelones. The availability of data for two moments in time enables the use of the double-difference method to assess the Plan and its results.
Although the impact of information and communication technologies on learning has been debated and a unanimous conclusion has not been reached, this research shows that in the areas of the country under study, the Ceibal Plan had a positive impact on student performance in mathematics and no impact on reading. These results are obtained after applying different specifications to the analysis model, when all students in the panel are assessed and when the analysis is limited to 6th grade students. In mathematics, the incremental effect estimated amounts to approximately one fifth standard deviations.

��
II. Justification and programme description
Due to the high levels of repetition in primary school, the significant dispersion in performance shown by the Programme for International Student Assessment (pisa)� and the high dropout rates in lower secondary school, one of the main goals of the Uruguayan public school system is to improve the learning levels (anep, �00�; anep, �005; anep, �00�; undp, �008).
Furthermore, previous studies have shown that differences in school perfor-mance are one of the main variables that account for social exclusion among Uruguayan students. In her analysis of child social exclusion, Machado (�006) shows that the economically, socially and culturally poorest children are the worst performers in learning evaluations, show the highest repetition rates and are the most difficult in group discipline.
The Ceibal Plan (which stands for “Education Connectivity of Basic Comput-ing for Online Learning”) was launched on �8 April �00� by Decree No. ���/00� and entails the distribution of a laptop computer (or xo) to all public school stu-dents and teachers. The Plan takes part in the global One Laptop per Child (olpc) project, launched in �005. Although the olpc has been implemented in many countries, Uruguay is so far the first to execute it on a national scale.
The Plan was deployed in several stages: it was first implemented in �00� in the department of Florida; in �008, it was extended to the rest of the depart-ments of the interior; and in October �009 it went nationwide, with the inclusion of the departments of Montevideo and Canelones (the two departments that form the urban area of the country’s capital).
The Plan has wide objectives, including: the improvement of the quality of education through the integration of technology in the classroom, school and family; fostering equal opportunities by giving a laptop computer to every child and teacher; developing a culture of collaboration on four lines: student-student, student-teacher, teacher-teacher and student-family-school; fostering electronic literacy and critical thinking in the teaching community based on ethical princi-ples�. These goals would be attained through different specific targets, such as the promotion of an integrated use of the laptop as a teaching aid in the classroom and the school; teacher training and updating for the use of the new resources; production of teaching resources with the available technology; and parent in-volvement in backing and promoting a correct and responsible use of the com-puter, for the benefit of the child and the family.
� The oecd Programme for International Student Assessment (pisa) is an internationally standardized assessment that was jointly developed by participating countries and administered to �5-year-olds in schools. pisa assesses how far students near the end of compulsory education have acquired some of the knowledge and skills that are es-sential for full participation in society. Reading, mathematical and scientific literacy are covered not merely in terms of mastery of the school curriculum, but in terms of impor-tant knowledge and skills needed in adult life. Uruguay participates in pisa since �00�.
� www.ceibal.org.uy
�5
The three main pillars of the Plan are:
Equity: democratization of access and use of computers and internet.Learning: new means of learning, both inside and outside the school.Technology: wireless internet connection in schools, public spaces and homes.
Given the wide range of objectives, there are several dimensions that could be analyzed. In this study, we focus on the impact of the Ceibal Plan on student learning particularly in mathematics and reading.
As learning receives different influences, this study analyzes the effects of classroom educational practices (particularly those related to the use of a computer) and the use of computers at home, connecting these findings with school learning. Also, the study presents a deeper knowledge of the role of technology in the creation of externalities, both within the family and the class-room. Accordingly, the study enables the analysis of two of the main objectives of the Ceibal Plan: improvement of the quality of education through the inte-gration of technology in the classroom, school and family, and development of a culture of collaboration on four lines: student-student, student-teacher, teacher-teacher and student-family-school.
In order to determine whether the Plan is able to attain these objectives and to give policymakers the information required to increase its impact, it is of the utmost importance that a thorough evaluation of the Ceibal Plan be available in Uruguay. The case is particularly relevant due to the magnitude of the investment vis-à-vis the Uruguayan economy and the scale of the Plan, relatively larger than similar plans in other countries.
This document is organized as follows: Section III presents a brief summary of the conceptual framework and Section IV the main background for this study. In Section V, the empirical strategy is laid out. Main results are presented in Section VI, and final reflections are made in Section VII.
›››
�6
III. Conceptual framework
As was previously mentioned, this study focuses on the impact of the Ceibal Plan on learning of school-age children. Accordingly, this section deals with the con-cept of learning, its main determinants and possible indicators to measure learn-ing. In following sections these conceptual elements will allow to establish the main channels through which the Plan may have affected student learning.
III.1 The concept of learning and main determinants
As there are multiple and various forms of learning, there cannot be one single definition for it. This study will focus on the evaluation of learning acquired in the formal education system. From this starting point, the next step is to determine which are the main determinants of this learning, and to identify policies that can potentially improve it. However, factors that contribute to learning are not easily identified, as they are abundant and interact in complex ways with each other, which can result in unexpected outcomes.
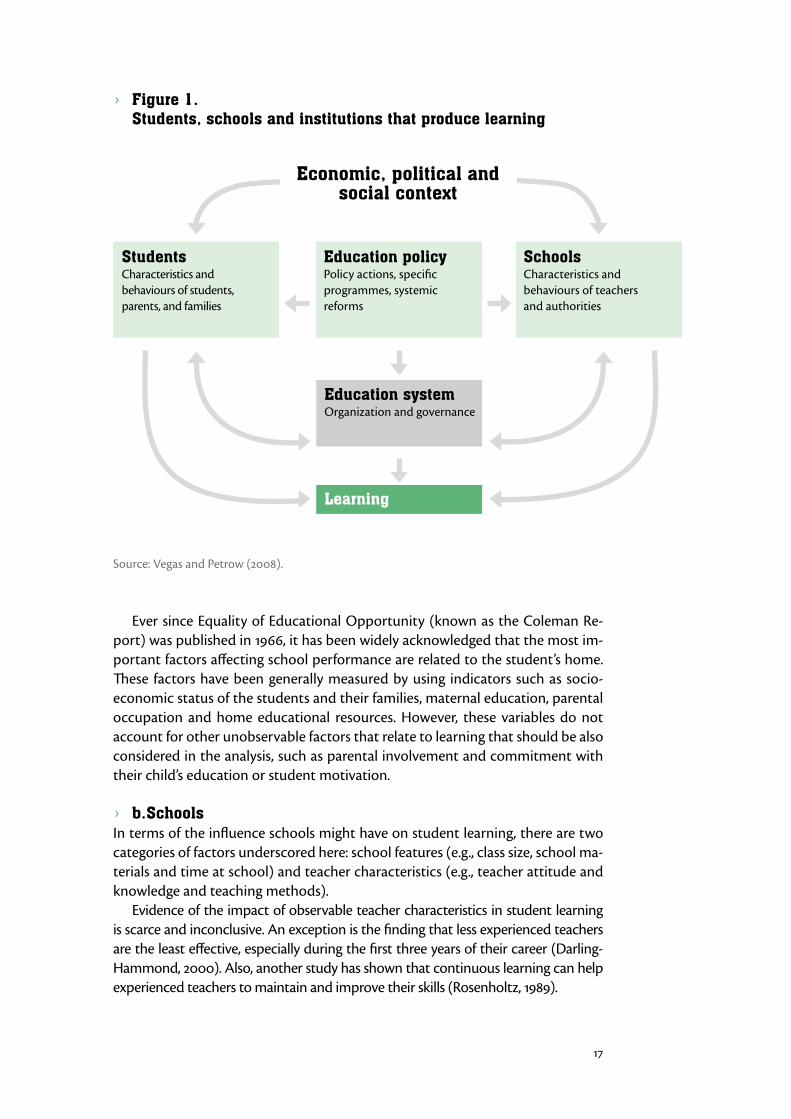
For the analysis of learning determinants this study will adopt the conceptual framework proposed by Vegas and Petrow (�008), whereby learning is the result of the interaction of factors related to the students and their families, to schools and the educational system.
In Figure � a distinction is introduced between the processes that have a bear-ing on learning, actors and institutions that take part in learning and policies that affect it. Students (with their particular characteristics and behaviours) interact with schools (also with their own characteristics and behaviours) in a context where systemic factors also affect how and what students learn.
The different elements that take part in the learning process are now discussed in more detail.
› a. StudentsSeveral studies have shown the importance of factors pertaining to the student in explaining most of the variations in educational performance. Many of these factors derive from characteristics of each child, but many others are more flex-ible and relate to their parents’ actions and decisions.
��
› Figure 1. Students, schools and institutions that produce learning
StudentsCharacteristics and behaviours of students, parents, and families
Education policyPolicy actions, specific programmes, systemic reforms
SchoolsCharacteristics and behaviours of teachers and authorities
Education systemOrganization and governance
Learning
Economic, political and social context
Source: Vegas and Petrow (�008).
Ever since Equality of Educational Opportunity (known as the Coleman Re-port) was published in �966, it has been widely acknowledged that the most im-portant factors affecting school performance are related to the student’s home. These factors have been generally measured by using indicators such as socio-economic status of the students and their families, maternal education, parental occupation and home educational resources. However, these variables do not account for other unobservable factors that relate to learning that should be also considered in the analysis, such as parental involvement and commitment with their child’s education or student motivation.
› b. SchoolsIn terms of the influence schools might have on student learning, there are two categories of factors underscored here: school features (e.g., class size, school ma-terials and time at school) and teacher characteristics (e.g., teacher attitude and knowledge and teaching methods).
Evidence of the impact of observable teacher characteristics in student learning is scarce and inconclusive. An exception is the finding that less experienced teachers are the least effective, especially during the first three years of their career (Darling-Hammond, �000). Also, another study has shown that continuous learning can help experienced teachers to maintain and improve their skills (Rosenholtz, �989).
�8
In Uruguay, evidence suggests that the teacher allocation system� may con-tribute to drive less experienced teachers to the least attractive schools, as more experienced teachers choose schools with better working environment, more resources and students with higher socioeconomic status (Urquiola and Cerdán-Infantes, cited in Vegas and Petrow, �008). This could well introduce a differential factor in the quality of education provided by schools, depending on their socio-economic context.
› c. Education policyBy influencing actors that take part in the teaching-learning process, education policies can have an effect on learning. Particularly, evidence shows that those ac-tions that affect students’ access to school, such as food programmes or promo-tion of preschool education, are effective policies for performance improvement and reduction of repetition rates (Vegas and Petrow, �008).
Moreover, policies can also affect administrative and organizational aspects of the education system. Student learning can be affected by decisions made regard-ing funding, investment, hiring and teacher career paths, teaching methods and curricula (anep, �00�).
The effects of educational policies on learning are supported by extensive em-pirical evidence. Some examples include preschool education, full-time schools, and funding of new and more teacher incentives and training (Vegas and Petrow, �008).
› d. Economic, social and political contextFinally, the economic, social and political context is the background of the inter-action between these factors. Particularly, the serce First Report (unesco-llece, �008) shows a positive (albeit not perfect) correlation between per capita gdp and average student performance, and a negative correlation with the Gini coef-ficient.
In sum, learning is the outcome of the interaction between different actors, students, teachers and schools, who are in turn affected by institutional and orga-nizational factors, by educational policies and by the economic, social and politi-cal context.
III. 2 Indicators
Educational indicators enable data comparisons and assessment of educational context, teaching performance and results. Authors identify four types of indi-cators according to their corresponding dimensions: input, access, output and outcome.
Input indicators measure the means or resources used to satisfy educational needs. Access indicators describe the characteristics of potential users of educa-tional services and show the accessibility of these services. The last two indicators measure the impact of a set of education policies: an improvement of these in-
� In Uruguay, teachers receive a score based on the evaluation of school inspectors and their years of service. Every two years teachers submit a list of schools in order of prefer-ence, and they are allocated to them according to their score.
�9
dicators account for the success of policies and projects, and for this reason they are associated with the objectives.
The difference between output and outcome indicators is related to the type of objectives, which could be either mediate or immediate. Outcome indicators measure long-term objectives (transcendent objectives) such as improving pro-ductivity, improving health, increasing people’s income. These are outcome in-dicators because they go beyond the visible effects of the activity carried out. Among the most common indicators are gdp, unemployment rate and access to opportunities (Morduchowicz, �006).
Immediate objectives are measured through output indicators that show changes in user access, use or satisfaction. The most common include enrolment, dropout and repetition rates, illiteracy, satisfaction about quality of education and improvement of learning results. Thus, results obtained by standardized learning evaluations are among the main output indicators.
National and international standardized evaluations have proved to be ef-ficient tools to monitor and assess the education system quality, to diagnose strengths and weaknesses, to provide a quantitative measure of certain skills that enables comparisons, and to shed light on alternative public policies.
As a result, standardized tests have become the most broadly used tool to measure student learning achievements. They also have some limitations. First, they can only grasp part of what students learn at school (usually mathematics, language and science), thus excluding other areas of non-academic knowledge. Therefore, these evaluations include a “noise” that must be taken into account, so that these indicators should be supplemented with others (Vegas and Petrow, �008). Second, standardized tests are unable to exclusively show what the situation of a certain school is in a particular moment in time, as results are also influenced by the students’ previous experiences and by external factors (Morduchowicz, �006).

�0
IV. Background
Teachers, politicians, concerned citizens and researchers have always looked to different forms of technology as teaching and learning devices. Several countries have already carried out various programmes to ensure higher student access to computers, both as a device that can be taken home or frequently used at school. Researchers have assessed the effects of these programmes in learning, particu-larly in such subjects as mathematics, language and natural sciences (Angrist and Lavy, �00�; Linden, Banerjee and Duflo, �00�; Gulek and Demirtas, �005; Machin, McNall and Silva, �00�; Linden, �008; Barrow, Markman and Rouse, �009; Bar-rera-Osorio and Linden, �009).
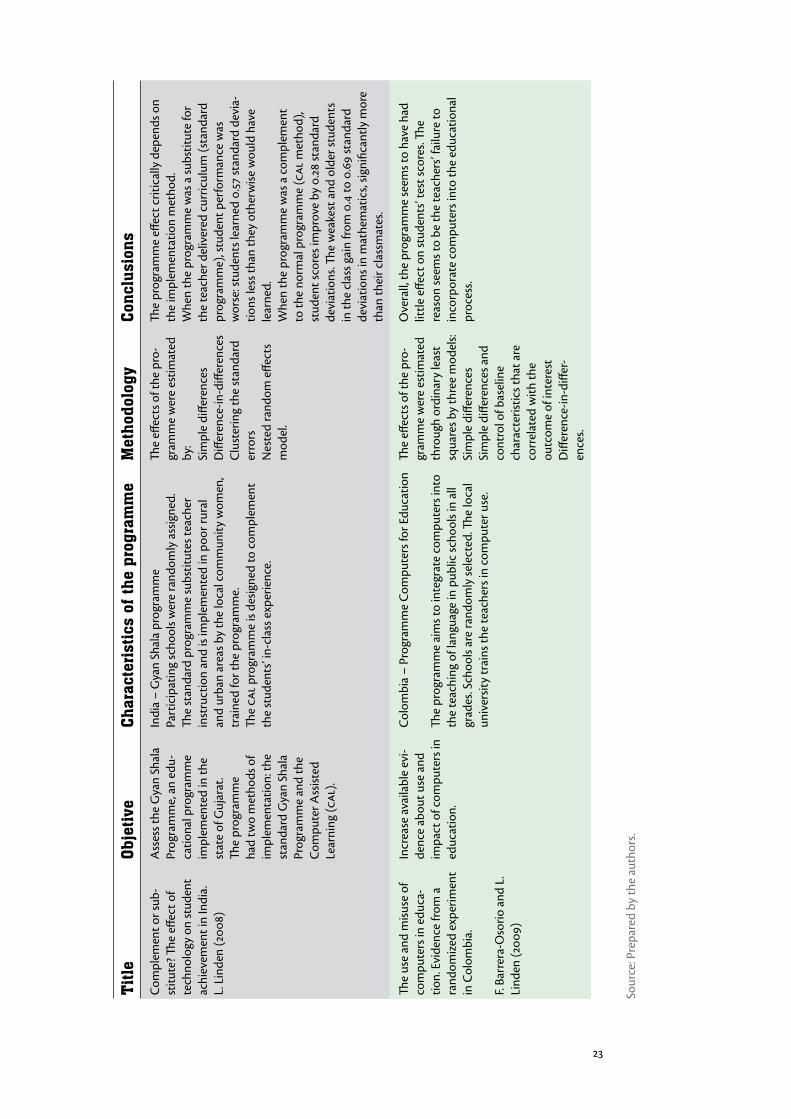
So far, the results of empirical studies on the subject are inconclusive. In part, this is due to the short exposure time of the programmes when subjected to analysis, to the quality of school resources and to the diversity of programmes implemented. Table � presents a synthesis of the main background studies on the subject that analyzed the impact of the inclusion of technology in the teaching-learning process in India, Colombia, Israel, the United States and England.

��
› Ta
ble
1. R
esea
rch
stud
ies
that
ass
ess
the
impa
ct o
f co
mpu
ters
in t
he e
duca
tion
pro
cess
Tit
leOb
jeti
veCh
arac
teri
stic
s of
the
pro
gram
me
Met
hodo
logy
Conc
lusi
ons
New
evi
denc
e on
cla
ss-
room
com
pute
rs a
nd
pupi
l lea
rnin
g.
J. A
ngris
t and
V. L
avy
(�00
�)
Det
erm
ine
the
shor
t-te
rm e
ffect
s of
tech
nolo
gy in
the
teac
hing
-lear
ning
pro
-ce
ss in
Isra
el.
Israe
l – T
omor
row
-98
Prog
ram
me
Com
pute
rizat
ion
of th
e ed
ucat
ion
syst
em a
nd
inte
grat
ion
of te
chno
logy
in th
e cl
assr
oom
. Pr
iorit
y w
as g
iven
to to
wns
with
a h
igh
prop
ortio
n of
�th
and
8th
gra
de e
nrol
men
t.
Estim
atio
n m
etho
ds:
Ord
inar
y le
ast s
quar
es
(OLS
), tw
o-st
age
leas
t sq
uare
s (�S
LS) a
nd
non-
linea
r ins
trum
enta
l va
riabl
es. Th
e va
riabl
e un
der s
tudy
is tr
eatm
ent
inte
nsity
.
The
auth
ors fi
nd e
ffect
s of t
he u
se o
f com
put-
ers i
n pr
imar
y sc
hool
, and
wea
ker e
ffect
s in
seco
ndar
y sc
hool
.A
s an
educ
atio
nal d
evic
e, c
ompu
ters
do
not
impr
ove
lear
ning
(thi
s is m
easu
red
base
d on
th
e sc
ores
obt
aine
d by
stud
ents
in m
ath-
emat
ics a
nd la
ngua
ge te
sts)
.
Lear
ning
With
Te
chno
logy
: The
Impa
ct
of L
apto
p U
se o
n
Stud
ent A
chie
vem
ent.
J. C
. Gul
ek-H
. Dem
irtas
(�
005)
Ass
ess t
he im
pact
of a
la
ptop
imm
ersio
n pr
ogra
mm
e on
st
uden
t per
form
ance
im
plem
ente
d in
�00
� in
Har
vest
Par
k se
cond
-ar
y sc
hool
(Ple
asan
ton,
C
alifo
rnia
).
US
– La
ptop
imm
ersio
n pr
ogra
mm
e St
arte
d in
�00
� with
6th
gra
de st
uden
ts a
nd
cont
inue
d in
subs
eque
nt y
ears
with
�th
and
8th
gr
ade
stud
ents
.A
ll st
uden
ts a
re e
ligib
le, b
ut e
nrol
men
t is
volu
ntar
y. Pa
rent
s buy
the
lapt
ops o
r the
y ap
ply
for a
yea
rly lo
an.
Perf
orm
ance
ana
lysis
of
thre
e st
uden
t coh
orts
ba
sed
on fi
ve p
erfo
r-m
ance
mea
sure
s.D
escr
iptiv
e an
d in
fere
n-tia
l sta
tistic
s and
est
ima-
tion
for p
anel
dat
a.
Stud
ent d
emog
raph
ics a
nd sc
hool
per
for-
man
ce a
re a
naly
zed
for t
he b
ase
year
in th
e tr
eatm
ent a
nd c
ontr
ol g
roup
s.Bo
th th
e in
fere
ntia
l and
the
long
itudi
nal
anal
yses
show
pos
itive
and
sign
ifica
nt e
ffect
s of
the
prog
ram
me
on m
athe
mat
ics a
nd
lang
uage
scor
es.

��
Tit
leOb
jeti
veCh
arac
teri
stic
s of
the
pro
gram
me
Met
hodo
logy
Conc
lusi
ons
New
tech
nolo
gy in
sc
hool
s: Is
ther
e a
payo
ff?
S. M
achi
n, S
. McN
all
and
O. S
ilva
(�00
�)
Ass
ess t
he im
pact
on
scho
ol p
erfo
rman
ce o
f a
gove
rnm
ent c
hang
e in
its i
nves
tmen
t pol
icy
rega
rdin
g fu
ndin
g fo
r in
form
atio
n an
d co
m-
mun
icat
ion
tech
nolo
gy
(ict)
in se
vera
l Eng
lish
scho
ols.
Engl
and
– W
ides
prea
d ap
plic
atio
n of
ict.
The
gove
rnm
ent a
im is
to fu
rnish
scho
ols w
ith
mod
ern
ict,
crea
te a
nat
iona
l fra
mew
ork
with
ed
ucat
ion
info
rmat
ion
and
mat
eria
l, an
d or
gani
ze
trai
ning
pro
gram
mes
for t
each
ers a
nd sc
hool
lib
raria
ns. F
unds
wer
e di
strib
uted
to sc
hool
s th
roug
h th
eir L
ocal
Edu
catio
n A
utho
ritie
s (LE
As)
, ba
sed
on d
iffer
ent a
lloca
tion
guid
elin
es, i
n �9
99-
�000
and
�00
�.
Inst
rum
enta
l var
iabl
es
regr
essio
n m
odel
, use
d to
iden
tify
the
caus
al im
-pa
ct o
f ict
inve
stm
ent
on st
uden
t per
form
ance
.
Posit
ive
impa
ct o
n pr
imar
y sc
hool
per
for-
man
ce in
lang
uage
and
scie
nce,
but
not
for
mat
hem
atic
s.
Tech
nolo
gy’s
edge
: The
educ
atio
nal b
enefi
ts o
f co
mpu
ter-
aide
d in
stru
c-tio
n.L.
Bar
row
, L. M
arkm
an
and
C. R
ouse
(�00
9)
Ana
lyze
the
outc
omes
of
an
inst
ruct
iona
l co
mpu
ter p
rogr
amm
e fo
r pre
-alg
ebra
and
al-
gebr
a in
thre
e di
stric
ts
in th
e U
S.
US
– Co
mpu
ter-
aide
d in
stru
ctio
n pr
ogra
mm
e
Com
pute
r inc
orpo
ratio
n to
pre
-alg
ebra
and
alg
e-br
a te
achi
ng. S
tude
nts w
ere
rand
omly
sele
cted
.
The
effec
ts o
f the
pro
-gr
amm
e w
ere
estim
ated
by
:Si
mpl
e di
ffere
nces
Te
ache
r fixe
d eff
ects
Inst
rum
enta
l var
iabl
es.
Stud
ents
obt
ain
high
er p
re-a
lgeb
ra a
nd a
lge-
bra
scor
es.
Com
pute
r-as
siste
d le
arni
ng: E
vide
nce
from
a
rand
omiz
ed e
xper
i-m
ent.
L. L
inde
n, A
. Ban
erje
e an
d E.
Dufl
o (�
00�)
Ass
ess t
he e
ffect
of
a co
mpu
ter-
aide
d in
stru
ctio
nal p
ro-
gram
me
on la
ngua
ge
and
mat
hem
atic
s in
Indi
a in
its fi
rst y
ear o
f im
plem
enta
tion.
Indi
a –
Com
pute
r-ai
ded
inst
ruct
ion
prog
ram
me
Two
shar
ed h
ours
of c
ompu
ting,
with
mat
hem
at-
ics g
ames
. Ran
dom
ized
sele
ctio
n of
hal
f the
Va
doda
ra sc
hool
s for
�th
gra
de st
uden
ts.
The
effec
ts o
f the
pro
-gr
amm
e w
ere
estim
ated
by
:Si
mpl
e di
ffere
nces
Diff
eren
ce-in
-diff
er-
ence
s.
Sign
ifica
nt p
ositi
ve im
pact
on
mat
hem
atic
s pe
rfor
man
ce, b
oth
with
sim
ple
diffe
renc
es
and
diffe
renc
e-in
-diff
eren
ces.
Aro
und
0.�
stan
dard
dev
iatio
ns.
The
prog
ram
me
effec
t is s
light
ly h
ighe
r at t
he
bott
om o
f the
dist
ribut
ion.
The
prog
ram
me
had
no a
ppar
ent s
pillo
ver o
n la
ngua
ge c
ompe
tenc
ies.
��
Tit
leOb
jeti
veCh
arac
teri
stic
s of
the
pro
gram
me
Met
hodo
logy
Conc
lusi
ons
Com
plem
ent o
r sub
-st
itute
? The
effec
t of
tech
nolo
gy o
n st
uden
t ac
hiev
emen
t in
Indi
a.L.
Lin
den
(�00
8)
Ass
ess t
he G
yan
Shal
a Pr
ogra
mm
e, a
n ed
u-ca
tiona
l pro
gram
me
impl
emen
ted
in th
e st
ate
of G
ujar
at.
The
prog
ram
me
had
two
met
hods
of
impl
emen
tatio
n: th
e st
anda
rd G
yan
Shal
a Pr
ogra
mm
e an
d th
e Co
mpu
ter A
ssist
ed
Lear
ning
(cal
).
Indi
a –
Gya
n Sh
ala
prog
ram
me
Part
icip
atin
g sc
hool
s wer
e ra
ndom
ly a
ssig
ned.
The
stan
dard
pro
gram
me
subs
titut
es te
ache
r in
stru
ctio
n an
d is
impl
emen
ted
in p
oor r
ural
an
d ur
ban
area
s by
the
loca
l com
mun
ity w
omen
, tr
aine
d fo
r the
pro
gram
me.
The
cal
prog
ram
me
is de
signe
d to
com
plem
ent
the
stud
ents
’ in-
clas
s exp
erie
nce.
The
effec
ts o
f the
pro
-gr
amm
e w
ere
estim
ated
by
:Si
mpl
e di
ffere
nces
Diff
eren
ce-in
-diff
eren
ces
Clu
ster
ing
the
stan
dard
er
rors
Nes
ted
rand
om e
ffect
s m
odel
.
The
prog
ram
me
effec
t crit
ical
ly d
epen
ds o
n th
e im
plem
enta
tion
met
hod.
Whe
n th
e pr
ogra
mm
e w
as a
subs
titut
e fo
r th
e te
ache
r del
iver
ed c
urric
ulum
(sta
ndar
d pr
ogra
mm
e), s
tude
nt p
erfo
rman
ce w
as
wor
se: s
tude
nts l
earn
ed 0
.5� st
anda
rd d
evia
-tio
ns le
ss th
an th
ey o
ther
wise
wou
ld h
ave
lear
ned.
Whe
n th
e pr
ogra
mm
e w
as a
com
plem
ent
to th
e no
rmal
pro
gram
me
(cal
met
hod)
, st
uden
t sco
res i
mpr
ove
by 0
.�8
stan
dard
de
viat
ions
. The
wea
kest
and
old
er st
uden
ts
in th
e cl
ass g
ain
from
0.�
to 0
.69
stan
dard
de
viat
ions
in m
athe
mat
ics,
signi
fican
tly m
ore
than
thei
r cla
ssm
ates
.
The
use
and
misu
se o
f co
mpu
ters
in e
duca
-tio
n. E
vide
nce
from
a
rand
omiz
ed e
xper
imen
t in
Col
ombi
a.
F. Ba
rrer
a-O
sorio
and
L.
Lind
en (�
009)
Incr
ease
ava
ilabl
e ev
i-de
nce
abou
t use
and
im
pact
of c
ompu
ters
in
educ
atio
n.
Colo
mbi
a –
Prog
ram
me
Com
pute
rs fo
r Edu
catio
n
The
prog
ram
me
aim
s to
inte
grat
e co
mpu
ters
into
th
e te
achi
ng o
f lan
guag
e in
pub
lic sc
hool
s in
all
grad
es. S
choo
ls ar
e ra
ndom
ly se
lect
ed. Th
e lo
cal
univ
ersit
y tr
ains
the
teac
hers
in c
ompu
ter u
se.
The
effec
ts o
f the
pro
-gr
amm
e w
ere
estim
ated
th
roug
h or
dina
ry le
ast
squa
res b
y th
ree
mod
els:
Sim
ple
diffe
renc
esSi
mpl
e di
ffere
nces
and
co
ntro
l of b
asel
ine
char
acte
ristic
s tha
t are
co
rrel
ated
with
the
outc
ome
of in
tere
stD
iffer
ence
-in-d
iffer
-en
ces.
Ove
rall,
the
prog
ram
me
seem
s to
have
had
lit
tle e
ffect
on
stud
ents
’ tes
t sco
res.
The
reas
on se
ems t
o be
the
teac
hers
’ fai
lure
to
inco
rpor
ate
com
pute
rs in
to th
e ed
ucat
iona
l pr
oces
s.
Sour
ce: P
repa
red
by th
e au
thor
s.

��
V. Empirical strategy
V.1 Data sources
This study analyzes the scores obtained by a panel of students in two moments in time, �006 and �009, to find out the students’ characteristics before the interven-tion and thus control the unobservable factors that could influence these results. The results obtained from the Second Regional Comparative and Explanatory Study (serce in Spanish) in �006 represents the baseline or first panel round, at a time when the Ceibal Plan had not been implemented.� A total of �,�09 �rd-grade and 6,��� 6th-grade students participated in serce. The study was imple-mented in all departments of the country and included language, mathematics and science tests,5 and a set of questionnaires for the students, their parents or guardians, teachers and school authorities.
The baseline of this study is the data obtained from the serce �006 evaluation for �rd grade students. Accordingly, our study group is made up of children who participated in serce �006 and were in �rd grade at that time.
With the support of the Division of Research, Evaluation and Statistics of anep, in �009 we were able to collect updated data regarding the school and the grade of the students that had participated in serce �006. Additionally, this Divi-sion provided the evaluation for these students who, in �009 were mostly in 6th grade. anep evaluation specialists suggested the last national evaluation tests for 6th grade (applied in �005) be used for this study, given that they tested primary school cumulative knowledge in mathematics and language.6 In this case, a set of questionnaires was also given to the students, their parents or guardians, teachers and school authorities.
V.2 Selecting treatment and control groups
For the impact evaluation, a sample of the students who had participated in serce was selected and two similar groups were built: one with students attend-ing schools where the Ceibal Plan was already running (treatment group), and another with students that in �009 had yet no contact with the Plan (control group). In section V.� we compare the groups treated and not treated by the baseline. The matching of the two groups prior to the impact estimation aims to reduce the potential selection bias. Studies show that this procedure creates efficient estimations (Khandker et al., �0�0).
Our empirical strategy consisted in the selection of a treatment group of 800 students from the departments where the Plan had the highest exposure (Florida, Durazno, Colonia, Paysandú, Río Negro, Salto and Soriano), and a control group
� serce is a learning evaluation carried out in a broad range of Latin American and Carib-bean countries in �005/�006 by the Latin American Laboratory for Assessment of the Quality of Education (llece) and applied to �rd and 6th grade students (serce, �008).
5 The natural sciences test was only completed by 6th grade students.6 The items included in the language module enable an analysis of the reading skills.

�5
of 800 students from Montevideo and Canelones, where the Ceibal Plan had not yet been implemented.
For the treatment group, at the time of the fieldwork the seven departments selected had been exposed to the Ceibal Plan for between �� and �� months. Table � shows the number of schools and students in the treatment and control groups. The �� schools included in the treatment group were visited by the re-search team in order to match these to the Montevideo and Canelones schools that would be included in the control group.
› Table 2. Number of schools and students that participated in the serce evaluation, in the selected departments
Treatment group Control group
DepartmentsNumber of schools with 10 or more students
Number of students in those schools
Number of schools with 10 or more students
Number of students in those schools
Colonia � ���
Durazno � ��
Florida 5 ��5
Paysandú 5 ��8
Río Negro � 60
Salto � ��6
Soriano � 5�
Montevideo �� �,��9
Canelones �5 ��6
27 875 59 2,800
Source: Prepared by the authors, based on data from anep Division of Research, Evaluation and
Statistics.
In all departments, the study included students who did not change schools between �006 and �009, and with those schools that in �009 had at least �0 stu-dents who had taken the serce evaluation in �006.� School matching was mainly carried out based on two cuts: the first was determined by the variable “school
� These criteria were adopted to reduce the costs of fieldwork. For the same reason, rural schools were not selected for the analysis. Table A�.�, in Annex �, shows that there are score differences between students from the selected sample (potential participants) and the students who were discarded from the study (children attending rural schools and schools where less than �0 students had participated in serce �006). In favour of the participating students, equal scores in mathematics (�0 per cent relevance) and reading (5 per cent) were weakly rejected. It is important to mention that this last result is present in all included regions, so it does not affect the analysis.

�6
category”, and the second, by the variable “school context”. Both variables were drawn from the Education Monitor for primary school.8
› Table 3. Student distribution in treatment and control groups in matching variables
Treatment group Control group
Very unf./Unf. Neutral Favourable Very unf./Unf. Neutral Favourable
CSCC �� 0 0 �,�60 0 0
PR 0 0 ��� 0 �� �0�
TC ��0 �5 �0 ��5 �� �5
UC �0� ��6 �� ��8 �0� �96
480 221 174 2,083 278 312
Source: Prepared by the authors, based on data from the anep Division of Research, Evaluation
and Statistics.
In those cases where more than one school was eligible for the study, average serce �006 mathematics and language scores and their distribution were also taken into account.9
The final sample includes �9� students in the treatment group and �8� in the control group. If the �8� students that were dropped from the original sample show different features between treatment and control, results may be biased to some extent. Section VI.� deals in more detail with panel attrition and its possible bias.
V.3 Assessing the impact of the Ceibal Plan in learning
An ideal methodological design of a study that aims at assessing a social policy would include a natural experiment with a fully random selection of the treat-ment and control groups. This is a popular method because, while it is almost im-possible to properly control all relevant variables, a natural experiment provides a reasonable confidence in the non-correlation of the dropped variables with the
8 The Education Monitor provides systematized information of the Uruguayan public primary education regarding each school’s department, sociocultural context and cat-egory, as well as information of the system as a whole (anep, �0�0). The school socio-cultural context was established in �005 through the combination of three dimensions: educational level of the parents, a socioeconomic status indicator and the level of social integration of the student´s home. Context provides five categories: very unfavourable, unfavourable, neutral, favourable, very favourable. The School category is determined by the combination of such aspects as the student socioeconomic context, the size of the school and the location. Thus, five types of Sociocultural contexts are established: Critical sociocultural Context (cscc), Full-time (ft), Standard Urban (su), Available to Practice (ap), Practicing (p) and Rural (r).
9 The Kolmogorov-Smirnov test leads to the non-rejection of the null hypothesis of equal distribution.

��
variables of interest. However, this kind of randomized experiment is hardly ever possible, so the researcher needs to resort to observational or quasi-experimental designs (Cansino and Sánchez, �006; Khandker et al., �0�0).
For the sample of students who participated in the �006 and �009 evaluations, data availability in two moments in time enable a double-difference estimation. The strategy is based on the comparison of student results before and after the implementation of the Plan. A simple comparison, however, might be affected by the time tendencies of the results variable or by the occurrence of other external events that affected this variable.
Accordingly, the methodology of difference-in-differences (did) is applied, which makes sense when one fraction of the population was subjected to treat-ment and the other was not. This methodology works on the assumption that the untreated group enables the isolation of the time variation that stems from other factors from the variation that is deemed an effect of the programme. Essentially, the did method compares the difference in results before and after the interven-tion for the affected group (treatment) and for the untreated group (control).�0
In this study, the treatment group consists of students from seven Uruguayan departments, and the control group consists of Montevideo and Canelones stu-dents, as in these two departments the Ceibal Plan had not been implemented at the time of the evaluation.
The did estimator can be calculated within a regression framework, as follows:
Yt = a + bTi1t + r Ti1 + gt + et
The dependent variable (Y) represents the learning evaluation results. The vari-able t is time, thus making a distinction between time 0 (the �006 evaluation) and time � (the �009 evaluation). The variable Ti� is the treatment (in this case, the Ceibal Plan). The variables Ti� and t are included separately to pick up any separate mean effects of time and the effect of being targeted versus not being targeted (Khandker et al., �0�0). Finally, Ti�t interaction is the variable of interest in policy assessments, as it results from the interaction between the post-programme treatment variable (Ti�) and time (t), thus identifying the mean effects of the programme. In sum, the coefficient represents the impact of the Ceibal Plan.
The did method requires that in absence of treatment, the mean results ob-tained by treatment and by control groups do not vary over time. This is due to the underlying assumption that time in the control group can be used as a counterfactual to understand the trend that would have been followed by the programme beneficiaries.
Thus, when baseline data are available, one can estimate impacts by assuming that unobserved heterogeneity is time invariant and uncorrelated with the treat-ment over time. In other words, the assumption is that changes in the results obtained by the control group are a true counterfactual.
When a public policy is constrained by certain initial local conditions, the un-observed heterogeneity could vary over time. To control for factors that could
�0 It is worth noticing that this method requires data from two points in time, although it does not necessarily require a panel, but at least a series of cross-section samples.

�8
produce changes in unobservables, the did method provides different alternatives, particularly to control for initial conditions that are correlated with the location for the policy. One of the alternatives used in this study is the control of initial condi-tions that could affect the unobservable characteristics of the population.
With this analysis, a Propensity Score Matching analysis was carried out on panel characteristics prior to the implementation of the Ceibal Plan (see Annex �) to obtain a better matching of the treatment and control groups. Accordingly, with the analysis of the general panel, this study provides an additional evalua-tion of the common subset of students, i.e., students selected with the Propensity Score Matching method. Results are provided in section VI.�.

�9
VI. Results
VI.1 Differences between treatment and control prior to intervention
Student and school performance for the baseline treatment and control groups was analyzed in order to validate the assumption of a similar evolution between these two groups. This analysis provides an evaluation of the similarities between the groups and an appraisal of their matching.
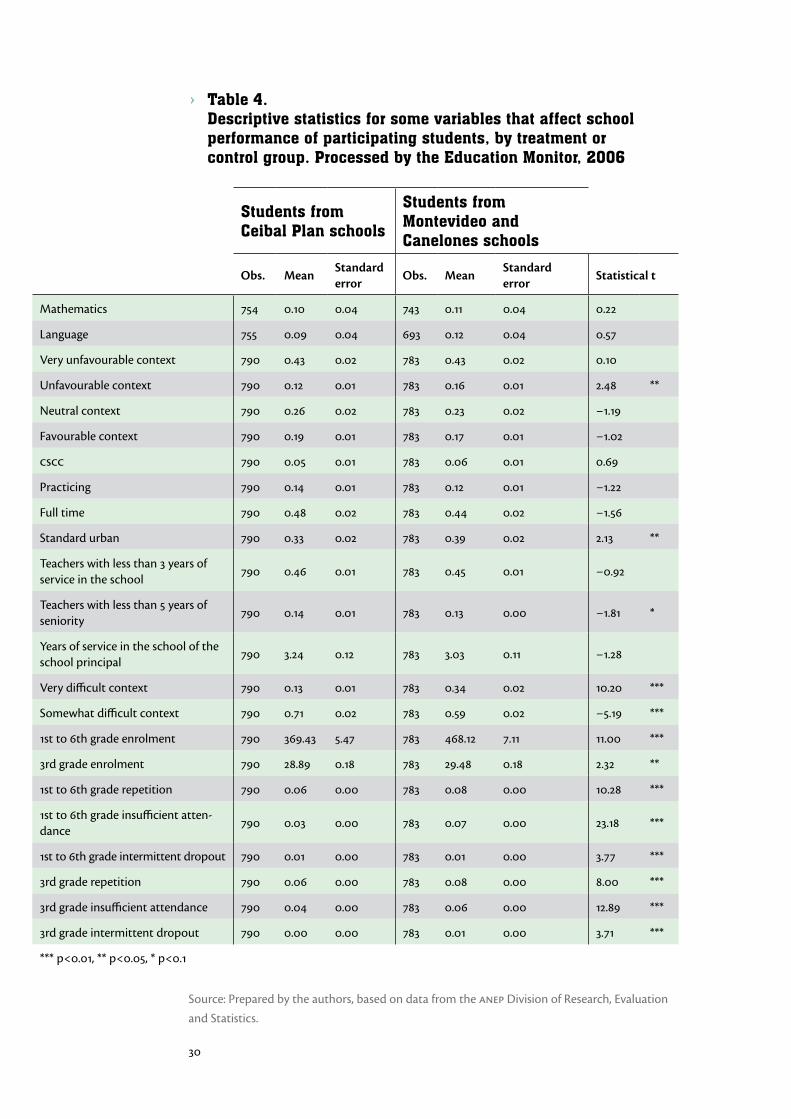
Table � shows the results obtained on the tests of difference of means for the variables of interest. As expected from the criteria used for the variable matching, in �006 there are no significant differences between school context and school category for the participating students from both regions analyzed. Neither are there significant differences in the baseline regarding mathematics and language scores, teacher seniority or years of service of the school authorities. These vari-ables have a conceptual effect in learning.
Differences between treatment and control groups answer to regional fea-tures. Schools in Montevideo and Canelones, and �rd grade classes in particular, are bigger in size, and show a more difficult environment, higher repetition rates, insufficient attendance and intermittent dropout.
However favourable these differences appear to be for the Uruguayan interior departments, �rd grade performance in the tests shows no significant differences between the regions. But because these differences might have an effect on the evolution of student performance by region, this study provides an additional analysis of the impact of the Ceibal Plan through an experiment that enables the isolation of performance per region. Results are provided in Annex �.
�0
› Table 4. Descriptive statistics for some variables that affect school performance of participating students, by treatment or control group. Processed by the Education Monitor, 2006
Students from Ceibal Plan schools
Students from Montevideo and Canelones schools
Obs. Mean
Standard error
Obs. MeanStandard error
Statistical t
Mathematics �5� 0.�0 0.0� ��� 0.�� 0.0� 0.��
Language �55 0.09 0.0� 69� 0.�� 0.0� 0.5�
Very unfavourable context �90 0.�� 0.0� �8� 0.�� 0.0� 0.�0
Unfavourable context �90 0.�� 0.0� �8� 0.�6 0.0� �.�8 **
Neutral context �90 0.�6 0.0� �8� 0.�� 0.0� −�.�9
Favourable context �90 0.�9 0.0� �8� 0.�� 0.0� −�.0�
cscc �90 0.05 0.0� �8� 0.06 0.0� 0.69
Practicing �90 0.�� 0.0� �8� 0.�� 0.0� −�.��
Full time �90 0.�8 0.0� �8� 0.�� 0.0� −�.56
Standard urban �90 0.�� 0.0� �8� 0.�9 0.0� �.�� **
Teachers with less than � years of service in the school
�90 0.�6 0.0� �8� 0.�5 0.0� −0.9�
Teachers with less than 5 years of seniority
�90 0.�� 0.0� �8� 0.�� 0.00 −�.8� *
Years of service in the school of the school principal
�90 �.�� 0.�� �8� �.0� 0.�� −�.�8
Very difficult context �90 0.�� 0.0� �8� 0.�� 0.0� �0.�0 ***
Somewhat difficult context �90 0.�� 0.0� �8� 0.59 0.0� −5.�9 ***
�st to 6th grade enrolment �90 �69.�� 5.�� �8� �68.�� �.�� ��.00 ***
�rd grade enrolment �90 �8.89 0.�8 �8� �9.�8 0.�8 �.�� **
�st to 6th grade repetition �90 0.06 0.00 �8� 0.08 0.00 �0.�8 ***
�st to 6th grade insufficient atten-dance
�90 0.0� 0.00 �8� 0.0� 0.00 ��.�8 ***
�st to 6th grade intermittent dropout �90 0.0� 0.00 �8� 0.0� 0.00 �.�� ***
�rd grade repetition �90 0.06 0.00 �8� 0.08 0.00 8.00 ***
�rd grade insufficient attendance �90 0.0� 0.00 �8� 0.06 0.00 ��.89 ***
�rd grade intermittent dropout �90 0.00 0.00 �8� 0.0� 0.00 �.�� ***
*** p<0.0�, ** p<0.05, * p<0.�
Source: Prepared by the authors, based on data from the anep Division of Research, Evaluation
and Statistics.

��
VI.2 Panel attrition
Table 5 shows panel attrition patterns, by treatment and control group. The attrition rates were �0 and �� per cent, respectively, so the difference was not significant. Also, we controlled for significant differences in �006 language and mathematics performance between students lost and not lost, both for the treatment and the control groups. Although there are significant differences between missing selected students and par-ticipants to the detriment of the formers, differences between treatment and control groups do not have statistical significance.
› Table 5. Panel attrition patterns
Ceibal Not Ceibal Difference
Intended cases 8�5 88�
Actual cases �9� �8�
Attrition rate (%) 9.60 ��.�� �.6�
(0.0�5)
Test results Lost - participating
Ceibal Not Ceibal Difference
Mathematics Difference in �006 tests: lost - participating
−0.��8*** −0.��5*** −0.05�
(0.�00) (0.08�) (0.��0)
Language Difference in �006 tests: lost - participating
−0.��8* −0.��8*** 0.099
(0.�0�) (0.089) (0.���)
Standard errors are in brackets*** p<0.0�, ** p<0.05, * p<0.�
Source: Prepared by the authors.
In sum, this analysis shows that, because no significant differences were found in the two tests between lost and participating students in the treatment group vis-à-vis the control group, panel attrition does not introduce a bias to the analysis.
VI.3 Indicators used as control variables
The impact evaluation only used the treatment variable (i.e., the variable that iden-tifies whether or not the students participated in the Ceibal Plan) and included control variables that were deemed important for their effects on learning.
Most of these control variables are indexes built through multiple correspon-dence factorial analyses, except the socioeconomic and cultural index (sci), which was built with the item response theory in order to use the same criteria applied for the serce �006 evaluation.
��
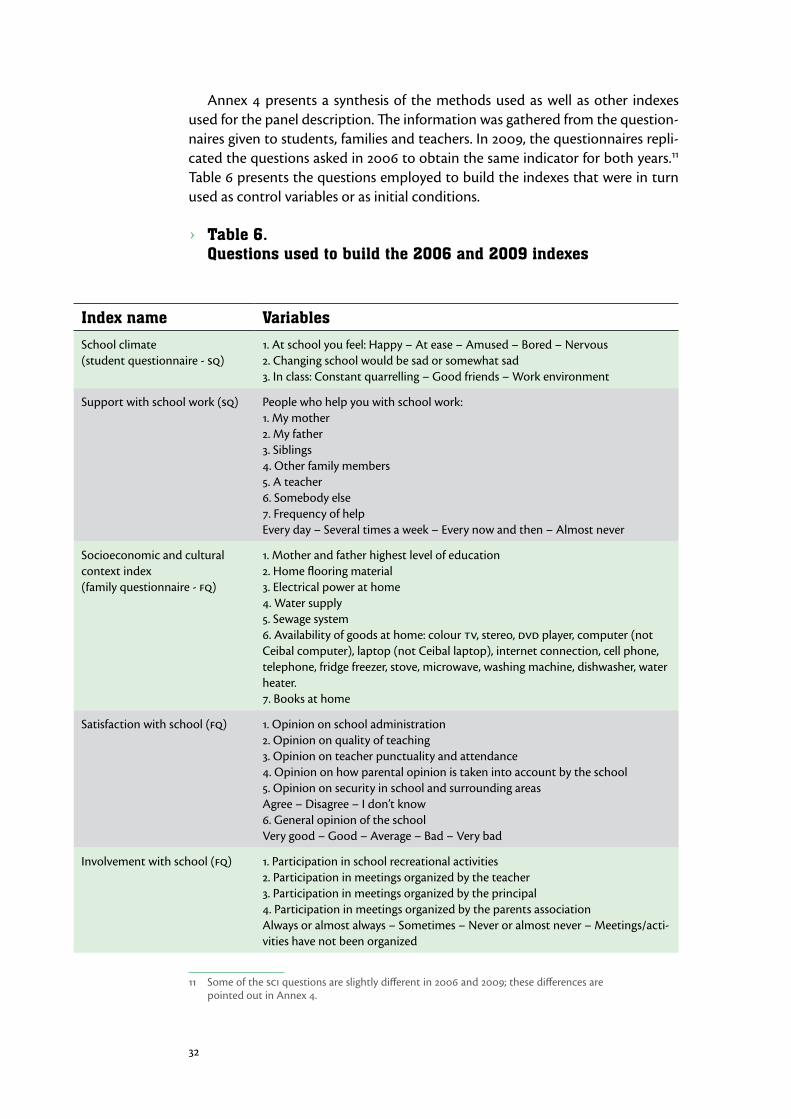
Annex � presents a synthesis of the methods used as well as other indexes used for the panel description. The information was gathered from the question-naires given to students, families and teachers. In �009, the questionnaires repli-cated the questions asked in �006 to obtain the same indicator for both years.�� Table 6 presents the questions employed to build the indexes that were in turn used as control variables or as initial conditions.
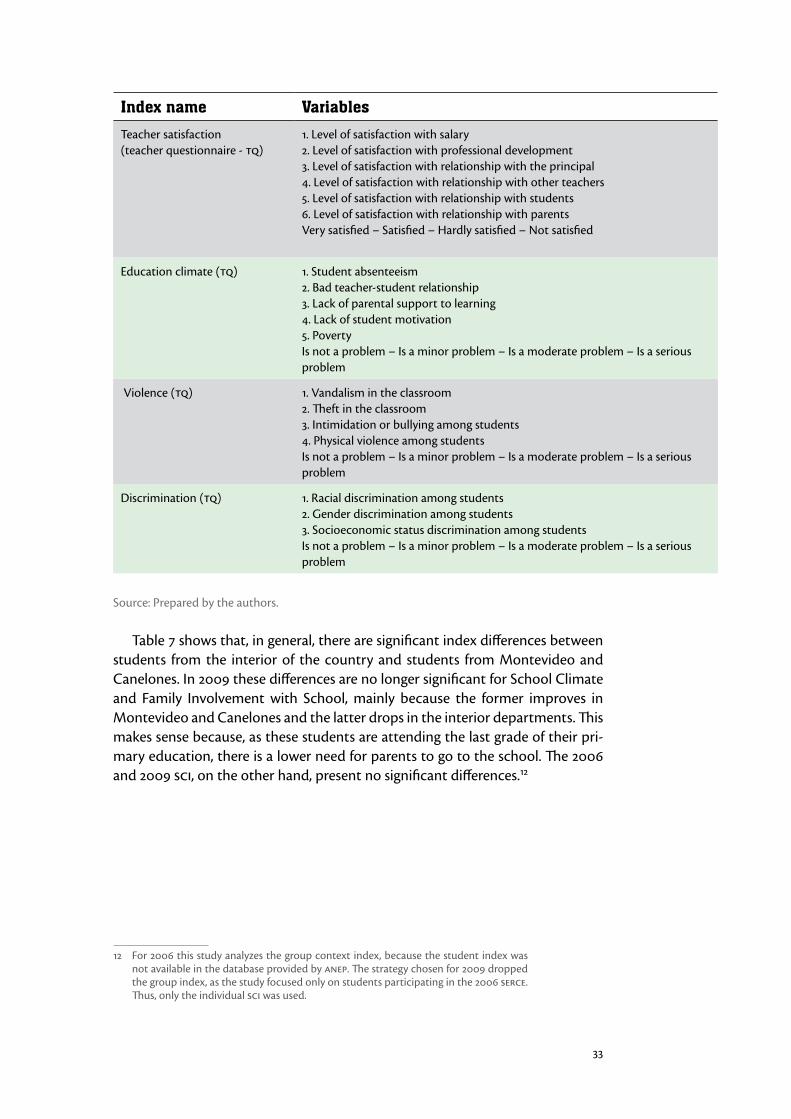
› Table 6. Questions used to build the 2006 and 2009 indexes
Index name Variables
School climate (student questionnaire - sq)
�. At school you feel: Happy – At ease – Amused – Bored – Nervous�. Changing school would be sad or somewhat sad �. In class: Constant quarrelling – Good friends – Work environment
Support with school work (sq) People who help you with school work:�. My mother �. My father �. Siblings �. Other family members 5. A teacher 6. Somebody else�. Frequency of helpEvery day – Several times a week – Every now and then – Almost never
Socioeconomic and cultural context index (family questionnaire - fq)
�. Mother and father highest level of education �. Home flooring material�. Electrical power at home �. Water supply5. Sewage system 6. Availability of goods at home: colour tv, stereo, dvd player, computer (not Ceibal computer), laptop (not Ceibal laptop), internet connection, cell phone, telephone, fridge freezer, stove, microwave, washing machine, dishwasher, water heater.�. Books at home
Satisfaction with school (fq) �. Opinion on school administration�. Opinion on quality of teaching�. Opinion on teacher punctuality and attendance �. Opinion on how parental opinion is taken into account by the school5. Opinion on security in school and surrounding areasAgree – Disagree – I don’t know6. General opinion of the schoolVery good – Good – Average – Bad – Very bad
Involvement with school (fq) �. Participation in school recreational activities �. Participation in meetings organized by the teacher�. Participation in meetings organized by the principal�. Participation in meetings organized by the parents association Always or almost always – Sometimes – Never or almost never – Meetings/acti-vities have not been organized
�� Some of the sci questions are slightly different in �006 and �009; these differences are pointed out in Annex �.
��
Index name Variables
Teacher satisfaction(teacher questionnaire - tq)
�. Level of satisfaction with salary�. Level of satisfaction with professional development �. Level of satisfaction with relationship with the principal�. Level of satisfaction with relationship with other teachers5. Level of satisfaction with relationship with students6. Level of satisfaction with relationship with parentsVery satisfied – Satisfied – Hardly satisfied – Not satisfied
Education climate (tq) �. Student absenteeism�. Bad teacher-student relationship�. Lack of parental support to learning�. Lack of student motivation5. PovertyIs not a problem – Is a minor problem – Is a moderate problem – Is a serious problem
Violence (tq) �. Vandalism in the classroom�. Theft in the classroom�. Intimidation or bullying among students�. Physical violence among studentsIs not a problem – Is a minor problem – Is a moderate problem – Is a serious problem
Discrimination (tq) �. Racial discrimination among students�. Gender discrimination among students �. Socioeconomic status discrimination among studentsIs not a problem – Is a minor problem – Is a moderate problem – Is a serious problem
Source: Prepared by the authors.
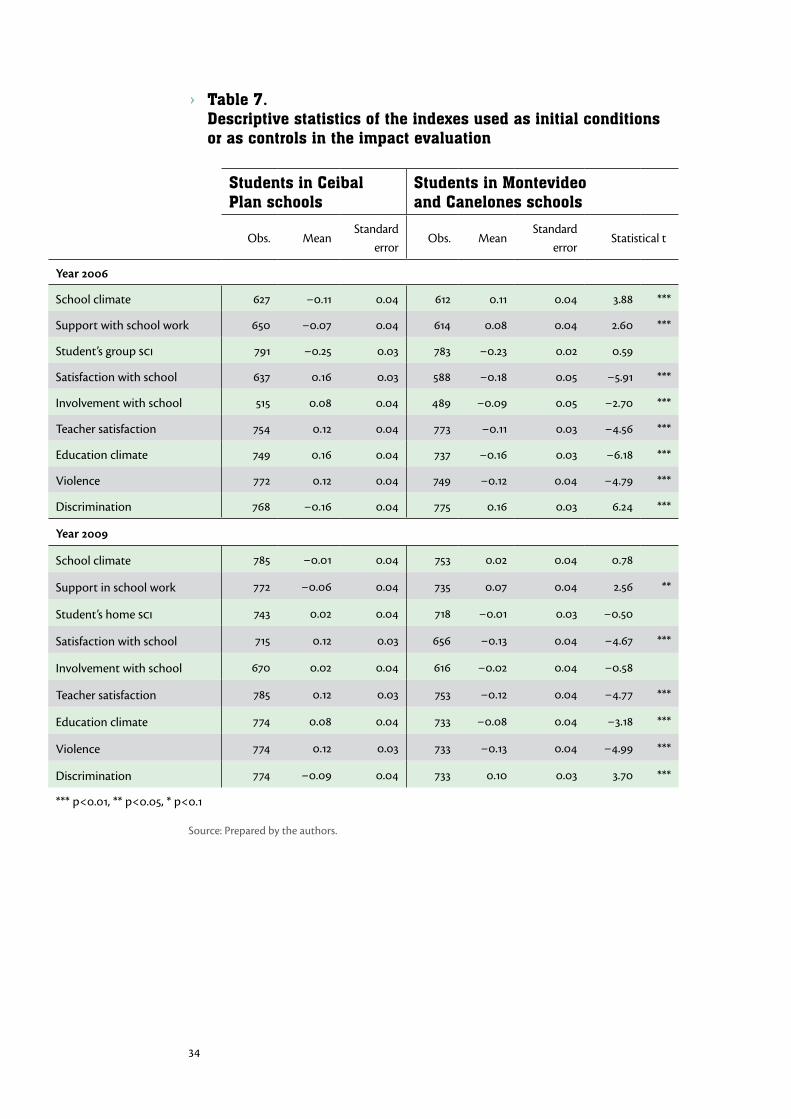
Table � shows that, in general, there are significant index differences between students from the interior of the country and students from Montevideo and Canelones. In �009 these differences are no longer significant for School Climate and Family Involvement with School, mainly because the former improves in Montevideo and Canelones and the latter drops in the interior departments. This makes sense because, as these students are attending the last grade of their pri-mary education, there is a lower need for parents to go to the school. The �006 and �009 sci, on the other hand, present no significant differences.��
�� For �006 this study analyzes the group context index, because the student index was not available in the database provided by anep. The strategy chosen for �009 dropped the group index, as the study focused only on students participating in the �006 serce. Thus, only the individual sci was used.
��
› Table 7. Descriptive statistics of the indexes used as initial conditions or as controls in the impact evaluation
Students in Ceibal Plan schools
Students in Montevideo and Canelones schools
Obs. MeanStandard
errorObs. Mean
Standard error
Statistical t
Year 2006
School climate 6�� −0.�� 0.0� 6�� 0.�� 0.0� �.88 ***
Support with school work 650 −0.0� 0.0� 6�� 0.08 0.0� �.60 ***
Student’s group sci �9� −0.�5 0.0� �8� −0.�� 0.0� 0.59
Satisfaction with school 6�� 0.�6 0.0� 588 −0.�8 0.05 −5.9� ***
Involvement with school 5�5 0.08 0.0� �89 −0.09 0.05 −�.�0 ***
Teacher satisfaction �5� 0.�� 0.0� ��� −0.�� 0.0� −�.56 ***
Education climate ��9 0.�6 0.0� ��� −0.�6 0.0� −6.�8 ***
Violence ��� 0.�� 0.0� ��9 −0.�� 0.0� −�.�9 ***
Discrimination �68 −0.�6 0.0� ��5 0.�6 0.0� 6.�� ***
Year 2009
School climate �85 −0.0� 0.0� �5� 0.0� 0.0� 0.�8
Support in school work ��� −0.06 0.0� ��5 0.0� 0.0� �.56 **
Student’s home sci ��� 0.0� 0.0� ��8 −0.0� 0.0� −0.50
Satisfaction with school ��5 0.�� 0.0� 656 −0.�� 0.0� −�.6� ***
Involvement with school 6�0 0.0� 0.0� 6�6 −0.0� 0.0� −0.58
Teacher satisfaction �85 0.�� 0.0� �5� −0.�� 0.0� −�.�� ***
Education climate ��� 0.08 0.0� ��� −0.08 0.0� −�.�8 ***
Violence ��� 0.�� 0.0� ��� −0.�� 0.0� −�.99 ***
Discrimination ��� −0.09 0.0� ��� 0.�0 0.0� �.�0 ***
*** p<0.0�, ** p<0.05, * p<0.�
Source: Prepared by the authors.

�5
VI.4 Impact analysis with the student panel
Results obtained by the did estimation with the student panel provide data to compare the mean performance of the students with and without a Ceibal Plan laptop over time. To add further controls to the estimation, the analysis model in-cluded several specifications. The results obtained by the did estimations confirm the impact of the Plan in mathematics for the different model specifications.��
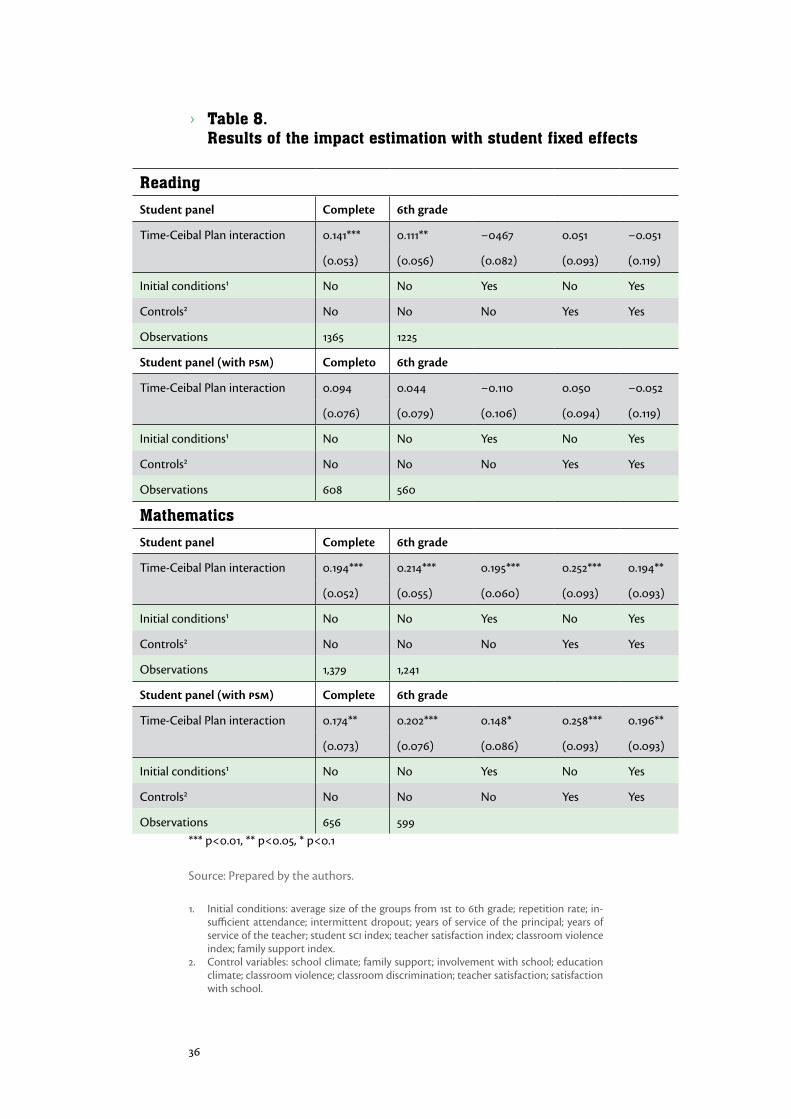
Table 8 presents the coefficient that results from the interaction between time and treatment; in other words, the result of the estimation for mathematics and language is identified.
To control for student unobservables and time-invariant characteristics, re-gressions are run with student fixed effects. The Time-Ceibal Plan interaction co-efficient shows the mean effect of the Plan estimated by the did method.
The study provides estimations for the complete panel and for the panel of 6th graders (to eliminate the effect of repetition on performance) taking into consideration and excluding initial conditions and controls respectively.
As was previously mentioned, the analysis is completed with the study of the effects on a subset of students selected after a Propensity Score Matching (psm) of the original panel is applied. Accordingly, the analyses were run on students from the most similar schools and families. Different variable combinations were included in the analysis to generate different groups to study the effects of the Ceibal Plan on each of them.
Table 8 shows the results obtained when the baseline variables�� included in the matching are: support with school work, average size of the class, sci, involve-ment with the school, satisfaction with school, education climate and discrimi-nation. Given that this specification includes the most variables, results are thus presented; results are also robust with other specifications.
The Ceibal Plan also shows a positive and significant effect in simpler models (with no initial conditions or controls), both with the complete panel and the 6th grade student panel.�5
�� Scores were standardized, as they create a ranking and respect the relative instance between the scores obtained.
�� From �006.�5 In Montevideo and Canelones repetition rates are higher, which could result in a worse
performance when analyzing the complete panel. For this reason the research team decided to take only 6th graders into account in the analysis.
�6
› Table 8. Results of the impact estimation with student fixed effects
Reading
Student panel Complete 6th grade
Time-Ceibal Plan interaction 0.���*** 0.���** −0�6� 0.05� −0.05�
(0.05�) (0.056) (0.08�) (0.09�) (0.��9)
Initial conditions� No No Yes No Yes
Controls� No No No Yes Yes
Observations ��65 ���5
Student panel (with psm) Completo 6th grade
Time-Ceibal Plan interaction 0.09� 0.0�� −0.��0 0.050 −0.05�
(0.0�6) (0.0�9) (0.�06) (0.09�) (0.��9)
Initial conditions� No No Yes No Yes
Controls� No No No Yes Yes
Observations 608 560
Mathematics
Student panel Complete 6th grade
Time-Ceibal Plan interaction 0.�9�*** 0.���*** 0.�95*** 0.�5�*** 0.�9�**
(0.05�) (0.055) (0.060) (0.09�) (0.09�)
Initial conditions� No No Yes No Yes
Controls� No No No Yes Yes
Observations �,��9 �,���
Student panel (with psm) Complete 6th grade
Time-Ceibal Plan interaction 0.���** 0.�0�*** 0.��8* 0.�58*** 0.�96**
(0.0��) (0.0�6) (0.086) (0.09�) (0.09�)
Initial conditions� No No Yes No Yes
Controls� No No No Yes Yes
Observations 656 599*** p<0.0�, ** p<0.05, * p<0.�
Source: Prepared by the authors.
�. Initial conditions: average size of the groups from �st to 6th grade; repetition rate; in-sufficient attendance; intermittent dropout; years of service of the principal; years of service of the teacher; student sci index; teacher satisfaction index; classroom violence index; family support index.
�. Control variables: school climate; family support; involvement with school; education climate; classroom violence; classroom discrimination; teacher satisfaction; satisfaction with school.
��
However, in order to take into account the different initial conditions between Montevideo and Canelones and the interior departments, the literature suggests estimates that include initial conditions and other controls. In this case and also when a psm is applied, the specifications show an effect of the Plan in mathemat-ics and no effect in reading.
The positive and significant effect in mathematics is around 0.� standard devia-tions from the mean. While it can be said that the Plan has positive effects (i.e., that in �009 those students included in the Ceibal Plan are in a better situation com-pared with the Montevideo and Canelones students), the nature of the evaluations applied in �006 and �009 precludes a translation of these results into a quantita-tive measure of such progress, that is, to establish the number of points into which improvement is translated and their meaning in terms of skills acquired.
VI.5 Impact channels As can be inferred from the conceptual framework, traits and behaviours of students, families, teachers and school authorities, together with policies and programmes can affect student learning. Thence, some authors underscore the importance of parent involvement and motivation, school characteristics (class size, materials and time spent at school) and teacher characteristics (effort made, knowledge used and teaching method). Particularly, any significant change in any of these factors could affect student learning indicators, such as the language and mathematics tests.
In view of the characteristics of the Ceibal Plan, many of these factors may have been affected, thus producing an effect in student learning. We consider that some dimensions are key to student learning: student motivation and school climate, stu-dent access and use of computers, teacher commitment with the plan and family approval of it, and teacher and family access and use of computers. The data pulled from the student, family and teacher questionnaires both in the treatment and control groups represent a first hint that some of these channels might be in opera-tion in the case of the Ceibal Plan, thus affecting student learning.
Together with the indexes mentioned in section VI.�, other indicators were also built although only for �009, as they draw from questions that were only asked in this instance. Table 9 shows these indexes.

�8
› Table 9. Questions used for the 2009 indexes
Index name Variables Access to computers (Student questionnaire - sq)
�. Has used a computer for more than three years �. Uses a computer once a week or more
Computer use (sq) Frequency of computer use at:�. School�. Internet café�. Somewhere elseOnce a week or more– Once a month or more – Every two or three months – Never
Computer used in school work(sq)
To do your homework or to study at home, you use:�. A computer�. Internet �. At home, you use the computer once a week or more
Commitment with the Plan(Teacher questionnaire - tq)
�. Frequency of computer use at school�. Frequency of computer use in classroom activitiesAlmost daily – A few times a week – Once a month or less – Never
Access to computers (tq) �. Frequency of computer useAlmost daily – A few times a week – Once a month or less – NeverFrequency of use:�. In a public space�. Somewhere elseAlmost daily – A few times a week – Once a month or less– Never�. For how long you have used a computerLess than a year – Between one and three years – Between three and five years – More than five years
Computer use (tq) Frequency of computer use:By application:�. E-Mail – �. Internet – �. Word processor – �. Spreadsheet – 5. Visual presentationFrequently – Occasionally – NeverBy purpose:6. Institutional communication – �. Families and students – 8. Personal – 9. Class preparationAlmost daily – A few times a week – Once a month or less – Never
Source: Prepared by the authors.
It is important to note that in a very high number both mothers and teachers express that ever since students have an xo, they show more motivation. Most of these students’ teachers believe that the tool is good or very good for learning (9� per cent), that the fact that each student has a laptop for personal use is po-sitive (9� per cent) and that motivation is particularly high in mathematics and language tasks (6� per cent). In the case of the parents, they indicate that their children show differences in behaviour ever since they received their xo: they look for more information for their homework (5� per cent), they are more moti-vated to attend school (�6.� per cent) and they are happier (��.� per cent).
Regarding the intermittent use of a computer and the number of years of computer use (the most frequent answer is more than three years) there are no

�9
differences in student answers between treatment and control groups. This means that although the Ceibal Plan might have introduced frequency and type of use differences between these groups, it did not introduce the novelty of first-time computer use. However, compared with students who had not yet received a Ceibal laptop, a high portion of those who have an xo use it between once a week or more (�� and 8� per cent, respectively). If students who use a laptop between once a week or more and students who use it between once a month or more are taken jointly, then almost 80 per cent of these students own a Ceibal computer and almost �8 per cent do not. An indicator was built from the student answers about the application of computer tools (computer and internet) to school work at home. As Table �0 shows, this indicator revealed significant differences in fa-vour of the students who own a Ceibal laptop.
› Table 10. Descriptive statistics of the indexes used to better understand the Ceibal Plan impact channels
Students in Ceibal Plan schools
Students in Montevideo and Canelones schools
Obs. MeanStandard error
Obs. MeanStandard error
Statistical t
Access to computers (sq) �8� 0.06 0.0� ��6 −0.06 0.0� �.�9 **
Computer use (sq) ��9 0.00 0.0� 6�9 −0.00 0.0� 0.05
Computer used in school work (sq) �50 0.�� 0.0� 65� −0.�9 0.0� 6.80 ***
Commitment with the Plan (tq) �80 0.�� 0.0� ��8 −0.�5 0.0� −��.86 ***
Access to computers (tq) �55 0.�� 0.0� ��8 −0.�5 0.0� 5.55 ***
Computer use (tq) ��� −0.0� 0.0� ��8 0.0� 0.0� −0.��
*** p<0.0�, ** p<0.05, * p<0.�
Source: Prepared by the authors.
The student questionnaire included questions addressed only to the treat-ment group (students who had their xo at the time of the survey) and some of the main results are presented in this section.
Eighty percent of students bring the computer to school at least once a week, and around �5 per cent bring it every day. While 8� per cent of the teachers of the treatment group bring a computer to the classroom almost daily or at least a few times a week, only 5� per cent of the control group teachers do. With this data, a “Commitment with the Plan” indicator was built to represent the frequency of use of computers at school and in the classroom. As Table �0 shows, this indica-tor presents significant differences in favour of the Ceibal Plan schools.
Also, the impact in school performance can also be explained by the way a computer is used in the classroom. This study found that 98 per cent of the stu-
�0
dents have teachers who use the xo as a teaching tool. Particularly, almost half of these teachers use them specifically to teach mathematics.
The “Access to computers” indicator also shows a higher frequency of use in Ceibal Plan teachers. The last indicator, built from the teacher questionnaire, “Computer use”, refers to the computer use frequency regarding application and purpose and shows no significant differences between both groups. It is note-worthy that for other relevant aspects such as school climate and student so-cioeconomic context (sci), the school experience and the teacher training, no relevant differences were found between treatment and control students.
��
VII. Final comments
The aim of this study was to determine the impact of the Ceibal Plan on student learning. The impact evaluation was carried out by comparing the relative posi-tion of the student panel in �006 vis-à-vis �009. The analysis shows that in the Uruguayan departments we studied, the Ceibal Plan had a positive impact on mathematics. This result was obtained both when all students and when only 6th graders were analyzed. The incremental effect estimated amounts to approxi-mately one fifth standard deviations from the mean.
Once the appropriate time lapse has passed, we suggest that a study of the effects of the Plan in Montevideo and Canelones be carried out. Particularly, al-though all estimations point to an effect of the Ceibal Plan in mathematics, rigor-ously similar groups are difficult to build for some variables related to regional characteristics.
This study also aimed at increasing knowledge of those aspects that could influence student learning. This was achieved by the analysis of the student, fam-ily and teacher questionnaires. Regarding the irregular use of the computer and the number of years of use (most frequently, more than three years), the student answers showed no important differences between the treatment and control groups. However, students who owned a Ceibal laptop showed favourable differ-ences regarding daily use of the tool.
At school also, those students who had a Ceibal laptop showed a higher use frequency and a higher home use of the computer and the internet in school assignments. This was not detrimental to the use of other study materials, such as dictionaries or textbooks, as the frequency of use of these was similar for all groups of students.
Regarding school motivation, most of the students analyzed were happy with their schools, had good friends in class and would be sad to have to change schools. Although the answers were slightly higher for the Ceibal students, we found no evidence that the Plan could explain a higher motivation with the school. Accordingly, the school climate index showed no significant differences between treatment and control groups. However, most parents and teachers ex-press that, since the introduction of the xo, students are more motivated toward school and daily school work.
This study was carried out when the Ceibal Plan had been running for be-tween �� and �� months in the seven selected departments. For this reason, we believe that the effects of the Plan on student learning should be further studied, after giving it time to mature.

��
VIII. References
anep-pisa (�00�). “Primer Informe Nacional pisa �00�. Uruguay.” Montevideo.anep (�005). “Panorama de la educación en el Uruguay. Una década de transfor-
maciones �99�-�00�.” Montevideo.anep (�00�). “Equidad y calidad de la educación en Uruguay.” Montevideo.anep (�009). “Uruguay en el Segundo Estudio Regional Comparativo y Explicativo
(serce). Informe nacional.” Dirección Sectorial de Planificación Educativa. Di-visión de Investigación, Evaluación y Estadística. Montevideo, junio de �009.
anep (�0�0). “Monitor educativo de enseñanza primaria. Estado de situación �009.” Angrist, Joshua and Victor Lavy (�00�). “New evidence on classroom computers
and pupil learning.” The Economic Journal, ���(�8�): ��5-�65. Banerjee, Abhijit, Shawn Cole, Esther Duflo and Leigh Linden (�00�). “Remedying
education: Evidence from two randomized experiments in India.” Quarterly Journal of Economics, ���(�): ���5-6�.
Barrera-Osorio, Felipe and Leigh Linden (�009). “The use and misuse of com-puters in education: Evidence from a randomized experiment in Colombia.” World Bank Policy Research Working Paper Series, �8�6. Available at: ssrn.com/abstract=�������.
Barrow, Lisa, Lisa Markman and Cecilia Rouse (�009). “Technology’s edge: The educational benefits of computer-aided instruction.” American Economic Journal: Economic Policy, �(�): 5�-��. Available at: www.aeaweb.org/articles.php?doi=�0.��5�/pol.�.�.5�
Cansino, José Manuel and Antonio Sánchez Braza (�006). “La evaluación aplicada de programas públicos de formación. La utilización de métodos observacio-nales: el estimador de diferencias en diferencias.” Evaluación de Políticas Públi-cas y Calidad de Gobierno. Madrid: Delta. ��0-�6�.
Darling-Hammond, Linda (�000). “Teacher quality and student achievement.” Education policy analysis archives, North America. Available at: epaa.asu.edu/ojs/article/view/�9�.
Duflo, Esther (�000). “Schooling and labor market consequences of school con-struction in Indonesia: Evidence from an unusual policy experiment.” American Economic Review 9�(�): �95-8��.
Gulek, James and Hakan Demirtas (�005). “Learning with technology: The impact of laptop use on student achievement.” Journal of Technology, Learning, and Assessment, �(�). Available at: www.jtla.org
Goolsbee, Austan and Jonathan Guryan (�006). “The impact of internet subsidies in public schools.” Review of Economics and Statistics, 88(�): ��6-��.
Hanushek, Eric and Javier Luque (�00�). “Efficiency and equity in schools around the world.” Economics of Education Review, Elsevier, ��(5), �8�-50�, October.
Khandker, Shahidur, Gayatri Koolwal and Hussain Samad (�0�0). Handbook on impact evaluation: quantitative methods and practices. The International Bank for Reconstruction and Development/The World Bank.
Kozma, Robert (�006). “Monitoring and evaluation of ict for education impact: A review.” In: Wagner, D. et al. (eds.), Monitoring and evaluation of ict in education
��
projects. A handbook for developing countries. Washington, dc: infodev/The International Bank for Reconstruction and Development/The World Bank.
Linden, Leigh (�008). “Complement or substitute? The effect of technology on student achievement in India.” Columbia University, mit Jameel Poverty Ac-tion Lab, iza.
Linden, Leigh, Abhijit Banerjee and Esther Duflo (�00�). “Computer-assisted learning: evidence from a randomized experiment.” Poverty Action Lab Paper No. 5.
Machado, Alina (�006). “Exclusión social en la infancia. ¿Una problemática que afecta a los niños uruguayos?” Tesis de Maestría en Economía de la fceya.
Machin, Stephen, Sandra McNally and Olmo Silva (�00�). “New technology in schools: Is there a payoff?” Economic Journal, ���(5��): ���5-6�.
orealc/unesco-llece (n/d). “Reporte técnico serce. Los aprendizajes de los estu-diantes de América Latina y el Caribe.” Santiago, Chile.
Morduchowicz, Alejandro (�006). Los indicadores educativos y las dimensiones que los integran. unesco. Instituto Internacional de Planeamiento de la Edu-cación. Buenos Aires.
Rosenholtz, Susan (�989). “Workplace conditions that affect teacher quality and commitment: Implications for Teacher Induction Programmes.” The Elemen-tary School Journal, 89(�).
Russell, Michael, Damian Bebell and Jennifer Higgins (�00�). “Laptop learning: A comparison of teaching and learning in upper elementary classrooms.” Tech-nology and Assessment Study Collaborative, Boston College.
Silvernail, David and Aaron Gritter (�00�). “Maine’s middle school laptop pro-gramme: creating better writers.” Research Brief, Maine Education Policy Re-search Institute, University of Southern Maine.
umre (�999). “Estudio de los factores institucionales y pedagógicos que inciden en los aprendizajes en escuelas primarias de contextos sociales desfavorecidos en el Uruguay.” Project mecaep. anep/birf.
unesco-llece (�008). “Primer reporte serce. Los aprendizajes de los estudiantes de América Latina y el Caribe.” Laboratorio Latinoamericano de Evaluación de la Calidad de la Educación.
undp (�008). Desarrollo humano en Uruguay 2008. Política, políticas y desarrollo humano en Uruguay. Montevideo, Uruguay.
Vegas, Emiliana and Jenny Petrow (�008). Raising student learning in Latin Amer-ica. The challenge for the 21st century. The World Bank.
Wang, Xiaoping, Tingyu Wang, and Renmin Ye (�00�). “Usage of instructional ma-terials in high schools: Analyses of nels data.” Paper presented at the Annual Meeting of American Educational Research Association, New Orleans, la.
Wenglinsky, Harold (�998). “Does it Compute? The relationship between educa-tional technology and student achievement in mathematics.” eric Document Reproduction Service No. ED��5�9�.
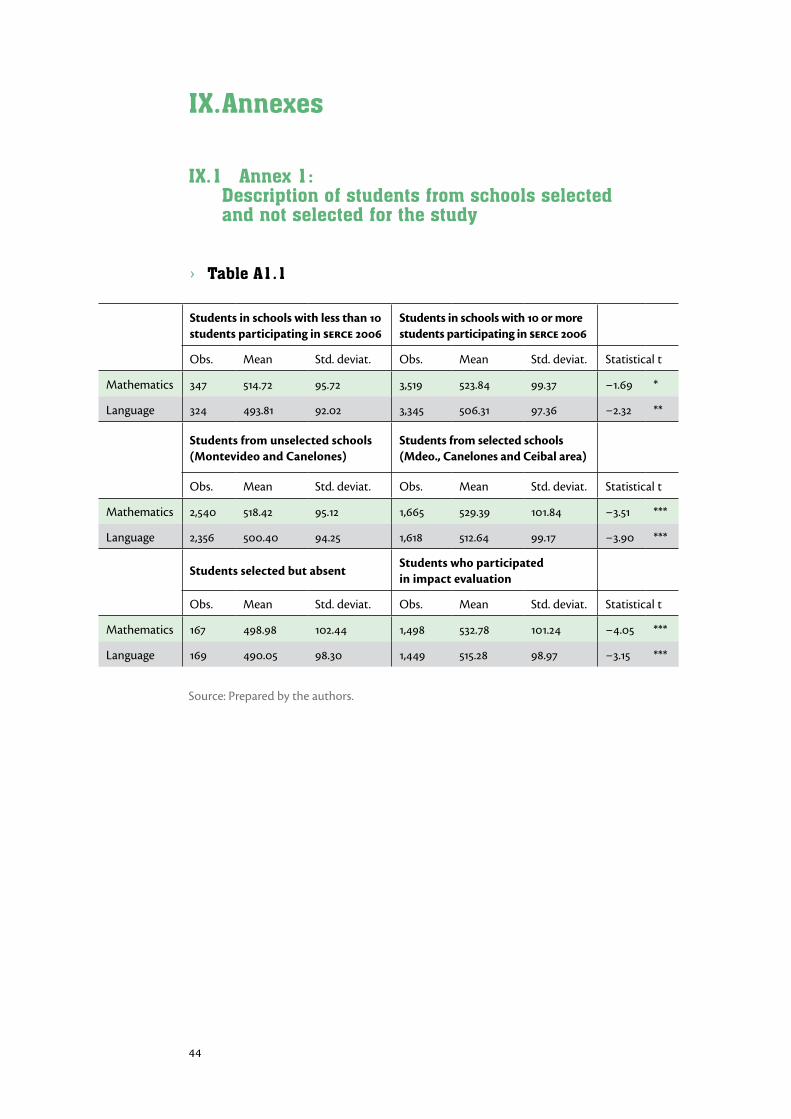
��
IX. Annexes
IX.1 Annex 1: Description of students from schools selected and not selected for the study
› Table A1.1
Students in schools with less than 10 students participating in serce 2006
Students in schools with 10 or more students participating in serce 2006
Obs. Mean Std. deviat. Obs. Mean Std. deviat. Statistical t
Mathematics ��� 5��.�� 95.�� �,5�9 5��.8� 99.�� −�.69 *
Language ��� �9�.8� 9�.0� �,��5 506.�� 9�.�6 −�.�� **
Students from unselected schools (Montevideo and Canelones)
Students from selected schools (Mdeo., Canelones and Ceibal area)
Obs. Mean Std. deviat. Obs. Mean Std. deviat. Statistical t
Mathematics �,5�0 5�8.�� 95.�� �,665 5�9.�9 �0�.8� −�.5� ***
Language �,�56 500.�0 9�.�5 �,6�8 5��.6� 99.�� −�.90 ***
Students selected but absentStudents who participated in impact evaluation
Obs. Mean Std. deviat. Obs. Mean Std. deviat. Statistical t
Mathematics �6� �98.98 �0�.�� �,�98 5��.�8 �0�.�� −�.05 ***
Language �69 �90.05 98.�0 �,��9 5�5.�8 98.9� −�.�5 ***
Source: Prepared by the authors.

�5
› Table A1.2 Descriptive statistics of some variables that affect student school performance, by zone. Students selected for the evaluation. Processed by the Education Monitor, 2006
Students from schools in Montevideo and Canelones
Students from Ceibal zone
Obs. MeanStd. deviation
Obs. MeanStd. deviation
Statistical t
Very unfavourable context 88� 0.�� 0.50 8�5 0.�� 0.50 0.5�
Unfavourable context 88� 0.�6 0.�� 8�5 0.�� 0.�� �.�9 **
Standard context 88� 0.�� 0.�� 8�5 0.�5 0.�� -�.��
Favourable context 88� 0.�� 0.�8 8�5 0.�0 0.�0 -�.�0
sci 88� 0.0� 0.�6 8�5 0.05 0.�� �.�� **
Practicing 88� 0.�� 0.�� 8�5 0.�� 0.�5 -�.50
Full time 88� 0.�� 0.50 8�5 0.�� 0.50 -�.�8 *
Standard urban 88� 0.�8 0.�9 8�5 0.�� 0.�� �.�� *
Teachers with less than � years of service in the school
88� 0.�5 0.�5 8�5 0.�6 0.�9 -�.00
Teachers with less than 5 years of seniority
88� 0.�� 0.�� 8�5 0.�� 0.�� -�.55
Years of service in the school of the principal
88� �.0� �.�0 8�5 �.�� �.�� -�.��
Very difficult context 88� 0.�� 0.�� 8�5 0.�� 0.�� �0.88 ***
Somewhat difficult context 88� 0.59 0.�9 8�5 0.�� 0.�5 -5.�� ***
�st to 6th grade enrolment 88� �69.�9 �98.06 8�5 �69.9� �5�.�� ��.�� ***
�rd grade enrolment 88� �9.�� 5.�5 8�5 �8.�� 5.08 �.�� **
�st to 6th grade repetition 88� 0.08 0.05 8�5 0.06 0.0� ��.�� ***
�st to 6th grade insufficient attendance
88� 0.0� 0.0� 8�5 0.0� 0.0� �5.06 ***
�st to 6th grade intermittent dropout
88� 0.0� 0.0� 8�5 0.0� 0.0� �.65 ***
�rd grade repetition 88� 0.08 0.06 8�5 0.06 0.05 8.�9 ***
�rd grade insufficient atten-dance
88� 0.06 0.0� 8�5 0.0� 0.0� ��.6� ***
�rd grade intermittent dropout 88� 0.0� 0.0� 8�5 0.00 0.0� �.�� ***
*** p<0.0�, ** p<0.05, * p<0.�
Source: Prepared by the authors.
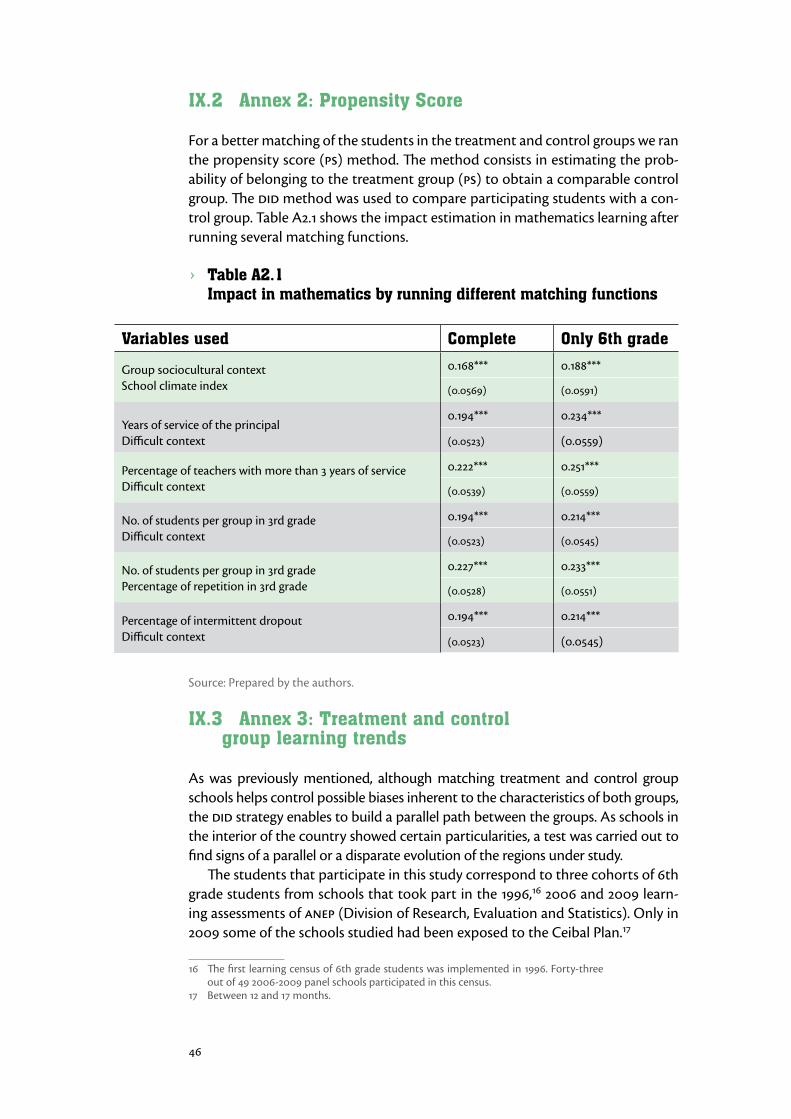
�6
IX.2 Annex 2: Propensity Score
For a better matching of the students in the treatment and control groups we ran the propensity score (ps) method. The method consists in estimating the prob-ability of belonging to the treatment group (ps) to obtain a comparable control group. The did method was used to compare participating students with a con-trol group. Table A�.� shows the impact estimation in mathematics learning after running several matching functions.
› Table A2.1 Impact in mathematics by running different matching functions
Variables used Complete Only 6th grade
Group sociocultural contextSchool climate index
0.�68*** 0.�88***
(0.0569) (0.059�)
Years of service of the principalDifficult context
0.�9�*** 0.���***
(0.05��) (0.0559)
Percentage of teachers with more than � years of serviceDifficult context
0.���*** 0.�5�***
(0.05�9) (0.0559)
No. of students per group in �rd gradeDifficult context
0.�9�*** 0.���***
(0.05��) (0.05�5)
No. of students per group in �rd gradePercentage of repetition in �rd grade
0.���*** 0.���***
(0.05�8) (0.055�)
Percentage of intermittent dropoutDifficult context
0.�9�*** 0.���***
(0.05��) (0.05�5)
Source: Prepared by the authors.
IX.3 Annex 3: Treatment and control group learning trends
As was previously mentioned, although matching treatment and control group schools helps control possible biases inherent to the characteristics of both groups, the did strategy enables to build a parallel path between the groups. As schools in the interior of the country showed certain particularities, a test was carried out to find signs of a parallel or a disparate evolution of the regions under study.
The students that participate in this study correspond to three cohorts of 6th grade students from schools that took part in the �996,�6 �006 and �009 learn-ing assessments of anep (Division of Research, Evaluation and Statistics). Only in �009 some of the schools studied had been exposed to the Ceibal Plan.��
�6 The first learning census of 6th grade students was implemented in �996. Forty-three out of �9 �006-�009 panel schools participated in this census.
�� Between �� and �� months.
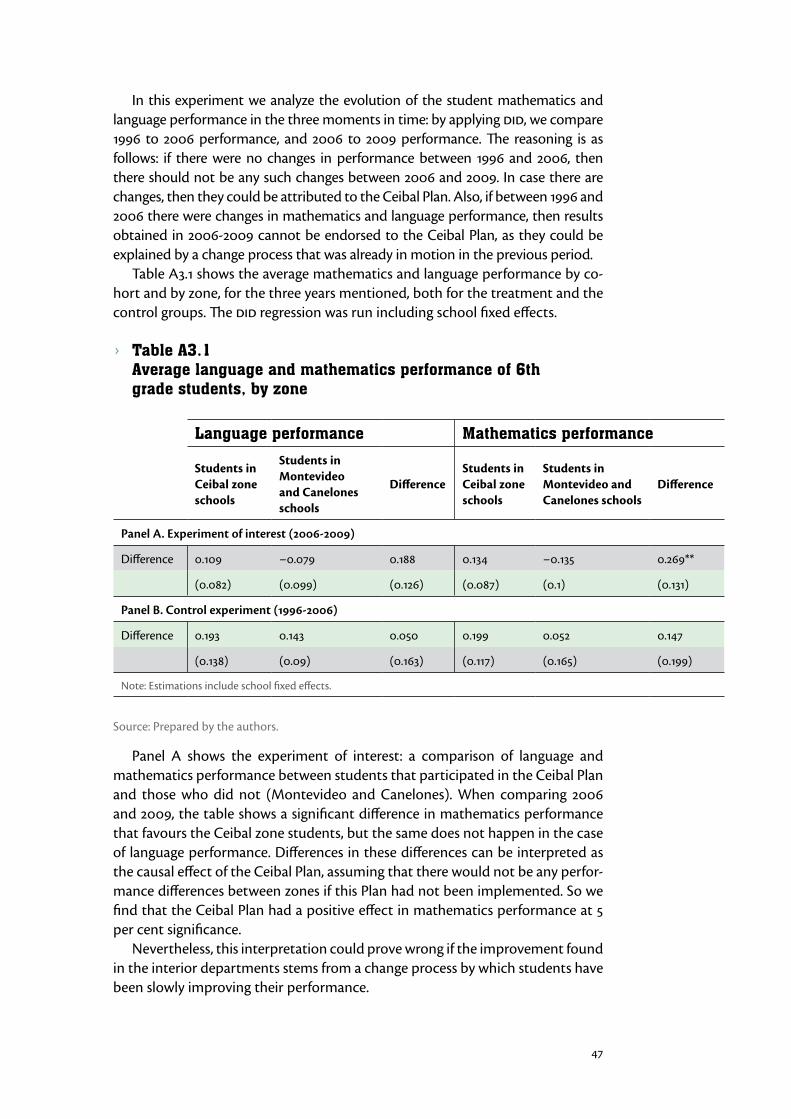
��
In this experiment we analyze the evolution of the student mathematics and language performance in the three moments in time: by applying did, we compare �996 to �006 performance, and �006 to �009 performance. The reasoning is as follows: if there were no changes in performance between �996 and �006, then there should not be any such changes between �006 and �009. In case there are changes, then they could be attributed to the Ceibal Plan. Also, if between �996 and �006 there were changes in mathematics and language performance, then results obtained in �006-�009 cannot be endorsed to the Ceibal Plan, as they could be explained by a change process that was already in motion in the previous period.
Table A�.� shows the average mathematics and language performance by co-hort and by zone, for the three years mentioned, both for the treatment and the control groups. The did regression was run including school fixed effects.
› Table A3.1 Average language and mathematics performance of 6th
grade students, by zone
Language performance Mathematics performance
Students in Ceibal zone schools
Students in Montevideo and Canelones schools
DifferenceStudents in Ceibal zone schools
Students in Montevideo and Canelones schools
Difference
Panel A. Experiment of interest (2006-2009)
Difference 0.�09 −0.0�9 0.�88 0.��� −0.��5 0.�69**
(0.08�) (0.099) (0.��6) (0.08�) (0.�) (0.���)
Panel B. Control experiment (1996-2006)
Difference 0.�9� 0.��� 0.050 0.�99 0.05� 0.���
(0.��8) (0.09) (0.�6�) (0.���) (0.�65) (0.�99)
Note: Estimations include school fixed effects.
Source: Prepared by the authors.
Panel A shows the experiment of interest: a comparison of language and mathematics performance between students that participated in the Ceibal Plan and those who did not (Montevideo and Canelones). When comparing �006 and �009, the table shows a significant difference in mathematics performance that favours the Ceibal zone students, but the same does not happen in the case of language performance. Differences in these differences can be interpreted as the causal effect of the Ceibal Plan, assuming that there would not be any perfor-mance differences between zones if this Plan had not been implemented. So we find that the Ceibal Plan had a positive effect in mathematics performance at 5 per cent significance.
Nevertheless, this interpretation could prove wrong if the improvement found in the interior departments stems from a change process by which students have been slowly improving their performance.
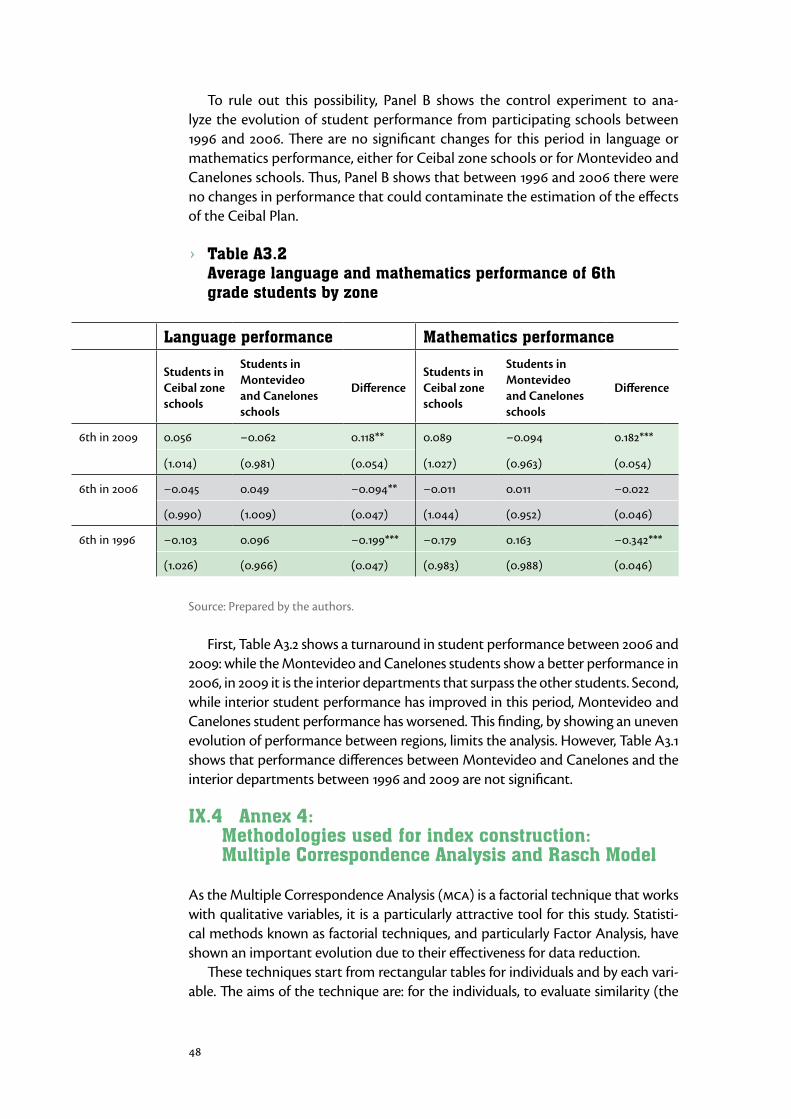
�8
To rule out this possibility, Panel B shows the control experiment to ana-lyze the evolution of student performance from participating schools between �996 and �006. There are no significant changes for this period in language or mathematics performance, either for Ceibal zone schools or for Montevideo and Canelones schools. Thus, Panel B shows that between �996 and �006 there were no changes in performance that could contaminate the estimation of the effects of the Ceibal Plan.
› Table A3.2 Average language and mathematics performance of 6th grade students by zone
Language performance Mathematics performance
Students in Ceibal zone schools
Students in Montevideo and Canelones schools
DifferenceStudents in Ceibal zone schools
Students in Montevideo and Canelones schools
Difference
6th in �009 0.056 −0.06� 0.��8** 0.089 −0.09� 0.�8�***
(�.0��) (0.98�) (0.05�) (�.0��) (0.96�) (0.05�)
6th in �006 −0.0�5 0.0�9 −0.09�** −0.0�� 0.0�� −0.0��
(0.990) (�.009) (0.0��) (�.0��) (0.95�) (0.0�6)
6th in �996 −0.�0� 0.096 −0.�99*** −0.��9 0.�6� −0.���***
(�.0�6) (0.966) (0.0��) (0.98�) (0.988) (0.0�6)
Source: Prepared by the authors.
First, Table A�.� shows a turnaround in student performance between �006 and �009: while the Montevideo and Canelones students show a better performance in �006, in �009 it is the interior departments that surpass the other students. Second, while interior student performance has improved in this period, Montevideo and Canelones student performance has worsened. This finding, by showing an uneven evolution of performance between regions, limits the analysis. However, Table A�.� shows that performance differences between Montevideo and Canelones and the interior departments between �996 and �009 are not significant.
IX.4 Annex 4: Methodologies used for index construction: Multiple Correspondence Analysis and Rasch Model
As the Multiple Correspondence Analysis (mca) is a factorial technique that works with qualitative variables, it is a particularly attractive tool for this study. Statisti-cal methods known as factorial techniques, and particularly Factor Analysis, have shown an important evolution due to their effectiveness for data reduction.
These techniques start from rectangular tables for individuals and by each vari-able. The aims of the technique are: for the individuals, to evaluate similarity (the

�9
closer their values in the variable set, the more similar two individuals are); for the variables, to evaluate relationship (proximity is assessed by the number of individu-als these variables simultaneously share). Another aim is to reduce the space of analysis with the minimum possible information loss. This is possible because this is a technique that projects the original data cloud to a smaller space, where the distance between the original data points and the projections is minimal.
In practice, the technique entails looking for a series of orientations known as factorial axes. Each orientation provides a maximum inertia of the data cloud in relation to the centroid.�8 Once the first axis is defined, the following must be orthogonally located. Thus, factorial axes describe the data in the cloud while avoiding redundancy (i.e., they are non-correlated).
The mca starts with a set of individuals to be analyzed by a group of qualita-tive variables. Thus, the analysis includes the individuals, the variables and their modalities (i.e., their different defining categories). Table A�.� shows the percent-age of inertia explained and each of the indexes created with mca.
› Table A4.1 Percentage of inertia of the 2006 and 2009 indexes
Indexes
2006 2009
Name% of inertia explained
Mean difference between treatment and control groups
% of inertia explained
Mean difference between treatment and control groups
Students
School climate �6.�9 −0.��9*** RH0 �6.�� −0.0�0 NRH0
Support with school work 86.� −0.��6*** RH0 �5.86 −0.���** RH0
Family
Satisfaction with school 95.� 0.���*** RH0 9�.09 0.�5�*** RH0
Involvement with school 55.�� 0.��0*** RH0 5�.� 0.0��� NRH0
Teachers
Teacher satisfaction 5�.�9 0.���*** RH0 6� 0.���*** RH0
Education climate 60.9� 0.��6*** RH0 ��.6� 0.�6�*** RH0
Violence 80.�6 0.���*** RH0 66.9� 0.�56*** RH0
Discrimination �8.8� −0.���*** RH0 86.09 −0.�89*** RH0
�8.8� −0.���*** RH0 86.09 −0.�89*** RH0
Source: Prepared by the authors.
�8 The notion of inertia of a data cloud in relation to the centroid goes parallel to the statistical notion of the variance of a variable in relation to the mean. In mca the total inertia equals K/J-�.
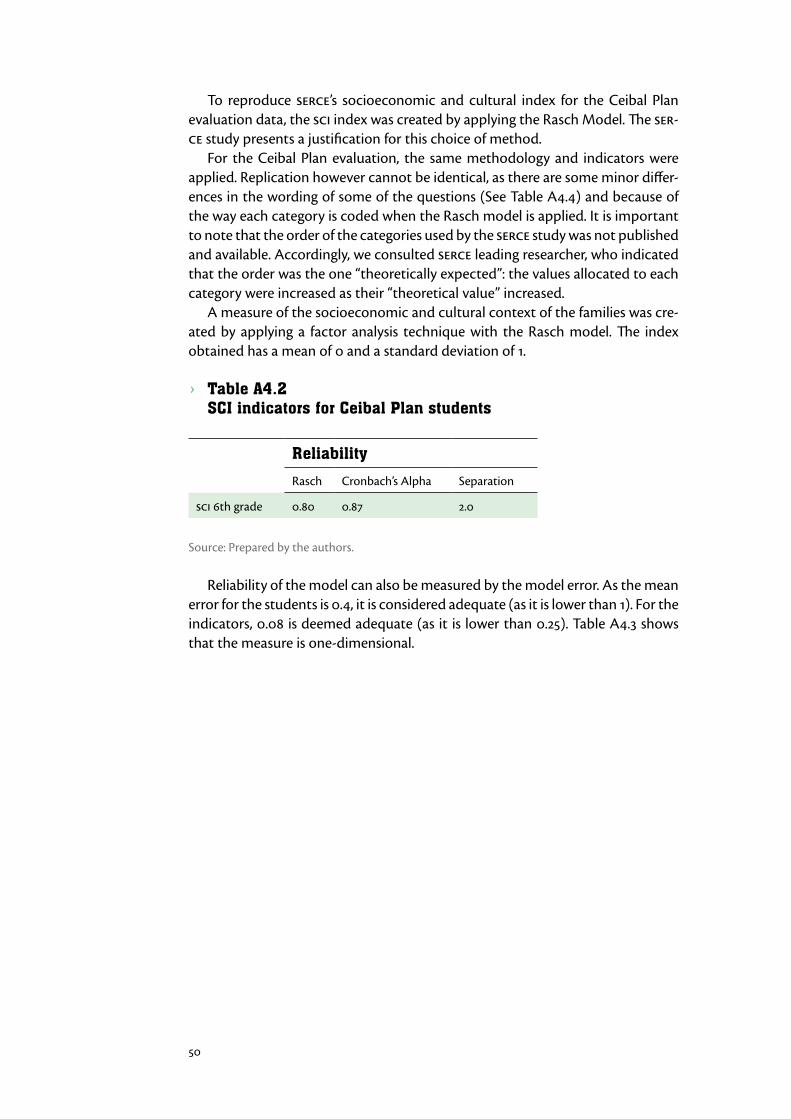
50
To reproduce serce’s socioeconomic and cultural index for the Ceibal Plan evaluation data, the sci index was created by applying the Rasch Model. The ser-ce study presents a justification for this choice of method.
For the Ceibal Plan evaluation, the same methodology and indicators were applied. Replication however cannot be identical, as there are some minor differ-ences in the wording of some of the questions (See Table A�.�) and because of the way each category is coded when the Rasch model is applied. It is important to note that the order of the categories used by the serce study was not published and available. Accordingly, we consulted serce leading researcher, who indicated that the order was the one “theoretically expected”: the values allocated to each category were increased as their “theoretical value” increased.
A measure of the socioeconomic and cultural context of the families was cre-ated by applying a factor analysis technique with the Rasch model. The index obtained has a mean of 0 and a standard deviation of �.
› Table A4.2 SCI indicators for Ceibal Plan students
Reliability
Rasch Cronbach’s Alpha Separation
sci 6th grade 0.80 0.8� �.0
Source: Prepared by the authors.
Reliability of the model can also be measured by the model error. As the mean error for the students is 0.�, it is considered adequate (as it is lower than �). For the indicators, 0.08 is deemed adequate (as it is lower than 0.�5). Table A�.� shows that the measure is one-dimensional.

5�
› Table A4.3 One-dimensional measure
Empirical Model
Total raw variance in observations ��.5 �00.0 % �00.0 %
Raw variance explained by measures ��.5 �9.5 % 5�.0 %
Raw variance explained by persons ��.� �0.� % ��.� %
Raw variance explained by items 8.� �9.� % �0.� %
Raw unexplained variance (total) ��.0 50.5 % �00.0 % �8.0 %
Unexplained variance in �st contrast = �.0 �.5 % 8.9 %
Unexplained variance in �nd contrast = �.5 �.5 % �.0 %
Unexplained variance in �rd contrast = �.� �.9 % 5.� %
Unexplained variance in �th contrast = �.� �.8 % 5.6 %
Unexplained variance in 5th contrast = �.� �.� % 5.� %
Source: Prepared by the authors.
› Table A4.4 Comparison of family questionnaires to build the children’s socioeconomic and cultural context index
SERCE CEIBAL
P�. What is the highest level of education of the following people? Father / MotherAlternatives:�. Did not study�. Primary incomplete�. Primary complete�. Secondary incomplete5. Secondary complete6. Higher or university incomplete�. Higher or university complete
P��. What is the highest level of education of the following people? Father or male referent / Mother or female referent�. Never attended school�. Primary incomplete �. Primary complete �. Lower secondary incomplete (first � secondary school years or techni-cal school)5. Lower secondary complete (first � secondary school or technical school years)6. Secondary incomplete (� or 5 secondary or technical school years)�. Secondary complete (6 secondary or technical school years)8. Higher incomplete9. Higher complete�0. Does not know
P5. What was the student’s mother language?�. Spanish or Portuguese�. Foreign language�. Indigenous language ��. Indigenous language �5. Other indigenous language
Was not asked because it did not apply to Uruguay

5�
SERCE CEIBAL
P8. What is the material used for most of the floors in your home?�. Parquet, polished wood or carpet�. Tile, ceramic or similar�. Cement�. Dirt5. Unpolished wooden boards
P��. What is the material used for most of the floors in your home?�. Parquet, polished wood or carpet�. Tile, ceramic or similar�. Cement�. Dirt5. Unpolished wooden boards
P9. Which of the following services are availa-ble in your home?�. Electric power�. Drinking water�. Sewage�. Telephone5. Cable or satellite TV 6. Internet
P�6. Is there electric power in this home?P��. How does water get to the home?�. Internal pipes�. External pipes�. OtherP�5. The sewage system is:�. National system (ose)�. Septic tank, cesspit�. There is no sewage systemP��. Is there any of the following appliances at home? Fixed telephone Cable TV Broadband internet connection or antenna (other than Ceibal) Dial-up internet connection
P�0. Which of the following are present at home?�. Colour TV �. Radio�. Stereo�. vcr5. dvd or vhs player6. Computer�. Cell phone8. Fridge9. Stove (electric or gas)�0. Microwave��. Washing machine��. Clothes dryer��. Dishwasher��. Car�5. Motorcycle
P��. Does this house have any of the following appliances? Colour TVRadio and/or stereovhs or dvd player Common computer (other than Ceibal) Laptop (other than Ceibal) Cell phone Fridge freezer Stove Microwave Automatic washing machine Dishwasher Water heater
P��. How many books are there at home? Include all kinds of books: poetry, novels, dic-tionaries, textbooks, etc.�. There are no books�. Less than �0�. Between �0 and 50 �. More than 50
P�5. Approximately how many books are there at home?�. None�. Less than �0�. Between �0 and 50 �. More than 50
Source: Prepared by the authors.