Embed Size (px)
Citation preview

LEARNING WITH MINITAB
Chapter 8 SESSION ONE: MINITAB BASICS
MOREHEAD STATE UNIVERSITY
IET603: STATISTICAL QUALITY ASSURANCE IN SCIENCE AND TECHNOLOGY
DR. AHMAD ZARGARI
22 MARCH 2014
Laura M Williams, RN, CLNC, MSN

“THE STORY OF POPLAR CLONE 252”
~ A PRACTICAL USE FOR MINITAB ~
MINITAB allows for data analysis on various projects.
In this example, researchers have employed a data analyst to
determine how Poplar trees from genetically identical cells grow
in different environments:
SITE 1 SITE 2
by a creek with rich well-drained soil dry, sandy soil
GETTING STARTED … START MINITAB & OPEN A WORKSHEET

SO MANY CHOICES …
Dozens of worksheets are included in the MINITAB software in the DATA folder …
Make sure :
the file type is a MINITAB worksheet (*.mtw)
the current subdirectory is DATA
select Poplar1
HINT: Click on this tab
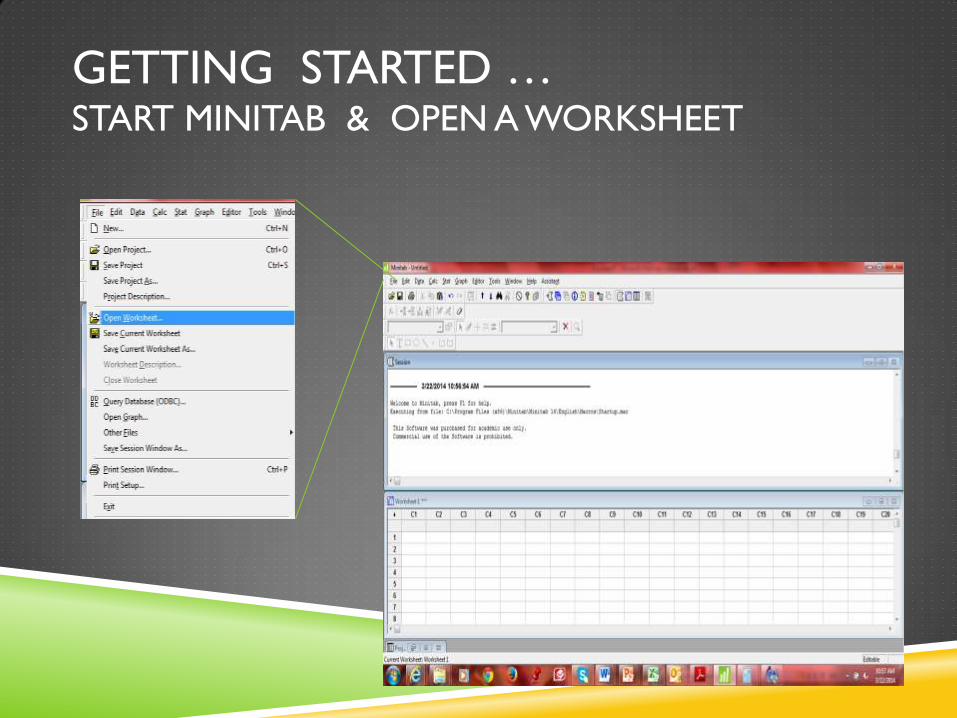
SELECTING THE DATA FILE
Allow data from Poplar1 Worksheet
to be added to your current
worksheet …
… and you will have pre-entered data to work with!
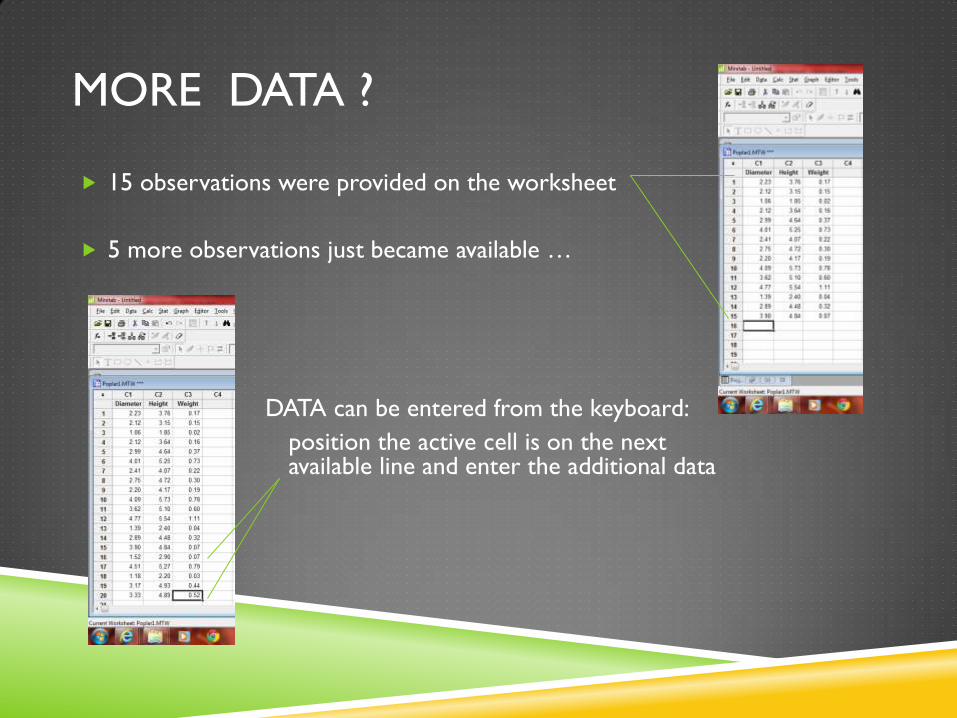
MORE DATA ?
15 observations were provided on the worksheet
5 more observations just became available …
DATA can be entered from the keyboard:
position the active cell is on the next available line and enter the additional data

PATTERNED DATA …
Let’s create a variable (“SITE”) which will indicate if the observation was
from “Environment 1” or from “Environment 2” …
Choose Calc Make Patterned Data Simple Set of Numbers

STORE THE PATTERNED DATA …
The new variable (called “SITE”) will have ten 1’s followed by ten 2’s
MINITAB will automatically assign “SITE” to
the next available cell … in this case, C4
To indicate the beginning and end of the
sequence, type “1” in “from first value” and
type “2” in “to last value”
Since we have ten 1’s and ten 2’s, in “List
each value,” type “10”
CLICK OK

A NEW COLUMN …
A new Site column appears in the active window.
Now …. this is a good time to save our project!
Choose: File Save Project
Enter File Name: POPLAR1
Click SAVE
When prompted to replace
existing file, click YES

COMPUTING DESCRIPTIVE STATISTICS
Stat Basic Statistics Display Descriptive Statistics

SEPARATE SUMMARY TABLES
We’re going to create separate summary tables for the trees at each site
describing the three variables: diameter, height, and weight.
Highlight the 3 variables and click select

SEPARATION BY SITE
To separate the statistics by site, select C4 SITE for the window
designated for “By Variable”
OPPORTUNITY TO CREATE A GRAPH
Click Graph to select from 4 display options

GRAPH SELECTION
Select “Boxplot of Data” and click OK for both windows

THE NUMBERS
MINITAB will separate the data by
the three variables, and will again
separate the individual variable
statistics by the site

THE PICTURES
Because we selected a visual representation, MINITAB also
displays the graph selected – making it very easy to see that SITE
2 is producing thicker, taller, and heavier Poplar trees

A RECAP
So far, this is what we have done ….
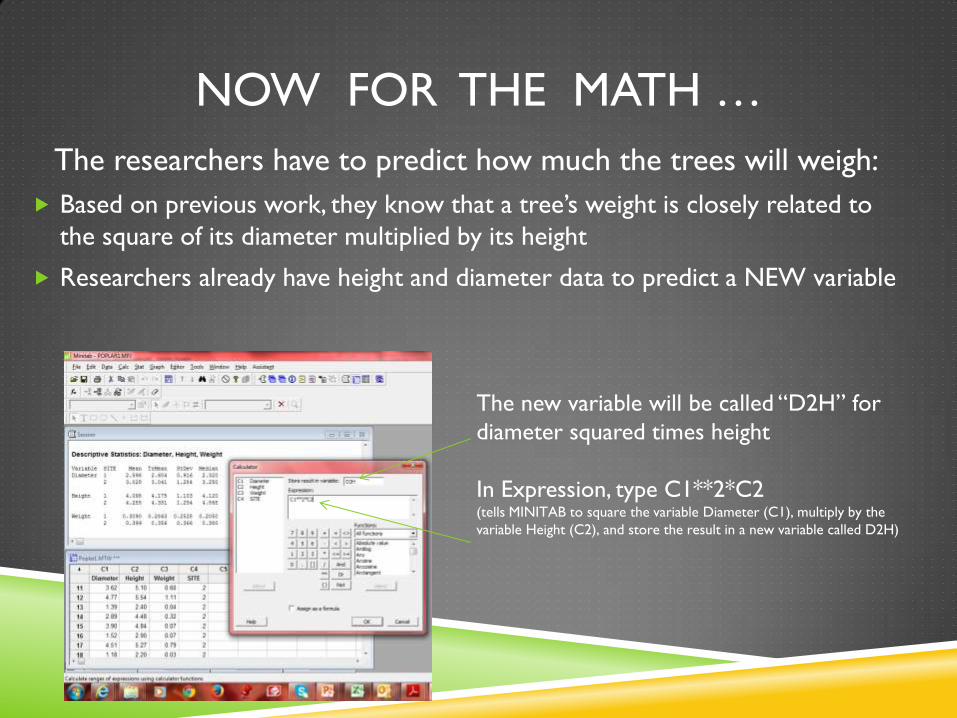
NOW FOR THE MATH …
The researchers have to predict how much the trees will weigh:
Based on previous work, they know that a tree’s weight is closely related to
the square of its diameter multiplied by its height
Researchers already have height and diameter data to predict a NEW variable
The new variable will be called “D2H” for
diameter squared times height
In Expression, type C1**2*C2 (tells MINITAB to square the variable Diameter (C1), multiply by the
variable Height (C2), and store the result in a new variable called D2H)

THE NEW DATA WINDOW
New column C5 added, showing prediction calculations made …

ORDERING THE SCATTERPLOT
Another graph is needed at this point to provide an easy to interpret
visual showing the correlation between the current weight and the
predicted weight.
Choose Graph Scatterplot THEN
Select the desired Scatterplot
Enter the Y and X Variables
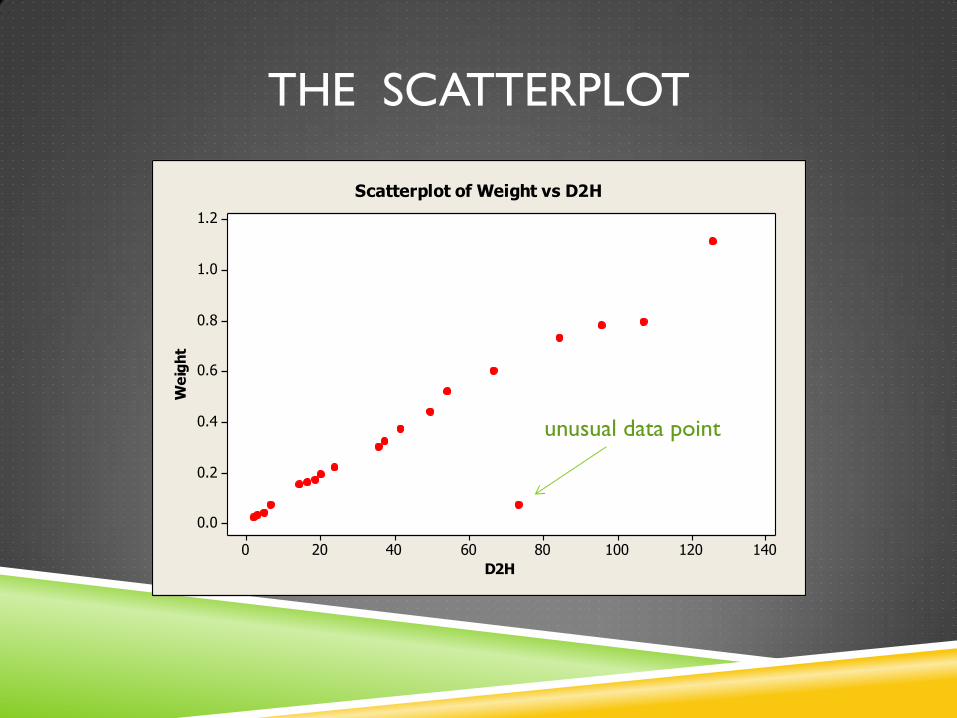
THE SCATTERPLOT
140120100806040200
1.2
1.0
0.8
0.6
0.4
0.2
0.0
D2H
We
igh
tScatterplot of Weight vs D2H
unusual data point

IS THERE A CORRELATION ?
Back to the basics ….
Stat Basic Statistics Correlation
In Variables, enter Weight AND D2H
Click OK

SESSION WINDOW OUTPUT
The correlation coefficient measures the linear relationship between two variables and assumes
a value between -1 and +1. The high POSITIVE correlation coefficient of 0.913 is close to 1,
showing a strong relationship between Weight and D2H for the trees in this sample.

NOW – LET’S EDIT THE SESSION WINDOW
FOR AN APPROPRIATE REPORT
Select Editor and make sure that the session
window can be edited
CLEAN UP THE SESSION WINDOW
Delete ALL the text not relevant to a report
Insert appropriate comments for identification

THE FINAL PRODUCT

THAT’S A WRAP… SAVE IT – PRINT IT – CLOSE IT
SAVE IT!!!
PRINT IT:
File Print Session
AND
Window Manage Graphs
Select the 4 graphs
Click Print
Click OK
CLOSE IT