Embed Size (px)
Citation preview

Learning user preferences for 2CP-regression for a
recommender system
Alan Eckhardt, Peter Vojtáš
Department of Software Engineering,
Charles University in Prague,
Czech Republic

SOFSEM 2010, Špindlerův mlýv, Czech Republic, 23.-29.1.2010
Outline
Motivation User model Peak and 2CP Experiments Conclusion and future work

SOFSEM 2010, Špindlerův mlýv, Czech Republic, 23.-29.1.2010
User preference learning
Helping the user to find what she looks for E.g. notebooks
A small amount of information required from the user Ratings of notebooks,...
Construction of a general user preference model Each user has his/her own preference model
Recommendation of the top k notebooks to the user Which the preference model has chosen as the most
preferred for the user
SOFSEM 2010, Špindlerův mlýv, Czech Republic, 23.-29.1.2010
User preference learning
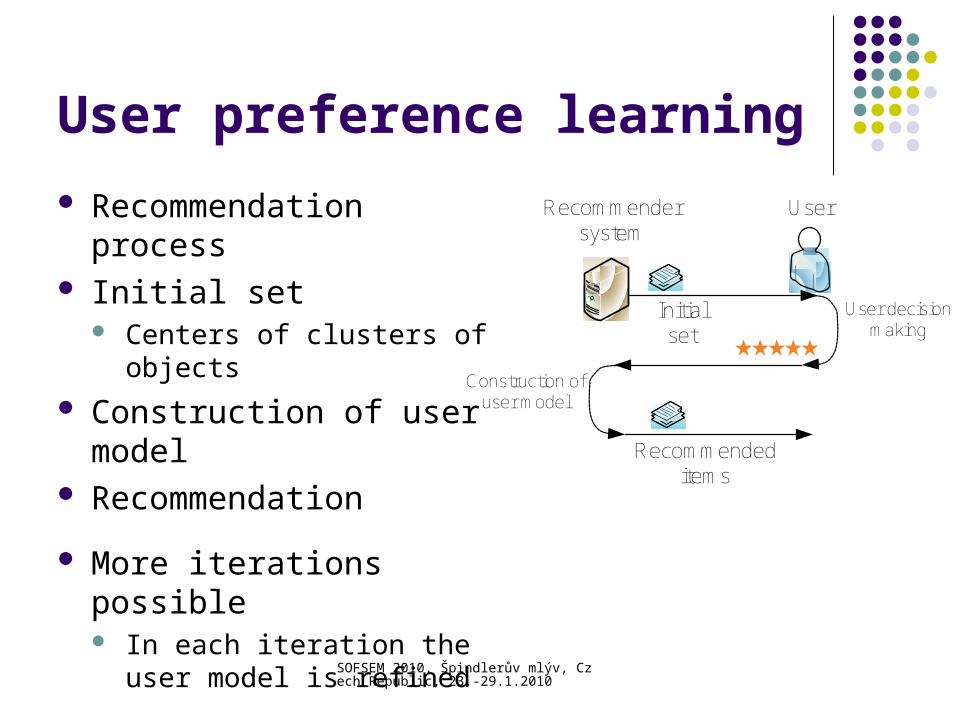
Recommendation process Initial set
Centers of clusters of objects
Construction of user model
Recommendation
More iterations possible In each iteration the user
model is refined
Initial set
Recommendersystem
User
Construction of user model
User decision making
Recommended items

SOFSEM 2010, Špindlerův mlýv, Czech Republic, 23.-29.1.2010
Two step user model
User model learning is divided into two steps1. Local preferences - normalization of the
attribute values of notebooks to their preference degrees
Transforms the space into [0,1]N
2. Global preferences - aggregation of preference degrees of attribute values into the predicted rating
1,0: iAi Df
1,01,0:@ N
iAD
SOFSEM 2010, Špindlerův mlýv, Czech Republic, 23.-29.1.2010
User model
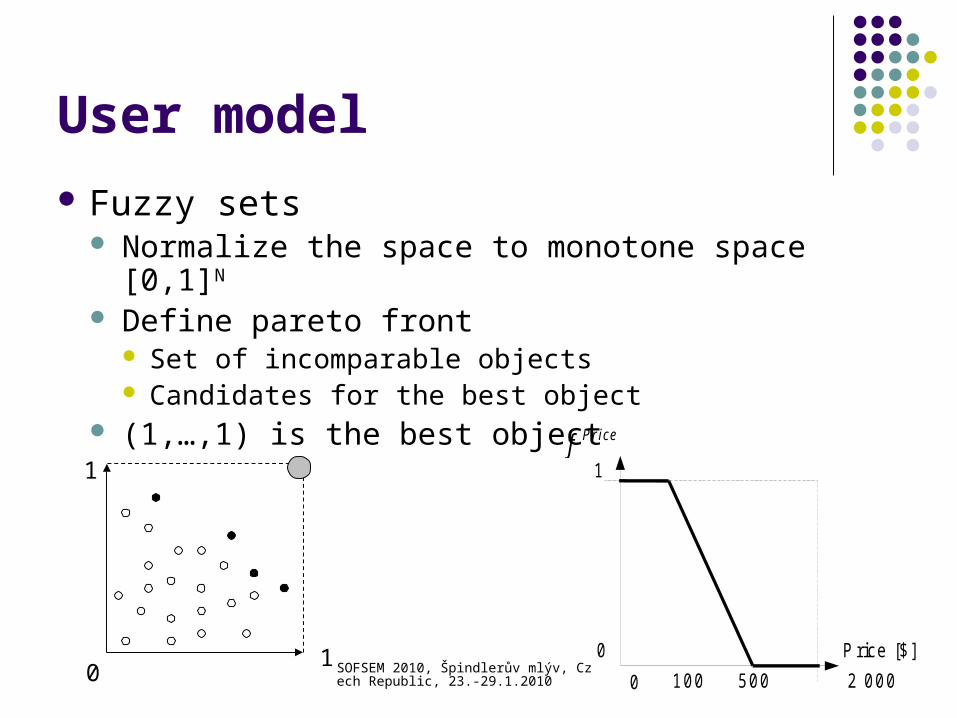
Fuzzy sets Normalize the space to monotone space [0,1]N
Define pareto front Set of incomparable objects Candidates for the best object
(1,…,1) is the best object1
500
0
0
f Price
2 000
Price [$]
100
1
10

SOFSEM 2010, Špindlerův mlýv, Czech Republic, 23.-29.1.2010
User model
Aggregation Resolves the best object from pareto front The second best object may not be on
pareto front Two methods – Statistical and Instances
9
Price_U*3CPU_U *1_UR*5
Price_U ,CPU_U ,RAM_U@
111
111
AM
1
10
1st best
2nd best
SOFSEM 2010, Špindlerův mlýv, Czech Republic, 23.-29.1.2010
Normalization of numerical attributes
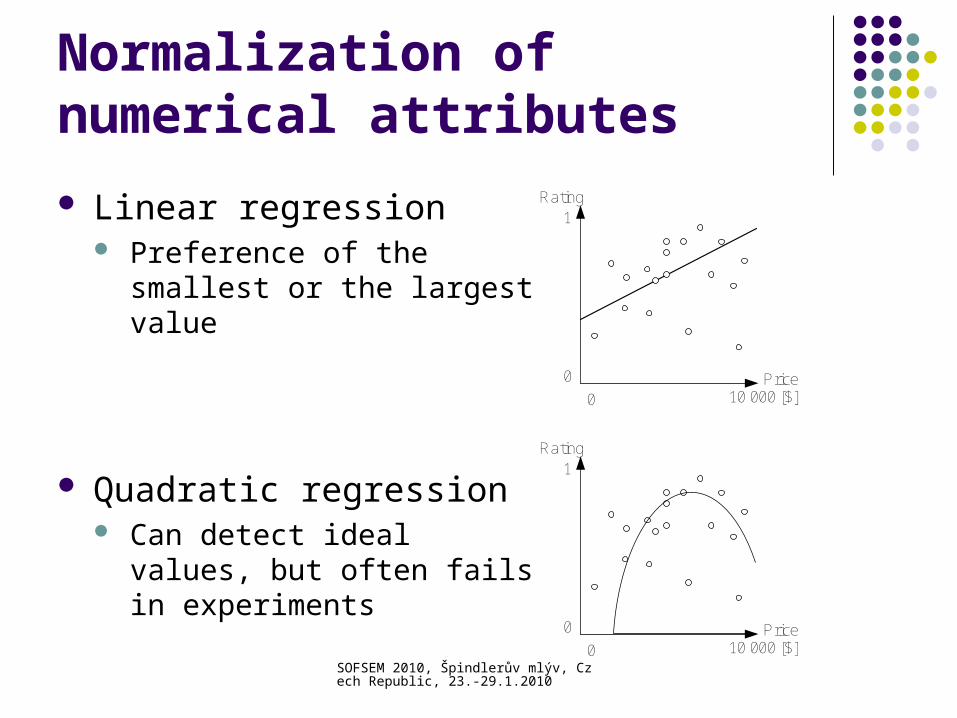
Linear regression Preference of the smallest or
the largest value
Quadratic regression Can detect ideal values, but
often fails in experiments
0
0
1
10 000 [$]
Rating
Price
0
0
1
10 000 [$]
Rating
Price

SOFSEM 2010, Špindlerův mlýv, Czech Republic, 23.-29.1.2010
2CP regression
Preference dependence between attributes This is not a dependence
in the dataset (e.g. the resolution of display influences the price)
The influence of the value of attribute A1 on the preference of attribute A2
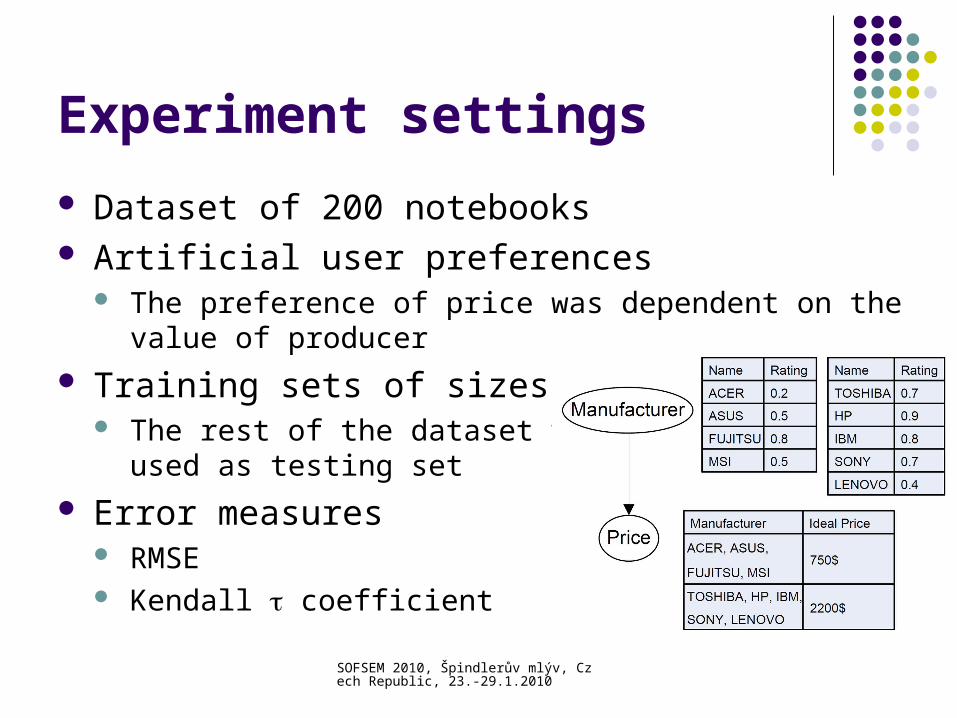
Manufacturer
Price
Name
ACER
ASUS
FUJITSU
MSI
Name
TOSHIBA
HP
IBM
SONY
LENOVO
ACER, ASUS,
FUJITSU, MSI
TOSHIBA, HP, IBM,
SONY, LENOVO 2200$
750$
Rating
0.2
0.5
0.8
0.5
Rating
0.7
0.9
0.8
0.7
0.4
Manufacturer Ideal Price
E.g. the value of the producer (IBM) of a notebook influence the preference of the price of the notebook (for IBM, the ideal price is 2200$).
SOFSEM 2010, Špindlerův mlýv, Czech Republic, 23.-29.1.2010
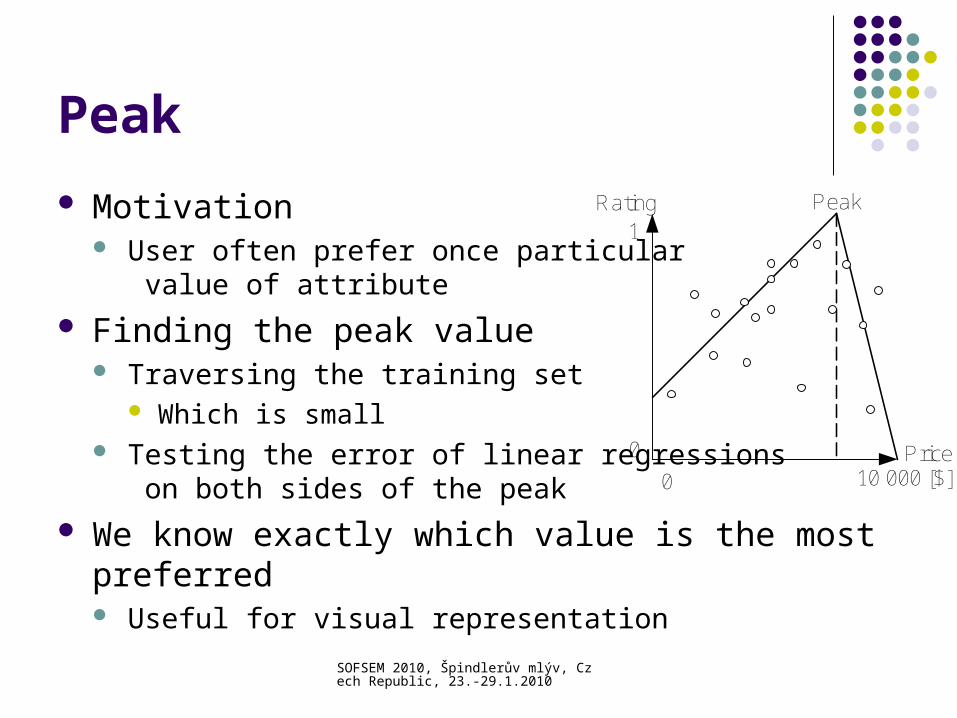
Peak
Motivation User often prefer once particular
value of attribute
Finding the peak value Traversing the training set
Which is small Testing the error of linear regressions
on both sides of the peak
We know exactly which value is the most preferred Useful for visual representation
0
0
1
10 000 [$]
PeakRating
Price

SOFSEM 2010, Špindlerův mlýv, Czech Republic, 23.-29.1.2010
2CP regression+Peak
Dependence of price on the value of manufacturer ACER => High price ASUS => Lower price
Manufacturer
Price
Name
ASUS
Name
ACER
SOFSEM 2010, Špindlerův mlýv, Czech Republic, 23.-29.1.2010
Experiment settings
Dataset of 200 notebooks Artificial user preferences
The preference of price was dependent on the value of producer
Training sets of sizes 2-60 The rest of the dataset was
used as testing set
Error measures RMSE Kendall coefficient
SOFSEM 2010, Špindlerův mlýv, Czech Republic, 23.-29.1.2010
Experiment settings
Tested methods Support Vector Machines from Weka Mean – returns the average rating from the training set Instances – classification, uses objects from the training as
boundaries on rating Statistical – weighted average with learned weights
2CP Both Instances and Statistical can use local preference
normalization – Linear, Quadratic, Peak 2CP serves to find the relation between the preference of an
attribute value and the value of another

SOFSEM 2010, Špindlerův mlýv, Czech Republic, 23.-29.1.2010
Experiment results

SOFSEM 2010, Špindlerův mlýv, Czech Republic, 23.-29.1.2010
Experiment results

SOFSEM 2010, Špindlerův mlýv, Czech Republic, 23.-29.1.2010
Experiment results

SOFSEM 2010, Špindlerův mlýv, Czech Republic, 23.-29.1.2010
Conclusion
Proposal of method Peak Combination with 2CP Experimental evaluation with very good
results Using rank correlation measure

SOFSEM 2010, Špindlerův mlýv, Czech Republic, 23.-29.1.2010
Future work
nCP-regression Clustering of similar values for better
robustness Degree of relation between two attributes