Embed Size (px)
Citation preview
Journal of Machine Learning Research 7 (2006) 2721-2744 Submitted 3/06; Revised 9/06; Published 12/06
Learning to Detect and Classify Malicious Executables in the Wild∗
J. Zico Kolter [email protected]
Department of Computer ScienceStanford UniversityStanford, CA 94305-9025, USA
Marcus A. Maloof [email protected]
Department of Computer ScienceGeorgetown UniversityWashington, DC 20057-1232, USA
Editor: Richard Lippmann
AbstractWe describe the use of machine learning and data mining to detect and classify malicious exe-cutables as they appear in the wild. We gathered 1,971 benign and 1,651 malicious executablesand encoded each as a training example using n-grams of byte codes as features. Such processingresulted in more than 255 million distinct n-grams. After selecting the most relevant n-grams forprediction, we evaluated a variety of inductive methods, including naive Bayes, decision trees, sup-port vector machines, and boosting. Ultimately, boosted decision trees outperformed other methodswith an area under the ROC curve of 0.996. Results suggest that our methodology will scale to largercollections of executables. We also evaluated how well the methods classified executables basedon the function of their payload, such as opening a backdoor and mass-mailing. Areas under theROC curve for detecting payload function were in the neighborhood of 0.9, which were smallerthan those for the detection task. However, we attribute this drop in performance to fewer trainingexamples and to the challenge of obtaining properly labeled examples, rather than to a failing ofthe methodology or to some inherent difficulty of the classification task. Finally, we applied detec-tors to 291 malicious executables discovered after we gathered our original collection, and boosteddecision trees achieved a true-positive rate of 0.98 for a desired false-positive rate of 0.05. Thisresult is particularly important, for it suggests that our methodology could be used as the basis foran operational system for detecting previously undiscovered malicious executables.
Keywords: data mining, concept learning, computer security, invasive software
1. Introduction
Malicious code is “any code added, changed, or removed from a software system to intentionallycause harm or subvert the system’s intended function” (McGraw and Morisett, 2000, p. 33). Suchsoftware has been used to compromise computer systems, to destroy their information, and to renderthem useless. It has also been used to gather information, such as passwords and credit card num-bers, and to distribute information, such as pornography, all without the knowledge of a system’s
∗. This work is based on an earlier work: Learning to Detect Malicious Executables in the Wild, in Proceedings ofthe Tenth ACM SIGKDD International Conference on Knowledge Discovery and Data Mining, c© ACM, 2004.http://doi.acm.org/10.1145/1014052.1014105.
c©2006 J. Zico Kolter and Marcus A. Maloof.
KOLTER AND MALOOF
users. As more and more novice users obtain sophisticated computers with high-speed connectionsto the Internet, the potential for further abuse is great.
Malicious executables generally fall into three categories based on their transport mechanism:viruses, worms, and Trojan horses. Viruses inject malicious code into existing programs, whichbecome “infected” and, in turn, propagate the virus to other programs when executed. Viruses comein two forms, either as an infected executable or as a virus loader, a small program that only insertsviral code. Worms, in contrast, are self-contained programs that spread over a network, usuallyby exploiting vulnerabilities in the software running on the networked computers. Finally, Trojanhorses masquerade as benign programs, but perform malicious functions. Malicious executables donot always fit neatly into these categories and can exhibit combinations of behaviors.
Excellent technology exists for detecting known malicious executables. Software for virus de-tection has been quite successful, and programs such as McAfee Virus Scan and Norton AntiVirusare ubiquitous. Indeed, Dell recommends Norton AntiVirus for all of its new systems. Althoughthese products use the word virus in their names, they also detect worms and Trojan horses.
These programs search executable code for known patterns, and this method is problematic.One shortcoming is that we must obtain a copy of a malicious program before extracting the patternnecessary for its detection. Obtaining copies of new or unknown malicious programs usually entailsthem infecting or attacking a computer system.
To complicate matters, writing malicious programs has become easier: There are virus kitsfreely available on the Internet. Individuals who write viruses have become more sophisticated,often using mechanisms to change or obfuscate their code to produce so-called polymorphic viruses(Anonymous, 2003, p. 339). Indeed, researchers have recently discovered that simple obfuscationtechniques foil commercial programs for virus detection (Christodorescu and Jha, 2003). Thesechallenges have prompted some researchers to investigate learning methods for detecting new orunknown viruses, and more generally, malicious code.
Our previous efforts to address this problem (Kolter and Maloof, 2004) resulted in a fieldedprototype, built using techniques from machine learning (e.g., Mitchell, 1997) and data mining(e.g., Hand et al., 2001). The Malicious Executable Classification System (MECS) currently detectsunknown malicious executables “in the wild,” that is, as they would appear undetected on a user’shard drive, without preprocessing or removing any obfuscation. To date, we have gathered 1,971system and non-system executables, which we will refer to as “benign” executables, and 1,651malicious executables with a variety of transport mechanisms and payloads (e.g., key-loggers andbackdoors). Although all were for the Windows operating system, it is important to note that ourapproach is not restricted to this operating system.
We extracted byte sequences from the executables, converted these into n-grams, and con-structed several classifiers: IBk, naive Bayes, support vector machines (SVMs), decision trees,boosted naive Bayes, boosted SVMs, and boosted decision trees. In this domain, there is an issue ofunequal but unknown costs of misclassification error, so we evaluated the methods using receiveroperating characteristic (ROC) analysis (Swets and Pickett, 1982), using area under the ROC curveas the performance metric. Ultimately, boosted decision trees outperformed all other methods withan area under the curve of 0.996.
We delivered MECS to the MITRE Corporation, the sponsors of this project, as a research pro-totype, and it is being used in an operational environment. Users interact with MECS through acommand line. They can add new executables to the collection, update learned models, displayROC curves, and produce a single classifier at a specific operating point on a selected ROC curve.
2722
DETECTING AND CLASSIFYING MALICIOUS EXECUTABLES
In this paper, we build upon our previous work (Kolter and Maloof, 2004) by presenting resultsthat suggest our estimates of the detection rate for malicious executables hold in an operationalenvironment. To show this, we built classifiers from our entire collection, which we gathered earlyin the summer of 2003. We then applied all of the classifiers to 291 malicious executables discoveredafter we gathered our collection. Detection rates for three different false-positive rates correspondedto results we obtained through experimentation. Boosted decision trees, for example, achieved adetect rate of 0.97 for a desired false-positive rate of 0.05.
We also present results suggesting that one can use our methodology to classify malicious exe-cutables based on their payload’s function. For example, from 520 malicious executables containinga mass-mailer, we were able to build a detector for such executables that achieved an area under theROC curve of about 0.9. Results were similar for detecting malicious executables that open back-doors and that load viruses.
With this paper, we make three main contributions. We show how to use established methodsof text classification to detect and classify malicious executables. We present empirical results froman extensive study of inductive methods for detecting and classifying malicious executables in thewild. We show that the methods achieve high detection rates, even on completely new, previouslyunseen malicious executables, which suggests this approach complements existing technologies andcould serve as the basis for an operational system.
In the three sections that follow, we describe related work, our data collection, and the methodswe applied. Then, in Sections 5–7, we present empirical results from three experiments. The firstinvolved detecting malicious executables; the second, classifying malicious executables based onthe function of their payload; and the third, evaluating fully trained methods on completely new,previously unseen malicious executables. Finally, before making concluding remarks, we discussin Section 8 our results, challenges we faced, and other approaches we considered.
2. Related Work
There have been few attempts to use machine learning and data mining for the purpose of identifyingnew or unknown malicious code (e.g., Lo et al., 1995; Kephart et al., 1995; Tesauro et al., 1996;Schultz et al., 2001; Kolter and Maloof, 2004). These have concentrated mostly on PC viruses (Loet al., 1995; Kephart et al., 1995; Tesauro et al., 1996; Schultz et al., 2001), thereby limiting theutility of such approaches to a particular type of malicious code and to computer systems runningMicrosoft’s Windows operating system. Such efforts are of little direct use for computers runningthe UNIX operating system, for which viruses pose little threat. However, the methods proposedare general, meaning that they could be applied to malicious code for any platform, and presently,malicious code for the Windows operating system poses the greatest threat, mainly because of itsubiquity.
In an early attempt, Lo et al. (1995) conducted an analysis of several programs—evidently byhand—and identified telltale signs, which they subsequently used to filter new programs. While theyattempted to extract patterns or signatures for identifying any class of malicious code, they presentedno experimental results suggesting how general or extensible their approach might be. Researchersat IBM’s T.J. Watson Research Center have investigated neural networks for virus detection (Kephartet al., 1995) and have incorporated a similar approach for detecting boot-sector viruses into IBM’sAnti-virus software (Tesauro et al., 1996).
2723

KOLTER AND MALOOF
Method TP Rate FP Rate Accuracy (%)Signature + hexdump 0.34 0.00 49.31RIPPER + DLLs used 0.58 0.09 83.61RIPPER + DLL function used 0.71 0.08 89.36RIPPER + DLL function counts 0.53 0.05 89.07Naive Bayes + strings 0.97 0.04 97.11Voting Naive Bayes + hexdump 0.98 0.06 96.88
Table 1: Results from the study conducted by Schultz et al. 2001.
More recently, instead of focusing on boot-sector viruses, Schultz et al. (2001) used data miningmethods, such as naive Bayes, to detect malicious code. The authors collected 4,301 programs forthe Windows operating system and used McAfee Virus Scan to label each as either malicious orbenign. There were 3,301 programs in the former category and 1,000 in the latter. Of the maliciousprograms, 95% were viruses and 5% were Trojan horses. Furthermore, 38 of the malicious programsand 206 of the benign programs were in the Windows Portable Executable (PE) format.
For feature extraction, the authors used three methods: binary profiling, string sequences, andso-called hex dumps. The authors applied the first method to the smaller collection of 244 executa-bles in the Windows PE format and applied the second and third methods to the full collection.
The first method extracted three types of resource information from the Windows executables:(1) a list of Dynamically Linked Libraries (DLLs), (2) function calls from the DLLs, and (3) thenumber of different system calls from each DLL. For each resource type, the authors constructedbinary feature vectors based on the presence or absence of each in the executable. For example, ifthe collection of executables used ten DLLs, then they would characterize each as a binary vector ofsize ten. If a given executable used a DLL, then they would set the entry in the executable’s vectorcorresponding to that DLL to one. This processing resulted in 2,229 binary features, and in a similarmanner, they encoded function calls and their number, resulting in 30 integer features.
The second method of feature extraction used the UNIX strings command, which shows theprintable strings in an object or binary file. The authors formed training examples by treating thestrings as binary attributes that were either present in or absent from a given executable.
The third method used the hexdump utility (Miller, 1999), which is similar to the UNIX octaldump (od -x) command. This printed the contents of the executable file as a sequence of hexadec-imal numbers. As with the printable strings, the authors used two-byte words as binary attributesthat were either present or absent.
After processing the executables using these three methods, the authors paired each extractionmethod with a single learning algorithm. Using five-fold cross-validation, they used RIPPER (Cohen,1995) to learn rules from the training set produced by binary profiling. They used naive Bayes toestimate probabilities from the training set produced by the strings command. Finally, they usedan ensemble of six naive-Bayesian classifiers on the hexdump data by training each on one-sixth ofthe lines in the output file. The first learned from lines 1, 6, 12, . . . ; the second, from lines 2, 7, 13,. . . ; and so on. As a baseline method, the authors implemented a signature-based scanner by usingbyte sequences unique to the malicious executables.
The authors concluded, based on true-positive (TP) rates, that the voting naive-Bayesian classi-fier outperformed all other methods, which appear with false-positive (FP) rates and accuracies in
2724
DETECTING AND CLASSIFYING MALICIOUS EXECUTABLES
Table 1. The authors also presented ROC curves (Swets and Pickett, 1982), but did not report theareas under these curves. Nonetheless, the curve for the single naive Bayesian classifier appears todominate that of the voting naive Bayesian classifier in most of the ROC space, suggesting that thebest performing method was actually naive Bayes trained with strings.
However, as the authors discuss, one must question the stability of DLL names, function names,and string features. For instance, one may be able to compile a source program using anothercompiler to produce an executable different enough to avoid detection. Programmers often usemethods to obfuscate their code, so a list of DLLs or function names may not be available.
The authors paired each feature extraction method with a learning method, and as a result,RIPPER was trained on a much smaller collection of executables than were naive Bayes and theensemble of naive-Bayesian classifiers. Although results were generally good, it would have beeninteresting to know how the learning methods performed on all data sets. It would have also beeninteresting to know if combining all features (i.e., strings, bytes, functions) into a single trainingexample and then selecting the most relevant would have improved the performance of the methods.
There are other methods of guarding against malicious code, such as object reconciliation(Anonymous, 2003, p. 370), which involves comparing current files and directories to past copies;one can also compare cryptographic hashes. One can also audit running programs (Soman et al.,2003) and statically analyze executables using predefined malicious patterns (Christodorescu andJha, 2003). These approaches are not based on data mining, although one could imagine the rolesuch techniques might play.
Researchers have also investigated classification methods for the determination of software au-thorship. Most notorious in the field of authorship are the efforts to determine whether Sir FrancesBacon wrote works attributed to Shakespeare (Durning-Lawrence, 1910), or who wrote the twelvedisputed Federalist Papers, Hamilton or Madison (Kjell et al., 1994). Recently, similar techniqueshave been used in the relatively new field of software forensics to determine program authorship(Spafford and Weeber, 1993). Gray et al. (1997) wrote a position paper on the subject of author-ship, whereas Krsul (1994) conducted an empirical study by gathering code from programmers ofvarying skill, extracting software metrics, and determining authorship using discriminant analysis.There are also relevant results published in the literature pertaining to the plagiarism of programs(Aiken, 1994; Jankowitz, 1988), which we will not survey here.
Krsul (1994) collected 88 programs written in the C programming language from 29 program-mers at the undergraduate, graduate, and faculty levels. He then extracted 18 layout metrics (e.g.,indentation of closing curly brackets), 15 style metrics (e.g., mean line length), and 19 structure met-rics (e.g., percentage of int function definitions). On average, Krsul determined correct authorship73% of the time. Interestingly, of the 17 most experienced programmers, he was able to determineauthorship 100% of the time. The least experienced programmers were the most difficult to classify,presumably because they had not settled into a consistent style. Indeed, they “were surprised to findthat one [programmer] had varied his programming style considerably from program to program ina period of only two months” (Krsul and Spafford, 1995, §5.1).
While interesting, it is unclear how much confidence we should have in these results. Krsul(1994) used 52 features and only one or two examples for each of the 20 classes (i.e., the authors).This seems underconstrained, especially when rules of thumb suggest that one needs ten times moreexamples than features (Jain et al., 2000). On the other hand, it may also suggest that one simplyneeds to be clever about what constitutes an example. For instance, one could presumably usefunctions as examples rather than programs, but for the task of determining authorship of malicious
2725
KOLTER AND MALOOF
programs, it is unclear whether such data would be possible to collect or if it even exists. Fortunately,as we discuss in the next section, a lack of data was not a problem for our project.
3. Data Collection
As stated previously, the data for our study consisted of 1,971 benign executables and 1,651malicious executables. All were in the Windows PE format. We obtained benign executablesfrom all folders of machines running the Windows 2000 and XP operating systems. We gath-ered additional applications from SourceForge (http://sourceforge.net) and download.com(http://www.download.com).
We obtained virus loaders, worms, and Trojan horses from the Web site VX Heavens (http://vx.netlux.org) and from computer-forensic experts at the MITRE Corporation, the sponsorsof this project. Some executables were obfuscated with compression, encryption, or both; somewere not, but we were not informed which were and which were not. For one small collection,a commercial product for detecting viruses failed to identify 18 of the 114 malicious executables.For the entire collection of 1,651 malicious executables, a commercial program failed to identify50 as malicious, even though all were known and in the public domain. Note that, for viruses, weexamined only the loader programs; we did not include infected executables in our study.
As stated previously, we gathered this collection early in the summer of 2003. Recently, weobtained 291 additional malicious executables from VX Heavens that have appeared after we tookour collection. As such, they were not part of our original collection and were not part of ourprevious study (Kolter and Maloof, 2004). These additional executables were for a real-world,online evaluation, which we motivate and discuss further in Section 7.
We used the hexdump utility (Miller, 1999) to convert each executable to hexadecimal codesin an ASCII format. We then produced n-grams, by combining each four-byte sequence into asingle term. For instance, for the byte sequence ff 00 ab 3e 12 b3, the corresponding n-gramswould be ff00ab3e, 00ab3e12, and ab3e12b3. This processing resulted in 255,904,403 distinctn-grams. One could also compute n-grams from words, something we explored and discuss furtherin Section 5.2. Using the n-grams from all of the executables, we applied techniques from textclassification, which we discuss further in the next section.
4. Classification Methodology
Our overall approach drew techniques from machine learning (e.g., Mitchell, 1997), data mining(e.g., Hand et al., 2001), and, in particular, text classification (e.g., Dumais et al., 1998; Sahamiet al., 1998). We used the n-grams extracted from the executables to form training examples byviewing each n-gram as a Boolean attribute that is either present in (i.e., T) or absent from (i.e., F)the executable. We selected the most relevant attributes (i.e., n-grams) by computing the informationgain (IG) for each:
IG( j) = ∑v j∈{0,1}
∑Ci
P(v j,Ci) logP(v j,Ci)
P(v j)P(Ci),
where Ci is the ith class, v j is the value of the jth attribute, P(v j,Ci) is the proportion that the jthattribute has the value v j in the class Ci, P(v j) is the proportion that the jth n-gram takes the valuev j in the training data, and P(Ci) is the proportion of the training data belonging to the class Ci. Thismeasure is also called average mutual information (Yang and Pederson, 1997).
2726
DETECTING AND CLASSIFYING MALICIOUS EXECUTABLES
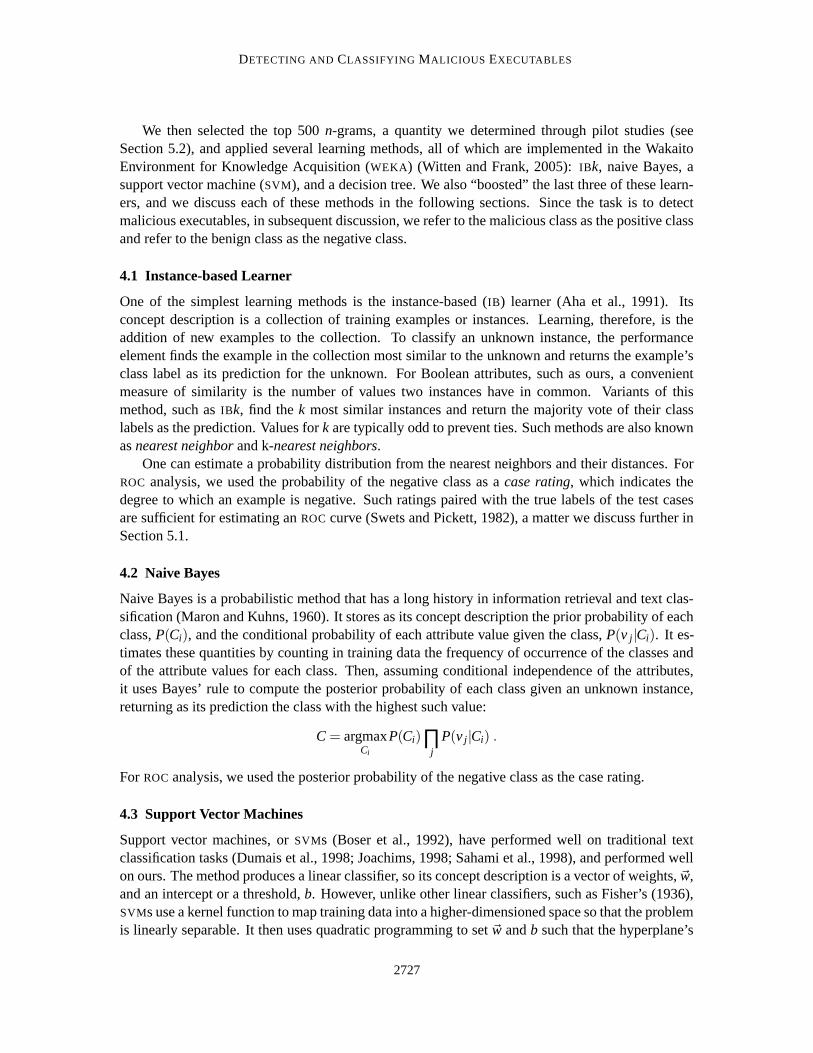
We then selected the top 500 n-grams, a quantity we determined through pilot studies (seeSection 5.2), and applied several learning methods, all of which are implemented in the WakaitoEnvironment for Knowledge Acquisition (WEKA) (Witten and Frank, 2005): IBk, naive Bayes, asupport vector machine (SVM), and a decision tree. We also “boosted” the last three of these learn-ers, and we discuss each of these methods in the following sections. Since the task is to detectmalicious executables, in subsequent discussion, we refer to the malicious class as the positive classand refer to the benign class as the negative class.
4.1 Instance-based Learner
One of the simplest learning methods is the instance-based (IB) learner (Aha et al., 1991). Itsconcept description is a collection of training examples or instances. Learning, therefore, is theaddition of new examples to the collection. To classify an unknown instance, the performanceelement finds the example in the collection most similar to the unknown and returns the example’sclass label as its prediction for the unknown. For Boolean attributes, such as ours, a convenientmeasure of similarity is the number of values two instances have in common. Variants of thismethod, such as IBk, find the k most similar instances and return the majority vote of their classlabels as the prediction. Values for k are typically odd to prevent ties. Such methods are also knownas nearest neighbor and k-nearest neighbors.
One can estimate a probability distribution from the nearest neighbors and their distances. ForROC analysis, we used the probability of the negative class as a case rating, which indicates thedegree to which an example is negative. Such ratings paired with the true labels of the test casesare sufficient for estimating an ROC curve (Swets and Pickett, 1982), a matter we discuss further inSection 5.1.
4.2 Naive Bayes
Naive Bayes is a probabilistic method that has a long history in information retrieval and text clas-sification (Maron and Kuhns, 1960). It stores as its concept description the prior probability of eachclass, P(Ci), and the conditional probability of each attribute value given the class, P(v j|Ci). It es-timates these quantities by counting in training data the frequency of occurrence of the classes andof the attribute values for each class. Then, assuming conditional independence of the attributes,it uses Bayes’ rule to compute the posterior probability of each class given an unknown instance,returning as its prediction the class with the highest such value:
C = argmaxCi
P(Ci)∏j
P(v j|Ci) .
For ROC analysis, we used the posterior probability of the negative class as the case rating.
4.3 Support Vector Machines
Support vector machines, or SVMs (Boser et al., 1992), have performed well on traditional textclassification tasks (Dumais et al., 1998; Joachims, 1998; Sahami et al., 1998), and performed wellon ours. The method produces a linear classifier, so its concept description is a vector of weights, ~w,and an intercept or a threshold, b. However, unlike other linear classifiers, such as Fisher’s (1936),SVMs use a kernel function to map training data into a higher-dimensioned space so that the problemis linearly separable. It then uses quadratic programming to set ~w and b such that the hyperplane’s
2727

KOLTER AND MALOOF
margin is optimal, meaning that the distance is maximal from the hyperplane to the closest examplesof the positive and negative classes. During performance, the method predicts the positive class if〈~w ·~x〉−b > 0 and predicts the negative class otherwise. Quadratic programming can be expensivefor large problems, but sequential minimal optimization (SMO) is a fast, efficient algorithm fortraining SVMs (Platt, 1998) and is the one implemented in WEKA (Witten and Frank, 2005). Duringperformance, this implementation computes the probability of each class (Platt, 2000), and for ROC
analysis, we used probability of the negative class as the rating.
4.4 Decision Trees
A decision tree is a rooted tree with internal nodes corresponding to attributes and leaf nodes cor-responding to class labels. For symbolic attributes, branches leading to children correspond to theattribute’s values. The performance element uses the attributes and their values of an instance totraverse the tree from the root to a leaf. It predicts the class label of the leaf node. The learningelement builds such a tree by selecting the attribute that best splits the training examples into theirproper classes. It creates a node, branches, and children for the attribute and its values, removesthe attribute from further consideration, and distributes the examples to the appropriate child node.This process repeats recursively until a node contains examples of the same class, at which point,it stores the class label. Most implementations use the gain ratio for attribute selection (Quinlan,1993), a measure based on the information gain. In an effort to reduce overtraining, most imple-mentations also prune induced decision trees by removing subtrees that are likely to perform poorlyon test data. WEKA’s J48 (Witten and Frank, 2005) is an implementation of the ubiquitous C4.5(Quinlan, 1993). During performance, J48 assigns weights to each class, and we used the weight ofthe negative class as the case rating.
4.5 Boosted Classifiers
Boosting (Freund and Schapire, 1996) is a method for combining multiple classifiers. Researchershave shown that ensemble methods often improve performance over single classifiers (Dietterich,2000; Opitz and Maclin, 1999). Boosting produces a set of weighted models by iteratively learninga model from a weighted data set, evaluating it, and reweighting the data set based on the model’sperformance. During performance, the method uses the set of models and their weights to predictthe class with the highest weight. We used the AdaBoost.M1 algorithm (Freund and Schapire, 1996)implemented in WEKA (Witten and Frank, 2005) to boost SVMs, J48, and naive Bayes. As the caserating, we used the weight of the negative class. Note that we did not apply AdaBoost.M1 to IBkbecause of the high computational expense.
5. Detecting Malicious Executables
With our methodology defined, our first task was to examine how well the learning methods de-tected malicious executables. We did so by conducting three experimental studies using a standardexperimental design. The first was a pilot study to determine the size of words and n-grams, and thenumber of n-grams relevant for prediction. With those values determined, the second experimentconsisted of applying all of the classification methods to a small collection of executables. The thirdthen involved applying the methodology to a larger collection of executables, mainly to investigatehow the approach scales.
2728

DETECTING AND CLASSIFYING MALICIOUS EXECUTABLES
5.1 Experimental Design
To evaluate the approach and methods, we used stratified ten-fold cross-validation. That is, werandomly partitioned the executables into ten disjoint sets of equal size, selected one as a testingset, and combined the remaining nine to form a training set. We conducted ten such runs using eachpartition as the testing set.
For each run, we extracted n-grams from the executables in the training and testing sets. Weselected the most relevant features from the training data, applied each classification method, andused the resulting classifier to rate the examples in the test set.
To conduct ROC analysis (Swets and Pickett, 1982), for each method, we pooled the ratings fromthe iterations of cross-validation, and used labroc4 (Metz et al., 2003) to produce an empiricalROC curve and to compute its area and the standard error of the area. With the standard error, wecomputed 95% confidence intervals (Swets and Pickett, 1982).
5.2 Pilot Studies
We conducted pilot studies to determine three parameters: the size of n-grams, the size of words,and the number of selected features. Unfortunately, due to computational requirements, we wereunable to evaluate exhaustively all methods for all settings of these parameters, so we assumed thatthe number of features would most affect performance, and began our investigation accordingly.
Using the experimental methodology described previously, we extracted bytes from 476 mali-cious executables and 561 benign executables and produced n-grams, for n = 4. (This smaller setof executables constituted our initial collection, which we later supplemented.) Using informationgain, we then selected the best 10, 20, . . . , 100, 200, . . . , 1,000, 2,000, . . . , 10,000 n-grams, andevaluated the performance of naive Bayes, SVMs, boosted SVMs, J48, and boosted J48. Selecting500 n-grams produced the best results.
We fixed the number of n-grams at 500, and varied n, the size of the n-grams. We evaluated thesame methods for n = 1,2, . . . ,10, and n = 4 produced the best results. We also varied the size ofthe words (one byte, two bytes, etc.), and results suggested that single bytes produced better resultsthan did multiple bytes.
And so by selecting the top 500 n-grams of size four produced from single bytes, we evaluatedall of the classification methods on this small collection of executables. We describe the results ofthis experiment in the next section.
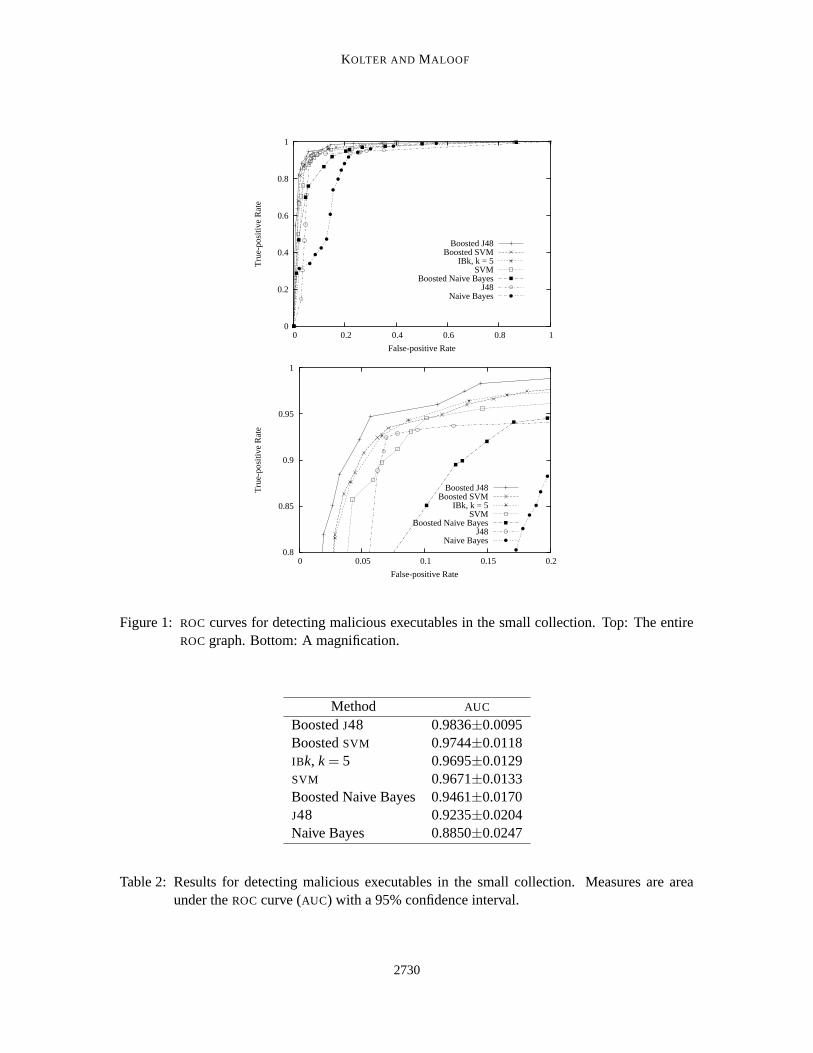
5.3 Experiment with a Small Collection
Processing the small collection of executables produced 68,744,909 distinct n-grams. Followingour experimental methodology, we used stratified ten-fold cross-validation, selected the 500 bestn-grams, and applied all of the classification methods. The ROC curves for these methods are inFigure 1, while the areas under these curves (AUC) with 95% confidence intervals are in Table 2.
As one can see, the boosted methods performed well, as did the instance-based learner andthe support vector machine. Naive Bayes did not perform as well, and we discuss this further inSection 8.
2729
KOLTER AND MALOOF
0
0.2
0.4
0.6
0.8
1
0 0.2 0.4 0.6 0.8 1
Tru
e-po
sitiv
e R
ate
False-positive Rate
Boosted J48Boosted SVM
IBk, k = 5SVM
Boosted Naive BayesJ48
Naive Bayes
0.8
0.85
0.9
0.95
1
0 0.05 0.1 0.15 0.2
Tru
e-po
sitiv
e R
ate
False-positive Rate
Boosted J48Boosted SVM
IBk, k = 5SVM
Boosted Naive BayesJ48
Naive Bayes
Figure 1: ROC curves for detecting malicious executables in the small collection. Top: The entireROC graph. Bottom: A magnification.
Method AUC
Boosted J48 0.9836±0.0095Boosted SVM 0.9744±0.0118IBk, k = 5 0.9695±0.0129SVM 0.9671±0.0133Boosted Naive Bayes 0.9461±0.0170J48 0.9235±0.0204Naive Bayes 0.8850±0.0247
Table 2: Results for detecting malicious executables in the small collection. Measures are areaunder the ROC curve (AUC) with a 95% confidence interval.
2730

DETECTING AND CLASSIFYING MALICIOUS EXECUTABLES
0
0.2
0.4
0.6
0.8
1
0 0.2 0.4 0.6 0.8 1
Tru
e-po
sitiv
e R
ate
False-positive Rate
Boosted J48SVM
Boosted SVMIBk, k = 5
Boosted Naive BayesJ48
Naive Bayes
0.85
0.9
0.95
1
0 0.05 0.1
Tru
e-po
sitiv
e R
ate
False-positive Rate
Boosted J48SVM
Boosted SVMIBk, k = 5
Boosted Naive BayesJ48
Naive Bayes
Figure 2: ROC curves for detecting malicious executables in the larger collection. Top: The entireROC graph. Bottom: A magnification.
Method AUC
Boosted J48 0.9958±0.0024SVM 0.9925±0.0033Boosted SVM 0.9903±0.0038IBk, k = 5 0.9899±0.0038Boosted Naive Bayes 0.9887±0.0042J48 0.9712±0.0067Naive Bayes 0.9366±0.0099
Table 3: Results for detecting malicious executables in the larger collection. Measures are areaunder the ROC curve (AUC) with a 95% confidence interval.
2731
KOLTER AND MALOOF
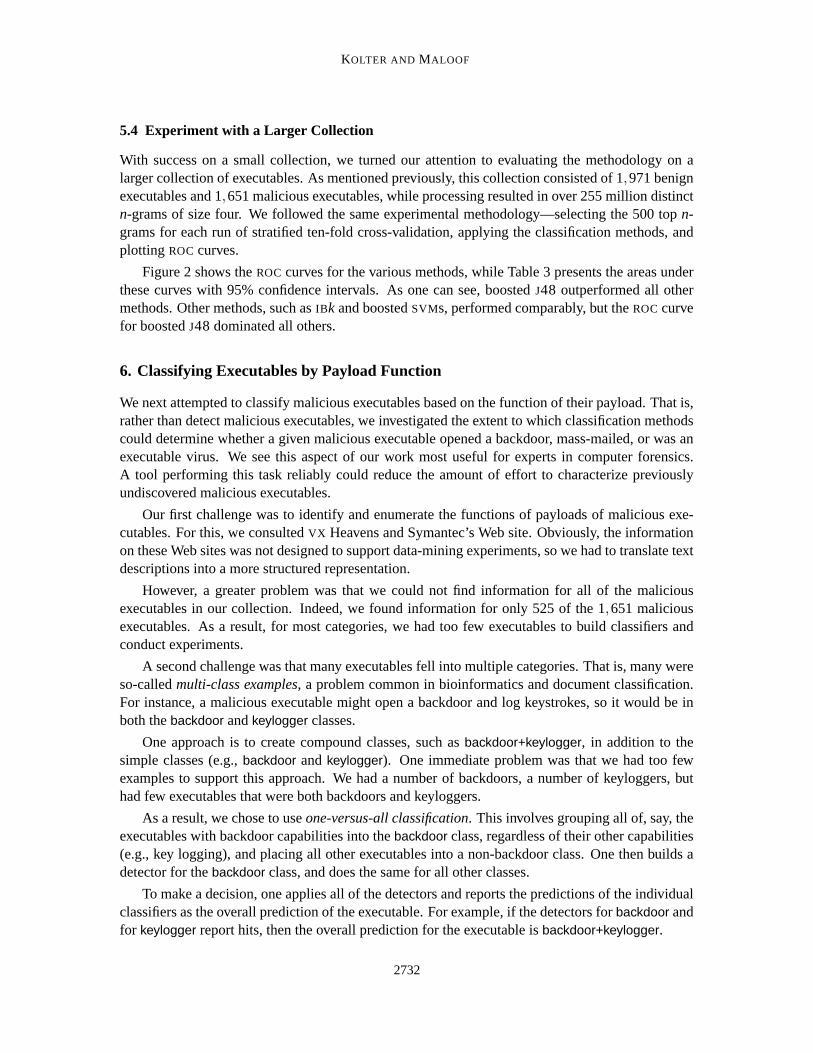
5.4 Experiment with a Larger Collection
With success on a small collection, we turned our attention to evaluating the methodology on alarger collection of executables. As mentioned previously, this collection consisted of 1,971 benignexecutables and 1,651 malicious executables, while processing resulted in over 255 million distinctn-grams of size four. We followed the same experimental methodology—selecting the 500 top n-grams for each run of stratified ten-fold cross-validation, applying the classification methods, andplotting ROC curves.
Figure 2 shows the ROC curves for the various methods, while Table 3 presents the areas underthese curves with 95% confidence intervals. As one can see, boosted J48 outperformed all othermethods. Other methods, such as IBk and boosted SVMs, performed comparably, but the ROC curvefor boosted J48 dominated all others.
6. Classifying Executables by Payload Function
We next attempted to classify malicious executables based on the function of their payload. That is,rather than detect malicious executables, we investigated the extent to which classification methodscould determine whether a given malicious executable opened a backdoor, mass-mailed, or was anexecutable virus. We see this aspect of our work most useful for experts in computer forensics.A tool performing this task reliably could reduce the amount of effort to characterize previouslyundiscovered malicious executables.
Our first challenge was to identify and enumerate the functions of payloads of malicious exe-cutables. For this, we consulted VX Heavens and Symantec’s Web site. Obviously, the informationon these Web sites was not designed to support data-mining experiments, so we had to translate textdescriptions into a more structured representation.
However, a greater problem was that we could not find information for all of the maliciousexecutables in our collection. Indeed, we found information for only 525 of the 1,651 maliciousexecutables. As a result, for most categories, we had too few executables to build classifiers andconduct experiments.
A second challenge was that many executables fell into multiple categories. That is, many wereso-called multi-class examples, a problem common in bioinformatics and document classification.For instance, a malicious executable might open a backdoor and log keystrokes, so it would be inboth the backdoor and keylogger classes.
One approach is to create compound classes, such as backdoor+keylogger, in addition to thesimple classes (e.g., backdoor and keylogger). One immediate problem was that we had too fewexamples to support this approach. We had a number of backdoors, a number of keyloggers, buthad few executables that were both backdoors and keyloggers.
As a result, we chose to use one-versus-all classification. This involves grouping all of, say, theexecutables with backdoor capabilities into the backdoor class, regardless of their other capabilities(e.g., key logging), and placing all other executables into a non-backdoor class. One then builds adetector for the backdoor class, and does the same for all other classes.
To make a decision, one applies all of the detectors and reports the predictions of the individualclassifiers as the overall prediction of the executable. For example, if the detectors for backdoor andfor keylogger report hits, then the overall prediction for the executable is backdoor+keylogger.
2732
DETECTING AND CLASSIFYING MALICIOUS EXECUTABLES
0
0.2
0.4
0.6
0.8
1
0 0.2 0.4 0.6 0.8 1
Tru
e-po
sitiv
e R
ate
False-positive Rate
Boosted J48SVM
IBk, k = 5Boosted SVM
Boosted Naive BayesNaive Bayes
J48
0.4
0.5
0.6
0.7
0.8
0.9
1
0 0.1 0.2 0.3 0.4 0.5 0.6
Tru
e-po
sitiv
e R
ate
False-positive Rate
Boosted J48SVM
IBk, k = 5Boosted SVM
Boosted Naive BayesNaive Bayes
J48
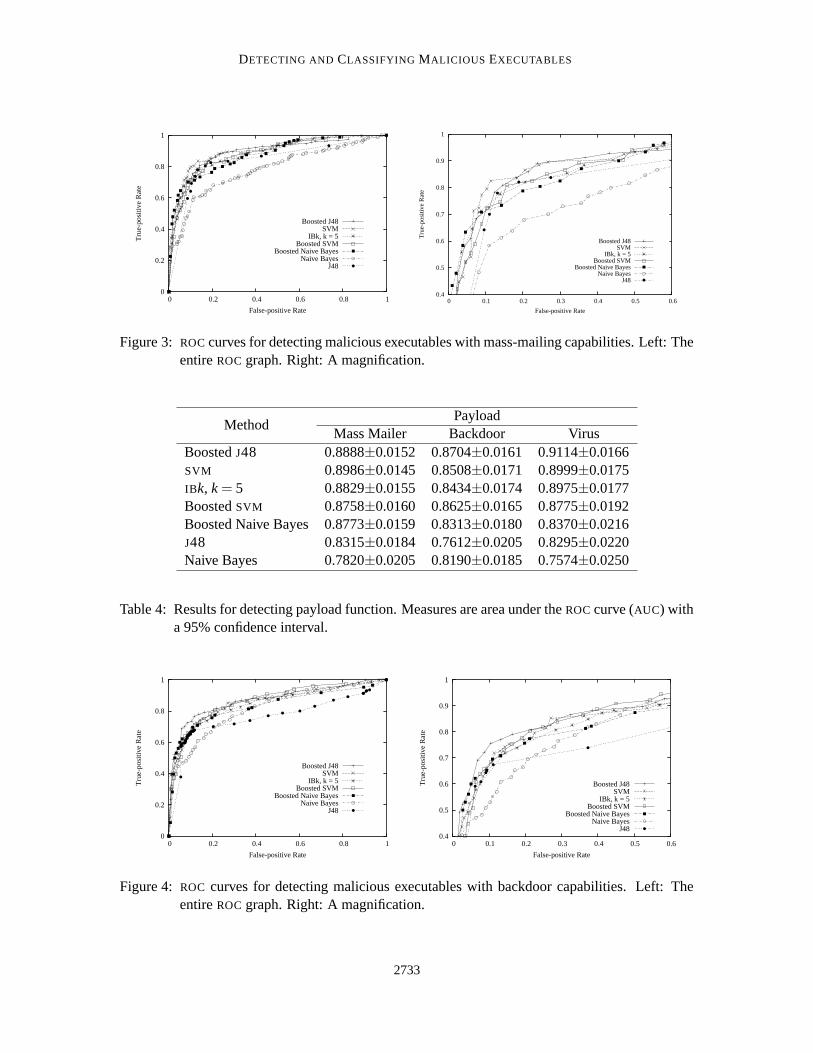
Figure 3: ROC curves for detecting malicious executables with mass-mailing capabilities. Left: Theentire ROC graph. Right: A magnification.
PayloadMethod
Mass Mailer Backdoor VirusBoosted J48 0.8888±0.0152 0.8704±0.0161 0.9114±0.0166SVM 0.8986±0.0145 0.8508±0.0171 0.8999±0.0175IBk, k = 5 0.8829±0.0155 0.8434±0.0174 0.8975±0.0177Boosted SVM 0.8758±0.0160 0.8625±0.0165 0.8775±0.0192Boosted Naive Bayes 0.8773±0.0159 0.8313±0.0180 0.8370±0.0216J48 0.8315±0.0184 0.7612±0.0205 0.8295±0.0220Naive Bayes 0.7820±0.0205 0.8190±0.0185 0.7574±0.0250
Table 4: Results for detecting payload function. Measures are area under the ROC curve (AUC) witha 95% confidence interval.
0
0.2
0.4
0.6
0.8
1
0 0.2 0.4 0.6 0.8 1
Tru
e-po
sitiv
e R
ate
False-positive Rate
Boosted J48SVM
IBk, k = 5Boosted SVM
Boosted Naive BayesNaive Bayes
J48
0.4
0.5
0.6
0.7
0.8
0.9
1
0 0.1 0.2 0.3 0.4 0.5 0.6
Tru
e-po
sitiv
e R
ate
False-positive Rate
Boosted J48SVM
IBk, k = 5Boosted SVM
Boosted Naive BayesNaive Bayes
J48
Figure 4: ROC curves for detecting malicious executables with backdoor capabilities. Left: Theentire ROC graph. Right: A magnification.
2733
KOLTER AND MALOOF
0
0.2
0.4
0.6
0.8
1
0 0.2 0.4 0.6 0.8 1
Tru
e-po
sitiv
e R
ate
False-positive Rate
Boosted J48SVM
IBk, k = 5Boosted SVM
Boosted Naive BayesNaive Bayes
J48
0.4
0.5
0.6
0.7
0.8
0.9
1
0 0.1 0.2 0.3 0.4 0.5 0.6
Tru
e-po
sitiv
e R
ate
False-positive Rate
Boosted J48SVM
IBk, k = 5Boosted SVM
Boosted Naive BayesNaive Bayes
J48
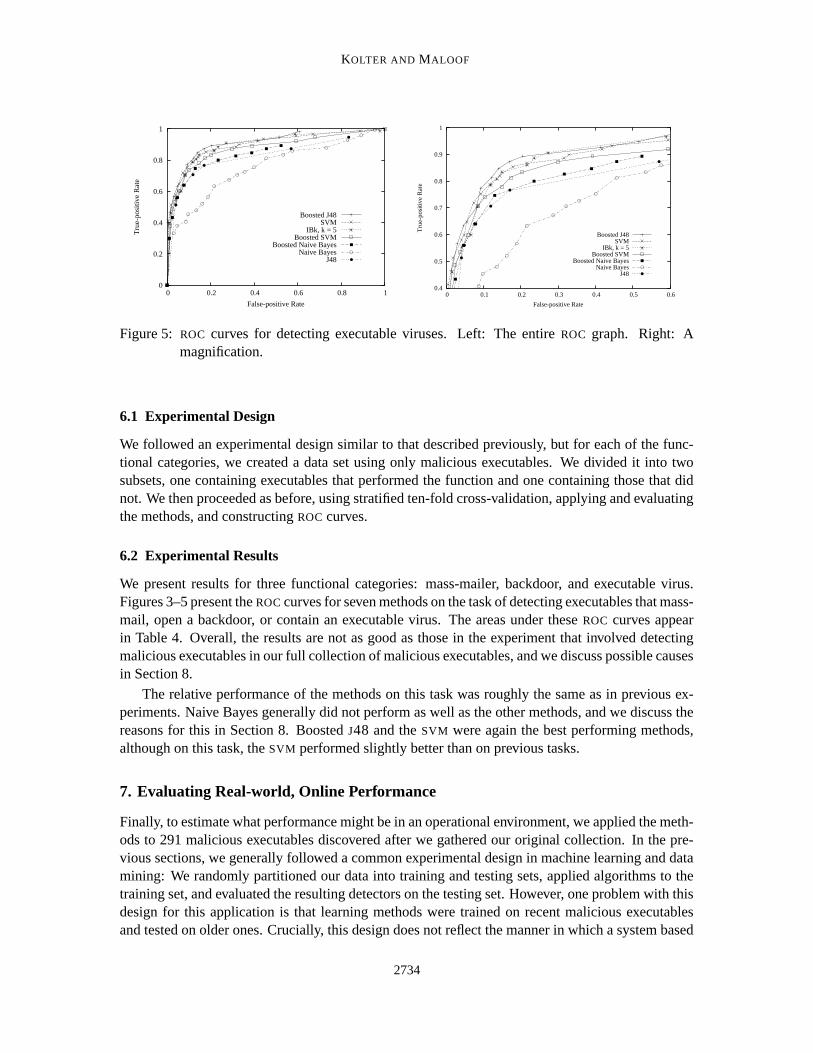
Figure 5: ROC curves for detecting executable viruses. Left: The entire ROC graph. Right: Amagnification.
6.1 Experimental Design
We followed an experimental design similar to that described previously, but for each of the func-tional categories, we created a data set using only malicious executables. We divided it into twosubsets, one containing executables that performed the function and one containing those that didnot. We then proceeded as before, using stratified ten-fold cross-validation, applying and evaluatingthe methods, and constructing ROC curves.
6.2 Experimental Results
We present results for three functional categories: mass-mailer, backdoor, and executable virus.Figures 3–5 present the ROC curves for seven methods on the task of detecting executables that mass-mail, open a backdoor, or contain an executable virus. The areas under these ROC curves appearin Table 4. Overall, the results are not as good as those in the experiment that involved detectingmalicious executables in our full collection of malicious executables, and we discuss possible causesin Section 8.
The relative performance of the methods on this task was roughly the same as in previous ex-periments. Naive Bayes generally did not perform as well as the other methods, and we discuss thereasons for this in Section 8. Boosted J48 and the SVM were again the best performing methods,although on this task, the SVM performed slightly better than on previous tasks.
7. Evaluating Real-world, Online Performance
Finally, to estimate what performance might be in an operational environment, we applied the meth-ods to 291 malicious executables discovered after we gathered our original collection. In the pre-vious sections, we generally followed a common experimental design in machine learning and datamining: We randomly partitioned our data into training and testing sets, applied algorithms to thetraining set, and evaluated the resulting detectors on the testing set. However, one problem with thisdesign for this application is that learning methods were trained on recent malicious executablesand tested on older ones. Crucially, this design does not reflect the manner in which a system based
2734

DETECTING AND CLASSIFYING MALICIOUS EXECUTABLES
Desired False-positive RateMethod 0.01 0.05 0.1
P A P A P A
Boosted J48 0.94 0.86 0.99 0.98 1.00 1.00SVM 0.82 0.41 0.98 0.90 0.99 0.93Boosted SVM 0.86 0.56 0.98 0.89 0.99 0.92IBk, k = 5 0.90 0.67 0.99 0.81 1.00 0.99Boosted Naive Bayes 0.79 0.55 0.94 0.93 0.98 0.98J48 0.20 0.34 0.97 0.94 0.98 0.95Naive Bayes 0.48 0.28 0.57 0.72 0.81 0.83
Table 5: Results of a real-world, online evaluation. Predicted (P) versus actual (A) detect rates forthree desired false-positive rates on 291 new, previously unseen malicious executables.Predicted detect rates are from Figure 2 and the experiment described in Section 5.4.
on our methodology would be used. In this section, we rectify this and describe an experimentdesigned to better evaluate the real-world, online performance of the detectors.
As mentioned previously, we gathered our collection of executables in the summer of 2003. InAugust of 2004, we retrieved from VX Heavens all of the new malicious executables and selectedthose that were discovered after we gathered our original collection. This required retrieving the3,082 new executables that were in the PE format and using commercial software to verify inde-pendently that each executable was indeed malicious. We then cross-referenced the names of theverified malicious executables with information on various Web sites to produce the subset of ma-licious executables discovered between July of 2003 and August of 2004. There were 291 suchexecutables.
7.1 Experimental Design
To conduct this experiment, we built classifiers from all of the executables in our original collection,both malicious and benign. We then selected three desired false-positive rates, 0.01, 0.05, and0.1. This, in turn, let us select three decision thresholds from each ROC curve for each method.Using these thresholds to parameterize specific classifiers, we applied them to each of the 291 newmalicious executables in the order of their date of discovery.
7.2 Experimental Results
Rather than analyze all of these results, we will discuss the actual (A) detection rates for the desiredfalse-positive rate of 0.05.1 As one can see, boosted decision trees detected about 98% of the newmalicious executables, missing 6 of 291 malicious executables. For some applications, six may betoo many, but if one is willing to tolerate a false-positive rate of 0.1, then one can achieve a perfectdetect rate, at least on these 291 malicious executables.
1. Our reasoning was that, for most operational scenarios, a desired false-positive rate of 0.1 would be too high, andthe detect rates achieved for a desired false-positive rate of 0.01 were too low. Knowledge of a given operationalenvironment would presumably help us choose a more appropriate decision threshold.
2735
KOLTER AND MALOOF
However, it is also important to compare the actual detection rates to the predicted rates fromthe experiment using our larger collection of executables, discussed in Section 5.4. As one cansee in Table 5 by comparing the predicted (P) and actual (A) detection rates for a desired false-positive rate of 0.05, four methods (SVM, boosted SVM, IBk, and J48) performed worse on the newmalicious executables, two methods (boosted J48 and boosted naive Bayes) performed about aswell under both conditions, and one method (naive Bayes) performed much better. Nonetheless,we determined that boosted decision trees achieved the best performance overall, not only in termsof the best actual performance on the new malicious executables, but also in terms of matching thepredicted performance from the experiment involving the larger collection of executables.
8. Discussion
To date, our results suggest that methods of machine learning, data mining, and text classificationare appropriate and useful for detecting malicious executables in the wild. Boosted classifiers, IBk,and a support vector machine performed exceptionally well given our current data collection. Thatthe boosted classifiers generally outperformed single classifiers echos the conclusion of severalempirical studies of boosting (Bauer and Kohavi, 1999; Breiman, 1998; Dietterich, 2000; Freundand Schapire, 1996), which suggest that boosting improves the performance of unstable classifiers,such as J48, by reducing their bias and variance (Bauer and Kohavi, 1999; Breiman, 1998). Boostingcan adversely affect stable classifiers (Bauer and Kohavi, 1999), such as naive Bayes, although inour study, boosting naive Bayes improved performance. Stability may also explain why the benefitof boosting SVMs was inconclusive in our study (Breiman, 1998).
Our experimental results suggest that the methodology will scale to larger collections of executa-bles. The larger collection in our study contained more than three times the number of executablesin the smaller collection. Yet, as one can see in Tables 2 and 3, the absolute performance of all ofthe methods was better for the larger collection than for the smaller one. The relative performanceof the methods changed somewhat. For example, the SVM moved from fourth to second, displacingthe boosted SVMs and IBk.
Regarding our results for classifying executables by function, we suspect the methods did notperform as well as they did on the detection task for two reasons. First, with the classificationtask, the algorithms must make finer distinctions between malicious and benign executables. Forexample, a malicious executable that mass-mails will be similar in some respects to a legitimatee-mail client. Such similarity could account for the lower performance.
Indeed, in pilot studies, we attempted to use the methods to distinguish between benign andmalicious executables that edited the registry. Performance on this task was lower than on theothers, and we suspect this is because editing the registry is a function common to many executables,malicious and benign. Such similarity could have accounted for the lower performance.
Second, we suspect that, on the classification task, performance suffered because the algorithmsbuilt classifiers from fewer examples. Performance on the detection task improved when we addedadditional examples, and we suspect that, likewise, with additional examples, we will obtain similarimprovements in accuracy on the classification task.
Regarding our online evaluation of the methods, we believe the experimental design representshow such methods would be used in a commercial or operational system. We did not conduct thisexperiment from the outset (Kolter and Maloof, 2004) because it was impossible to determine thedate of discovery of all of the malicious executables in our collection. Moreover, to conduct the ideal
2736
DETECTING AND CLASSIFYING MALICIOUS EXECUTABLES
030b0105 = T| 0b010219 = T: malicious (2.0)| 0b010219 = F| | 0000000a = T| | | 0001ff25 = T| | | | 0c100001 = T| | | | | 0000c700 = T: benign (6.0)| | | | | 0000c700 = F: malicious (2.0)| | | | 0c100001 = F: malicious (2.0)| | | 0001ff25 = F: benign (10.0)| | 0000000a = F: benign (253.0)030b0105 = F...
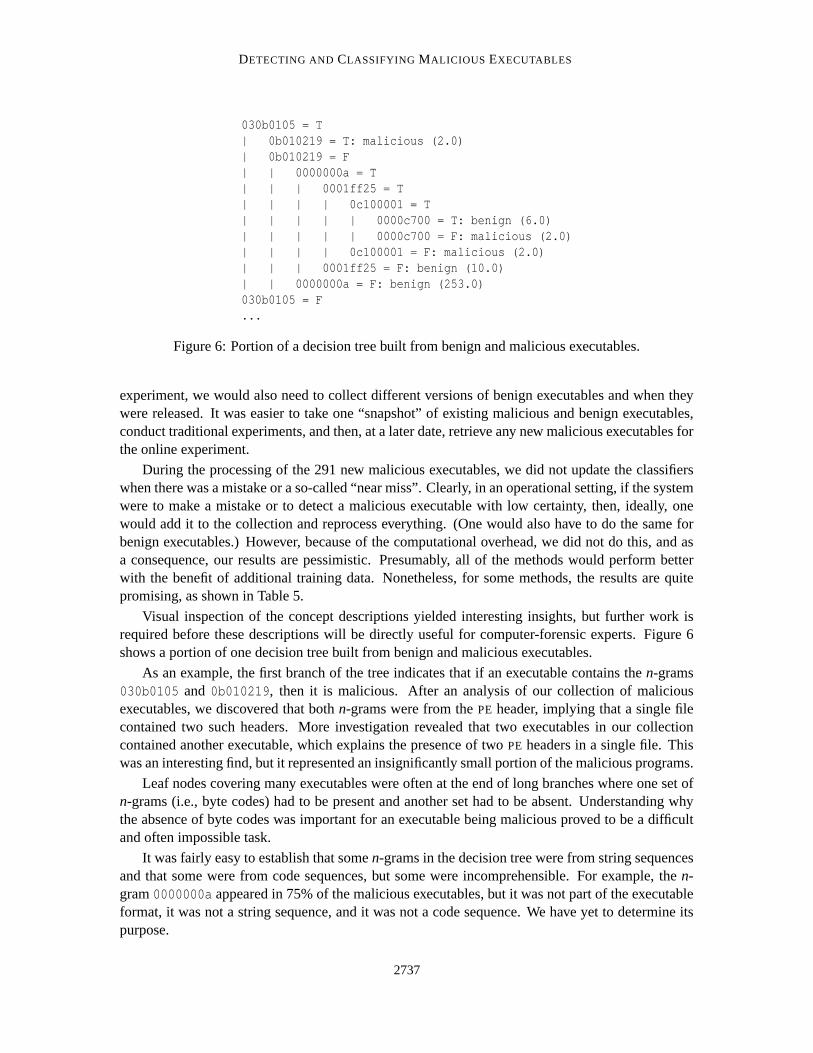
Figure 6: Portion of a decision tree built from benign and malicious executables.
experiment, we would also need to collect different versions of benign executables and when theywere released. It was easier to take one “snapshot” of existing malicious and benign executables,conduct traditional experiments, and then, at a later date, retrieve any new malicious executables forthe online experiment.
During the processing of the 291 new malicious executables, we did not update the classifierswhen there was a mistake or a so-called “near miss”. Clearly, in an operational setting, if the systemwere to make a mistake or to detect a malicious executable with low certainty, then, ideally, onewould add it to the collection and reprocess everything. (One would also have to do the same forbenign executables.) However, because of the computational overhead, we did not do this, and asa consequence, our results are pessimistic. Presumably, all of the methods would perform betterwith the benefit of additional training data. Nonetheless, for some methods, the results are quitepromising, as shown in Table 5.
Visual inspection of the concept descriptions yielded interesting insights, but further work isrequired before these descriptions will be directly useful for computer-forensic experts. Figure 6shows a portion of one decision tree built from benign and malicious executables.
As an example, the first branch of the tree indicates that if an executable contains the n-grams030b0105 and 0b010219, then it is malicious. After an analysis of our collection of maliciousexecutables, we discovered that both n-grams were from the PE header, implying that a single filecontained two such headers. More investigation revealed that two executables in our collectioncontained another executable, which explains the presence of two PE headers in a single file. Thiswas an interesting find, but it represented an insignificantly small portion of the malicious programs.
Leaf nodes covering many executables were often at the end of long branches where one set ofn-grams (i.e., byte codes) had to be present and another set had to be absent. Understanding whythe absence of byte codes was important for an executable being malicious proved to be a difficultand often impossible task.
It was fairly easy to establish that some n-grams in the decision tree were from string sequencesand that some were from code sequences, but some were incomprehensible. For example, the n-gram 0000000a appeared in 75% of the malicious executables, but it was not part of the executableformat, it was not a string sequence, and it was not a code sequence. We have yet to determine itspurpose.
2737
KOLTER AND MALOOF
Nonetheless, for the large collection of executables, the size of the decision trees averaged over10 runs was about 90 nodes. No tree exceeded 103 nodes. The heights of the trees never exceeded13 nodes, and subtrees of heights of 9 or less covered roughly 99.3% of the training examples.While these trees did not support a thorough forensic analysis, they did compactly encode a largenumber of benign and malicious executables.
Unfortunately, the best performing method did not always produce the most readable conceptdescriptions. Of the methods we considered, J48 is mostly likely to produce descriptions usefulfor computer-forensic experts. However, J48 was not the best performing method in any of ourexperiments. The best performing method was boosted J48. While it is true that this method alsoproduces decision trees, it actually produces a set of weighted trees. We discussed the difficultiesof analyzing a single tree, so it is unclear if analyzing an ensemble of weighted trees will be helpfulfor experts. And since J48 was not the best performing method, we may also have to question theutility of analyzing a single decision tree when its performance is subpar.
We estimated that about 20–25% of the malicious executables in our collection were obfuscatedwith either compression or encryption. To the best of our knowledge, none of the benign executableswere obfuscated. Early in our investigation, we conjectured that obfuscation would likely interferewith classifying payload function, but that it would not do so with detecting whether the executableis malicious. Our results on these tasks seem to support our conjecture: We were able to detectmalicious executables with high accuracy, so it is unlikely that obfuscation affected performance.On the other hand, we were not able to achieve the same high accuracy when classifying payloadfunction, and the presence of obfuscation may have contributed to this result.
With the detection task, it is possible that the methods simply learned to detect certain formsof obfuscation, such as run-time compression, but this does not seem problematic as long as thoseforms are correlated with malicious executables. Based on our collection and our own investigation,this is presently the case.
To place our results in context with the study of Schultz et al. (2001), they reported that thebest performing approaches were naive Bayes trained on the printable strings from the programand an ensemble of naive-Bayesian classifiers trained on byte sequences. They did not report areasunder their ROC curves, but visual inspection of these curves suggests that with the exception ofnaive Bayes, all of our methods outperformed their ensemble of naive-Bayesian classifiers. It alsoappears that our best performing methods, such as boosted J48, outperformed their naive Bayesianclassifier trained with strings.
These differences in performance could be due to several factors. We analyzed different types ofexecutables: Their collection consisted mostly of viruses, whereas ours contained viruses loaders,worms, and Trojan horses. Ours consisted of executables in the Windows PE format; about 5.6% oftheirs was in this format.
Our better results could be due to how we processed byte sequences. Schultz et al. (2001) usednon-overlapping two-byte sequences, whereas we used overlapping sequences of four bytes. Withtheir approach it is possible that a useful feature (i.e., a predictive sequence of bytes) would be splitacross a boundary. This could explain why in their study string features appeared to be better thanbyte sequences, since extracted strings would not be broken apart. Their approach produced muchless training data than did ours, but our application of feature selection reduced the original set ofmore than 255 million n-grams to a manageable 500.
Our results for naive Bayes were poor in comparison to theirs. We again attribute this to thedifferences in data extraction methods. Naive Bayes is well known to be sensitive to conditionally
2738
DETECTING AND CLASSIFYING MALICIOUS EXECUTABLES
dependent attributes (Domingos and Pazzani, 1997). We used overlapping byte sequences as at-tributes, so there were many that were conditionally dependent. Indeed, after analyzing decisiontrees produced by J48, we found evidence that overlapping sequences were important for detection.Specifically, some subpaths of these decision trees consisted of sequentially overlapping terms thattogether formed byte sequences relevant for prediction. Schultz et al.’s (2001) extraction methodswould not have produced conditionally dependent attributes to the same degree, if at all, since theyused strings and non-overlapping byte sequences.
Regarding our experimental design, we decided to pool a method’s ratings and produce a singleROC curve (see Section 5.1) because labroc4 (Metz et al., 2003) occasionally could not fit an ROC
curve to a method’s ratings from a single fold of cross-validation (i.e., the ratings were degener-ate). We also considered producing ROC convex hulls (Provost and Fawcett, 2001) and cost curves(Drummond and Holte, 2000), but determined that traditional ROC analysis was appropriate for ourresults (e.g., the curve for boosted J48 dominated all other curves).
In our study, there was an issue of high computational overhead. Selecting features was ex-pensive, and we had to resort to a disk-based implementation for computing information gain,which required a great deal of time and space to execute. However, once selected, WEKA’s (Wittenand Frank, 2005) Java implementations executed quickly on the training examples with their 500Boolean attributes.
The greatest impediment to our investigation was the absence of detailed, structured informationabout the malicious executables in our collection. As mentioned previously, we had 1,651 maliciousexecutables, but found information for only 525 that was sufficient to support our experiment onfunction classification, described in Section 6.
We arduously gathered this information by reading it from Web pages. We contemplated im-plementing software to extract this information, but abandoned this idea because of the difficultyof processing such semi-structured information and because of that information’s ad hoc nature.As an example, for one executable, the description that it opened a backdoor appeared in a sectiondescribing the executable’s payload, whereas the same information for another executable appearedin a section describing how the malicious executable degrades performance. This suggests the needfor a well-engineered database for storing information about malicious software.
As another example, we found incomplete information about the dates of discovery of many ofthe malicious executables. With this information, we could have evaluated our methods on the mali-cious executables in the order they were discovered. This would have been similar to the evaluationwe conducted using the 291 previously unseen malicious executables, as described in Section 7,but having complete information for all of the executables would have resulted in a much strongerevaluation.
However, to conduct a proper evaluation, we would also needed a comparable collection ofbenign executables. It seems unlikely that we would be able to reconstruct realistic snapshots ofcomplete Windows systems over a sufficient period of time. Snapshots of the system software mightbe possible, but creating a historical archive of application software and their different versionsseems all but impossible. Such snapshots would be required for a commercial system, and creatingsuch snapshots would be easier going forward.
In terms of our approach, it is important to note that we have investigated other methods ofdata extraction. For instance, we examined whether printable strings from the executable mightbe useful, but reasoned that subsets of n-grams would capture the same information. Indeed, afterinspecting some of the decision trees that J48 produced, we found evidence suggesting that n-grams
2739

KOLTER AND MALOOF
formed from strings were being used for detection. Nonetheless, if we later determine that explicitlyrepresenting printable strings is important, we can easily extend our representation to encode theirpresence or absence. On the other hand, as we stated previously, one must question the use ofprintable strings or DLL information since compression and other forms of obfuscation can maskthis information.
We also considered using disassembled code as training data. For malicious executables usingcompression, being able to obtain a disassembly of critical sections of code may be a questionableassumption. Moreover, in pilot studies, a commercial product failed to disassemble some of ourmalicious executables.
We considered an approach that runs malicious executables in a “sandbox” and produces an au-dit of the machine instructions. Naturally, we would not be able to execute completely the program,but 10,000 instructions may be sufficient to differentiate benign and malicious behavior. We havenot pursued this idea because of a lack of auditing tools, the difficulty of handling large numbersof interactive programs, and the inability of detecting malicious behavior occurring near the end ofsufficiently long programs. Moreover, some malicious programs can detect when they are beingexecuted by a virtual machine and either terminate execution or avoid executing malicious sectionsof code.
There are at least two immediate commercial applications of our work. The first is a system,similar to MECS, for detecting malicious executables. Server software would need to store all knownmalicious executables and a comparably large set of benign executables. Due to the computationaloverhead of producing classifiers from such data, algorithms for computing information gain andfor evaluating classification methods would have to be executed incrementally, in parallel, or both.
Client software would need to extract only the top n-grams from a given executable, apply aclassifier, and predict. Updates to the classifier could be made remotely over the Internet. Sincethe best performing method may change with new training data, it will be critical for the serverto evaluate a variety of methods and for the client to accommodate any of the potential classifiers.Used in conjunction with standard signature methods, these methods could provide better detectionof malicious executables than is currently possible.
The second is a system oriented more toward computer-forensic experts. Even though workremains before decision trees could be used to analyze malicious executables, one could use IBk toretrieve known malicious executables similar to a newly discovered malicious executable. Basedon the properties of the retrieved executables, such a system could give investigators insights intothe new executable’s function. While it remains an open issue whether an executable’s statisticalproperties are predictive of its function, we have presented evidence suggesting it may be possibleto achieve useful detection rates when predicting function.
9. Concluding Remarks
We considered the application of techniques from machine learning, data mining, and text classifi-cation to the problem of detecting and classifying unknown malicious executables in the wild. Afterevaluating a variety of inductive methods, results suggest that, for the task of detecting maliciousexecutables, boosted J48 produced the best detector with an area under the ROC curve of 0.996.
We also investigated the ability of these methods to classify malicious executables based on theirpayload’s function. For payloads that mass-mail, open a backdoor, and inject viral code, boostedJ48 again produced the best detectors with areas under the ROC curve around 0.9. While overall
2740
DETECTING AND CLASSIFYING MALICIOUS EXECUTABLES
the performance on this task was not as impressive as that on the detection task, we contend thatperformance will improve with the removal of obfuscation and with additional training examples.
Finally, boosted J48 also performed well on the task of detecting 291 malicious executablesdiscovered after we gathered our original collection, an evaluation that best reflects how one mightuse the methodology in an operational environment. Indeed, our methodology resulted in a fieldedprototype called MECS, the Malicious Executable Classification System, which we delivered to theMITRE Corporation.
In future work, we hope to remove obfuscation from our malicious executables and rerun theexperiment on classifying payload function. Removing obfuscation and producing “clean” executa-bles may prove challenging, but doing so would provide the best opportunity to evaluate whetherobfuscation affected the performance of the classifiers.
We also plan to investigate the similarity of malicious executables and how such executableschange over time. In this regard, we have not yet attempted to cluster our collection of executables,but doing so may yield two insights. First, if a new, unanalyzed malicious executable is similar toothers that have been analyzed, it may help computer-forensic experts conduct a faster analysis ofthe new threat.
Second, if we add information about when the executables were discovered, we may be able todetermine how malicious executables were derived from others. Although there is a weak analogbetween DNA sequences and byte codes from executables, we may be able to use a collection ofmalicious executables to build phylogenetic trees that may elucidate “evolutionary relationships”existing among them.
We anticipate that inductive approaches, such as ours, is but one process in an overall strategyfor detecting and classifying “malware.” When combined with approaches that use cryptographichashes, search for known signatures, execute and analyze code in a virtual machine, we hope thatsuch a strategy for detecting and classifying malicious executables will improve the security ofcomputers. Indeed, the delivery of MECS to MITRE has provided computer-forensic experts witha valuable tool. We anticipate that continued investigation of inductive methods for detecting andclassifying malicious executables will yield additional tools and more secure systems.
Acknowledgments
The authors first and foremost thank William Asmond and Thomas Ervin of the MITRE Corporationfor providing their expertise, advice, and collection of malicious executables. We thank NancyHoudek of Georgetown for help gathering information about the functional characteristics of themalicious executables in our collection. The authors thank the anonymous reviewers for their timeand helpful comments, Ophir Frieder of IIT for help with the vector space model, Abdur Chowdhuryof IIT for advice on the scalability of the vector space model, Bob Wagner of the FDA for assistancewith ROC analysis, Eric Bloedorn of MITRE for general guidance on our approach, and MatthewKrause of Yale University for reviewing an earlier draft of the paper. Finally, we thank RichardSquier of Georgetown for supplying much of the additional computational resources needed for thisstudy through Grant No. DAAD19-00-1-0165 from the U.S. Army Research Office. This researchwas conducted in the Department of Computer Science at Georgetown University. Our work wassupported by the MITRE Corporation under contract 53271. The authors are listed in alphabeticalorder.
2741

KOLTER AND MALOOF
References
D. W. Aha, D. Kibler, and M. K. Albert. Instance-based learning algorithms. Machine Learning, 6:37–66, 1991.
A. Aiken. MOSS: A system for detecting software plagiarism. Software, Department of ComputerScience, University of California, Berkeley, http://www.cs.berkeley.edu/ aiken/moss.html, 1994.
Anonymous. Maximum Security. Sams Publishing, Indianapolis, IN, 4th edition, 2003.
B. Bauer and R. Kohavi. An empirical comparison of voting classification algorithms: Bagging,boosting, and variants. Machine Learning, 36(1–2):105–139, 1999.
B. E. Boser, I. Guyon, and V. Vapnik. A training algorithm for optimal margin classifiers. InProceedings of the Fourth Workshop on Computational Learning Theory, pages 144–152, NewYork, NY, 1992. ACM Press.
L. Breiman. Arcing classifiers. The Annals of Statistics, 26(3):801–849, 1998.
M. Christodorescu and S. Jha. Static analysis of executables to detect malicious patterns. In Pro-ceedings of the Twelfth USENIX Security Symposium, Berkeley, CA, 2003. Advanced ComputingSystems Association.
W. W. Cohen. Fast effective rule induction. In Proceedings of the Twelfth International Conferenceon Machine Learning, pages 115–123, San Francisco, CA, 1995. Morgan Kaufmann.
T. G. Dietterich. An experimental comparison of three methods for constructing ensembles ofdecision trees: Bagging, boosting, and randomization. Machine Learning, 40(2):139–158, 2000.
P. Domingos and M. J. Pazzani. On the optimality of the simple Bayesian classifier under zero-oneloss. Machine Learning, 29:103–130, 1997.
C. Drummond and R. C. Holte. Explicitly representing expected cost: An alternative to ROC rep-resentation. In Proceedings of the Sixth ACM SIGKDD International Conference on KnowledgeDiscovery and Data Mining, pages 198–207, New York, NY, 2000. ACM Press.
S. Dumais, J. Platt, D. Heckerman, and M. Sahami. Inductive learning algorithms and representa-tions for text categorization. In Proceedings of the Seventh International Conference on Informa-tion and Knowledge Management, pages 148–155, New York, NY, 1998. ACM Press.
E. Durning-Lawrence. Bacon is Shake-speare. The John McBride Company, New York, NY, 1910.
R. Fisher. The use of multiple measurements in taxonomic problems. Annals of Eugenics, 7:179–188, 1936.
Y. Freund and R. E. Schapire. Experiments with a new boosting algorithm. In Proceedings of theThirteenth International Conference on Machine Learning, pages 148–156, San Francisco, CA,1996. Morgan Kaufmann.
2742
DETECTING AND CLASSIFYING MALICIOUS EXECUTABLES
A. R. Gray, P. J. Sallis, and S. G. MacDonell. Software forensics: Extending authorship analysistechniques to computer programs. In Proceedings of the Third Biannual Conference of the In-ternational Association of Forensic Linguists, pages 1–8, Birmingham, UK, 1997. InternationalAssociation of Forensic Linguists. URL citeseer.nj.nec.com/gray97software.html.
D. Hand, H. Mannila, and P. Smyth. Principles of data mining. MIT Press, Cambridge, MA, 2001.
A. K. Jain, R. P. W. Duin, and J. Mao. Statistical pattern recognition: A review. IEEE Transactionson Pattern Analysis and Machine Intelligence, 22(1):4–37, 2000.
H. T. Jankowitz. Detecting plagiarism in student Pascal programs. Computer Journal, 31(1):1–8,1988.
T. Joachims. Text categorization with support vector machines: Learning with many relevant fea-tures. In Proceedings of the Tenth European Conference on Machine Learning, pages 487–494,Berlin, 1998. Springer.
J. O. Kephart, G. B. Sorkin, W. C. Arnold, D. M. Chess, G. J. Tesauro, and S. R. White. Biologi-cally inspired defenses against computer viruses. In Proceedings of the Fourteenth InternationalJoint Conference on Artificial Intelligence, pages 985–996, San Francisco, CA, 1995. MorganKaufmann.
B. Kjell, W. A. Woods, and O. Frieder. Discrimination of authorship using visualization. Informa-tion Processing and Management, 30(1):141–150, 1994.
J. Z. Kolter and M. A. Maloof. Learning to detect malicious executables in the wild. In Proceedingsof the Tenth ACM SIGKDD International Conference on Knowledge Discovery and Data Mining,pages 470–478, New York, NY, 2004. ACM Press.
I. Krsul. Authorship analysis: Identifying the author of a program. Master’s thesis, Purdue Univer-sity, West Lafayette, IN, 1994.
I. Krsul and E. Spafford. Authorship analysis: Identifying the authors of a program. In Proceedingsof the Eighteenth National Information Systems Security Conference, pages 514–524, Gaithers-burg, MD, 1995. National Institute of Standards and Technology.
R. W. Lo, K. N. Levitt, and R. A. Olsson. MCF: A malicious code filter. Computers & Security, 14(6):541–566, 1995. http://www.cs.columbia.edu/ids/mef/llo95.ps.
M. E. Maron and J. L. Kuhns. On relevance, probabilistic indexing and information retrieval. Jour-nal of the Association of Computing Machinery, 7(3):216–244, 1960.
G. McGraw and G. Morisett. Attacking malicious code: A report to the In-fosec Research Council. IEEE Software, pages 33–41, September/October 2000.http://www.cigital.com/ gem/malcode.pdf.
C. E. Metz, Y. Jiang, H. MacMahon, R. M. Nishikawa, and X. Pan. ROC software. Web page,Kurt Rossmann Laboratories for Radiologic Image Research, University of Chicago, Chicago,IL, 2003. URL http://www-radiology.uchicago.edu/krl/roc\_soft.htm.
2743
KOLTER AND MALOOF
P. Miller. hexdump 1.4. Software, http://gd.tuwien.ac.at/softeng/Aegis/hexdump.html, 1999.
T. M. Mitchell. Machine learning. McGraw-Hill, New York, NY, 1997.
D. Opitz and R. Maclin. Popular ensemble methods: An empirical study. Journal of ArtificialIntelligence Research, 11:169–198, 1999. URL http://www.jair.org.
J. Platt. Fast training of support vector machines using sequential minimal optimization. InB. Scholkopf, C. J. C. Burges, and S. Mika, editors, Advances in Kernel Methods—Support VectorLearning. MIT Press, Cambridge, MA, 1998.
J. Platt. Probabilities for SV machines. In P. J. Bartlett, B. Scholkopf, D Schuurmans, and A. J.Smola, editors, Advances in Large-Margin Classifiers, pages 61–74. MIT Press, Cambridge, MA,2000.
F. Provost and T. Fawcett. Robust classification for imprecise environments. Machine Learning, 42:203–231, 2001.
J. R. Quinlan. C4.5: Programs for machine learning. Morgan Kaufmann, San Francisco, CA, 1993.
M. Sahami, S. Dumais, D. Heckerman, and E. Horvitz. A Bayesian approach to filtering junk e-mail. In Learning for Text Categorization: Papers from the 1998 AAAI Workshop, Menlo Park,CA, 1998. AAAI Press. Technical Report WS-98-05.
M. G. Schultz, E. Eskin, E. Zadok, and S. J. Stolfo. Data mining methods for detection of newmalicious executables. In Proceedings of the IEEE Symposium on Security and Privacy, pages38–49, Los Alamitos, CA, 2001. IEEE Press. URL http://www.cs.columbia.edu/˜ezk/research.
S. Soman, C. Krintz, and G. Vigna. Detecting malicious Java code using virtual machine audit-ing. In Proceedings of the Twelfth USENIX Security Symposium, Berkeley, CA, 2003. AdvancedComputing Systems Association.
E. H. Spafford and S. A. Weeber. Software forensics: Can we track code to its authors? Computers& Security, 12:585–595, 1993.
J. A. Swets and R. M. Pickett. Evaluation of diagnostic systems: Methods from signal detectiontheory. Academic Press, New York, NY, 1982.
G. Tesauro, J. O. Kephart, and G. B. Sorkin. Neural networks for computer virus recognition. IEEEExpert, 11(4):5–6, August 1996.
I. H. Witten and E. Frank. Data mining: Practical machine learning toolsand techniques. Morgan Kaufmann, San Francisco, CA, 2nd edition, 2005.http://www.cs.waikato.ac.nz/ml/weka/index.html.
Y. Yang and J. O. Pederson. A comparative study on feature selection in text categorization. InProceedings of the Fourteenth International Conference on Machine Learning, pages 412–420,San Francisco, CA, 1997. Morgan Kaufmann.
2744