Embed Size (px)
DESCRIPTION
Governments around the world are currently striving to realise a spatiallyenabled society. This is achieved when location is used to organise information,which is then made freely available to society to endeavour towards benefits increativity and productivity, and improvements in transparency and decisionmaking.The currency of this ideal is a corollary of the changing relationshipbetween people and information, in which geo-referenced information is rapidlybecoming normative as it provides an additional degree of personal relevance.People’s roles are also changing; they are no longer passive consumers ofinformation but are becoming active producers – a behaviour manifested mostobviously online.
Citation preview
Learning From the Crowd: The Role of Volunteered Geographic Information in Realising a Spatially Enabled
Society
Serene Ho1 and Abbas Rajabifard2 Department of Geomatics, University of Melbourne, Australia
[email protected] [email protected]
Abstract
Governments around the world are currently striving to realise a spatially enabled society. This is achieved when location is used to organise information, which is then made freely available to society to endeavour towards benefits in creativity and productivity, and improvements in transparency and decision-making. The currency of this ideal is a corollary of the changing relationship between people and information, in which geo-referenced information is rapidly becoming normative as it provides an additional degree of personal relevance. People’s roles are also changing; they are no longer passive consumers of information but are becoming active producers – a behaviour manifested most obviously online.
One of the challenges that have been identified in realising a spatially enabled
society is the development of a spatial data infrastructure (SDI) that would support the wider society. Most SDIs typically comprise participants such as national spatial data agencies, government or private organisations, who have traditional or commercial roles in producing spatial information. This leaves a large part of society, such as community groups or ordinary citizens, with nominal roles within the SDI and potentially disengaged. The challenge of how the SDI can support the wider society would therefore need to address two inherent issues: recognising society’s role, and the design itself of the SDI to facilitate the functions of that role.
The nascent discipline of volunteered geographic information (VGI) offers an
opportunity to investigate both these issues, especially from society’s perspective. Although voluntarism has always been present in some way or form in the collection of spatial information, it has never before existed on such a prolific scale as evidenced from the plethora of sites on the internet that use, produce and share geo-referenced data. VGI is essentially the production of spatial information for society by society and this paper is predicated on VGI being a potential role for society and a function within the SDI. Therefore, how can we engage with the significant volume of spatial information that has been

generated from VGI? How can VGI be facilitated and supported with the eventual aim of incorporating it into a national SDI?
This paper will discuss the body of research that has been conducted to examine and understand the nature of VGI and the issues and challenges in engaging with it. It will use case studies of web applications that can demonstrate successful participation with their target communities to deliberate the technical, social, institutional and legal issues associated with designing an enabling platform, specifically the user interface, to act as a portal for VGI. It will also look to the future and consider new concepts and technologies such as the spatial marketplace and the impending ICT revolution. Finally, the paper will conclude with proposed guidelines for the design of an enabling platform for VGI so it can be a means of facilitating engagement, and eventually allow for incorporation into any vision for realising a spatially enabled society. Keywords: Volunteered geographic information, spatially enabled society, spatial data infrastructure, framework, enabling platform. 1. INTRODUCTION
Spatial information has become the new information standard (Rajabifard,
2009). New technologies are being developed everyday to provide location-based information: the iPhone with its six different sensors; the EXIF specification providing geotagged metadata in digital images...the list grows exponentially. This proliferation of spatial information in many aspects of our lives has given rise to the vision of a spatially enabled society (SES).
SES is realised when the whole of society has free access to spatial information, which promotes development through improved transparency and decision-making, but also the reduction of administrative costs (Wallace et al, 2006; Rajabifard, 2007). At a governmental level, advancement towards SES is most evident in the development and implementation of spatial data infrastructures (SDIs) at various jurisdiction levels. SDIs enable access, sharing and integration of spatial information, and the delivery of associated services, by bringing together technical and social components to provide end-users with a common platform (Groot and McLaughlin, 2000; Masser 2005). Most SDIs typically only comprise participants who have traditional or commercial roles in producing spatial information (i.e. spatial data agencies, government or private organisations), leaving a large part of society, such as community groups or ordinary citizens, with nominal roles (Williamson et al 2005; Budhathoki et al, 2008). The engagement of society is critical in the realisation of SES, and the incorporation of a more bottom-up approach will enhance the degree of accessibility and applicability of information within the SDI. This paper seeks to examine the issue of engaging society to achieve the vision of SES through the

prism of volunteered geographic information (VGI), with VGI being considered as a potential role for ordinary citizens and consequently, a component of the SDI. 2. VGI CONCEPTS AND CURRENT CHALLENGES
The term, VGI, is attributed widely to Michael Goodchild, who used it to describe the diverse practices of observing, collecting and producing geographic information by citizens with no formal expertise in the area (Goodchild, 2007a). VGI has gained critical mass in recent years because the development of online technologies has enabled the internet to be a platform for collaboration, production and distribution. These technologies are collectively known as Web 2.0.
Web 2.0 has changed the way we engage with information online. Users are no longer relegated to being mere consumers but now simultaneously interpret and produce information (Goodchild, 2007a). The conflation of these old and new roles has given rise to the need for a new paradigm: the ‘produser’ (see Bruns, 2007; Budhathoki et al, 2008; Coleman et al, 2009). By providing web consumers with the tools to essentially self-serve, Web 2.0 has managed to tapg into the ‘long tail’ of the web – the numerous individual and small stakeholders that form the bulk of the web. The potential reach yielded by engaging into this portion of web users may be a vital facilitator for realising SES. In this way, VGI presents an opportunity to facilitate citizen participation from a grassroots level (bottom up approach) which is an important driver in realising SES.
If VGI is to be a potential role for society in realising spatial enablement and a function within the SDI, the key challenges are:
1. How can we engage with the significant volume of spatial information
produced by VGI? 2. How can VGI be facilitated and supported with the eventual aim of
incorporation into an SDI?
The paper will use case studies of VGI websites and introduce the 9C framework to examine interface elements of the websites to discuss current practices in facilitating and engaging with VGI. These findings will be applied to the design of a conceptual framework for an enabling platform for VGI.
2.1 Engaging with VGI
VGI describes any type of content that has a geographic element which has
been voluntarily collected. However, its distinctive element is that the typical contributor is usually not trained in spatial, cartographic or geographical concepts (Goodchild, 2007a). Instead, this specialist knowledge has mostly been

supplanted by technology – many programs now encode these concepts within their programs (Goodchild, 2007a; Castelein et al, 2010). These technologies are examples of Web 2.0 technologies and as such, many authors have referenced Web 2.0 in defining elements of VGI (e.g. Goodchild, 2007a; Elwood, 2008a; Hudson-Smith et al, 2009).
These technologies include geospatial browsers, wikis, mashups and ‘folksonomies’ (common language structures), which facilitate engagement by using the internet as a platform for collaboration, and by encouraging two-way interactivity – users are no longer relegated to mere consumers but now simultaneously interpret and produce information (Goodchild, 2007a). One of the hallmarks of Web 2.0 is the ability to tap into the collective wisdom of the crowd (O’Reilly, 2005) – and therefore VGI – and is the result of the wide scale use of wiki technology. Wikis enable a group to access and edit content at any time by any number of people. This open system is integral to facilitating collaboration, but subsequently offers little in defence of site vandalism. The wiki’s only defence against inaccurate data comes back to trust in the collective wisdom of the crowd for self-regulation (Bishr and Kuhn, 2007). OpenStreetMap is an example of a wiki application in VGI.
In almost all the literature on VGI, Google Earth has inexorably been referenced suggesting the importance of its role in VGI. As a type of geospatial browser, it is considered one of two main drivers in the development of VGI (McDougall, 2009) and has been responsible for raising the profile of geographic information (GI) to the extent that Goodchild (quoted in Butler 2006: pg. 777) made the comparison that “just as the PC democratised computing, so systems like Google Earth will democratise GIS”. Google Earth brought spatial awareness into the mainstream, and by releasing its Application Programming Interface (API) publicly and freely, encouraged users to apply their own social and cognitive interpretation to GI. Figure 1. Most popular APIs downloaded (left) and most popular types of mashups created
(right) (http://www.programmableweb.com/apis).

The availability of mapping APIs like Google’s has facilitated the concept of a
‘mashup’ as the ideal presentation vehicle for VGI by providing a geographical backdrop. Figure 1 above shows both the popularity of the Google Maps API, and perhaps as a consequence, the popularity of mapping mashups. This provides an indication of how widespread spatial visualisation is online and how online users have embraced the concept of VGI.
Figure 2. Mashups using various sources and the different formats of information and protocol methods.
In general, mashups combine content from other sources like mapping data, web services, feeds, geo-referenced data to create a new data resource in a web interface (see figure 2 above), and largely uses the Extensible Markup Language (XML) to transfer data (Pietroniro and Fichter, 2007 in Li and Gong, 2008). It is this aggregating functionality that enables information to be reused and reinterpreted to suit the specific needs of its creator. Some mashups use an interface, the widget, to enable the user to dynamically interact with the underlying data (Crupi and Warner, 2008). Mashups provide an effective way of engaging with the significant volume of information in VGI, mashups allow the user to tailor the information to produce ad-hoc solutions that address short-term, judicious purposes. Arguably, mashups are popular because they provide flexibility and customisation – something that SDIs cannot easily provide. Figure 3 below shows how a Google Earth image of the city of Melbourne has been used to produce a mashup which provides information (images and videos) about specific sites.
Figure 3. Google Earth showing information around Melbourne.
Web service 1 e.g. API (HTTP) (APIs)
Feeds e.g. Atom, RSS Mashup
(new website or content)
Other data sources (via XML)
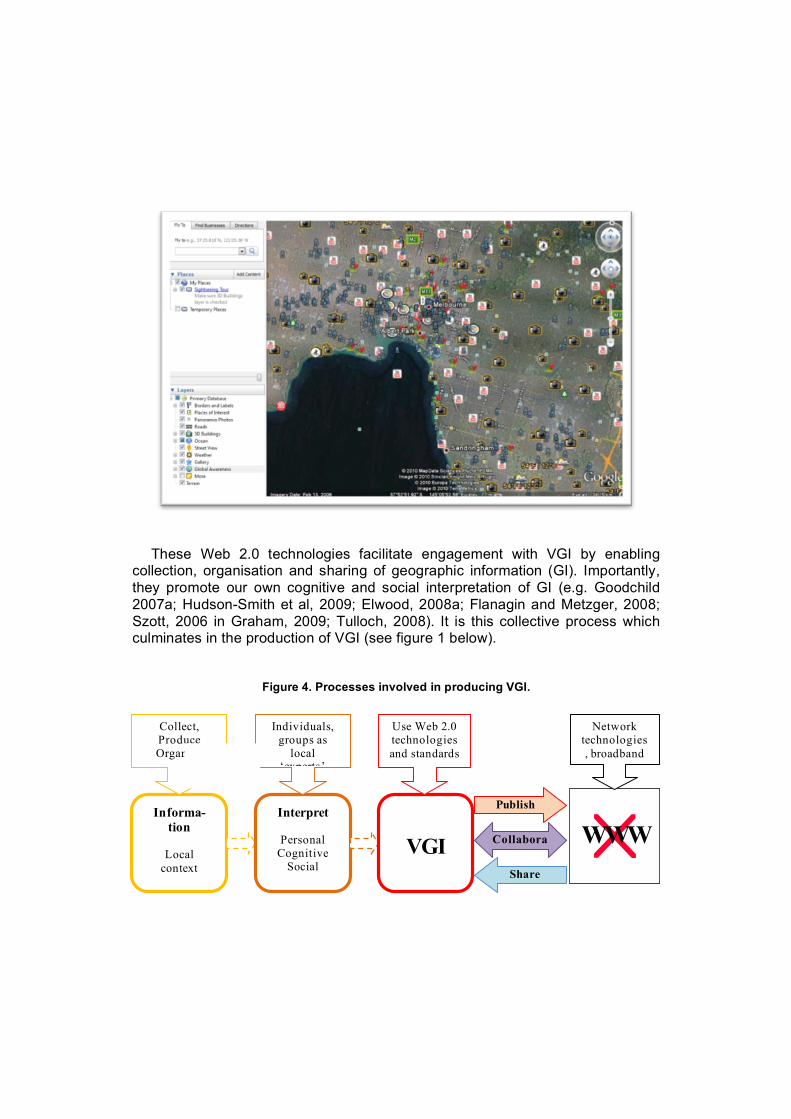
These Web 2.0 technologies facilitate engagement with VGI by enabling collection, organisation and sharing of geographic information (GI). Importantly, they promote our own cognitive and social interpretation of GI (e.g. Goodchild 2007a; Hudson-Smith et al, 2009; Elwood, 2008a; Flanagin and Metzger, 2008; Szott, 2006 in Graham, 2009; Tulloch, 2008). It is this collective process which culminates in the production of VGI (see figure 1 below).
Figure 4. Processes involved in producing VGI.
Informa-tion
Local
context
Interpret
Personal Cognitive
Social
VGI
Collect, Produce Organise
Individuals, groups as
local ‘experts’
Use Web 2.0 technologies and standards
Network technologies, broadband
Publish
Collaborate
Share
WWW
2.3 Value of VGI
Web 2.0 technology may have instigated the development of VGI, but at its core, there is a strong underlying desire for information that is relevant to people’s lives. This is not necessarily always available from official datasets and recognising the gaps in information, people have used VGI as a mechanism for filling this gap; who better to do so than the ‘experts’ themselves – people who are local to the area (Goodchild, 2007b). VGI’s value lies in providing a bottom-up approach to the production, maintenance and updating of GI and present an effective avenue through which ordinary citizens can be engaged in democratic processes (Bishr and Kuhn, 2007). This supports the current view that VGI’s value lies in augmenting existing datasets (e.g. Goodchild, 2007b; Goodchild, 2008a; Elwood, 2008b; Coleman et al, 2009; McDougall, 2009). Without the bureaucracy of government spatial data departments, VGI presents a more flexible application and can be a source of targeted information collection at short notice (e.g. in post-disaster information gathering) (e.g. Nature, 2006 in Budhathoki et al, 2008; Goodchild, 2007b; Elwood, 2008b; Coleman et al, 2009; Laituri and Kodrich, 2008 and Crutcher and Zook, 2009 in Coleman et al, 2009). As a visible representation of people’s thoughts, observations and information about their local environment which has been freely volunteered, VGI can be a potential barometer for people’s concerns and attitudes. 3.4 Issues in VGI
There are some tangible concerns that can be immediately identified in VGI e.g. technical issues like data quality and interoperability (see Bishr and Mantelas, 2008; Grossner and Glennon, 2007 in Elwood, 2008b; Flanagin and Metzger, 2008; Gouveia and Fonseca, 2008; McDougall, 2009). There are also some less tangible concerns that are more difficult to define – these tend to social, legal and institutional ones.
The social issues in VGI encapsulate questions regarding contributor motivations (Anthony et al, 2005; Bishr and Mantelas, 2008), determination of credibility (Goodchild, 2007b; Maue, 2007; Goodchild, 2008a; Goodchild, 2008b; Flanagin and Metzger, 2008, Seeger, 2008) and data accuracy (Goodchild, 2008a; Flanagin and Metzger, 2008; Seeger, 2008; Hudson-Smith et al, 2009), which together affects data quality (Anthony et al, 2005; Flanagin and Metzger, 2008). This is compounded by the fact that due to its recent development, there are still many aspects of VGI that do not yet have standards.
The recent spotlight on Google and Facebook (The Economist, 2010) has highlighted concerns around some of the legal and institutional issues in Web 2.0, which are shared by VGI. Issues around data ownership, confidentiality and

liability are not new and have been found in related areas like participatory GIS and other open environments (see Dunn, 2007; McDougall, 2009). Issues like copyright are beginning to be addressed by applying practices from other areas, for example, the open source Creative Commons licensing initiative. Some countries are beginning to legislate for Web 2.0, applying current legal practices to this new domain. For example, the Australian Copyright Council has released an information sheet to provide users with guidelines protecting user-generated content (UGC) (ACC, 2010) There are also challenges in applying localised information to address challenges on a bigger regional or national scale (Dunn, 2007). Other institutional considerations include identifying the objectives for harnessing and adopting VGI and establishing conditions of VGI data ownership. (Coleman et al, 2009). These issues need to be considered when considering the design of an enabling platform as the value of VGI can only be realised if we can negotiate the challenges posed by its nature and characteristics. 3. CASE STUDIES
To better understand the current practices of VGI and the different platforms used to facilitate participation, this paper will examine three case studies of VGI websites that can demonstrate successful participation with their target communities. The focus will be on the interface elements of these websites and how these facilitate contribution, collaboration and engagement. To make this comparison, this paper will introduce the 9C framework. 3.1 The 9C Framework
The 9C framework has been adapted from Yang et al’s (2008) 8C framework for evaluating Web 2.0 website interfaces, which comprises elements of context, content, community, customisation, communication, connection, commerce and collaboration. Although appropriate for comparing Web 2.0 websites, it does not explicitly take into consideration the function of credibility and the important role it plays not only in VGI, but in other UGC. Therefore, the additional element of credibility has been added to the framework. The evaluation of the user interface elements will also reveal the strategic, operational and technological principles of a website. The elements of the 9C framework are outlined in table 1 below.
Table 1. Overview of 9C framework elements relevant to Web 2.0 and VGI (adapted from Yang et al, 2008).
ELEMENT CRITERIA – WEB 2.0 CRITERIA – VGI Context How is the website organised? How
is the website’s content presented? E.g. static, dynamic
How is geospatial information organised and presented?
Content What type(s) of content is being What type of geospatial content is

offered on the website? E.g. data, services, catalogues
offered on the website?
Community What kind of collaborative communication channels are there?
Does collaborating in geospatial information require specific channels?
Customisation How can content be customised for the user?
No change.
Communication What type(s) of site-to-user communication channels exist? E.g. RSS, blogs
No change.
Connection What kind of external content is linked to the site? E.g. mash-ups
No change.
Commerce What kind of transactional service is available? E.g. data ordering services
No change. *May have limited applicability due to volunteered nature of information.
Collaboration What kind of service is provided to enable collaboration amongst users?
Does collaborating in geospatial content require specific services? License type?
Credibility NA What kinds of statements or policies are published? Is credibility linked with the website’s brand? Is there a system for peer review or ranking?
The following case studies of the BBC Berkshire Flood Map, OpenStreetMap,
and the United States National Snow and Ice Data Centre’s (NSIDC) climate change tour will be discussed with consideration to the abovementioned elements but also the underpinning technologies to explore the types of mechanisms currently used to facilitate contribution. Table 2 provides a summary of the 9C elements of each case study and how they compare relevant to each other. 3.2. BBC Berkshire Flood Map
The BBC Berkshire flood map was created in 2007 by BBC Radio Berkshire journalist, Ollie Williams, in response to the volume of information the radio station was receiving from members of the public in the county and in recognition that the station had no coherent method of displaying all available information on the flood affected areas. Williams used Google Maps to plot BBC radio reports alongside pictures and videos that the public had sent in creating a focal point for both the distribution and access of current information (see figure 5 below). Figure 5. BBC Berkshire’s flood map (www.http://cybersoc.blogs.com/photos/uncategorized
/2007/07/24/ berkshirefloodmashup.jpg).

The BBC site is an example of a simple, short-term and organic VGI mashup website using the Google Map of the area to provide a geographic backdrop onto which images, videos and radio reports are geo-referenced. The interface is simple and highly useable; interestingly, collaboration is facilitated via email, and not through a specific interface element. The site’s community likely preceded the site, being local BBC Radio listeners affected by the flood. Credibility of the site and the information was ensured by affiliation to the BBC brand and the journalist maintaining sole and editorial responsibility over uploaded content. The copyright of the information was covered by Google’s standard Terms of Service. This website shows how applicable and responsive VGI can be in providing information in a post-disaster environment. 3.3 OpenStreetMap
The OpenStreetMap (OSM) project aims to produce a map of the world solely from users’ contributions – which provides an indication of the collective value that can be delivered using VGI. The project, which has existed since 2004, had approximately 260000 registered users on its database as of May 2010 (OpenStreetMap, 2010).
Figure 6. A view of Potlatch, OpenStreetMap’s online editor.

Unlike the BBC website, OSM functions as a platform for viewing and also a tool for creating VGI. The interface is straightforward and functional with the slippy map providing a place-specific way of navigation and customisation. The Potlatch editor (see figure 6 above), though quite technical, is fairly intuitive and employs point-and-click ways of adding points, polygons or places of interest. The concept of the wiki as an interface is employed throughout the website – from the map itself to the help resources. The frequency at which changes are made provides a sense of the OSM online community. Anyone can contribute to OSM at any time as long as they register as a user. However, the contributions are fairly technical, requiring some basic knowledge of the principles of spatial data and topology. For this reason, OSM is regarded as a good example of VGI where users provide fairly technical content. It demonstrates how VGI can be sustained as a long-term, global project which has leveraged the information gathered for commercial purposes. This in turn builds credibility in terms of both organisational reputation and the information being generated. It also typifies the self-regulation that the collective wisdom of the crowd can provide and the resulting quality of information. 3.4 NSIDC Google Earth Climate Change Tour
Figure 7. NSIDC Climate Change Tour on Google Earth.

The NSIDC used Google Earth as a platform for visualising official data on climate change. The tour is provided as a downloadable file on the NSIDC’s website, which is typical for Google Earth mashups (the user loads the file on a desktop version of Google Earth and views the file as a layer).
The tour is an example of VGI where users are not only able to produce their
own GI, but also make this available to others. By mapping data onto Google Earth, the NSDIC has made tangible the effects of climate change – something many people find abstract and difficult to imagine. Many of the tour’s characteristics are determined by Google Earth. Like OSM, Google Earth has two separate functions – as a viewer or browser of pre-uploaded spatial information, and as a platform for others to create and show VGI. As a tool for VGI, Google Earth’s main advantage is in providing a visual presentation of information and by using the KML standard to encode information. However, collaboration is not open in the way that it is open in OSM – produsers need to initiate sharing of the KML files with others by email or by hosting on an external site. On the other hand, the level of customisation is very high with many ways to import data into the browser. However, there are some inherent issues with Google Earth that also serves to highlight the issues in VGI – for example, some countries claim that Google Earth poses a threat to national security due to the resolution of the satellite imagery provided.
4.5 Analysis of Case Studies
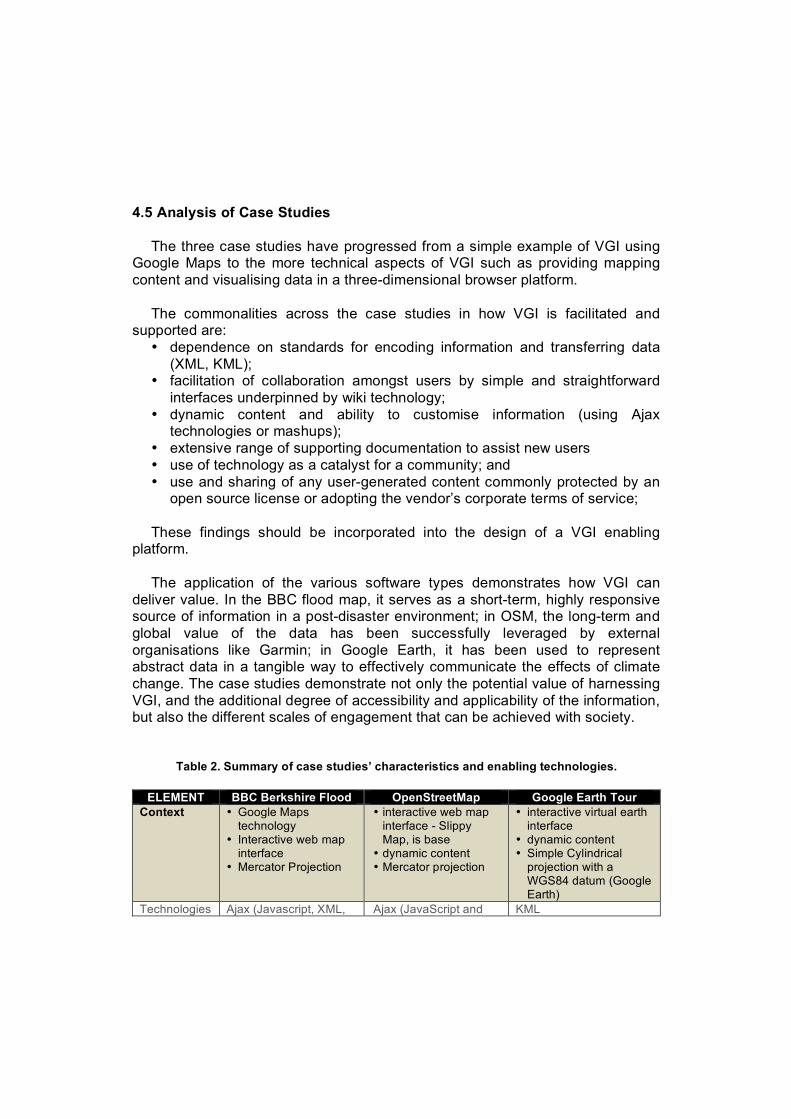
The three case studies have progressed from a simple example of VGI using Google Maps to the more technical aspects of VGI such as providing mapping content and visualising data in a three-dimensional browser platform.
The commonalities across the case studies in how VGI is facilitated and
supported are: • dependence on standards for encoding information and transferring data
(XML, KML); • facilitation of collaboration amongst users by simple and straightforward
interfaces underpinned by wiki technology; • dynamic content and ability to customise information (using Ajax
technologies or mashups); • extensive range of supporting documentation to assist new users • use of technology as a catalyst for a community; and • use and sharing of any user-generated content commonly protected by an
open source license or adopting the vendor’s corporate terms of service;
These findings should be incorporated into the design of a VGI enabling platform.
The application of the various software types demonstrates how VGI can
deliver value. In the BBC flood map, it serves as a short-term, highly responsive source of information in a post-disaster environment; in OSM, the long-term and global value of the data has been successfully leveraged by external organisations like Garmin; in Google Earth, it has been used to represent abstract data in a tangible way to effectively communicate the effects of climate change. The case studies demonstrate not only the potential value of harnessing VGI, and the additional degree of accessibility and applicability of the information, but also the different scales of engagement that can be achieved with society.
Table 2. Summary of case studies’ characteristics and enabling technologies.
ELEMENT BBC Berkshire Flood OpenStreetMap Google Earth Tour Context
• Google Maps technology
• Interactive web map interface
• Mercator Projection
• interactive web map interface - Slippy Map, is base
• dynamic content • Mercator projection
• interactive virtual earth interface
• dynamic content • Simple Cylindrical
projection with a WGS84 datum (Google Earth)
Technologies Ajax (Javascript, XML, Ajax (JavaScript and KML

JSON, IFrame) XML) Open Layers
Content
• mechanism to locate and reference all the BBC reports about the disaster
• Listeners provide updates, images and videos via email to BBC with location details
• Centralised public repository of information about flood
• Content offered as audio, image or video files; flood stages presented as coloured polylines on the map.
• upload spatial data via a GPS trace or via the online map editor, Potlatch
• rendering data as tiles • different layers of data
(alternative renderings stored as views)
• no direct upload available – view-only layer
• sharing of VGI through email or as file downloads on an external site
Technologies JavaScript PNG (placemarks) Youtube (video), JPEG (photographs), audio files
Flash Java Open Layers
KML, KMZ
Community
• BBC radio community provided critical mass for ‘community’
• BBC listeners used to contacting the BBC directly to provide feedback – the same mechanism was preserved
• slippy map is the main forum for collaboration
• help wiki - users can add, edit or delete help information
• community blogs – OpenGeoData, OpenStreetMap Community Blogs
• No community for the tour
• Google Earth Community defacto official forum for Google Earth users but there are many more unofficial sites.
Technologies Wiki Blogs
• Wiki Blogs
Customi-sation
• By location • by location • Usual Google Earth customisation turned off during tour
Technologies NA NA KML, XML Communi-cation
• Communication via publication of information on the map
• Feedback can be provided via email to Williams
• Feeds NA
Technologies RSS XML HTTP
RSS Atom
NA
Connection
NA OSM does not actually have obvious links to
NSIDC

external sites; instead, it takes the reverse approach of showing the pages that link to the OSM main page (approximately 500).
Commerce NA ‘Shop’ functions more as a fund-raising avenue
NA
Collabo-ration
• Use of map as collaborative platform
• Publishing of map made it evident radio station was interested in seeking views and updates on the ground, especially if it provided visual accompaniment and correlation to the audio reports
• Google support resources
• use of common technologies – easy access
• extensive help and support resources provided
• Creative Commons license
• No platform to collaborate further on tour as that is the end product
• Google Earth use of KML specification enables users to create and make available their own VGI
• extensive help and support resources – both official and unofficial
• Google Earth supports 39 languages
Technologies Google’s Terms of Service
Creative Commons Attribution-ShareAlike 2.0 license
Google’s Terms of Service
Credibility • BBC brand – created and updated by BBC journalist
• Contributions vetted by journalist
• User comments • Date and time of
updates, as well as contributors’ real names provided
• account registration • log of all changes and
timestamp provided freely
• strength of OSM brand
• Commercial viability of data lends credibility
• reputation of NSIDC as producer of climate change tour
• account registration needed to access Google Earth Community
• Strength of Google brand and its chosen data partners
Technologies Email Ratings Comments
Account registration
Account registration
5. AN ENABLING PLATFORM FOR VGI: A CONCEPTUAL FRAMEWORK
The earlier sections have outlined the key technological facilitators of VGI, being the wiki, the mashup and the use of folksonomies, with the desire for relevant information providing the main social driver. Utilising the findings from the current understanding of VGI and the case studies, this paper proposes a conceptual framework that considers the current use of the SDI platform in tandem with the characteristics of VGI.
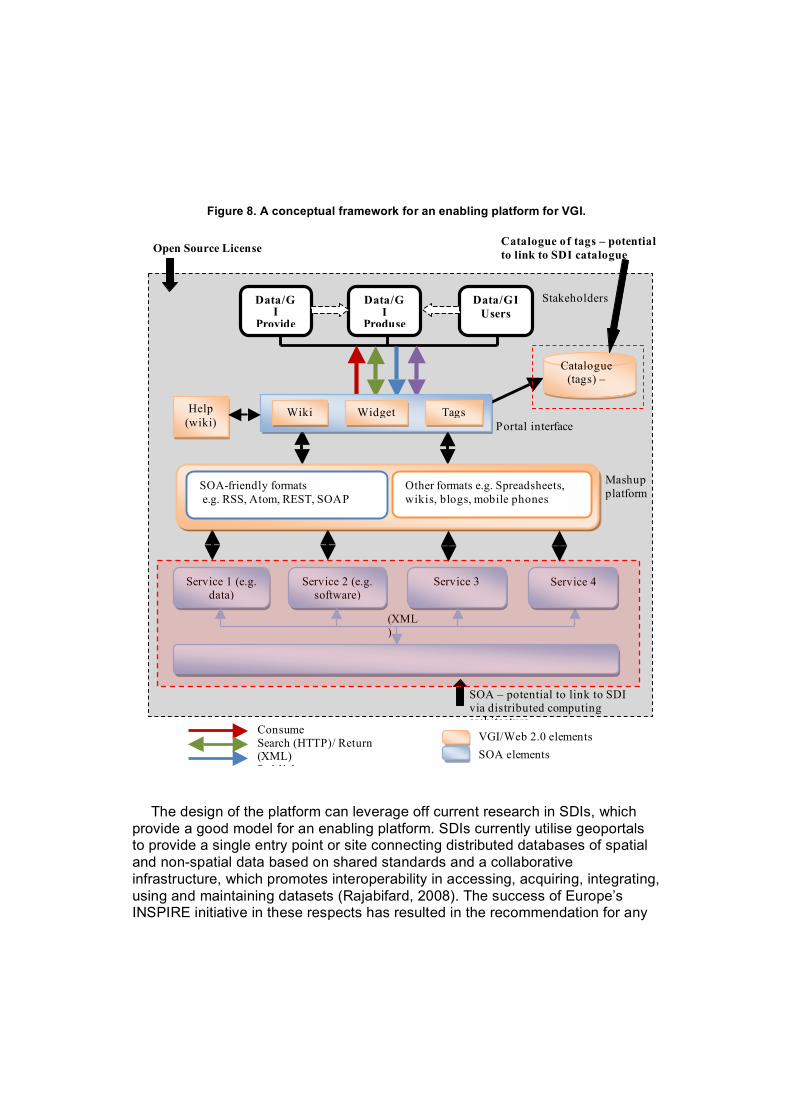
Figure 8. A conceptual framework for an enabling platform for VGI.
The design of the platform can leverage off current research in SDIs, which provide a good model for an enabling platform. SDIs currently utilise geoportals to provide a single entry point or site connecting distributed databases of spatial and non-spatial data based on shared standards and a collaborative infrastructure, which promotes interoperability in accessing, acquiring, integrating, using and maintaining datasets (Rajabifard, 2008). The success of Europe’s INSPIRE initiative in these respects has resulted in the recommendation for any
Portal interface
Mashup platform
SOA – potential to link to SDI via distributed computing architecture
Stakeholders
Consume Search (HTTP)/ Return (XML) Publish
VGI/Web 2.0 elements SOA elements
Data/GI
Provider
Data/GI Users
Data/GI
Produser
Catalogue
(tags) –
SOA-friendly formats e.g. RSS, Atom, REST, SOAP
Other formats e.g. Spreadsheets, wikis, blogs, mobile phones
Catalogue of tags – potential to link to SDI catalogue Open Source License
Widget Wiki Tags Help (wiki)
SOA
(XML)
Service 1 (e.g. data)
Service 2 (e.g. software)
Service 4 Service 3

platform to adopt INSPIRE’s operating principles to ensure data efficiency, cataloguing, interoperability, accessibility and the primacy of the spatial component of any information type (Rajabifard, 2007). SDI research also recommends that such a distributed system is underpinned by a service-oriented architecture (SOA) (Rajabifard, 2010). However, a major drawback in using the current SDI model is the delineation of the roles between GI producer and user/consumer – this concept has no provision for the produser nor can it integrate UGC, both of which are integral to VGI (Budhathoki et al, 2008; Elwood, 2008b).
The framework proposed (see figure 8 above) seeks to build on the current SDI model with amendments to allow for both the produsing paradigm and integration of UGC. Similar to the SDI model, the framework uses a SOA-based portal, providing theoretical potential to link the VGI platform to the SDI to form one interconnected distributed system, but differing in the interface elements to support VGI characteristics. The interface uses mashups, wikis and tags to provide new elements to facilitate produsage, collaboration and UGC. As seen from the case studies, mashups provide a flexible and customisable way of interacting with dynamic content and aggregating different information sources to produse new information. It can interact with many SOA formats such as RSS and Atom, and even beyond that to spreadsheets and even mobile phones, manifested as widgets (Warner and Crupi, 2008). The provision of widgets can provide a way for users to reuse and reinterpret the prodused VGI. The case studies have also show that wikis facilitate contributions by providing produsers with a way to upload GI, and to contribute or maintain the platform’s support resources, which play a role in encouraging participation.
Information uploaded to the platform could be tagged using the Web 2.0
practice of folksonomies or according to a provided list of geographic categories. The use of tags enables the produser to provide metadata to aid in the discovery of information, and a way of classifying the VGI that is being uploaded onto the site. The database of tags could then not only serve as a catalogue, but also provide a way to link VGI to similar classifications of SDI information, and hence, eventually enable integration with the SDI itself.
The key benefit of this framework is that the technologies for enabling
mashups currently exist in most distributed web environments – by simply reusing available resources, mashups provide a new cost-efficient opportunity to engage new users in SDIs who would otherwise have been disengaged. It also opens up new avenues for creating information, which could then be made available for others to reuse. The classification of VGI by tags promotes discovery and assessment of fitness-of-purpose, and therefore could enable VGI to be harnessed for specific projects. Through the site’s communication to its users, organisations could make requests to the community if they needed

information to cover current gaps in datasets. If the platform was integrated with an SDI, it would provide a means of updating and maintaining current data, providing locally-relevant (bottom-up) information to supplement official datasets.
Some of the immediate challenges in this framework are shared by VGI and SDI in general; however, by engaging infinitely more users, it is likely that these issues will be magnified. Although there is currently no standard specification for mashup format, its tendency to use current standardised data formats means it is possible to combine itself, and the SOA underpinning it, to external information standards insofar as the standards adopted are the same. The tagging of information presents a quandary – if folksonomies are permitted, tags could become quite diverse; conversely, not using folksonomies is infinitely worse as information will no longer be discoverable. There is also the semantic challenge of aligning folksonomies with official taxonomy classifications. However, the advent of the semantic web may provide solutions to this issue. At a broader level, there is also the issue of security and governance – the use of mashups will likely compromise the security of the overall systems; however, there is current research looking at the concept of enterprise mashups to overcome these issues (see Warner and Crupi, 2008). 6. FUTURE DIRECTIONS
The conceptual framework presented in this study should ideally be built and tested against real-life scenarios to gauge its viability as a construct. There also needs to be research into some of the issues highlighted above – for example, the semantic alignment of folksonomies and official taxonomies and use of enterprise mashups to ensure security and governance.
It is also necessary to consider some of the trends that are developing in ICT
technologies. These include the use of Representational State Transfer (REST) architecture for network information repositories and services instead of SOA as REST being a lighter system that places a greater emphasis on distribution (Vinoski, 2007). The convergence of Web 2.0 and SOA philosophies is also likely to result in a global SOA termed “Internet of Services” (IoS), which attributes Web 2.0 philosophies to opening up delivery of services on the internet via a decentralised model (which otherwise would have limited accessibility) (Schroth and Janner, 2007: 40). For VGI, IoS is likely to have significant applicability especially with the development of spatial marketplaces to transact in spatial information and research needs to be undertaken to realise this development. 7. CONCLUSION
This paper considered the potential of VGI as a role for citizens in meeting the challenges of realising SES. VGI, the practice of GI production by ordinary
citizens (that is, people typically unskilled in geographic or spatial concepts), may provide a potential channel of engaging the broader society. In VGI, individuals are encouraged to produse GI by utilising Web 2.0 technologies such as wikis, geospatial browsers, mashups and folksonomies. The roles these mechanisms play are strongly evidenced in the case studies used, which analysed current practices in VGI. The focus of current challenges in VGI has been on technical aspects such as data and semantic interoperability. There is however, a raft of social, legal and institutional issues that need to be negotiated in order to realise the value of VGI. These include credibility, liability, and copyright and data ownership.
The report proposed a conceptual framework for an enabling platform for VGI leveraging off current SDI research recommending the use of a SOA-based portal and the adopting of INSPIRE’s operating principles. However, to facilitate VGI, it includes a mashups, widgets, wikis and tags in the interface. The additional interface elements cater for the produsing and collaborative character of VGI. The potential ways to link to an SDI are through the use of SOA, and by finding a way to align the respective catalogues. Some of the issues inherent in the framework are localised, such as semantic issues associated with the use of folksonomies, as well as broader challenges such as system security and governance. To address these issues, this framework needs to be tested in real life scenarios. However, there are also trends in ICT technologies that may yield potential solutions such as the development of the semantic web, which may help align the use of folksonomies with more formal ontologies, and IoS, which may help delivery of services.
This paper has demonstrated that VGI can play a role in engaging the wider
society by facilitating citizen participation. The conceptual platform, which takes into consideration VGI characteristics and practices, is an attempt to propose how data integration can be facilitated between VGI and SDI, given the different social, technical, legal and institutional factors. In doing so, the findings from this paper can contribute to current discourse on realising the vision of a spatially enabled society. REFERENCES ACC (2010). User-Generated Content Information Sheet. Australian Copyright
Council website. at http://www.copyright.org.au/g108.pdf [accessed 15 June 2010].
Anthony, D., Smith, S.W and Williamson, T. (2005). Explaining Quality in Internet
Collective Goods: Zealots and Good Samaritans in the Case of Wikipedia. MIT Sloan Technological Innovation, Entrepreneurship and Strategy Seminar website at

http://web.mit.edu/iandeseminar/Papers/Fall2005/anthony.pdf [accessed 20 January 2010].
Bishr, M. and Kuhn, W. (2007). Geospatial Information Bottom-Up: A Matter of
Trust and Semantics. The European Information Society: Lecture Notes in Geoinformation and Cartography, Part 9, pp. 365-387. Berlin, Heidelberg: Springer.
Bishr, M. and Mantelas, L. (2008). A Trust and Reputation Model for Filtering and
Classifying Knowledge about Urban Growth. GeoJournal, 72 (3-4): 229-237.
Bruns, A. (2007). The Future is User-Led: The Path towards Widespread
Produsage. Fibreculture Journal, 15-18 September 2007. Budhathoki, N.R., Bertram, B. and Nedovic-Budic, Z.(2008). Reconceptualizing
the Role of the User of Spatial Data Infrastructure. GeoJournal, 72(3-4): 149-160.
Butler, D., (2006). The Web-Wide World. Nature, 439 (7078): 776–778. Castelein, W., Grus, L., Crompvoets, J. and Bregt, A. (2010). “A Characterization
of Volunteered Geographic Information”. Proceedings 13th AGILE International Conference on Geographic Information Science 2010, Guimarães, Portugal at http://plone.itc.nl/agile_old/Conference/2010-guimaraes/ShortPapers_PDF%5C106_DOC.pdf [accessed 3 June 2010].
Coleman, D.J., Georgiadou, Y. And Labonte, J. (2009). Volunteered Geographic
Information: The Nature and Motivation of Produsers. International Journal of Spatial Data Infrastructures Research, 4: 332-358
Crupi, J. and Warner, C. (2008). Enterprise Mashups Part I: Bringing SOA to the
People. The SOA Magazine, Issue 28, May 2008 at http://www.soamag.com/I18/0508-1.asp [accessed 30 May 2010].
Dunn, C. (2007) Participatory GIS – A People’s GIS? Progress in Human
Geography, 31(5): 616-637. Elwood, S. (2008a). Volunteered Geographic Information: Key Questions,
Concepts and Methods to Guide Emerging Research and Practice. GeoJournal, 72 (3-4): 133-135.

Elwood, S. (2008b). Volunteered Geographic Information: Future Research Directions Motivated by Critical, Participatory, and Feminist GIS. GeoJournal, 72 (3-4): 173-183.
Flanagin, A.J. And Metzger, M.J. (2008). The Credibility of Volunteered
Geographic Information. GeoJournal, 72 (3-4): 137-148. Goodchild, M.F. (2007a). Citizens as Voluntary Sensors: Spatial Data
Infrastructure in the World of Web 2.0. International Journal of Spatial Data Infrastructures Research, Vol. 2: 24-32.
Goodchild, M.F. (2007b). Citizens as Sensors: The World of Volunteered
Geographic Information. Position paper for the Specialist Meeting, Workshop on Volunteered Geographic Information, December 13-14, 2007, Santa Barbara, CA, USA at http://ncgia.ucsb.edu/projects/vgi/docs/position/Goodchild_VGI2007.pdf [accessed 20 January 2010].
Goodchild, M.F. (2008a). Spatial Accuracy 2.0. Proceedings 8th International
Symposium on Spatial Accuracy Assessment in Natural Resources and Environmental Sciences, Shanghai 2007 at http://www.geog.ucsb.edu/~good/papers/453.pdf [accessed on 20 January 2010].
Goodchild, M.F. (2008b). Commentary: Whither VGI? GeoJournal, 72 (3-4):
239-244. Gouveia, C. and Fonseca, A. (2008). New Approaches to Environmental
Monitoring: The Use of ICT to Explore Volunteered Geographic Information. GeoJournal, 72 (3–4): 185-197.
Graham, M. (2009). Neogeography and the Palimpsests of Place: Web 2.0 and
the Construction of a Virtual Earth. Pre-publication version of paper to appear in Tijdschrift voor economische en sociale geografie (Journal of Economic & Social Geography), Issue 101 or 102 at http://geospace.co.uk/files/Neogeography.pdf [accessed on 26 February 2010].
Hudson-Smith, A., Crooks, A., Gibin, M., Milton, R. And Batty, M. (2009).
NeoGeography and Web 2.0: Concepts, Tools and Applications. Journal of Location Based Services, 3 (2): 118-145.
Li, S. and Gong, J. (2008). Mashup: A New Way of Providing Web Mapping/GIS
Services. Proceedings 37th Congress of the International Archives of the
Photogrammetry, Remote Sensing and Spatial Information Sciences, Beijing 2008 at http://www.isprs.org/proceedings/XXXVII/congress/4_pdf/114.pdf [accessed on 6 June 2010].
Masser, I. (2005). GIS Worlds: Creating Spatial Data Infrastructures (First ed.).
Redlands, California: ESRI Press. McDougall, K. (2009). Volunteered Geographic Information for Building SI. In B.
Ostendorf, P. Baldock, D. Bruce, M. Burdett, and P. Corcoran (eds.), Proceedings of the Surveying and Spatial Sciences Institute: Biennial International Conference, Adelaide 2009. Surveying and Spatial Sciences Institute, pp. 645-653.
OpenStreetMap (2010). OpenStreetMap Statistics. OpenStreetMap Wiki at
http://www.openstreetmap.org/stats/data_stats.html [accessed on 16 May 2010].
O’Reilly, T. (2005). What is Web 2.0? Design Patterns and Business Models for
the Next Generation of Software, O’Reilly Media, at http://oreilly.com/web2/archive/what-is-web-20.html [accessed on 25 April 2010].
Rajabifard, A. (2007). Towards a Spatially Enabled Society. A. Rajabifard (ed).
University of Melbourne, Australia: Centre for SDIs and Land Administration.
Rajabifard, A. (2008). SDI Design to Facilitate Spatially Enabled Government and
Society. Paper from ISPRS workshop on Geoinformation and Decision Support Systems and 4th GIS Conference, 6-7 January, Tehran, Iran at http://www.csdila.unimelb.edu.au/publication/conferences/ISPRS%202008-Tehran-SDI%20and%20Spatially%20Enabled%20Society.doc.pdf [accessed on 3 March 2010].
Rajabifard, A. (2009). Realizing Spatially Enabled Societies – A Global
Perspective in Response to Millennium Development Goals. Proceedings 18th United Nations Regional Cartographic Conference for Asia and the Pacific, Bangkok 2009 at http://unstats.un.org/unsd/methods/cartog/Asia_and_Pacific/18/Papers/IP/IP%204%20-%20Abbas%20Rajabifard-%20Keynote%20paper.pdf [accessed on 20 January 2010].
Rajabifard, A. (2010). Spatially Enabled Government and Society- The Global
perspective. Plenary Session 2 – Spatially Enabled Society, FIG

Congress 2010: Facing the Challenges – Building the Capacity, Sydney, Australia, 11-16 April 2010 at http://www.csdila.unimelb.edu.au/publication/conferences/Fig2010/SpatiallyEnabledGovernmentandSociety_the%20Global_Perspective.pdf [accessed 19 May 2010].
Schroth, C. And Janner, T. (2007). Web 2.0 and SOA: Converging Concepts
Enabling the Internet of Services. IT Professional, May/June 2007 issue, pp. 36-41.
Seeger, C.J. (2008). The Role of Facilitated Volunteered Geographic Information
in the Landscape of Planning and Site Design Process. GeoJournal, 72 (3-4): 199-213.
The Economist (2010). Dicing with Data. The Economist online, May 20, 2010 at
http://www.economist.com/node/16163396 [accessed on 29 May 2010]. Tulloch, D.L. (2008). Is VGI Participation? From Vernal Pools to Video Games.
GeoJournal, 72 (3-4): 161-171. Vinoski, S. (2007). REST Eye for the SOA Guy. Internet Computing, Issue 1,
January/February 2007. Wallace, J., Williamson, I., Rajabifard, A. and Bennett, R. (2006). Spatial
Information Opportunities for Government. Spatial Science Journal, 51 (1): 79-99.
Warner, C. and Crupi, J. 2008. Enterprise Mashups Part II: Why SOA Architects
Should Care. SOA Magazine, Issue 21, August 2008 at http://www.soamag.com/I21/0808-1.asp [accessed on 30 May 2010].
Williamson, I., Grant, D., & Rajabifard, A. (2005). Land administration and spatial
data infrastructures. Proceedings 8th Global Spatial Data Infrastructure Conference and FIG Working Week: From Pharaohs to Geoinformatics, Cairo, Egypt, April 16-21, 2005 at http://www.fig.net/pub/cairo/papers/ts_01/ts01_01_williamson_etal.pdf [accessed on 23 March 2010].
Yang, T.A., Kim, D.J., Dhalwani, V. And Vu, T.K. (2008). The 8C Framework as a
Reference Model for Collaborative Value Webs in the Context of Web 2.0. Proceedings 41st Hawaii International Conference on System Sciences, pp. 319-328. Washington, D: IEEE Computer Society.