Embed Size (px)
DESCRIPTION
Learn to identify and graph linear equations. Vocabulary. linear equation rate of change. - PowerPoint PPT Presentation
Citation preview
Graphing Linear Equations12-1
Learn to identify and graph linear equations.
Graphing Linear Equations12-1
Vocabulary
linear equation
rate of change
Graphing Linear Equations12-1
A linear equation is an equation whose solutions fall on a line on the coordinate plane. All solutions of a particular linear equation fall on the line, and all the points on the line are solutions of the equation.
Graphing Linear Equations12-1
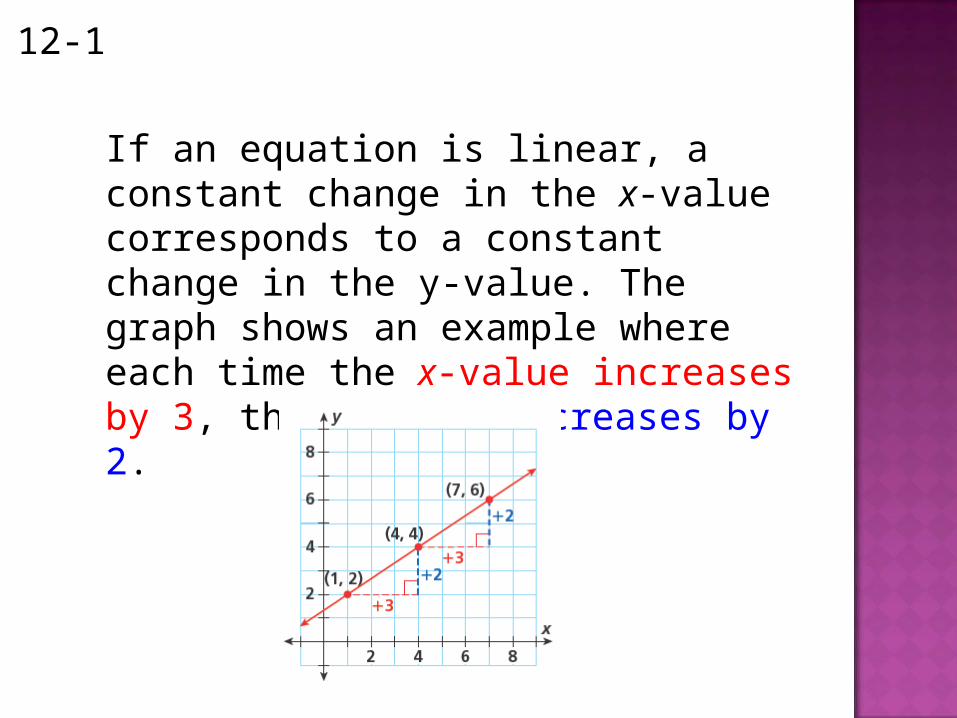
If an equation is linear, a constant change in the x-value corresponds to a constant change in the y-value. The graph shows an example where each time the x-value increases by 3, the y-value increases by 2.
Graphing Linear Equations12-1
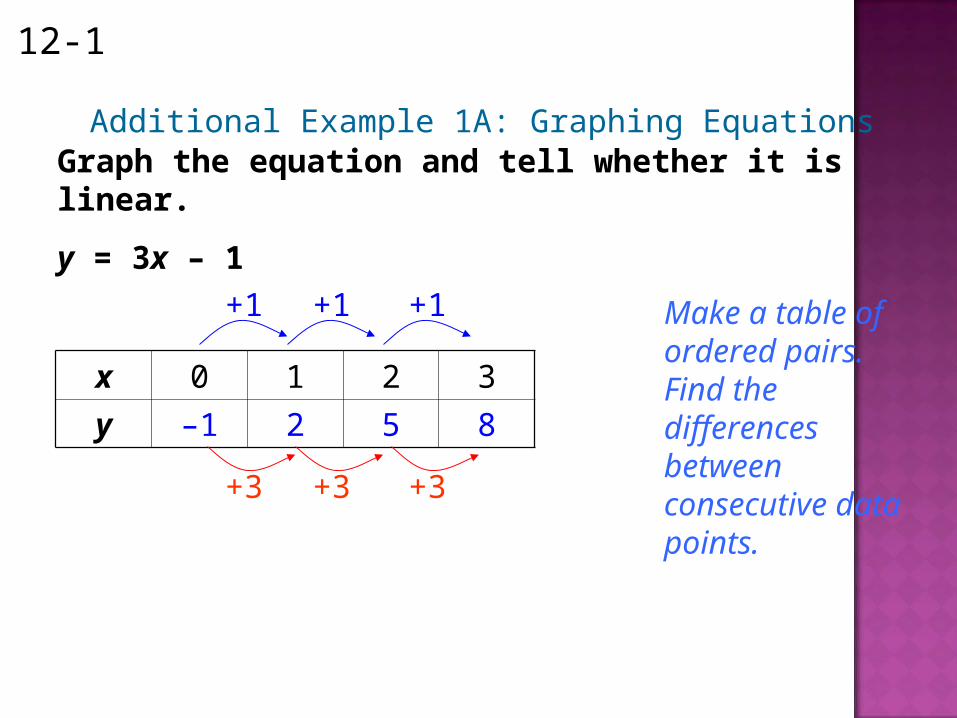
Graph the equation and tell whether it is linear.
y = 3x – 1
Additional Example 1A: Graphing Equations
x 0 1 2 3
y –1 2 5 8
+3 +3 +3
Make a table of ordered pairs. Find the differences between consecutive data points.
+1 +1 +1
Graphing Linear Equations12-1
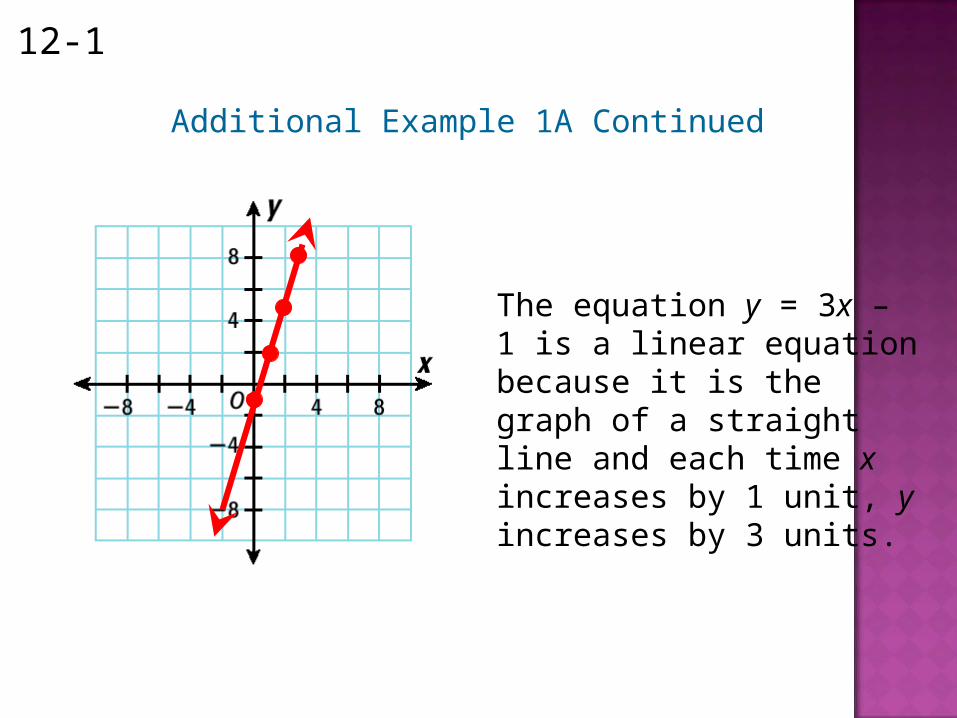
Additional Example 1A Continued
The equation y = 3x – 1 is a linear equation because it is the graph of a straight line and each time x increases by 1 unit, y increases by 3 units.
Graphing Linear Equations12-1
Be careful when graphing each ordered pair. Double check each point you plot.
Caution!
Graphing Linear Equations12-1
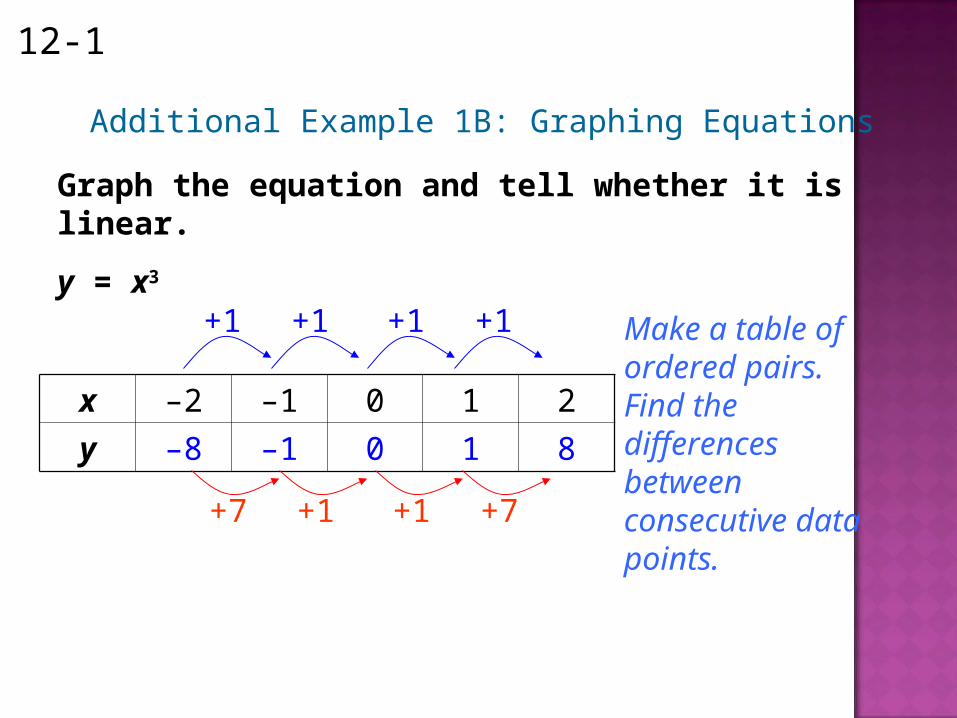
Graph the equation and tell whether it is linear.
y = x3
Additional Example 1B: Graphing Equations
Make a table of ordered pairs. Find the differences between consecutive data points.
x –2 –1 0 1 2
y –8 –1 0 1 8
+7 +1 +1 +7
+1 +1 +1 +1
Graphing Linear Equations12-1
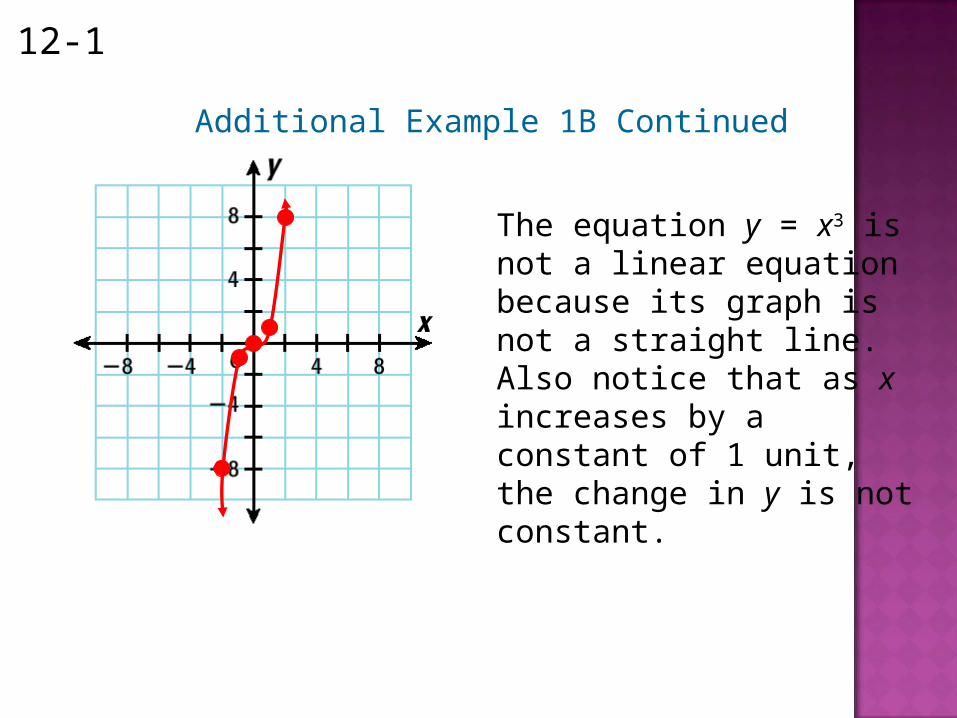
Additional Example 1B Continued
The equation y = x3 is not a linear equation because its graph is not a straight line. Also notice that as x increases by a constant of 1 unit, the change in y is not constant.
Graphing Linear Equations12-1
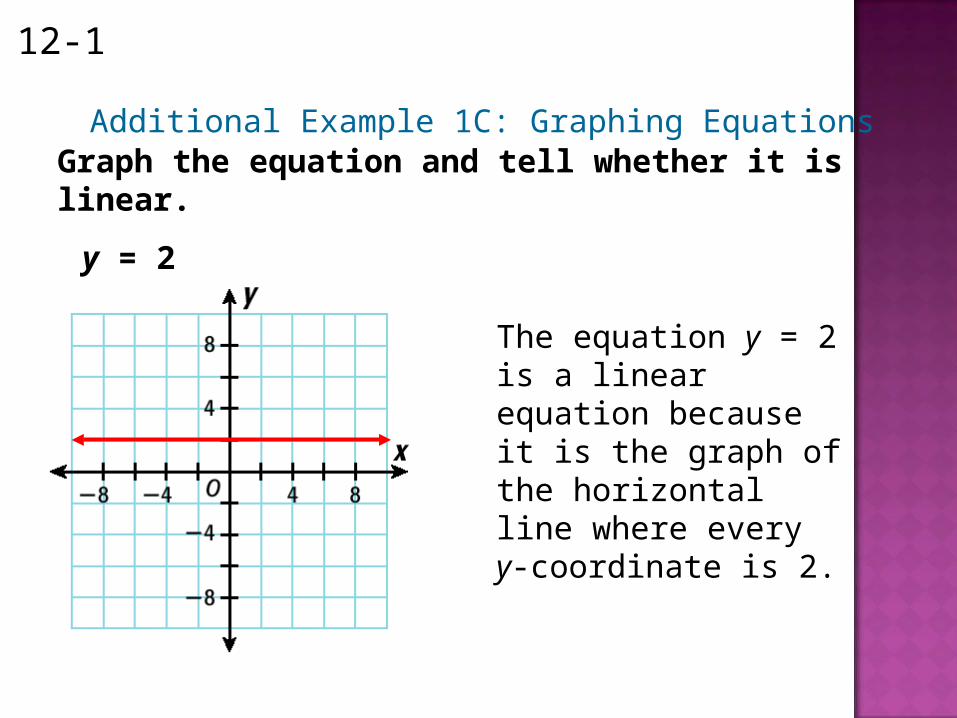
Additional Example 1C: Graphing EquationsGraph the equation and tell whether it is linear.
y = 2
The equation y = 2 is a linear equation because it is the graph of the horizontal line where every y-coordinate is 2.
Graphing Linear Equations12-1
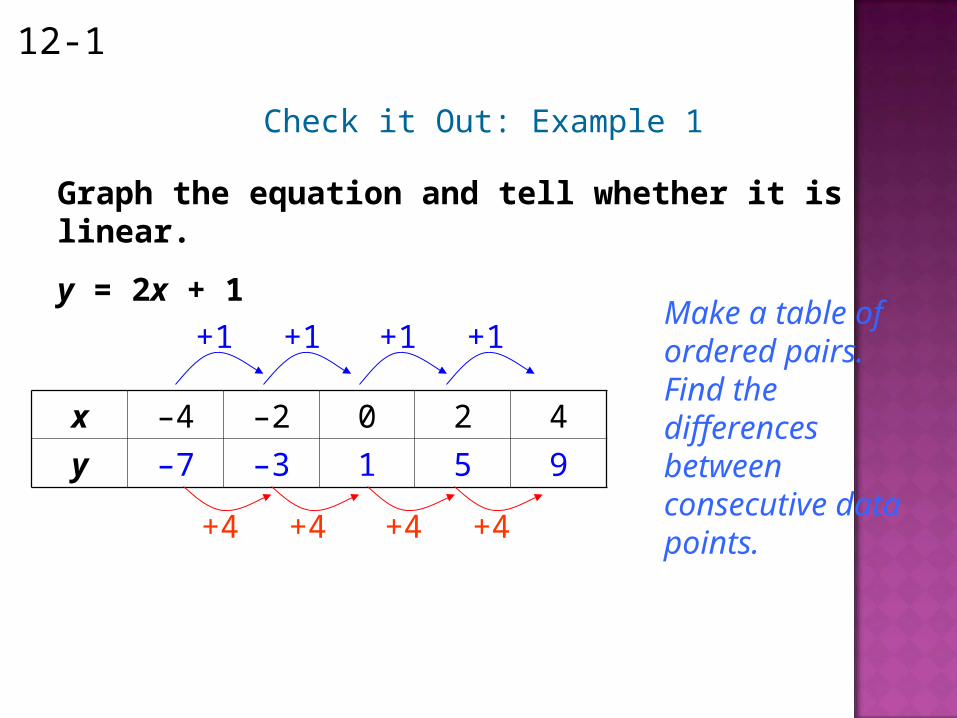
Graph the equation and tell whether it is linear.
y = 2x + 1
Check it Out: Example 1
x –4 –2 0 2 4
y –7 –3 1 5 9
+4 +4 +4 +4
+1 +1 +1 +1Make a table of ordered pairs. Find the differences between consecutive data points.
Graphing Linear Equations12-1
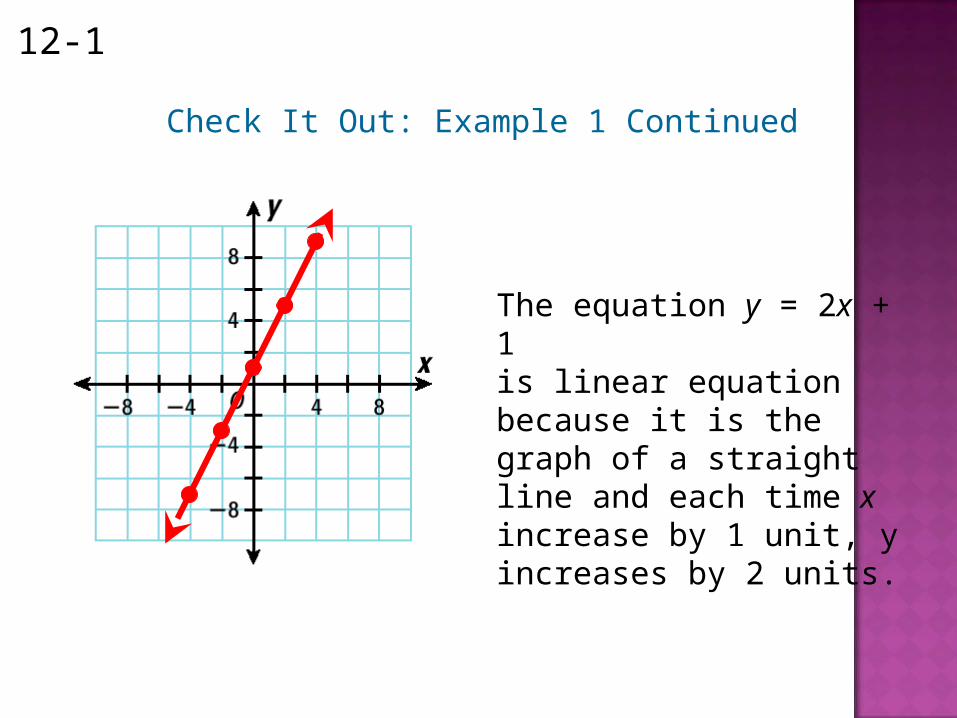
Check It Out: Example 1 Continued
The equation y = 2x + 1is linear equation because it is the graph of a straight line and each time x increase by 1 unit, y increases by 2 units.
Graphing Linear Equations12-1
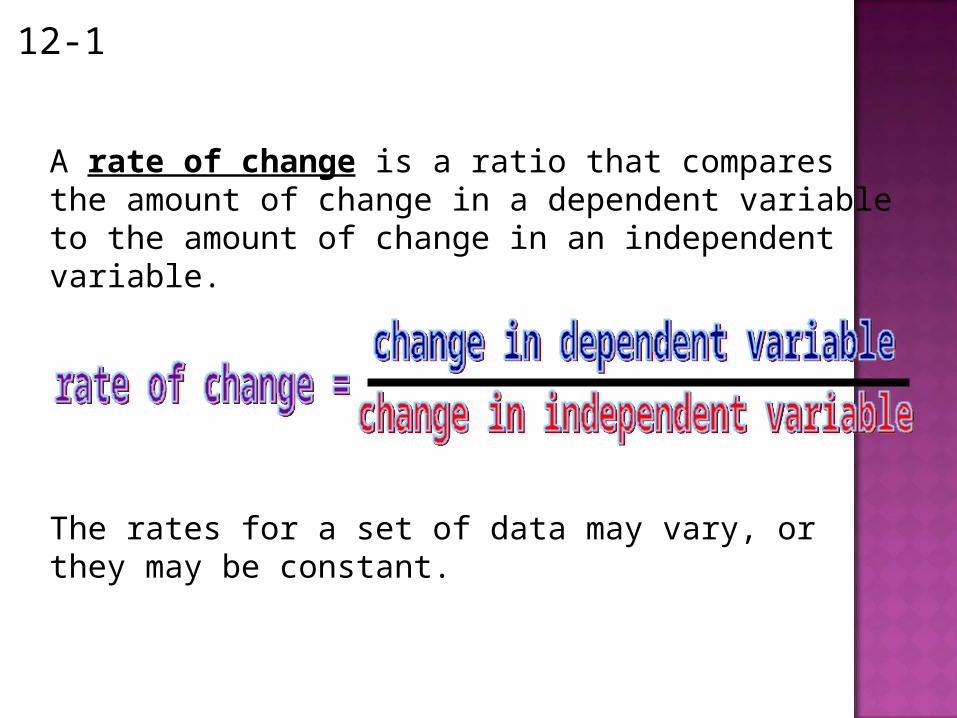
A rate of change is a ratio that compares the amount of change in a dependent variable to the amount of change in an independent variable.
The rates for a set of data may vary, or they may be constant.
Graphing Linear Equations12-1
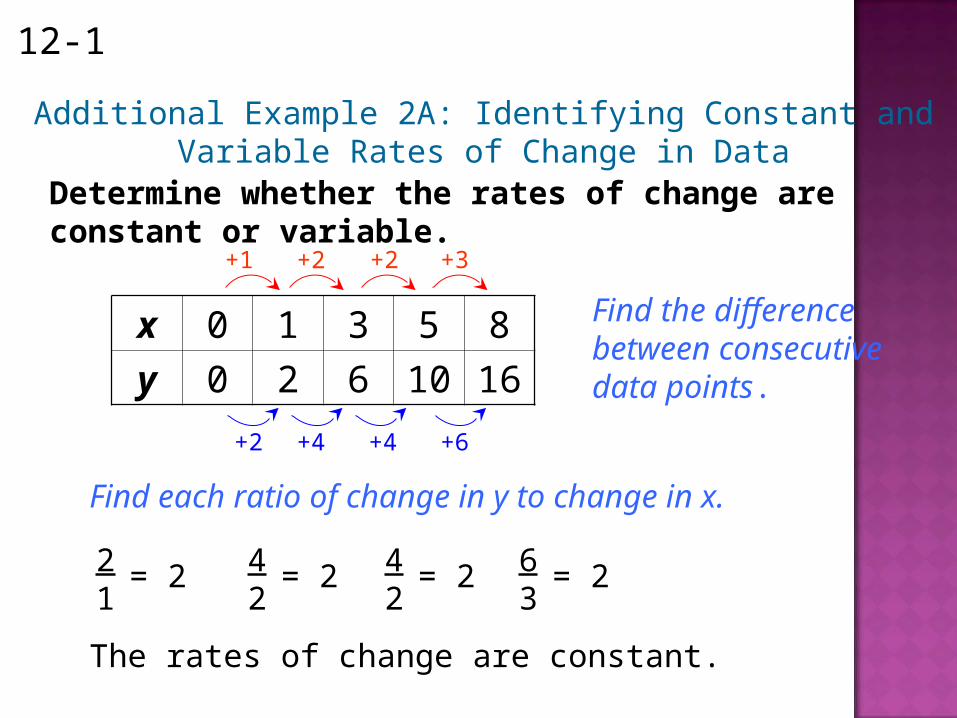
Determine whether the rates of change are constant or variable.
Additional Example 2A: Identifying Constant and Variable Rates of Change in Data
Find the difference between consecutive data points.
x 0 1 3 5 8
y 0 2 6 10 16
+1 +2 +2 +3
+2 +4 +4 +6
Find each ratio of change in y to change in x.
2 1
= 2 4 2
= 2 4 2
= 2 6 3
= 2
The rates of change are constant.
Graphing Linear Equations12-1
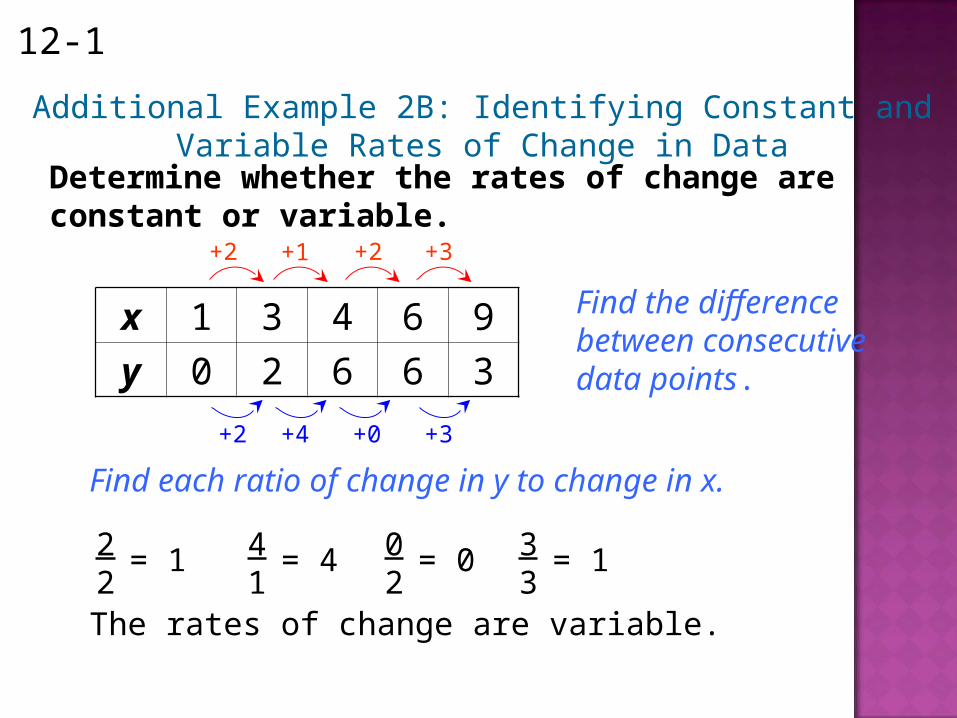
Determine whether the rates of change are constant or variable.
Additional Example 2B: Identifying Constant and Variable Rates of Change in Data
Find the difference between consecutive data points.
x 1 3 4 6 9
y 0 2 6 6 3
+2 +1 +2 +3
+2 +4 +0 +3
Find each ratio of change in y to change in x.
2 2
= 1 4 1
= 4 0 2
= 0 3 3
= 1
The rates of change are variable.
Graphing Linear Equations12-1
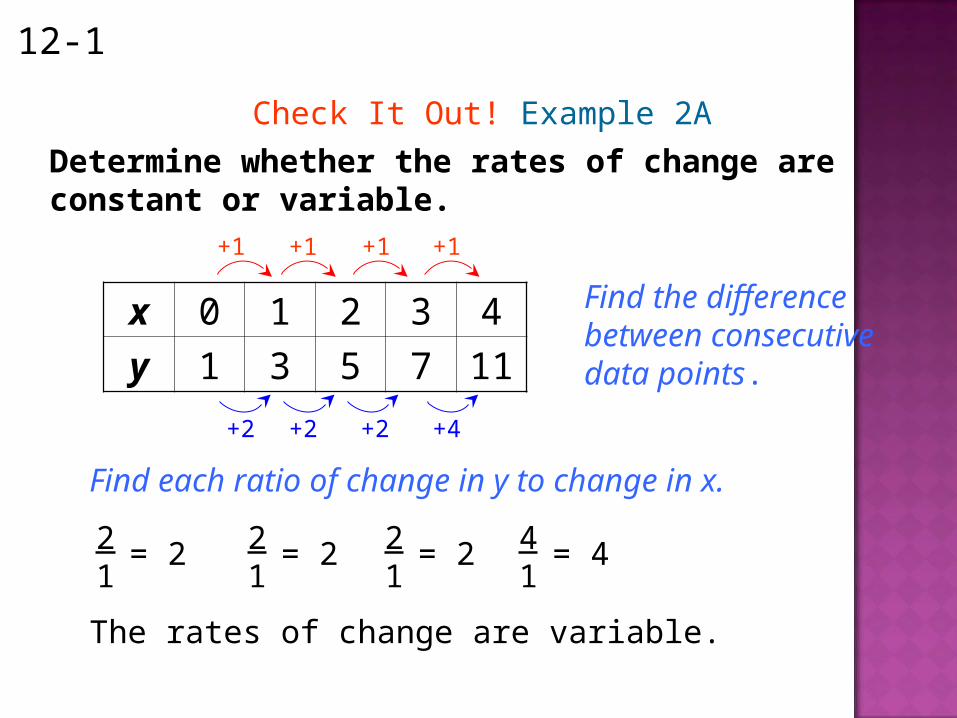
Determine whether the rates of change are constant or variable.
Check It Out! Example 2A
Find the difference between consecutive data points.
x 0 1 2 3 4
y 1 3 5 7 11
+1 +1 +1 +1
+2 +2 +2 +4
Find each ratio of change in y to change in x.
2 1
= 2 2 1
= 2 2 1
= 2 4 1
= 4
The rates of change are variable.
Graphing Linear Equations12-1
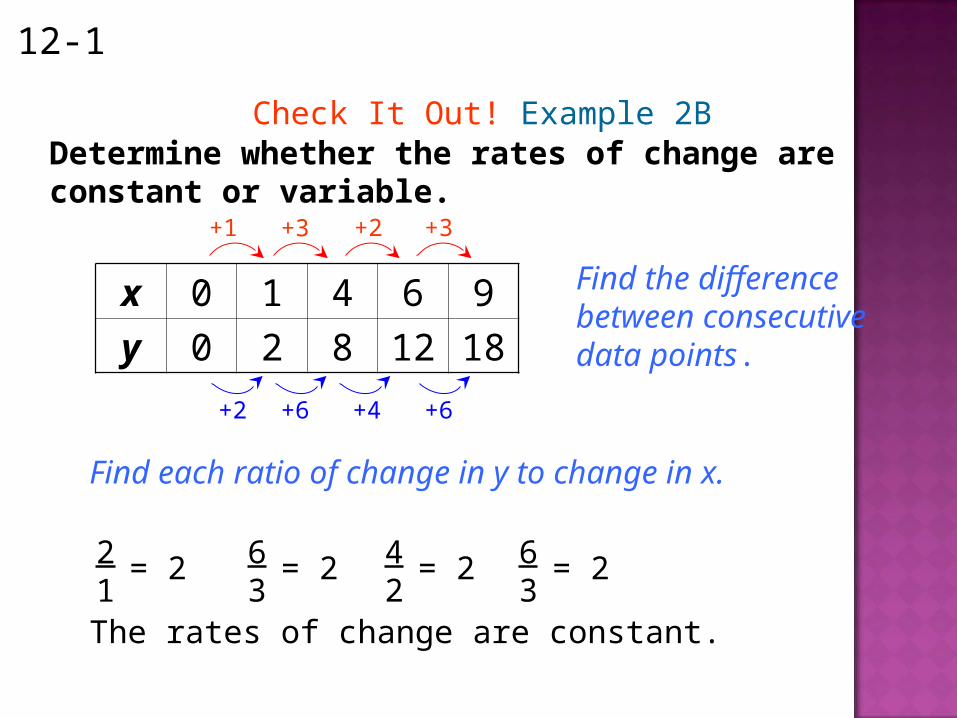
Determine whether the rates of change are constant or variable.
Check It Out! Example 2B
Find the difference between consecutive data points.
x 0 1 4 6 9
y 0 2 8 12 18
+1 +3 +2 +3
+2 +6 +4 +6
Find each ratio of change in y to change in x.
2 1
= 2 6 3
= 2 4 2
= 2 6 3
= 2
The rates of change are constant.
Graphing Linear Equations12-1
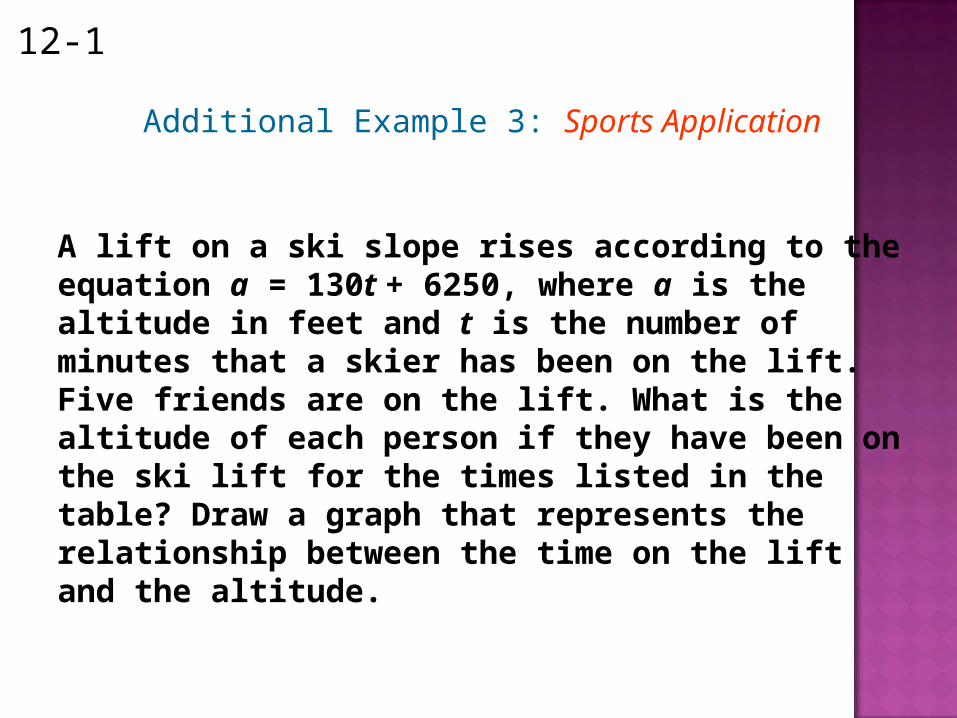
Additional Example 3: Sports Application
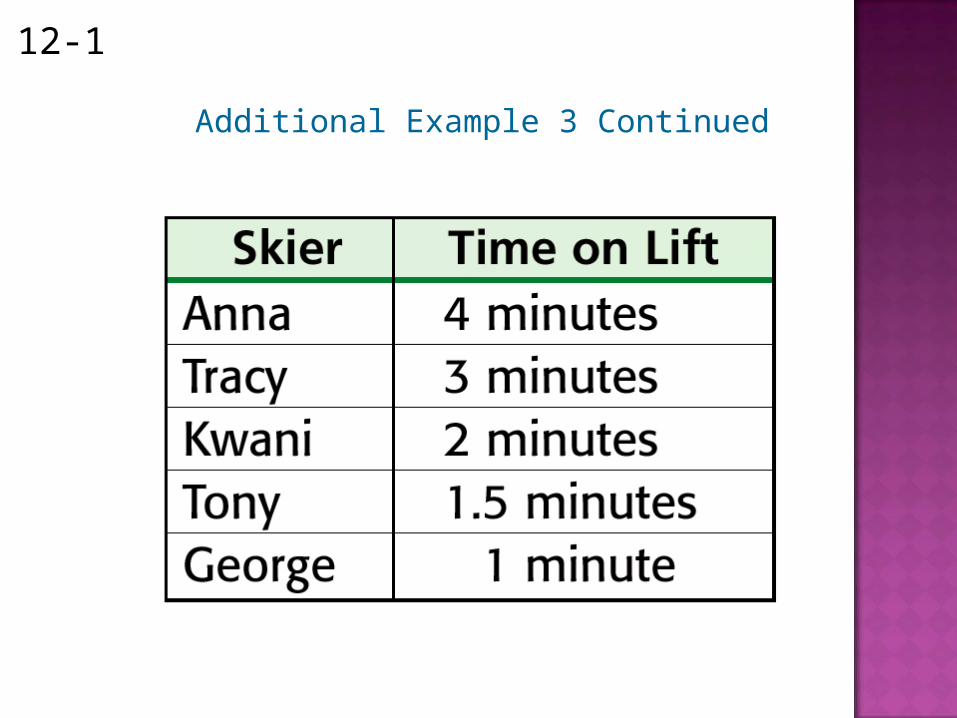
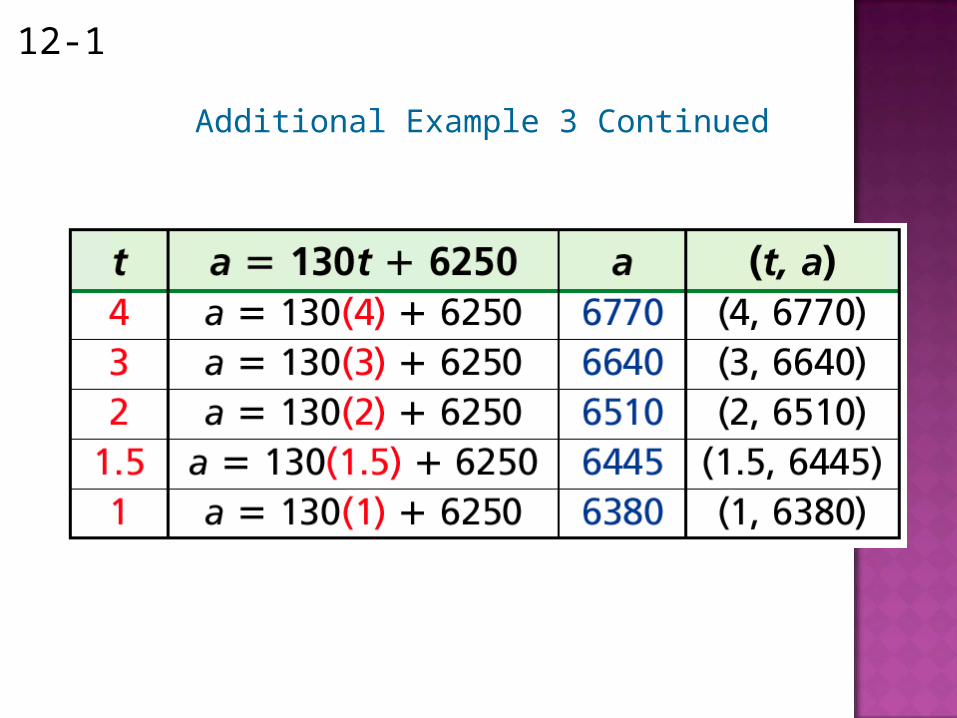
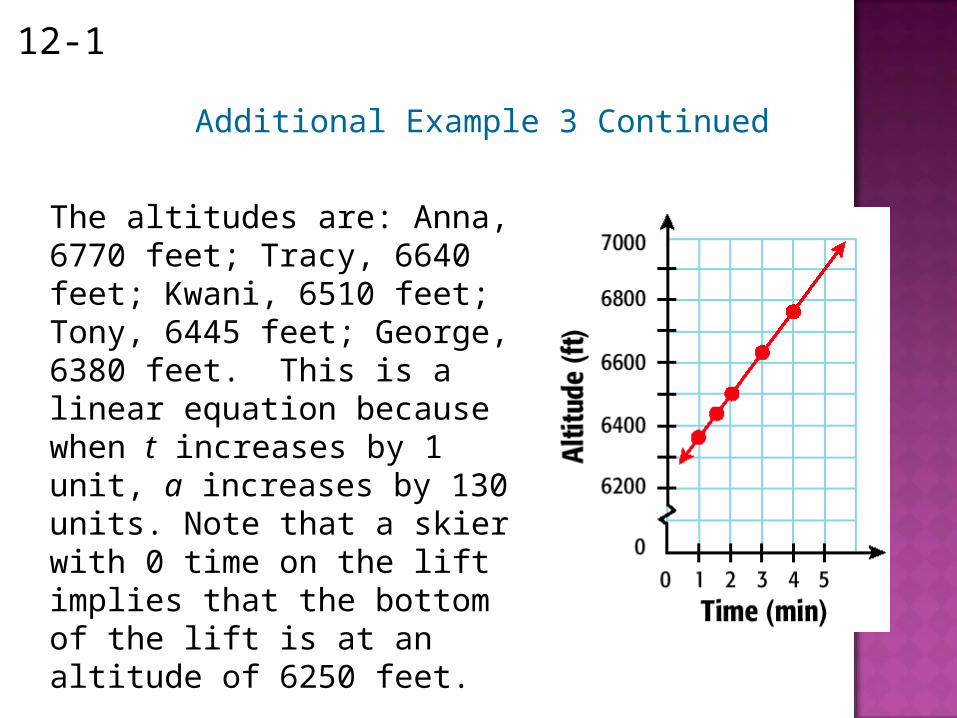
A lift on a ski slope rises according to the equation a = 130t + 6250, where a is the altitude in feet and t is the number of minutes that a skier has been on the lift. Five friends are on the lift. What is the altitude of each person if they have been on the ski lift for the times listed in the table? Draw a graph that represents the relationship between the time on the lift and the altitude.
Graphing Linear Equations12-1
Additional Example 3 Continued
Graphing Linear Equations12-1
Additional Example 3 Continued
Graphing Linear Equations12-1
The altitudes are: Anna, 6770 feet; Tracy, 6640 feet; Kwani, 6510 feet; Tony, 6445 feet; George, 6380 feet. This is a linear equation because when t increases by 1 unit, a increases by 130 units. Note that a skier with 0 time on the lift implies that the bottom of the lift is at an altitude of 6250 feet.
Additional Example 3 Continued
Graphing Linear Equations12-1
Check It Out: Example 3
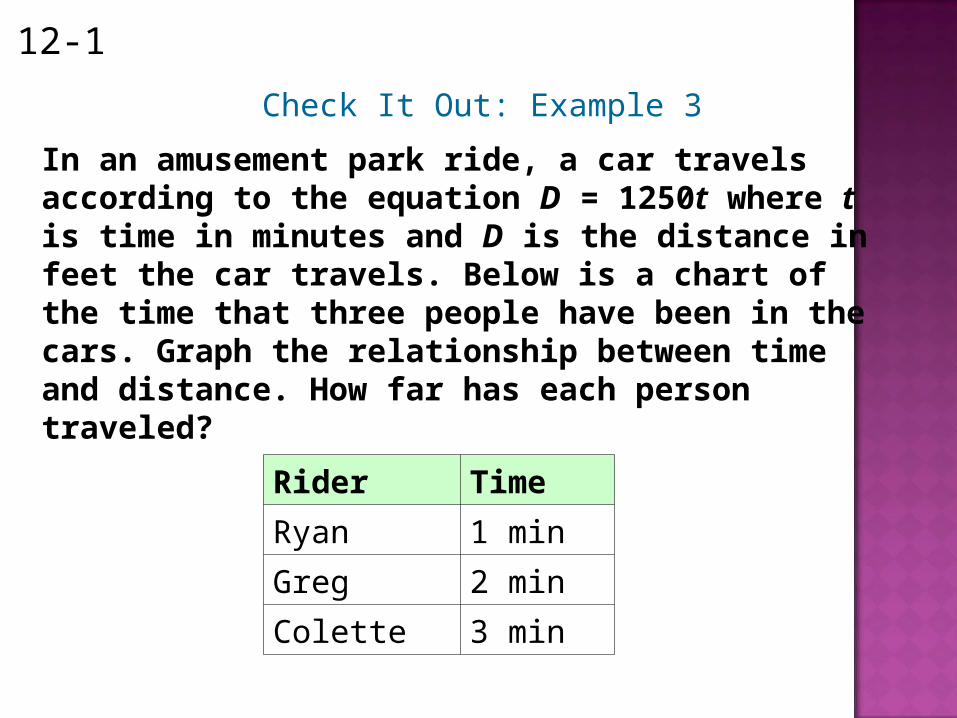
In an amusement park ride, a car travels according to the equation D = 1250t where t is time in minutes and D is the distance in feet the car travels. Below is a chart of the time that three people have been in the cars. Graph the relationship between time and distance. How far has each person traveled?
Rider Time
Ryan 1 min
Greg 2 min
Colette 3 min
Graphing Linear Equations12-1
Check It Out: Example 2 Continued
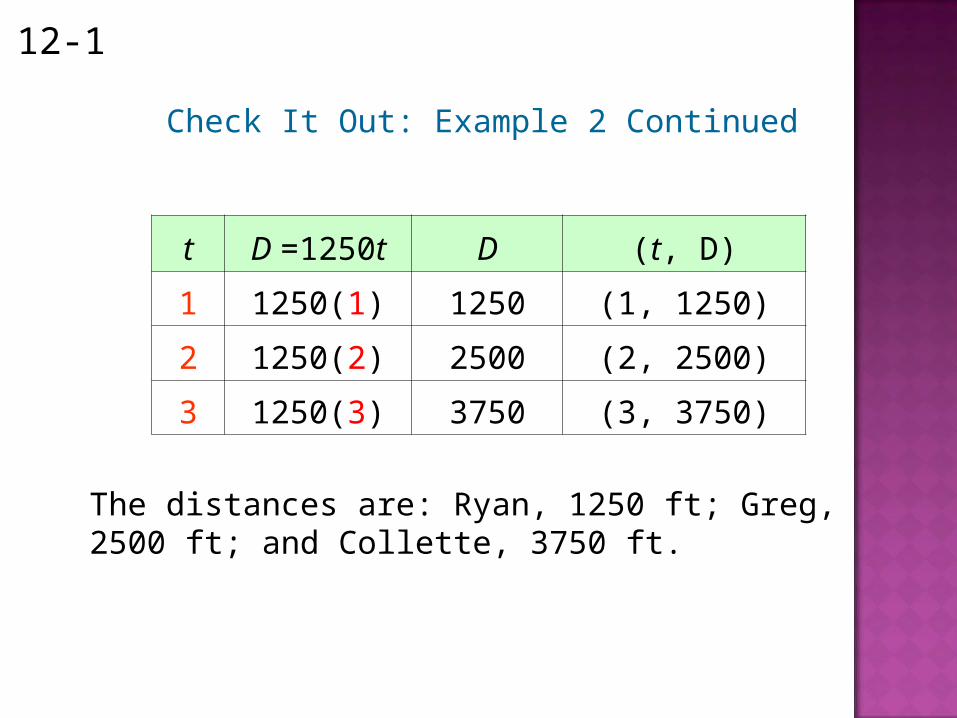
t D =1250t D (t, D)
1 1250(1) 1250 (1, 1250)
2 1250(2) 2500 (2, 2500)
3 1250(3) 3750 (3, 3750)
The distances are: Ryan, 1250 ft; Greg, 2500 ft; and Collette, 3750 ft.
Graphing Linear Equations12-1
Check It Out: Example 2 Continued
x
y
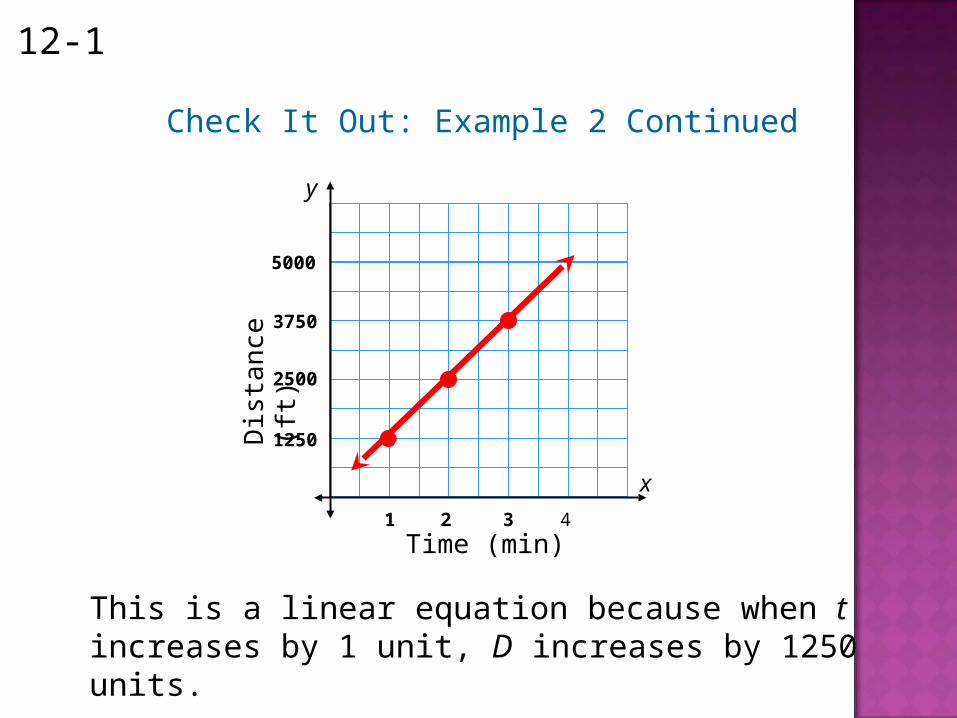
This is a linear equation because when t increases by 1 unit, D increases by 1250 units.
1250
2500
1 2
3750
5000
3 4Time (min)
Dis
tan
ce (
ft)
Graphing Linear Equations12-1
Standard Lesson Quiz
Lesson Quizzes
Lesson Quiz for Student Response Systems
Graphing Linear Equations12-1
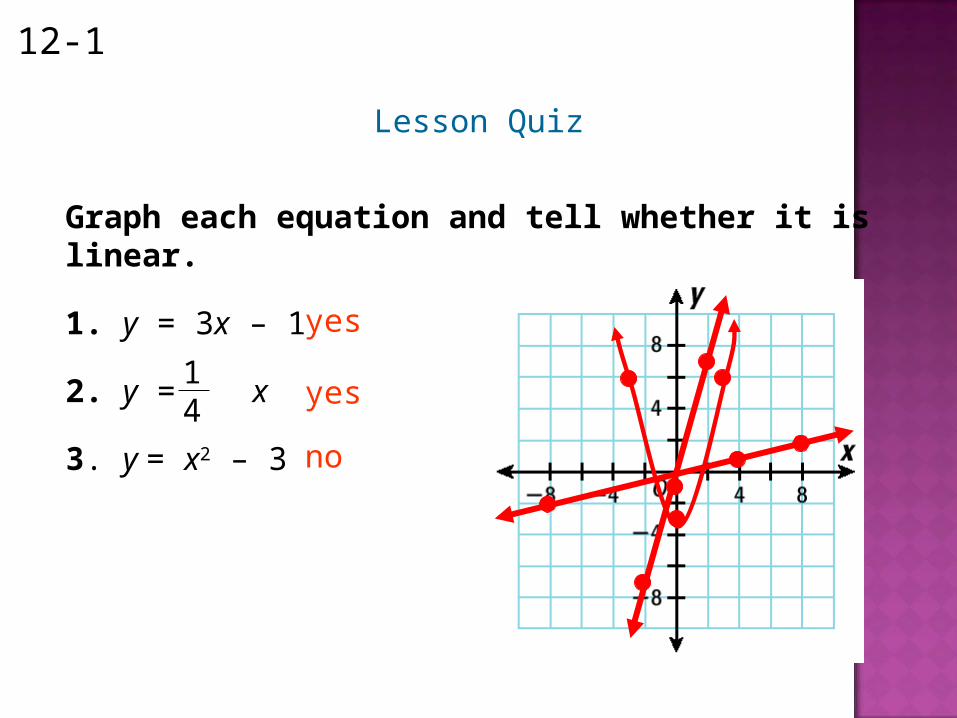
Lesson Quiz
Graph each equation and tell whether it is linear.
1. y = 3x – 1
2. y = x
3. y = x2 – 3
yes
yes
no
14
Graphing Linear Equations12-1
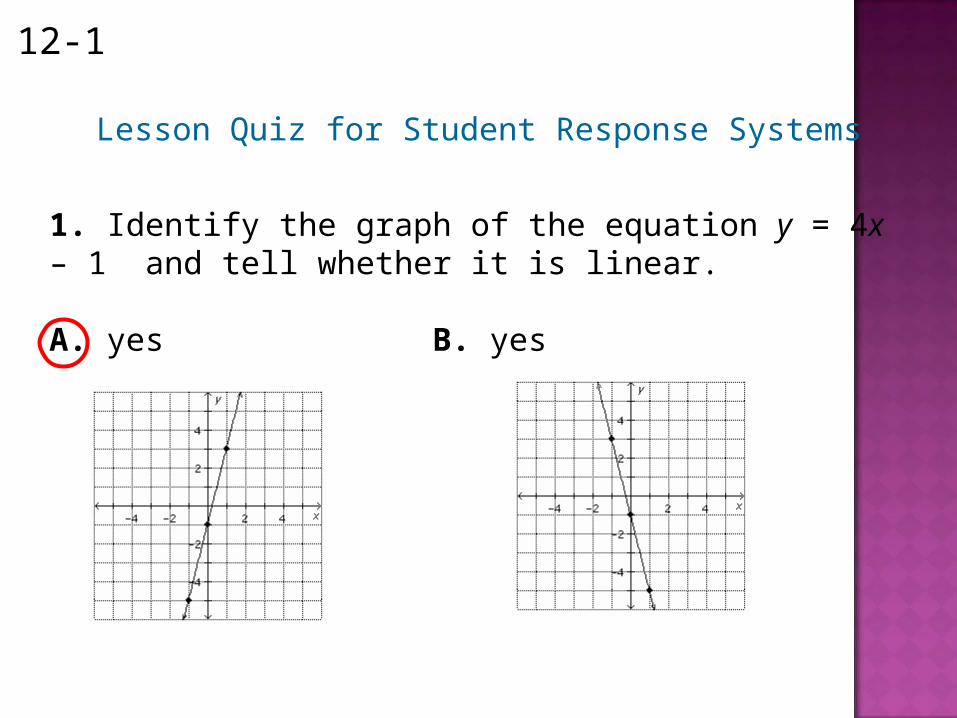
1. Identify the graph of the equation y = 4x – 1 and tell whether it is linear.
A. yes B. yes
Lesson Quiz for Student Response Systems
Graphing Linear Equations12-1
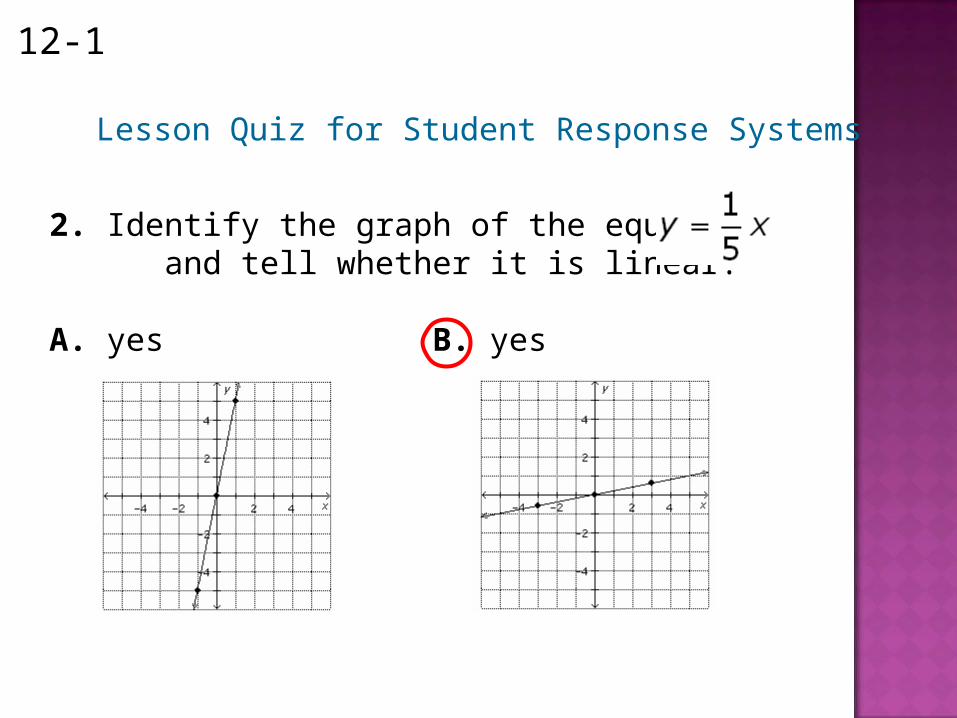
2. Identify the graph of the equation and tell whether it is linear.
A. yes B. yes
Lesson Quiz for Student Response Systems
Graphing Linear Equations12-1
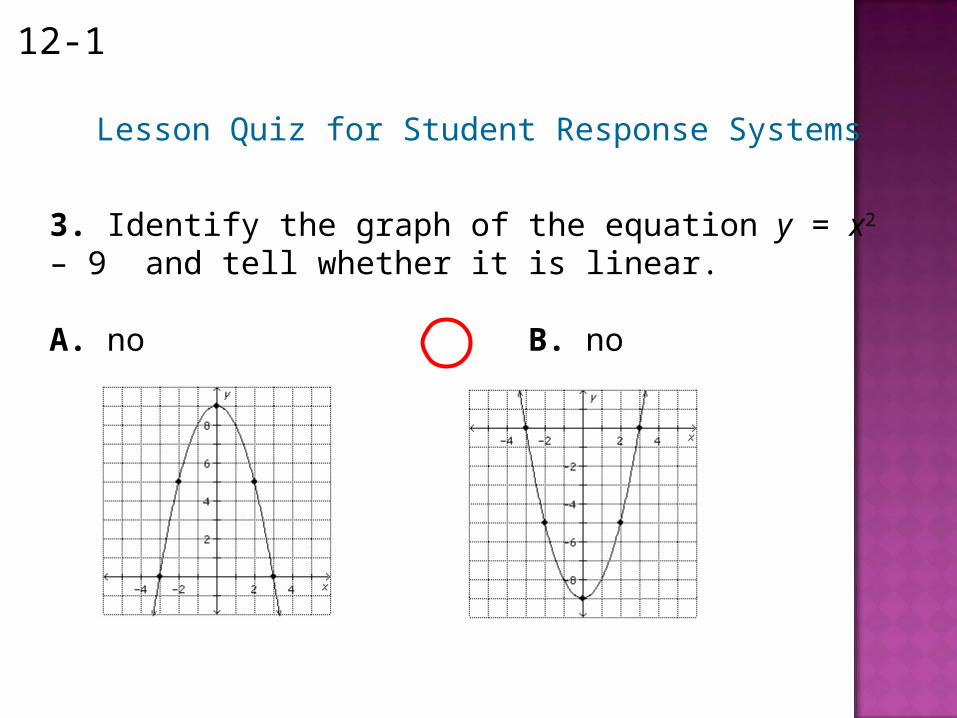
3. Identify the graph of the equation y = x2 – 9 and tell whether it is linear.
A. no B. no
Lesson Quiz for Student Response Systems