Embed Size (px)
Citation preview

“New NMR LWD Laboratory LAYOUT”
LEAN Project
By Cesar Javier Siles Saracho
Electronic Engineer
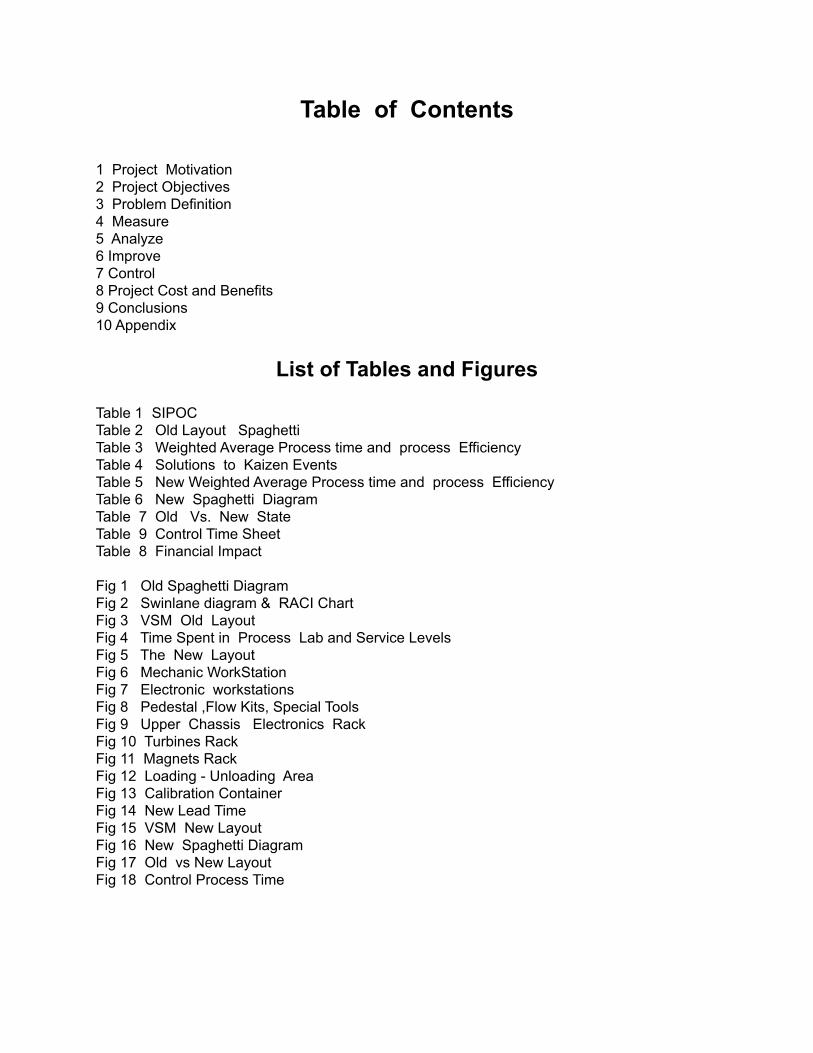
Table of Contents
1 Project Motivation 2 Project Objectives 3 Problem Definition 4 Measure 5 Analyze 6 Improve 7 Control 8 Project Cost and Benefits 9 Conclusions 10 Appendix
List of Tables and Figures
Table 1 SIPOC Table 2 Old Layout Spaghetti Table 3 Weighted Average Process time and process Efficiency Table 4 Solutions to Kaizen Events Table 5 New Weighted Average Process time and process Efficiency Table 6 New Spaghetti Diagram Table 7 Old Vs. New State Table 9 Control Time Sheet Table 8 Financial Impact
Fig 1 Old Spaghetti Diagram Fig 2 Swinlane diagram & RACI Chart Fig 3 VSM Old Layout Fig 4 Time Spent in Process Lab and Service Levels Fig 5 The New Layout Fig 6 Mechanic WorkStation Fig 7 Electronic workstations Fig 8 Pedestal ,Flow Kits, Special Tools Fig 9 Upper Chassis Electronics Rack Fig 10 Turbines Rack Fig 11 Magnets Rack Fig 12 Loading - Unloading Area Fig 13 Calibration Container Fig 14 New Lead Time Fig 15 VSM New Layout Fig 16 New Spaghetti Diagram Fig 17 Old vs New Layout Fig 18 Control Process Time

1.Project Motivation Monitoring the actual proVISION work process , it is possible to observe that in most of the sub processes , there is waste , like excessive motion, transportation , defect and waiting time ,so there are several opportunities to optimize such process.
The company did the decision to built a new bigger laboratory at the base, thus it will give the great chance to improve the actual Layout of the proVISION Laboratory, so the mentioned problems related to non value added time could be minimized.
This project is going to use Lean Tools and techniques to minimize the waste in a process or just reduce the activities that not add value in the process. The first step is going to be a define phase, when all the main problems are going to defined, Then the process need to be measure, It means that all sub process will be measure in time, so it will analyze the bottlenecks and calculating the efficiency and maximum capacity of tools that could being provided. The next step will be the proposal plan to improve the process using a new Layout that plays a crucial role in determining the flow patterns, reduce the waste , organize the workplace and impact the safety. The new Layout will be consider as the main problem solving tool ,however it is also necessary use a systematic method to improve and sustain workplace organization (5S), standardize some of the sub process and get the habilitation of equipment strongly necessary to perform important tests.
With the implementation of this project it will increase the efficiency and capacity to cover the future client’s demand. It will also reduce the non value added time , will be soft saving and it will improve the service quality and safety.
Finally the motivation factors could be summarize in the following :
• Expansion due to activity increase • Expected Job count from 3.9 to 6.5 during 2013 (Q1-Q4) • Reduce the non value added time • Reduce Costs • Provide a better service quality
2.Project Objectives
• Design a layout to optimize the flow of proVISION Tools by minimizing the times the tools have to go back to the same workstation, reduce the distance between stations, reduce the barriers between stations, decrease the movement of heavy equipment such as container and design a better path to get access to shared equipment like ovens .
• Increase also the service Quality by organizing the workplace, so adding store places for proVISION components , such as racks, cabinets, implementing trolleys for move heavy items and fixing turbine test setup.
• Improve the safety by reducing the mechanical lifting operations, like moving container with a forklift, loading electronics out of a yellow line for personnel and

Rack magnets out of compliance. • Improve the efficiency of the proVISION Laboratory by 22% and the capacity by
23 %
3.Problem Definition The problems have seen in the actual NMR work process are :
• Excessive motion of technicians, going to the Break Out Machine , Push or The Surface area to get a container.
• Excessive transportation of the tool , it have to travel several times long ways. The NMR Collar goes from PUSH Area to NMR Lab to be unloaded , then it have to return to PUSH Area to be inspected and finally go back to NMR Lab to load the electronic. After loading the electronics, some test are performed, then the tool goes to the BOM to torque the wear bands to be ready for calibration, Then it goes to the calibration container, later it have to return to the BOM for assembly (Turbine , Pony ) and finally the last test (Jackstand test ) need to be performed also in the calibration container . This is difficult to move due the tool with the pony is longer and heavier. ( Fig 1 Old Spaghetti Layout )
• There is no specific area to place the container. There is a lot of time consuming and waiting time, to perform the task to move the container inside the workshop with a forklift, the use of crane to move the container from the entrance to the push area , placing the tool inside the container and finally doing the setup by covering the holes with aluminum.
• The actual NMR Lab is situated next to Xceed test area. This situation is one of the key problems affecting NMR service time due to the noise affecting NMR tests, and the waste related to "wait time" or rework. The longest test the could avoided is the PWO test that usually takes 3hrs.
• Actually, using Xceed Turbine test set up for NMR Turbine test adds to the wait time as the Technicians wait for Xceed test to be completed before they can set up NMR Turbine.
• The NMR tool is seriously affected by electrical noise, so the electrical grounding need to be improved.
• The two Ovens are shared , so it derives in a lot of waiting time and extra time in Setup.
• Actual layout doesn’t provide a good space for loading the upper chassis due it cross the corridor and interrupt the normal transit of people.
• The rack magnets is too close to computer setup. • The ProVISION area doesn’t provide enough room to perform some processes
simultaneously.
RIRs Related • 20120903163758 Sep 01, 2012 SQ • 20121203160050 Nov 30, 2012 HSE • 20121229182212 Dec 27, 2012 SQ • 20130225140537 Feb 22, 2013 SQ • 20130306122618 Mar 01, 2013 Sug • 20130319095118 Mar 19, 2013 SQ • InTouch Ticket 6128184, 6179781

In order to help to determine the scope of the project we are going to use the SIPOC LEAN tool (Supplier, Input, Process, Output, and Customer) , It is also a very high level map of a process that help to identify any quick disconnects with the supplier inputs, and identify the project customers and their outputs.
TABLE 1 proVISION SIPOC
!
4.Measure The collected information will allow us to make important decisions and manage the process by facts and evidence. It will also quantify the baseline and show the improvement after the project is completed. So for this case the issue is to calculate the actual capacity of the proVISION work process and the efficiency in order to have a start point to know if we could comply with the future customer capacity. From the Spaghetti diagram below Fig1 , it is possible to observe the waste of excessive motion of the technician and also excessive transportation of the proVISION items (Collar, pony collar , turbine ) in the actual work process. Two shift of mechanicals and electronics technician working on the same tool from the Beginning to the end do the job in 51 Steps , with a total distance of 1219mts .From the Table 2 is possible quantify the distance of each step and observe the highest distances to run are to get a borrowed container for calibration , go to Break Out Machine (BOM ) and IST are (Incoming Sytem Test )
Technician
R&M
Too
Push deliver PULL
TEAM

Figure 1 OLD SPAGHETTI LAYOUT

Table 2 Old Layout Spaghetti Service Level 3
The Swinlane diagram Fig2 show the proVISION work process and help us to understand the interactions of the proVISION work process through the different departments, some departments like Push and Pull have a big contribution in the tool lead time , however we are only focus to minimize the waste in the ProVISION Lab process ( total time of 86hrs SL3).
OLD Spaghetti Service Level 3
# Step distance (Mts) Comments
ET1 0-1 105 Take setup to IST Area
ET1 1-2 105 Return from IST
ET 1 2-3 11.38 Go out side with Trolley
ET1 3-4 4.87 Install power cord ,
Et1 4-5 4.87 Remove plugs and unsolder
MT1 2-3 6.5 Go out side to remove Jamnuts with splecial toolMT1 3-4 5.46 Search for tube to remove jamnuts MT1 4-5 5.46 Returning with tube to remove jam nuts MT1 5-6 5.82 Remove the LC MT1 6-7 3.69 Place the LC in the RACK Et 1 5-6 2 help the the MT place the LC MT1 7-8 12 take special tool to remove UCMT1 8-9 6.4 Place Special tool to remove UC and remove UC ET1 6-7 13.54 Search Trolley to remove UC ET1 7-8 7.62 place the Trolley y pull together with the MT1 ET1 9-10 7.5 Remove UC with MT1MT1 9-10 6.5 search for trolley from TST area MT1 10-11 6.9 return with trolley and pull the UC ET1 9-10 7.8 Return trolley from TST ET1 10-11 6 go back to lab to work in UC MT1 11-12 64 Move Collar to Inspection Area MT1 12-13 64 return from push MT1 13-14 7.6 Take the crane to lift UC MT1 14-15 4 Place the crane and remove NMR & Power Chassis ET1 11-12 11.6 move to get ovens ET1 12-13 17 ET1 Returns with one ovenET1 13-14 7 Return to get secong oven ET1 14-15 5.6 Takes the second oven ET1 15-16 6.5 Connects the power cord ET1 16-17 8.3 Returns to work heat test setupMT1 15-16 147 MT goes to surface to coordinate the container MT1 140 MT Goes to coordinate the forklift MT1 16-17 90 MT Return from surface to the workshop entranceMT1 17-18 14 Move container to Calibration Area ET1 17-18 42 ET1 goes to help the MT to move the container ET1 18-19 12 ET1 help the MT to place the container ET1 19-20 26 ET goes to NMR Area to lift the tool MT1 18-19 26 MT goes to NMR Area MT1 19-20 26 MT Return with the tool ET 1 20-21 26 ET returns with the toolET1 21-22 18.5 Goes to BOM to assembly Pony and Turbine MT1 20-21 23 Goes to BOM to assembly Pony and Turbine MT1 21-22 30 Install Shield and move tool Pull ET1 22-23 27 Install Shield and move tool Pull Et1 23-24 10 goes to moves the container back MT1 22-23 10 goes to moves the container back MT1 23-24 11 moves container ET1 24-25 11 moves container
1219.41 MTS Total STEP of both ET &MT is 51

The RACI Chart Fig 2 should clarify roles, as well as ensure accountability and individual levels of participation.
NMR Supervisor
Electonic Techncian
Mechanical Technician
Inspection Team
AR I
IAR
II
IR
IR
RI
II
AR I
RR
AR
IR
RI
RI
RC
RR
Assembly Tool and complete OST AR
R
Perfom Test Heat Test Load Upper Chassis Perform Vaccum Test on Collar Perform UC Tests
ACTIVITIES
Quality Check
Alert Team Tool arrival in PUSH Explain TCO, Priority and SL Perform the IST Unload Upper Chassis Inspection Perform R&M
Fig 2 Swim
Lane D
iagram &
RA
CI
Chart
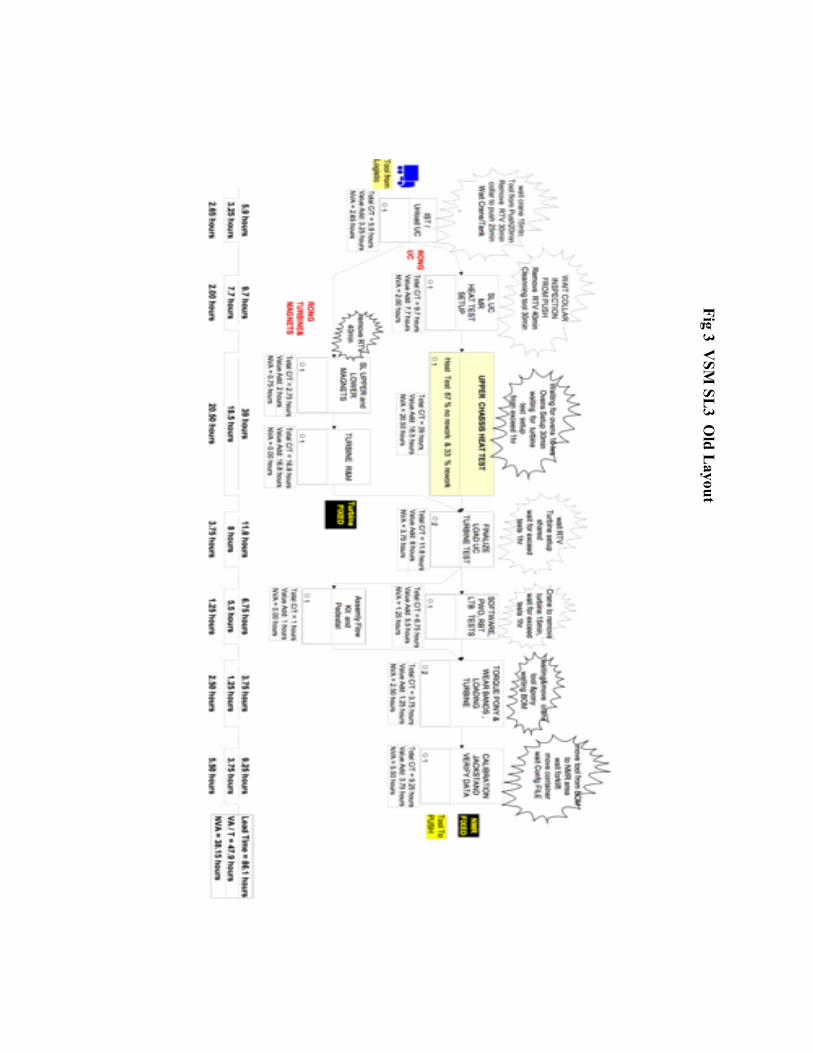
Fig 3 VSM
SL3 O
ld Layout

In the Value Stream Map Fig 3 (see previous page) for the actual is possible to measure the timing of the entire ProVISION Laboratory process for the maximum service level 3 , taking in count that the lead time of each individual process is the sum of value added time and non value added time. However this case is only for SL3 , so we have to do similar Value Steam Maps for the rest of services levels 0,1,2 . (Appendix A).
*Note.In the VSM Fig 3, it was not consider the rework in all the process except of heat test and also the time spent in Failure investigation
5.Analyze
In order to calculate the weighted average of the total process time and the efficiency we need to consider the Timing of each service level and also the contribution of each service levels according to the statistics (Qtrac between October 2012 to Jan 2013 ) . So from the table 3 and figure 4 below we calculate the average time to produce one tool including the service probability as per Service Level and the efficiency of the our process.
Table 3 Actual Weighted Average Process time and process Efficiency
Now From the data above we derive in the Maximum Capacity and Takt Time
Calculating the Actual Capacity and Efficiency
!
Service Levels Sep 2012- Dec 2013 SL MRT6 MRT8Period TotaL
Tools per month SL %
VA/T (hrs )
L/T hrs
L/T x % (hrs) VA x %
MRT6UC 6007 (including one time )SL3 or SL 4 15 6 21 1.31 21.00 47.90 86.10 18.08 10.06
SL2 25 7 32 2.00 32.00 29.00 42.00 13.44 9.28
SL1 12 5 17 1.06 17.00 6.50 16.30 2.77 1.11
SL0 24 6 30 1.88 30.00 2.75 8.80 2.64 0.83
Total 76 24 100 6.25 100Average L/T (hrs) 36.93
Average VA (hrs ) 21.27

Fig 4 Time Spent in Process Lab and Service Levels %
! !
Bottle Neck is the process with the highest long term utilization, so if we see again the VSM Fig 3 it would be the heat test with an average of 39hrs (calculate below), however the process itself only take 18,5 hrs including shop failure , so the NVA 20.5 hrs (waste time ) it is considerable
Heat Test 67 % no rework & 33 % rework (Heat Test Statistic 3failed and 6 passed) no rework = 10work hrs + 17.5 waitoven = 27.5hrs rework = norework + 16hrs troubleshoot + 10workhours + 8.75waitoven = 62.25hrs Total = 0.67 x 27.5 + 0.33 x 62.25 = 39hrs VA = 10hrs x 0.67 + (10 + 16 + 10) x 0.33 = 18.5 hrs NVA = 0.67 x 17.5hrs + 0.33 x ( 17.5 + 8.75) = 20.5hrs
6.Improve The improve plan will be using the following LEAN methods, Kaizen Events, Improve Layout, 5S and Generate improvent ideas. As we can see from the table 4 the solution to the problem is going to be time saving projects that will impact the efficency and the quality of the overall process. Such projects were created with ideas generated by teamwork. The List of Kaizen event was taken from the VSM , and the time saved in each process in order to minimize the Non Value adde time is in base of Layout solution, 5S ,changes in procedures and getting new standard equipment.
Table 4 Solutions to Kaizen Events
!
SOLUTIONES TO KAIZEN EVENTS
OLD NEW
PROCESS Total C/T (hrs)
VA (hrs)
NVA (hrs)
NVA (hrs)
KAIZEN EVENT EQUIPMENT NEEDED
IST 1.5 0.5 1 0.5
Electronic workstation and calibration KIT in PUSH Area (future Layout)
DC power suplies ,TSIM ,computer , calibration Tanks and shields , jackstands
UNSOLDER ANTENNA, REMOVE JAMM NUTS,LC,UC 3.5 2.25 1.25 0.75
Unloading workStation in PUSH Area (future Layout)
Portable soldering workstation and special tools to remove UC
REMOVE UPPER MAGNET 0.917 0.5 0.417 0.25New Mechanical lifting Equipment Trolley for Magnets and
Pallet Truck
SL UC (CHANGE BATT, ORING MOD RECAP IF NEEDED 8.2 6.7 1.5 1
New Benches Layout , easy way to move the Upper Chassis Electronics with a trolley (Fig 7)
Soldering workstation, Rack for UC , Pallet Truck for upper magnet
SETUP FOR HEAT TEST INSTALL TANK 1.5 1 0.5 0.25
5S for cables and wires Kit of wires for Antenna , Battery,RPM simultator, Termocouple
HEAT TEST 39 18.5 20.5 17.8
Less time spent to setup due to new layout, Turbine Test jig for NMR only, and decreased Xceed tests interference
New Turbine Test Setup , New Turbines RACK
CONNECT UPPER MAGNETS & FINALIZING UC 3.75 3.5 0.25 0.1
New Layout, less distance to Racks, and lifting Equipment New Rack for Magnets, Pallet
Truck and Special Trolley
LOADING UPPER CHASSIS , LC and Torque Jamm Nuts 4.25 2 2.25 2
Loading Chassis with Ratchet Strap Best Practice 6218607, Improved Loading area Cabinets for Special Tools
New Racks for Magnets, Special Tool for Loading UC, Cabinets for wearbands ,flow kits
SOLDERING & INSTALL ROPs 1.5 1.5 0 0Soldering workstation Soldering workstation
TURBINE TEST 2.25 1 1.25 0.25Turbine Test , RACKs and New Layout New complete turbine Test ,
New Turbine RACK UPDATE SOFTWARE ,PWO, RBT LTB TESTS 6.75 5.5 1.25 0.5
With New Layout less interference from Exceed , MRT8 Tank best Practice 6302142 LTB Wires KIT
TORQUE PONY & WEAR BANDS , LOADING TURBINE 3.75 1.25 2.5 1.5
Less distance to BOM due new Layout and change in the Process IT 6128184
Turbines ,Pedestal Racks and Cabinets
CALIBRATION IN CONTAINER 3.8 1.5 2.3 0.5
Container already in LAB Layout , no need to move from surface Area , Best practice # 6237734 NEW owned Container
Design,
JACKSTAND 3.25 1.25 2 1Improve procedure,Configuration File ready in TCO QUEST 20130306122618
QTRAC,OST VALIDATION , INSTALL SHIELD, TO PUSH 2.25 1 1.25 0
Improve Layout, not necessary remove container , Lifting Equipment ,
TIME (hrs) 86.167 47.95 38.217 26.4

!
Fig 5 New
proVISIO
N L
ayout

The New Layout Fig 5
• The new Layout is designed to have a Linear Flow , so it follow as much as posible the ProVISION work Process. This layout is designed to impact the safety,quality, workplace organization and future expansion.
• After breaking the tool and washing the main components (Pony, turbine and MRT collar) the turbine enter the lab first,IST is performed, then the UC have to be unloaded in the same place, so the collar will have a shorter path to the inspection area meanwhile the Upper Chassis enter in the lab to perform the required service level. Later the collar enter in the laboratory and it is placed at the heat test are were the Upper Chassis is going to be heat. (The UC have to go back a litte for heat test)
• After heat the elecronics and at the same time the turbine could serviced , the upper chassis is finalized, then load for testing and final calibration in container . At last the MRT collar a the turbine leave the lab for assembly together wih the pony in the Pull area.
• The there are two parallel long benches for the mechanic technicians Fig 6 , so it could be placed two turbines in the 2 benches of 1.5mts x 0.7mts with easy access of both sides and also there are two more benches for place two magnets. Ther are also Two extra tables to place the computers technician in order to prevent the computer damage due to magnets or vibration to hit on the same table.
• There are basically three benches for the Electronic workstation Fig 7 so it is easy access and place the tool over the bench just using the trolley. It is also enough space to perform maintenace of two upper chassis at the same time as in general the trolley is used to perform this service. One extra bench is required for laptops.
• In The Fig 8, Fig 9 ,Fig 10 and Fig 10 is posible to observed to differents racks and cabinets in order to organize the workplace ,comply with the SQ Standards by segregating the NMR Equpment like , Pedestalls , Flow Kits , Electronics, Turbines and Magnets . Such Racks were designed taking in mind the future activity (See Apendix )
• The magnets have been placed away from the computer setups,far from tools and isolated with its respective warning signs. Also a new rack for the the magnets have been introduced in order to improve the segregation and minimize the risk of attraction between them while are transported.Fig11
• The Loading area Fig 12 for the Upper Chassis avoid the safety issues of the previous one where the movement of the electronics had to cross the corridor,so now there is enough space between tools and it will be possible the perform processes in parallel , like for example Heat Test , PWO RBT LTB and calibration and Jackstand.
• With The Calibration container Fig 13 ( Appendix 10) inside the laboratory the use of forklift was eliminated and also it was placed far enough to minimize the interference between other tools. With The practical hole in the container it is possible to setup the tool in less time.

Fig 6 Mechanic WorkStation Before After
! !
Fig 7 Electronic workstations Before After
!
Fig 8 Pedestal & FlowKit Before After
! ! !

Fig 9 UC mixed with others Electronics Before After
! !
Fig 10 New Turbine Rack
!

Fig 11 Magnets Racks Before After
! !
Fig 12 Loading /Unloading Area Before After
! !
Fig 13 Calibration Container Before After
! !

After working in the new layout with all the required equipment it is possible to generate a Future VSM SL3 Fig 15 (similar VSM are needed for SL0,1,2) , then we can make the similar previous analysis in order to calculate the new efficency and maximun capacity of the new layout. (Fig14)
Table 5 New Weighted Average Process time and process Efficiency
Fig 14 New Lead Time
Calculating the NEW Capacity
Qtrac SLevels Oct 12-Aug 13 SL MRT6 MRT8Period TotaL
Average per
month SL % VA/T (hrs)
L/T (hrs)
L/T x % (hrs) VA x %
MRT6UC 6007 (including one time )S3 or SL 4 15 6 21 1.3125 21 47.90 74.3 15.603 10.06
SL2 25 7 32 2 32 29.00 35.2 11.264 9.28
S1 12 5 17 1.0625 17 6.50 11.3 1.921 1.11
SL0 24 6 30 1.875 30 2.75 4 1.200 0.83
Total 76 24 100 6.25Average L/T (hrs) 29.99
VA (hrs) 21.27
New Lead Time
HR
S
0
20
40
60
80
SL3 SL2 SL1 SL0
Lead Time = 30hrs (weigthed average time)
Efficiency = VA / Lead Time = 71 % Capacity = Available time / Lead Time = 10.6 Tools/month

!
Fig 15 VSM
SL3 N
ew L
ayout

At same time we are going derive in a future Spaghetti Diagram Fig 16 & Table 6
Table 6 New Spaghetti Diagram
!
# Step distance (Mts) Comments ET1 0-1 20 Take setup to IST Area ET1 1-2 22 Return from IST ET1 2-3 15 Goes to Unloading area with Trolley ET 1 3-4 8.5 Install power cord , ET1 4-5 3.5 Remove plugs and unsolder MT1 0-1 6.6 Go outside to remove Jamnuts with special toolsMT1 1-2 2.5 Remove the LC MT1 2-3 7 Place the LC in the RACK or bench Et1 5-6 11 help the the MT place the LC MT1 3-4 16.5 taks and Place Special tool to remove UC Et1 6-7 21 Search Trolley to remove UC MT1 4-5 11 Place UC collar to Inspection ET1 7-8 26 Place UC inside the Lab for R&M MT1 5-6 40 return to work in lab and then place the collar for heat test ET1 8-9 14 Place the two ovens one by one ET1 9-10 18 Place the UC inside de oven and perfrom heat ET1 10-11 29.5 finalize ,Load Tool , Then perform calibration and tests MT1 6-7 11 Load tool MT1 7-8 32 Takes turbine to install the flow kit MT1 8-9 49 Together with the ET place the tool inside container ET1 11-12 34 Assembly tool in PULL BOMMT1 9-10 38 Assembly tool in PULL BOM
436.1 MTS

!
Fig 16 New
Spaghetti Diagram

After the improvement is extremely important compare the old state, versus the future state in order to verify and prove the improvement in efficiency and capacity
Comparison Actual Vs Future State
Fig 17 Old vs. New Layout
!
Table 7 Old Vs. New State
!

7.Control The control is going to be implemented by :
• 5S Audit including the Layout • Floor Lines to indicate the correct place of equipment • Compare expected Lead Time vs. actual Lead Time . Figure 18 below shows
the Lead time of tools as per service levels during the period of Jun –July 2013. It is possible to observe that several tools the lead time was not as expected.
• Control Time Sheet to sustaining and continuous improvement Table 9
Fig 18 CONTROL PROCESS TIME
!
!

Table 8 Control Time Sheet
!
SERVICE LEVEL CONTROL TIME SHEET TOOl SN UPPER CHASSIS SERVICE LEVEL 3
PROCESS Expected Time (hrs ) START TIME END TIME HRS DATE TECH COMMENTS
IST 1REMOVE JAM NUT ,LC , UNSOLDER ANTENNA , UNLOAD UC 3
REMOVE UPPER MAGNET 0.75
SL UC ( BATTERY , ORINGR , MR ) 7.7
SETUP For Heat Test 1.25
HEAT TEST 36.3CONNECT UPPER MAGNET AND FINALIZE 3.6
LOAD UC, LC , INSTALL JAM NUTS 4
SOLDERING AND INSTALL ROP 1.5
TURBINE TEST 1.25
UPDATE SOFTWARE , LTB , PWO,RBT 6
CALIBRATION 2
JACKSTAND 2.25
ASSEMBLY TOOL IN BOM 2.75
INSTALL SHIELD , CLOSE WO 1
74.35

8.Project Cost and Benefits Table 9 Financial Impact
BENEFITS Financial
Soft Saving 100K$us/ year
Service Quality
• Increase the Efficiency by 24% and Capacity by 23 % • Improve Capacity from 8.6 to 10.6 Tools/ Month with the same personal • Reduced the Distance by 783mts • Organize Workplace with new Racks and segregating the equipment
LABOR Description Baseline process
New process Hours Saved Hourly Rate Savings
Non-exempt time per yearRedution in Total Lead Time (7hrs/Tool) x 6 Tool /Month x 12month
2664 2160 504 $ 100.00 50,400.00$
(Old LT 37hrs , New LT 30hrs ) -$
50,400.00$
COST AVOIDANCE / RISK REDUCTION Description Baseline process
New process Value per Unit
Number of units per
yearSavings
SQ Event reduction Board damaged by Store Electronics (every 2 year ) $ 6,000.00 0.5 3,000.00$
Job count increase (when there is market) Increased Tool Capacity by 2 $ 186,000.00 0.25 46,500.00$
RPJ(In K$) = 186 K$us -$
49,500.00$
EQUPMENT / SOFTWARE / FOOT PRINT Description Baseline process
New process Value per Unit
Number of units per
yearCosts
New equipment (3)Racks and (1) Cabinets $ 8,362.00 1 (8,362.00)$ New equipment Fixing Turbine Test Setup $ 1,000.00 1 (1,000.00)$
-$ (9,362.00)$
$99,900.009,362.00$
$90,538.00
ACTUAL SOFT SAVINGS
TOTAL PROJECT SAVINGS - TOTAL PROJECT COSTS ACTUAL SOFT COSTS
SOFT SAVINGS/COSTS

Safety
• Eliminate Mechanical Forklift Operations • New Loading Area not crossing trough Yellow personnel corridor and doors • Magnets Racks far from Electronic Workstations , Tools, and Magnetic
equipment • Minimize Collar transportation
Client
Improve the Turn Around Time
9.Conclusions • The new Lab Layout plays an important role to determine the Tools flow and need
to be done according to the proVISION work process, safety and future expansion in mind.
• The combination of a new Lean Layout and workplace organization will improve the efficiency and safety of the process.
• The project helped the whole team to understand the impact of a Lean Layout on your daily work

10 Appendix Diagrams Calibration Container
!
! !
PEDESTALS RACK for 24 Units 30Kg per Arm , Total Rack Capacity = 300KG QTY 1

! !
!
!
TURBINES FOR 24 UNITS (similar to Xceed Rack) Per Arm Max 300Kg , Total Capacity = 300Kgx 8 Arms= 2400KG QTY 1
Upper Chassis RACK(Electronics ) for 7 Units Lower Arms= 1500kg , Middle arms =1 000Kg , Upper Arms =1000Kg Total Rack Capacity = 3500KG QTY 1

! !
Cabinet for Flow KITS and Special Tools , Qty 1 Total Capacity = 250 KG
!
MAGNETS RACK for 8 Units ( Made of None Magnetic Material )