Embed Size (px)
Citation preview

Lean Enterprise Management Development System & 8 Step Problem Solving
Mike HoseusAuthor, President, CI Culture EnterprisesExecutive Director, Center for Quality People & Organizations (CQPO)[email protected] or 859-699-2235

Ice Breaker: X-Y Exercise
“Win all you can!”
3
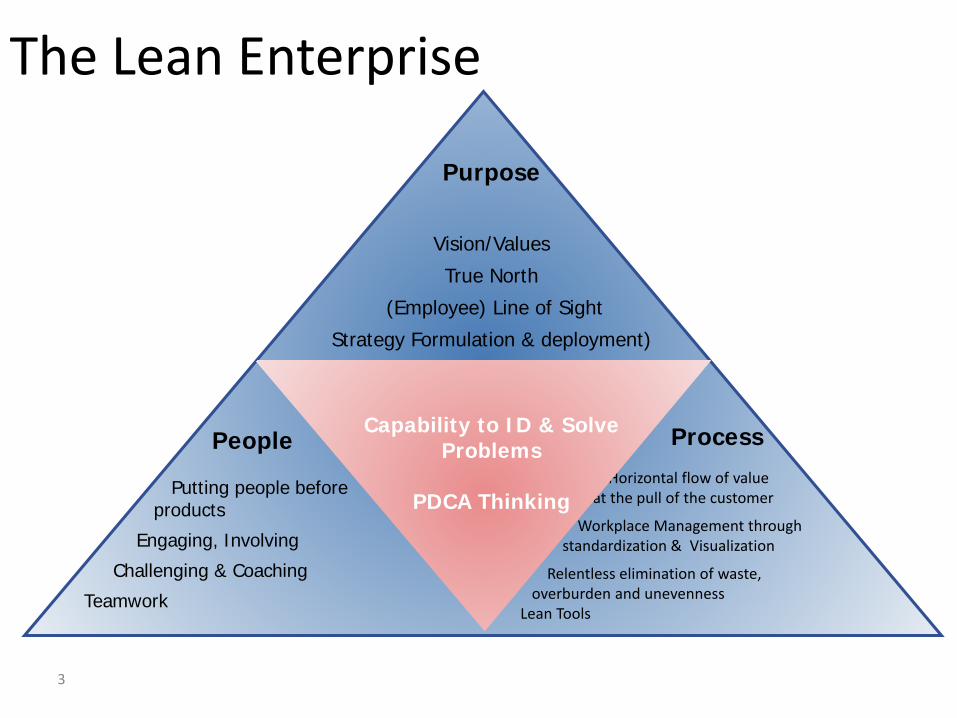
Purpose
Vision/ValuesTrue North
(Employee) Line of SightStrategy Formulation & deployment)
ProcessPeople
CorePutting people before
productsEngaging, Involving
Challenging & CoachingTeamwork
The Lean Enterprise
Horizontal flow of value at the pull of the customer
Workplace Management through standardization & Visualization
Relentless elimination of waste, overburden and unevenness
Lean Tools
Capability to ID & SolveProblems
PDCA Thinking

Phases of EMDS
4
Phase 1Set clear purpose,
direction and measurable goals
Phase 2Set up Standards
Phase 3Make problems
visible
Phase 4Develop problem solvers to reach business goals
Continuous Improvement

5
ProcessPeople
Core
Capability to ID & SolveProblems
PDCA Thinking Putting people before
productsEngaging, Involving
Challenging & CoachingTeamwork
The Lean Leadership System
Horizontal flow of value at the pull of the customer
Workplace Management through standardization & Visualization
Relentless elimination of waste, overburden and unevenness
Lean Tools
PURPOSE
Vision/ValuesTrue North
(Employee) Line of SightStrategy Formulation & deployment)

True North (Hoshin)
Purpose
Vision Values
CurrentPerformance
The process of reflective learning lead by management keeps the organization on track to its True North despite the short-term influences
Philosophies and Beliefs
• Layoffs and dismissal not readily made
• Role of employees• Role of Leaders
6

CURRENT CONDITION
P
DC
A
P
DC
A
P
DC
A
GtS
Tools
True North
TARGETED CONDITION
Tools
Tools
GtS
GtS
In the lean organization, the work of managers involves teaching this pattern of thinking and acting in order to continuously
improve work.
Managing for Improvement
7

Profit
Long Term Success
Contribute to Economy
Contribute to Society
Good Quality
Long Term Mutual
Prosperity for all Stakeholders
A Paycheck
Growth
Good Benefits
A Safe Workplace
Meaningful Work
Company Goals Employee Goals
Mutual Trust
Purpose

RespectPartnership
A Partnership between an Organization & its Employees
Mutual TrustContinuous
Improvement
Organization provides Stable Employment & Sustains or Improves Working Conditions
Employees Contribute Efforts to Realize Company Objectives
Organizational Prosperity is
achieved through
Continuous Improvement
EmployeesSatisfaction is experienced through the Continuous
Improvement Process

Example - Toyota WayThe Toyota Way 2001 is an ideal, a standard and a guiding beacon for the people of the global Toyota organization. It expresses the beliefs and values shared by all of us.

11
It Starts with Values
ValuesBeliefs
ThoughtsActions
HabitsCharacter
Culture
Toyota Way
TBP8 Steps
Goals for the
company

Servant LeadershipLeadership develops the capacity that allows team
members to improve what needs to be done
Suppliers – Team Members - CustomersTeam Leaders Group Leaders
Asst. Manager/Manager
Asst/General Manager
Vice President
President
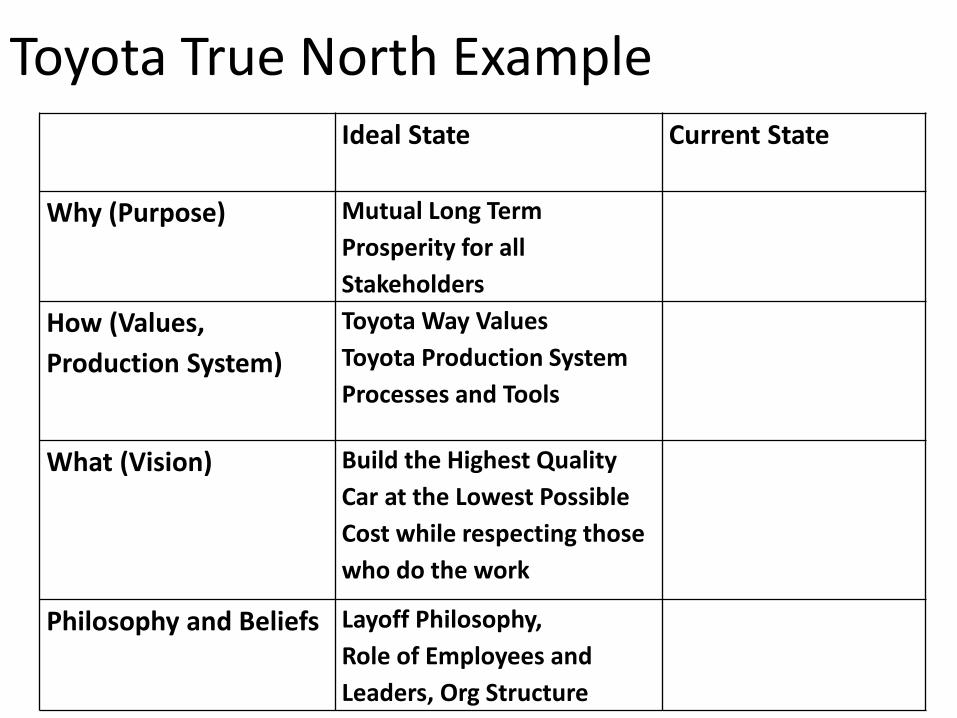
Ideal State Current State
Why (Purpose) Mutual Long Term Prosperity for all Stakeholders
How (Values, Production System)
Toyota Way ValuesToyota Production System Processes and Tools
What (Vision) Build the Highest Quality Car at the Lowest Possible Cost while respecting those who do the work
Philosophy and Beliefs Layoff Philosophy,Role of Employees and Leaders, Org Structure
Toyota True North Example

“What’s Your True North?”- Exercise
• Complete the table titled “What is Your True North?”
• Determine both the ideal state and current state of the following:– Why (Purpose)– How (Values, Production System)– What (Vision)– Philosophy and Beliefs (Layoff
policy and Roles for members, leaders)
• Identify Gaps where you have no Current Standard or where your Current state doesn’t match your Standard
Ideal State(or Current Standard)(What we
“talk”)
Current State
(What we “walk”)
Why (Purpose)
How (Values,
ProductionSystem)
What (Vision)
Philosophy and Beliefs
WHAT IS YOUR TRUE NORTH?

15
People
Core
Capability to ID & SolveProblems
PDCA Thinking Putting people before
productsEngaging, Involving
Challenging & CoachingTeamwork
The Lean Work System
PURPOSE
Vision/ValuesTrue North
(Employee) Line of SightStrategy Formulation & deployment)
Process
• Horizontal flow of value at the pull of the customer
• Workplace Management through standardization & Visualization
• Relentless elimination of waste, • overburden and unevenness• Lean Tools

16
Suppliers SalesMarketing/
R&DSupply Chain
Human Resources Finance IT Customers
Growing the Business
Fulfilling Customer Orders
Growing and Developing People, Leaders
Selling, market buildingIdeation, product development and launch
Business development and alliances
Order to deliveryBuy – make – ship
Procurement and supplier development
Human resources managementTraining and development
Learning and problem solving
Big
hor
izon
tal b
usin
ess
proc
esse
sValue and work flows across functions
Most important problems are cross-functional

Which one describes your Company?
Vertical
• Focus - Production• Budgets, SOP’s• Make the numbers• Leaders separated from the
work• People’s ingenuity used to
“beat the system”• Supervisors “manage”
people
Horizontal
• Focus - Process• Purpose• Make problems visible• Leaders focusing on the work• People’s ingenuity used to
“improve the system”• Supervisors work with the
people to solve problems
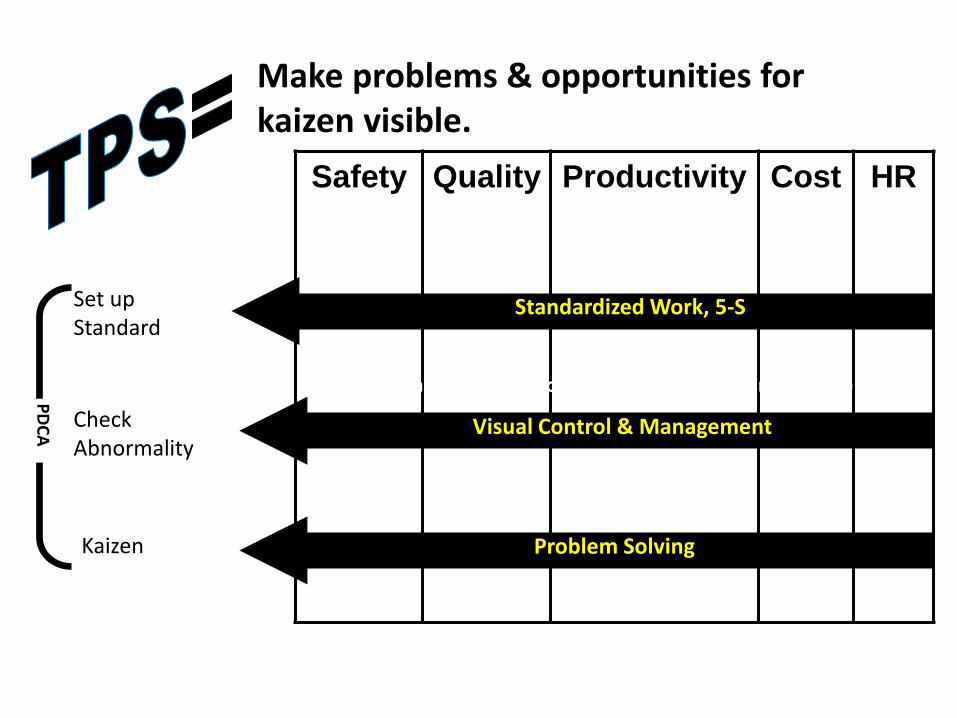
Safety Quality Productivity Cost HR
Make problems & opportunities for kaizen visible.
Standardized Work, 5-S
Visual Control (Andon, Line-stop, Visual Management)
Problem Solving
PDCA
Standardized Work, 5-SStandardized Work, 5-S
Visual Control & Management
Set up Standard
Check Abnormality
Kaizen

• Reduce variability, increase predictability• Enhance repeatability, confidence, consistency• Clarify procedures• Enhance communication• Improve Problem Solving• Set good discipline• Develop awareness• Establish “Problem Consciousness”• Establish a basis for education and training• Establish a baseline for performance• Improve Quality, Safety, Delivery, Cost• Provide the basis for Improvement
The Objectives of Standardization

Step 1: PREPARE WORKER
Step 4: FOLLOW UP
Step 3: TRY OUT PERFORMANCE
Step 2: PRESENTOPERATION
Plan
DoCheck
Action
Major Steps
Key Points
Reasons
The Four Steps of JI

21
Typical Flexibility ChartAuthor:J. Smith
Process
Nr.
1 2 3 4 5 6 7 8 9 10 11 12
of processe
Target (Man/Job)
Sectionnr. 10 A
Teamnr.: 1
Date: 6/98
JOB NAME A
SS
EM
BLY
INS
PE
CTI
ON
TOE
INA
DJU
STM
EN
T
HE
AD
LIG
HT
AD
JUS
TME
NT
RO
LL T
ES
T
BR
AK
E T
ES
T
EM
ISS
ION
TE
ST
FIN
AL
DR
ES
SC
HE
CK
TE
ST
WA
TER
LE
AK
TE
ST
DV
T
1M2J %1M2JName & Position PlanAct
John Jones 3 2 50%
Joe Bates 3 2
Wendy Smith 2 2
Geoff Smith 2 1
Tom King 3 2
George Whiteside 1 1
Danny Nelson 1 1
Tony Abila 1 0
Ken Anderson 1 1
John Smith (TL) 9 6 per process Plan 4 3 3 3 2 1 2 2 2
Act 3 3 3 4 2 1 0 0 2Target (Job/Man) 1J2M
Target % 1J2M 66%
EVALUATION Jan Feb Mar Apr May Jun Jul Aug Sep Oct Nov DecGroup leaderSection managerDepartment managerGMIO Standard Form (flexchar.xls)
= Knows steps (in training)
= Can perform job to quality and safety but not in takt
= Can perform job to quality, safety in takt without supervision
= Can Train Job to job inst std
= Is authorised to do repairs
A B C
D
E
F
G
H
# %
JobsO
pera
tor N
ames
Plan vs. Actual
Monthly Evaluation

Teams and Work Groups are Basic Units of Toyota Organization
TeamLeader
TMTM TM TM TM TM
TeamLeader
TM TM TM TM TM TM TM TM TM TM TM TM TM TM
TeamLeader Team
Leader
GroupLeader
Inputs
CustomerValue
Safety
HR
Quality
TPS
Maintenance
Engineering

Group Exercise: EMDS Lean Foundations Gemba Walk Reflections• Title your flipcharts “EMDS Gemba
Walk Reflections”• Identify the “Current State” of Lean
Culture in relation to the foundations of EMDS determine gaps in relation to the foundations of EMDS– 5S– Standardization– Training Method– Visualization– Value Stream Organization– Management Structure
• Identify gaps in relation to the same foundations listed above
• Target Cycle Time: 30 minutes
Foundation of EMDS
Current State
Identified Gaps
5S
STANDARDIZATION
TRAINING METHOD
VISUALIZATION
VALUE STREAM ORGANIZATION
MANAGEMENT STRUCTURE
EMDS Gemba Walk Reflections

Process• Horizontal flow of value at the pull of the
customer• Workplace Management through
standardization & Visualization• Relentless elimination of waste, • overburden and unevenness• Lean Tools
24
Core
Capability to ID & SolveProblems
PDCA Thinking
The Lean Development System
PURPOSE
Vision/ValuesTrue North
(Employee) Line of SightStrategy Formulation & deployment)People
Putting people before products
Engaging, InvolvingChallenging & Coaching
Teamwork
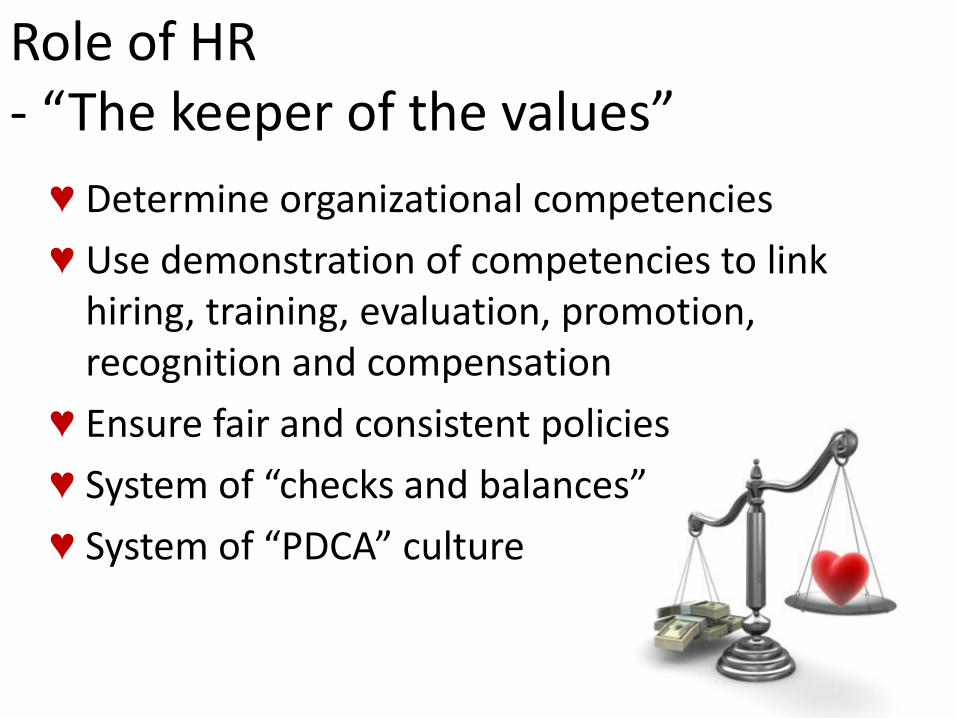
♥ Determine organizational competencies♥ Use demonstration of competencies to link
hiring, training, evaluation, promotion, recognition and compensation
♥ Ensure fair and consistent policies♥ System of “checks and balances”♥ System of “PDCA” culture
Role of HR- “The keeper of the values”

The Toyota Wayin Lean & HR Mgt.
“Toyota’s management system is all about each and every employee engaging in kaizen and challenges in his or her own position and seeking a solution, through which human resources develop and management methods are thereby improved. For this reason we hold the belief that human resources are the key to management and determine the success or decline of the company.” TMC

Human Resources
INPUTS
Assessment
Quality People
OUTPUTS
QualityOrganization
Lean Culture Overview Model
ENGAGEDEVELOPATTRACT ENROLL
ORGANIZATIONALSTRUCTURE &
SYSTEMS
ORGANIZATIONAL LEADERSHIP &ENVIRONMENT

Principal Roles – For ALL“The Lean Management System”
1. Go and See: Understand the real situation, the real process, from the real
people who work it, at the real place of action.2. Define Normal Conditions
Is the Current Condition (ab)Normal? Prove it.Can you define (ab)Normal? Write it.Can you SEE (ab)Normal? Visual ManagementWhen is it (ab)Normal? Tracking Metrics
3. Solve a ProblemTeach the METHOD for Problem Solving – get involvement.Implement Solutions / Permanent counter measures.
4. Sustain and Nurture the Processes/People
29
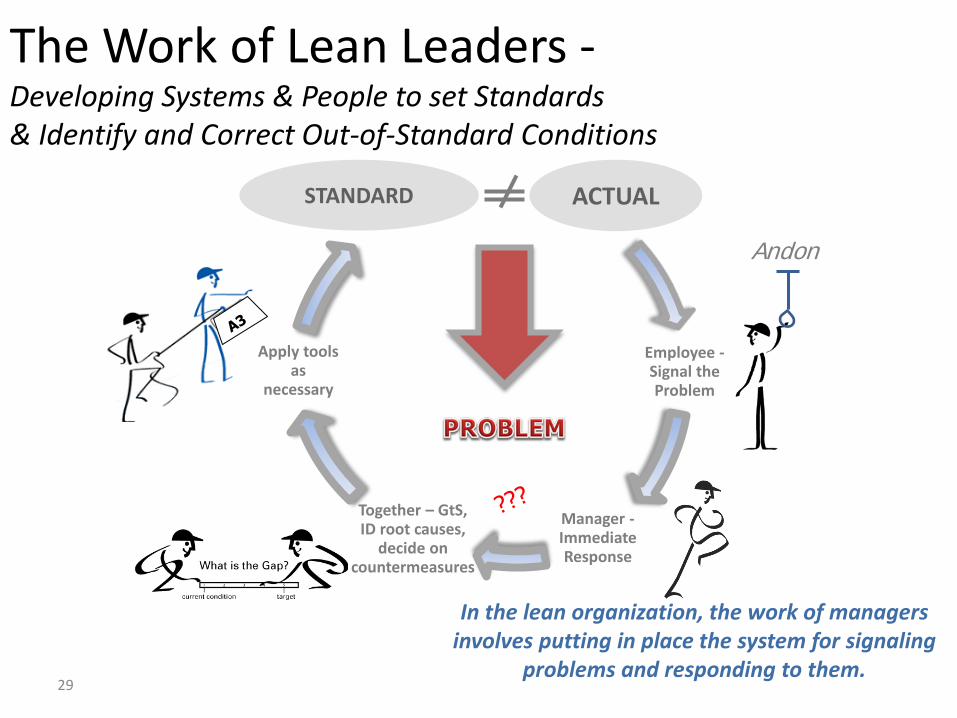
Actual
Employee -Signal the Problem
Manager -Immediate Response
Together – GtS, ID root causes,
decide on countermeasures
Apply tools as
necessary
StandardAndon
STANDARD ACTUAL
In the lean organization, the work of managers involves putting in place the system for signaling
problems and responding to them.
The Work of Lean Leaders -Developing Systems & People to set Standards & Identify and Correct Out-of-Standard Conditions

Selection “Funnel”
Prescreening Interview
Structured Behavioral Interview
Background Review/ Drug and Alcohol Screen
Resume/ Application
Competency Assessment (tests / simulations)
Recruiting & Communication
Each step in the hiring funnel has evaluation content that should be checked for accuracy and consistency across locations.
ApplicantTracking

Ma nager Level Focus on Shop Floor and Syste ms Improvement. Tools: Visual Factory & TBP
Tea m Lea der and Group Lea der Mana ge Standardized Wor k, Process Improvement and De velop Proble m
Solving Skills . Tools: FMD S, TBP & OJD
Tea m Me mber Focus on Funda mental Skills & S tandardized Wor k
Tools: Skills Trainin g, Job Instruction , Stand ardized Wor k and 5 -S
Gene ral Manage r and VP Leve l Business Planning and Policy Deplo yment Tools: Hoshin Planning & Toyota Business Practice s (TBP)
Toyota Training and Development

32
Purpose
Vision/ValuesTrue North
(Employee) Line of SightStrategy Formulation & deployment)
ProcessPeople
Putting people before products
Engaging, InvolvingChallenging & Coaching
Teamwork
The Lean Management System
Horizontal flow of value at the pull of the customer
Workplace Management through standardization & Visualization
Relentless elimination of waste, overburden and unevenness
Lean Tools
Capability to ID & SolveProblems
PDCA Thinking
Core
33
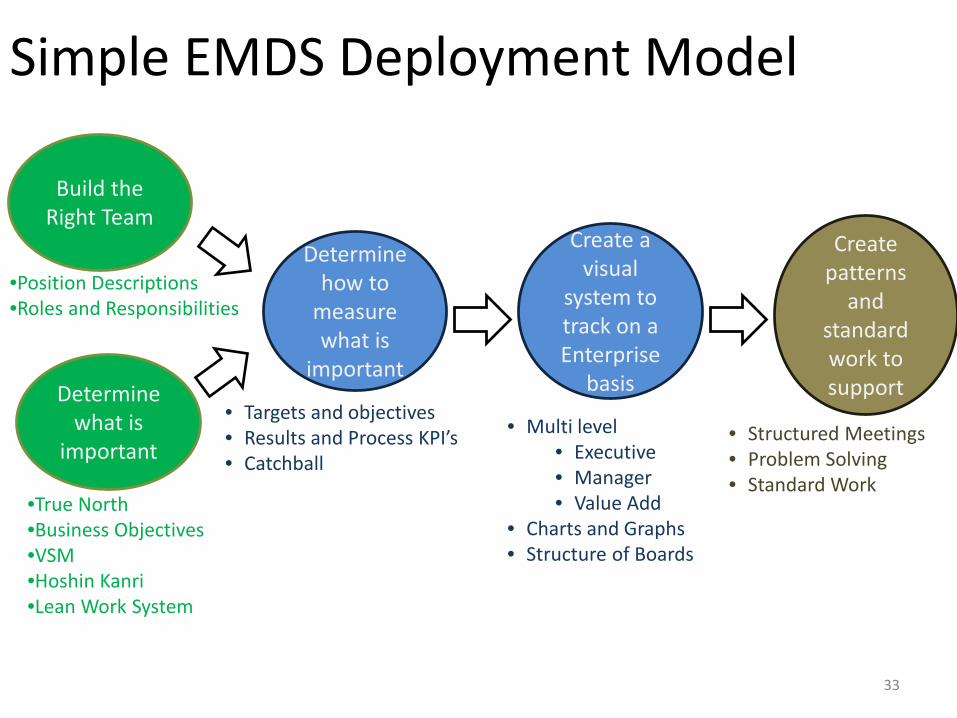
Simple EMDS Deployment Model
Determine what is
important
Determine how to
measure what is
important
Create a visual
system to track on a Enterprise
basis
Create patterns
and standard work to support
•True North•Business Objectives•VSM •Hoshin Kanri•Lean Work System
• Targets and objectives• Results and Process KPI’s• Catchball
• Multi level• Executive• Manager• Value Add
• Charts and Graphs• Structure of Boards
• Structured Meetings• Problem Solving• Standard Work
Build the Right Team
•Position Descriptions•Roles and Responsibilities

Function Hoshin
Division Hoshin
Department Hoshin
Individual Priority ThemesOJD
P/S
Horizontal Alignment
Vertical Alignment
Company Hoshin
Hoshin Kanri= Direction Management Core

Relationship between Hoshin Kanri and Daily Mgt.
P
D
C
A
S
D
C
A
Level of Operation
Time Function
Improvement of operating process
Daily maintenance and small improvement of job
A process is standardized and it shifts smoothly and continuously.
Hoshin Kanri
Daily Management
Standardization

Annual StrategyKPIActivity
Division HoshinKPIActivity
Dept. HoshinKPI Activity
Team TargetKPI’sActivity
Group TargetKPIActivity
Enterprise Management and HoshinPe
rfor
man
ce
Time
Continue with current Enterprise ops
Time
Actual Performance
Kaizen
Kaizen
Perf
orm
ance
Problem
Problem
PolicyReduce Downtime by 30%
ActivityStandard Work, Respond, Continuous Improvement
GENERALMGRS
DEPTMGRS
GROUP LEADERS
TEAM LEADER
TEAM
CATC
H B
ALL
PRO
CESS
Innovation
CEO

Features of Good Metric Systems• Balance and sufficiency
– Metrics should span all important dimensions of performance and weight should be appropriately balanced relative to value creation.
– Example: operations• Safety• Quality
– conformance to standards and tolerances – value delivery to customer
• Delivery• Production • Cost• Behavior and Morale
– In general, we rank order the first five dimensions above.– Different metrics structure naturally applies to the Process,
Team, Value Stream, and Plant levels. 37

How metric focus changes by level
38
Process
Team
Value Stream
Plant Output
Control
SystemStatus
ProcessStatus
Composite
Simple RealTime
LongerTerm
AnalyzedInformation
BasicData
Action andAccountability
Action andAccountability
Appl
ies t
o al
l lev
els
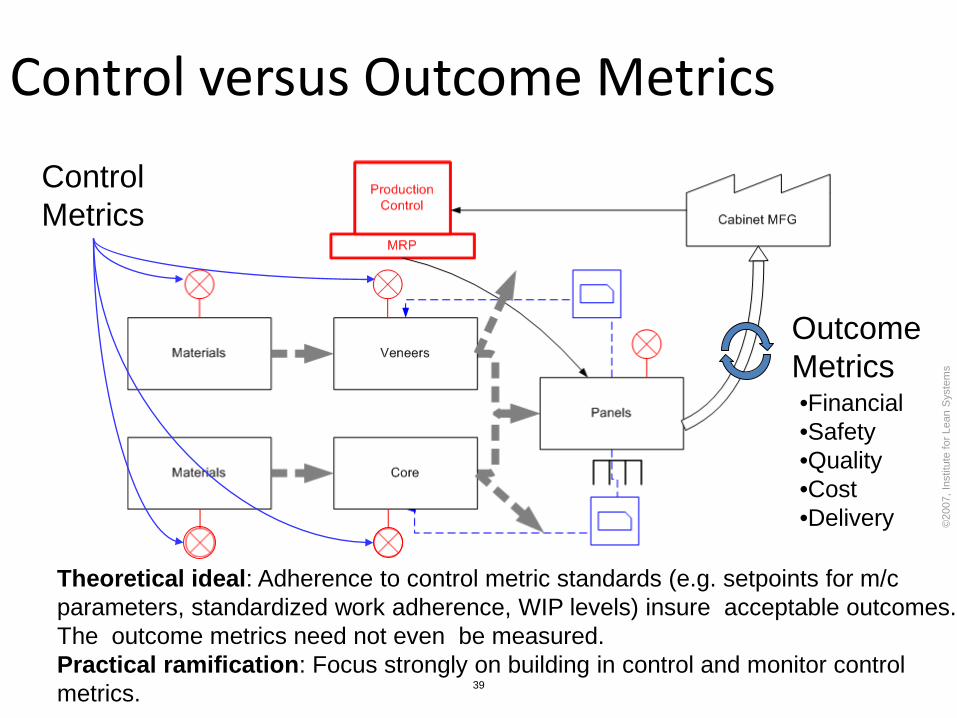
Control versus Outcome Metrics
©20
07, I
nstit
ute
for L
ean
Syst
ems
39
ControlMetrics
OutcomeMetrics
Theoretical ideal: Adherence to control metric standards (e.g. setpoints for m/cparameters, standardized work adherence, WIP levels) insure acceptable outcomes. The outcome metrics need not even be measured.Practical ramification: Focus strongly on building in control and monitor controlmetrics.
•Financial•Safety•Quality•Cost•Delivery

CEO, Group President, EVP Monthly
Who Frequency
Group VP,Operations Director
Weekly
Who Frequency
Plant Manager Daily
Who Frequency
Area Manager Every Shift
Who Frequency
Team Leader Hourly
Who FrequencyProduction Line
Production Area
Regional Operations
Plant Level
ExecMgmt
Visualization and MeetingManagement Standards

General Structure of EMDS
41
Process 1
Process
Board
Process 2
Process
Board
Process 3
Process
Board
Team
Board
TM1, TM2 TM3 TM4, TM5, TM6Primary Process Owner
TL 1
Process 4
Process
Board
Process 5
Process
Board
Team
Board
TM7, TM8, TM9, TM10
TM11, TM12
TL 2
Value Stream
Board
Process 6
Process
Board
Process 7
Process
Board
Team
Board
TM13, TM14,
TM15, TM16,TM17, TM18
TL 3
VSM1
Plant Level
BoardPlant
Manager
Team Level
Value Stream Level
Plant LevelWar Room
Team MeetingArea

Group Board - Enterprise Management Development System

Quality Section of Group Board

•Deployed per line, cell, or stand-alone process.
•Depicts current local status in all performance dimensions, identifying and driving activity to reduce or overcome abnormal conditions.
•Team leader visits and updates at high frequency (typically 30-60 min. intervals)
•VSMs and Plant manager visit frequently in gemba walks. Perform audits
•Source for data gathering for use in higher
Process-level Boards
44
PROCESS X BOARD
level DM Boards. Lead operator collects and posts data.•Feedback and feed-forward information (e.g. successor inspection and quality gate information) also logged by lead operator and communicated to team.
•Plan vs. Actual data collected, including reasons for discrepancy. Status depicted based on real-time run ratio targets.
•Focus on control metrics, e.g., setpoints, SW audits, 5S audits, etc.•Shows status of local problem solving activities.

“Insert Title/Position” ENTERPRISE MANAGEMENT DEVELOPMENT SYSTEM (FMDS) BOARD
SAFETY QUALITY ENVIRONMENTPRODUCTIVITYPEOPLE
MAI
NKP
ISU
B-KP
I’s
STANDARD DAILY MEETING AGENDA
STANDARD WORK FOR USING AND UPDATING BOARD
BOARD REVIEW SIGN OFF
Concerns1. ~~~~~~~~~2. ~~~~~~~~~3. ~~~~~~~4. ~~~~ ~~~~ 5. ~~~~~~6. ~~~ ~~ ~~~
PRIORITY CONCERNS C4 CARDS IN PROGRESS C4 CARDS COMPLETED
Proc
ess
Indi
cato
r Co
ntro
l Che
ck
Activ
ity /
Stan
dard
W
ork
MG
MT
Cate
gory
Hosh
inPl
an
Organisation Vision / Mission /
HoshinLead
Category Owner (s)
Support Support
Division or Department Hoshin
Lead
Category Owner (s)
Support Support Lead
Category Owner (s)
Support Support Lead
Category Owner (s)
Support Support Lead
Category Owner (s)
Support Support
Board Owner (s)
Lead Support

Sales ProductDevelopment
Supply Chain ExecutionOperations
ExecutionSupport
Finance
Revenue Quality OrderFulfillment
Safety HRTurnover
ROI
Growth Time to Market
Forecast/Actual%
Quality SafetyMedical Cost
EBITDA
CustomerSatisfaction
Cost to Budget
MaterialShortage
Service/ Delivery
QA Direct Margin
Sales Pipeline Productivity/Delivery to Target
SupplierReport card Quality
Cost COGS Margin
Sales Forecast to Actual
Problems ID’d timely
Order to Cash Lead Time
People Debt
Business AcquisitionProcess
Problems solved timely
Inventory turns
Environment Accts Rec
Sales, Leads, Calls
MasterPlan
Master Plan
Enterprise-wide Business Management Development System

KPI Development
47
Hoshin Objective
MAI
N K
PISU
B KP
I
PRODUCTIVITY
PRO
CESS
KP
I’S
X
X
Main KPI - KPI’s selected through catch-ball process that will be primary indicator to align with Hoshin.
Sub-KPI’s - KPI’s that link to main KPI and are important to measure for dept/area/group/team.
Process KPI’s – Measuring critical processes and metrics that align with sub-KPI’s through to Hoshin.(dependent on maturity of area for these KPI’s)

EMDS KPI Exercise• Title your flipcharts “EMDS KPI
Exercise”• In your teams, recommend a KPI
structure for all three levels of the organisation:
– Executive– Manager– Value Added
• Each team will take on one of the pillars of Safety, Quality, Service/Delivery, Cost, and People, (other?)
• Each team will:– Recommend enterprise wide KPI (and/or Main
KPI)– Recommend vertical cascade KPI’s (Main, Sub,
and Process KPIs for each of the levels listed above

3 Levels of Problem Solving
PDC
AGtS
Business PlanningProject Management
Problem Solving/KaizenEnterprise Work
Basic PDCA
A-3 System Level Problem Solving Hoshin Kanri

Goal
•Problem Solving that results in getting to the goal.
Three Stages of Problem Solving
New Goal
“Reaching”“Maintaining”
“Raising”
•Problem Solving that focuses on maintaining the goal.
•Problem Solving that focuses on increasing capability beyond the goal -“Kaizen”.
Maintenance Kaizen Kaizen

Problem Solving at all Levels
•Policies•Annual Objectives•Improvement Plans
•Cross Organizational Problem Solving •Process Improvement
•Objectives & Budget Management•Management Directed Kaizen
•Enterprise Problem Solving•Standardized Work•Kaizen•5S
Supervisors & Team Leaders
Operators
Top Management
Plant Manager & Manager

Goals of Employee Involvement
• To involve and empower the workforce in the continuous improvement process. (Team Member Participation)
• To provide opportunities for workers to improve and expand their abilities.(Team Member Development)
52

To encourage all team members to
look more creatively at what they do and
to take an active part in the development of an outstanding
company.
Suggestion System

Quality Circle Summary
Quality Circles are a means to encourage such participation while at the same time enhancing the development of each circle participant’s abilities (problem solving, leadership skills, and teamwork).
Team members, through Quality Circles, have a means of ensuring safety, enhancing quality, increasing productivity, improving the environment, and reducing costs.
54

Employee Involvement Teams
Stage 1Orientation
Stage 2Dissatisfaction
Stage 3Resolution
Stage 4Production
Stage 5Termination
Adapted from R. B. Lacoursiere, The Life Cycle of Groups
Team Development Model
HIGH
LOW TIME
ProductivityMorale

Linking the 8 Steps with PDCA and Drive & Dedication
1. Clarify the Problem
2. Break Down the Problem
3. Target Setting
4. Root Cause Analysis
5. Develop Countermeasures
6. See Countermeasures Through
7. Monitor Both Results and Process
8. Standardize Successful Processes
A
C
D
P
Concrete Actions and Processes
Customer FirstAlways Confirm the Purpose of Your WorkOwnership and ResponsibilityVisualization (MIERUKA)Judgment Based on FactsThink and Act PersistentlySpeedy Action in a TimelyMannerFollow Each Process with Sincerity and CommitmentThorough CommunicationInvolve All Stakeholders
Drive and Dedication
4/30/2019

Step 1. Clarify the Problem
Step 1: Problem Identification
Visualizing(Making Explicit)
GAP
Purpose
Problem
Ideal Situation
Current Situation
57
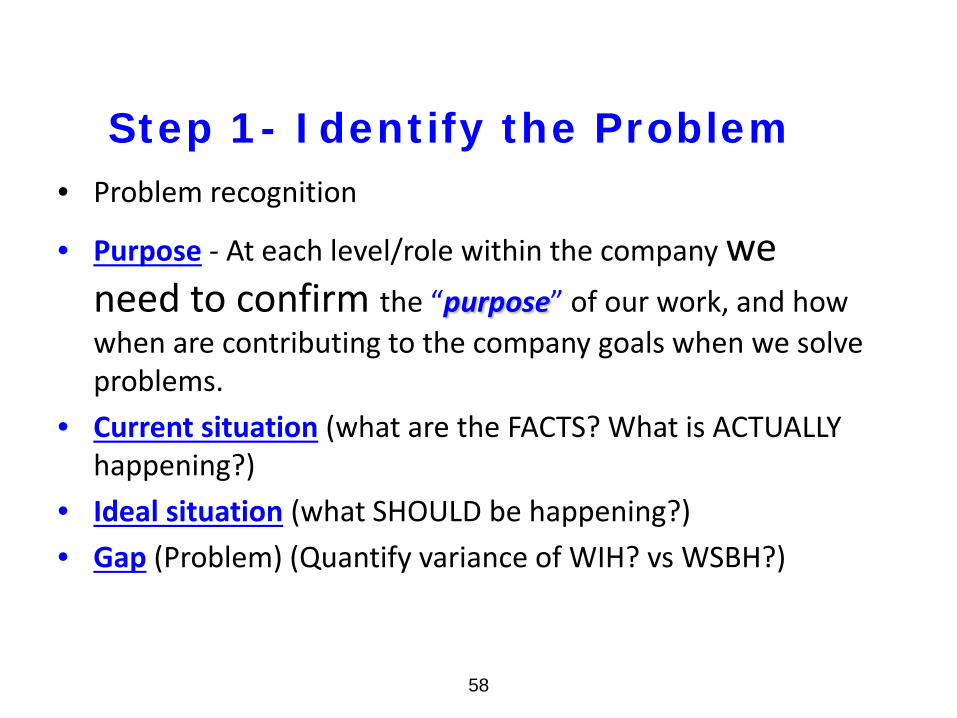
Step 1- Identify the Problem• Problem recognition
• Purpose - At each level/role within the company we need to confirm the “purpose” of our work, and how when are contributing to the company goals when we solve problems.
• Current situation (what are the FACTS? What is ACTUALLY happening?)
• Ideal situation (what SHOULD be happening?)• Gap (Problem) (Quantify variance of WIH? vs WSBH?)
58

Large / Vague Problem
Problem Problem Problem
Problem Problem Problem Problem ProblemProblem Problem
Breakdown
what? where? when? who?
BreakdownPrioritize
BreakdownPrioritize
To the “Prioritized Problem”
Confirm facts through checking the processes (GENCHI GENBUTSU)
~ Based on facts, divide the problem and clarify objectives~
Prioritized problemAt the point of occurrence
Point of Cause
Step 2: Breakdown the ProblemOVERALL IMAGE of Step 2
what? where? when? who?
Now let’s break down these steps for you….59

How to Breakdown The Problem – to focus on the prioritized problem
Ask yourself “What Is / Is Not Part Of The Gap”
Problem
Where is ithappening?
Work stations, OnlineOffline, Depart,
Section?
When it is Occurring?
Time, Shift, Day, Month
Who is it affecting?Who is involved?
Who are the Stakeholders?
What is it?What is it impacting
What areas?Sections, Dept
Check each factor using Genchi G
enbutsu
Divide
1
2
21
3
DivideSeparate into division points using the 4W’s
Continue breakdown using G
enchi Genbutsu
4W D
ivision points and prioritizing
Prioritize
PrioritizedProblem
60

Select the prioritized problem
Step 2: Breakdown the ProblemSo now that we have prioritized let’s:
Problem
Problem Problem Problem
ProblemWe are specifying the problem within our GAP/Problem that can be linked to a process
THE PROCESS(ES)
What is a “process” and how do we define it?
Breakdown
Prioritize
Further breakdown
61

After we have selected the “Prioritized Problem” and determine the process in which it’s occurring:
Prioritized ProblemAt the point of occurrence
POO
“Where” is the problem occurring within the process? Once we understand “where” the abnormality is occurring this becomes our Prioritized Problem at the point of occurrence . Our “POO” is what we set our targets on to address, and then begin to ask WHY is this happening.
Breakdown the Problem, Continued
Observe a process through the sequence of steps
Or tracking back through a process
62

Target
Prioritized Problem at the Point of occurrence
Is it quantitative, detailedand challenging enough?
How Much?
By When?
Set the Target for the Prioritized Problem at the Point of Occurrence
~Set challenging but realistic output measurement guidelines~
Are we contributing to the Purpose?
Step 3: Target Setting
63

(1) Consider potential causes by imaging the actual situation where the problem occurs
(2) Based on facts gathered through GENCHI GENBUTSU, keep asking “Why?”
(3) Specify the root cause
In order to clarify the root cause, thoroughly investigate the process involved
対策
Prioritized Problem at the Point of Occurrence
Root Cause
Cause
Cause
Cause
Cause
“WHY?”
Repeatedly ask “WHY?”
Countermeasure
Confirm facts. If there’s no cause/effect sequence in the cause, stop asking “WHY?”
Step 4: Root Cause Analysis
Detailed Processes
64

Cause / Effect RelationshipsConfirm with facts through Genchi Genbutsu
• You have a cause when you can show there is a link between the existence of your problem and the existence of another occurrence or condition.
• The best way to demonstrate a Cause / Effect relationship is to remove or block the cause. If the problem goes away you have found a Cause of the Problem.
ProblemCause exists, therefore aEffect
exists
CauseProblem
EFFECT
NO65

Root Cause AnalysisPursue and specify the root cause by repeatedly asking
“Why?” and building a chain of Cause/Effect Relationships to the root cause
Stop when you believe you have reached the root cause and check to see if it this cause is effectively counter measured will it address all the causes up the chain?
ProblemDirect Cause
Cause
Cause
Cause
Root Cause
?Why?Why?
Why?
Why?
Cause >> Effect Relationships
66

Countermeasure
Countermeasure
Countermeasure
Countermeasure
Countermeasure
What people or parties
will be impacted?
Countermeasure
Root Cause Countermeasure
Can We Get Rid of
it?
What are therisks involved?
Framework of Experiences
Frameworkof Scope
Step 5. Development Countermeasures
67

Step 6. Implement Countermeasures
~Coordinated and speedy implementation~
Proper Checking
Persistent & Confident Implementation
Timely Reporting, Informing,Consulting
Speedy & Smooth
Coordination
68
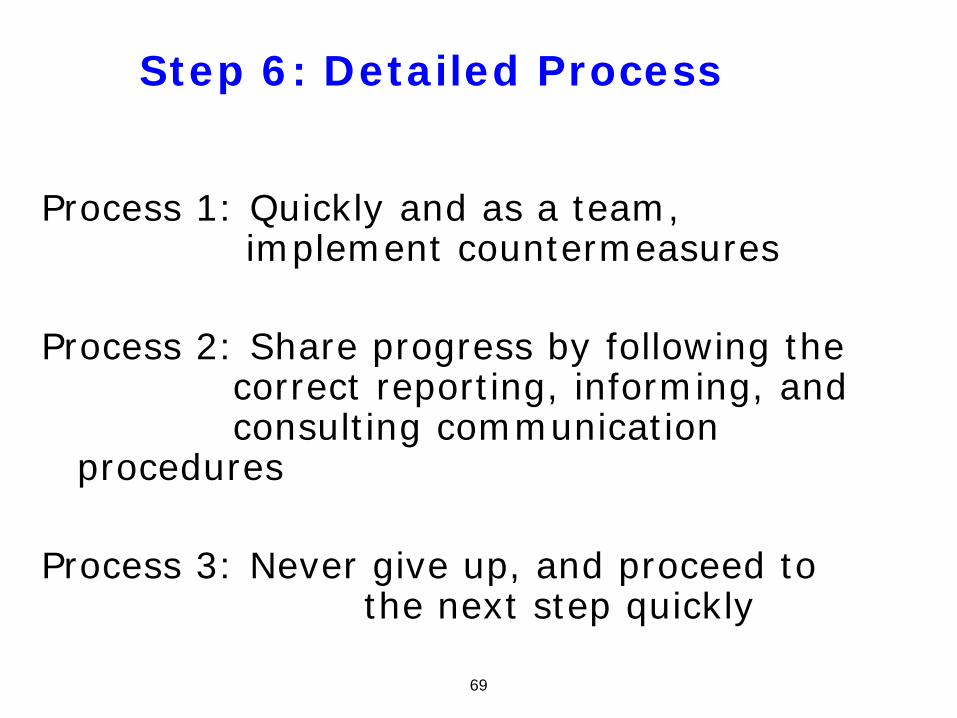
Step 6: Detailed Process
Process 1: Quickly and as a team, implement countermeasures
Process 2: Share progress by following the correct reporting, informing, and consulting communication
procedures
Process 3: Never give up, and proceed to the next step quickly
69

In terms of the target, how was the outcome?
Customer’s Viewpoint
Toyota’s Viewpoint
Your Own
Viewpoint
Evaluation Evaluation Evaluation
What was the result?
What wasthe process?
~Evaluate both results and processes and learn from both success and failure ~
Step 7. Monitor Process and Results
70

(1) Structuralize the successful processes (Standardize)
(2) Share the new precedent through YOKOTEN
(3) Start the next round of KAIZEN
-Establish the successful process as precedent, -and continue to
raise the standard level of success-New Ideal Situation
Own work &Responsibility
OverallCompany
Standardization
KAIZEN
P
D
C
A Repeat PDCA until success is achieved, then Standardize
YOKOTEN
StandardizationKAIZEN
YOKOTEN
StandardizationSuccess
Failure
Implementation
Step 8: Standardize and Share Success
Overall Image
Let Discuss these points further71

What is an A3 ?• Core Communication Tool at Toyota
Reporting
Informing
Consulting

A3 Applications
• Problem Solving
• Proposal/Approval
• Status
•Strategy
73

74
Standard Work for Leaders
ROLE % of Work (time) that should be Standard
Executives 10-15%
Value Stream Manager 25%
Support Department Managers
50%
Group Leaders 50%
Team Leaders 80%
Team Members 95+%

Recognition & Corrective Action
• Company and supervisor recognizing quality work
• Trust economy vs. Entitlement Economy• Company recognizing sub standard work or
unfair work practices and addressing it• Members having the ability to recognize sub
standard performance and unfair work practices and getting it addressed (checks and balances)

76
Fujio Cho, Chairman, Toyota MotorFormer President, Toyota Motor Manufacturing,
Kentucky:3 Keys to Lean Leadership:
1. Go See.• “Sr. Mgmt. must spend time on the
plant floor.”
2. Ask Why.• “Use the ‘Why?’ technique daily.”
3. Show Respect.• “Respect your people.”