Embed Size (px)
Citation preview

Leading Organisational Change: Improving Hospital Performance
02/2007-5354
This case was written by Jean-Louis Barsoux, PhD, and Mattia Gilmartin RN, PhD, both Senior Research Fellows at INSEAD. It is based on fieldwork conducted by Julie Battilana, Doctoral Candidate, under the supervision of Thomas D'Aunno, Novartis Professor of Healthcare Management at INSEAD.
It is intended to be used as a basis for class discussion rather than to illustrate either effective or ineffective handling of an administrative situation.
The project was supported by the Johnson & Johnson–INSEAD HMI Partnership, The National Health Service-Modernisation Agency, Leadership Centre, and the INSEAD Alumni Fund.
Copyright © 2007 INSEAD
N.B. PLEASE NOTE THAT DETAILS OF ORDERING INSEAD CASES ARE FOUND ON THE BACK COVER. COPIES MAY NOT BE MADE WITHOUT PERMISSION.

Copyright © 2007 INSEAD 02/2007-5354 1
Disturbing Symptoms
In April 2002, under government pressure to improve services and reduce duplication, three hospitals merged to form the King Edgar Hospitals NHS Trust (see Appendix 1). A year later, the Trust received a lot of adverse media coverage over its waiting list problems and £30 million financial deficit. With its credibility within the community plunging, something had to be done.
The Trust board discussed a wide range of problems at its monthly meeting in March 2003, including increased trolley waits for patients in the accident and emergency (A&E) department, bottlenecks in the medical admissions ward, high admission rates, patients placed on the wrong wards, increased lengths of stay, delays in discharges, poor relationships with social services, and increased patient complaints. (For the standard patient flow, see Appendix 2).
As the 11-member board debated these topics, it became clear that many issues pertained to the inefficient processing of patients, which inhibited the hospitals’ capability to reduce their waiting lists. Given government scrutiny of long waiting lists—and the resultant autonomy repercussions for the Trust—sorting out these capacity and throughput problems was deemed a priority. As part of the broader turnaround strategy, someone needed to drive and accept accountability to improve the performance of the admission-to-discharge chain. Rodger Andrews, the Chief Executive, asked Tracey Burns, the Executive Director of Nursing, if she would take the lead.
As a former matron, Burns was acutely aware of these problems. Although her responsibilities were entirely managerial, she was no stranger to hands-on nursing, and she knew that hospital beds were often blocked by patients who were medically stable but had nowhere else to go (e.g., a nursing home). A study conducted in her hospital in March 2000 indicated that as many as 30% of patients were medically fit. She also knew that the necessary changes in systems, performance measures and procedures would amount to something of a culture shock, liable to elicit resistance from both specialist physicians and nurses.
However, Burns welcomed the opportunity for two primary reasons. First, there was the professional caregiver’s gut reaction to an unacceptable situation: “I was trying to put myself in the patient’s position, having to spend up to 12 hours on a trolley in an A&E department when you’ve had nothing to eat or drink and you’ve probably got a sore bottom because you’re laid on a tiny little thin mattress, with no dignity. For me, it was about saying ‘We can make a change to that now by just moving some of the systems’.”
Second, and beyond the patient perspective, she saw an opportunity to extend the role of nurses in an environment dominated by the medical profession. She wanted “to try to increase the nursing voice and … demonstrate how nursing could contribute to the agenda”. Empowering the nurses might help recruit and retain more of them in what had become a very tight labour market. With its additional potential to relieve waiting lists, this project was a high stakes undertaking on all fronts.
Burns had in mind a systemic approach to patient discharge that would begin at the pre-admission stage. More controversially, she nurtured plans to introduce nurse-led discharges,

Copyright © 2007 INSEAD 02/2007-5354 2
which would mean nurses would take over responsibility from specialist physicians to make the final decision to discharge a patient.
The Waiting Game
Even as early as the decision to merge, the prevailing climate and priorities within the Trust had been heavily influenced by the programme of National Health Service (NHS) reform launched by the Labour Government (for background information, see Appendix 3). The heart of the government’s NHS Plan, unveiled in July 2000, was an ambitious pledge to cut maximum waiting times, which were regarded as the public’s main concern and a striking symbol of hospital inefficiency. Under the new guidelines, for example, patients who previously waited up to 18 months for treatment could expect to wait no longer than 9 months by 2004, and 3 months by 2008. Similarly, cases of patients waiting more than 12 hours in the A&E department were to be reported to the Strategic Health Authority, which would inform the Department of Health.
On the basis of these and other metrics (e.g., financial performance, cleanliness, staff morale, patient satisfaction levels), hospital trusts were awarded stars, like Michelin restaurant ratings, to indicate how well they were run. Those awarded three stars received full funding and were free to spend the money as they chose. In contrast, zero-starred trusts would have to submit performance improvement plans to the NHS Modernisation Agency and be subjected to close scrutiny, particularly in terms of how they spent their money. On the basis of its performance prior to March 2003, the King Edgar Hospitals NHS Trust was awarded one star—a moderate fail—which signified that it had not performed well across its key targets.1
The star ratings were regarded as a means to drive up standards and reduce the wide variations in the performance of NHS trusts while making managers more accountable to the public. Yet the intense political pressure on NHS trusts to meet the waiting list targets also generated some unwanted side effects. For example, in several cases, waiting list figures were “misreported”i and questions arose about how the hospitals were meeting their targets when it was discovered some hospitals drafted extra physicians, nurses, and radiographers into their A&E departments to raise their performance during crucial assessment weeks.ii A spokeswoman for one of the top-performing trusts explained: “We wanted to maintain our three stars.... We did probably what most other trusts did and brought in extra staff.”iii
Unfortunately, the option of pouring in extra resources to hit its targets was not available to the cash-strapped King Edgar Hospitals NHS Trust; it could only work to meet its targets as best it could with the resources available. Occasionally, that goal gave rise to expedient measures that produced difficulties downstream. For example, when patients had been waiting in casualty for almost 12 hours, pressure mounted on the medical admission ward to assign them to a ward, – to avoid breaching the 12-hour ruling – which meant that they might be dispatched to wherever a bed was available. Typically, such assignments increased the length of patients’ stay, because they would not be seen by the appropriate specialists, who performed their rounds on other wards.
1 Of the nine key targets, the Trust failed on three: (1) financial management; (2) three patients waited longer
than the 12-month standard; and (3) ten patients waited longer than the 26-week outpatient standard - (Source: Annual Report 2002–2003).

Copyright © 2007 INSEAD 02/2007-5354 3
Department of Health figures also implied that target pressures might be distorting clinical priorities, as was suggested by the national surge in emergency re-admissions—that is, patients sent home early who had to be rushed back to hospital.iv Given these risks, Burns knew that the Trust would have to monitor re-admission trends closely.
Burns had actually taken initial steps to review the discharge process in October 2002 when interviewing Sue Green for one of the three Assistant Director of Nursing positions. If successful, Green had been told, the Chief Executive would want her to use her training experience (and her work with different agencies) to run a workshop with key stakeholders at Clover Hospital to address discharge problems. Green got the job and, three weeks later, organized a workshop to get everybody thinking about improvements. But in an atmosphere of widespread anxiety and change fatigue, nothing came of it. She was particularly disappointed by the evidence of a “blame culture” that had permeated the workshop—a sense of “But what more can we do?” and a tendency to hold Social Services responsible for all the discharge problems because of its inability to propose timely solutions for patients.
The Case for Treatment
In April 2003, the Chief Executive announced a series of key performance objectives, which he dubbed “golden bullets.” The first required an energetic investment in improving and overhauling the Trust’s discharge performance. Shortly thereafter, during a lunch meeting with the Chief Executive, Burns secured a pledge that if nursing took responsibility for discharge planning, matrons would be relieved of their onerous bed management duties, which would be picked up by general management.
Backed by her strong mandate from the top, Burns organized a workshop on improving the discharge process. Working closely with Green, she invited the entire body of matrons, each in charge of a group of wards; 20 of the 22 attended. The workshop was essentially designed to launch the project and get buy-in from the matrons, because many seemed unsure why nursing had taken on this “medical issue.” The idea was to underline that nurses had both the authority and the expertise to “sort out the production lines”.
While introducing the purpose of the workshop, Burns also announced the concessions she had obtained in terms of reduced duties, effective from July, which received an enthusiastic reception. Then, speaking from experience, she evoked various areas where there seemed to be room for improvement in the discharge process. She started by reminding the matrons that the Trust’s biggest hospital (Clover) actually had the third-highest admission volume in the country. To some extent, she conceded, this volume reflected the lack of adequate alternative healthcare facilities in the community, but she insisted there were other factors too. After an initial triage by an experienced A&E nurse, actual admission decisions were made by very junior physicians, who tended to err on the side of caution, which generated an immediate bottleneck in the A&E department. When those patients moved on to the medical admission ward, the lack of a senior medical presence again meant that patients were not getting moved fast enough, causing even more backup in the A&E department, and resulting in some patients waiting upward of 11 hours. On some wards capacity was so stretched that it would only require a power cut in the operating theatres or a few cancelled operating sessions to breach key waiting list standards.

Copyright © 2007 INSEAD 02/2007-5354 4
In addition, pressures on capacity meant that surgeons sometimes took precautions to ensure that their scheduled patients were admitted. For example, surgeons might call in early those patients due to have an elective procedure if they anticipated a likely squeeze in bed space. Patients could end up waiting as long four days before the actual intervention, which naturally compounded the capacity problems.
At the other end of the process, Burns noted that inefficient practices and poor communication were blocking the release of many patients. For example, many patients were simply waiting for test results or a prescription to take home and did not need a hospital bed. Another common scenario was that physicians doing their rounds would suddenly pronounce a patient fit to go home, at which point the discharge planning procedures would commence. This late start caused unnecessary delays due to simple problems like arranging for relatives to collect or look after the patient for a few days, or more complex concerns of finding suitable residential or nursing home accommodation. Poor communication with Social Services and poor knowledge of the varied and evolving care schemes provided by primary care trusts (as well as their eligibility criteria) further complicated matters.
Nor were the hospitals making effective use of their discharge lounges. Patients due for discharge would remain on the ward until ready to leave, which did not ease pressure on beds or allow the early call-up of new patients. Often, it was the nurses themselves who would notice the patient’s stable condition and call the physician to authorize the discharge, but that practice typically meant waiting until the physicians had completed their afternoon rounds, at which point it was too late to call in a new patient that day. And to cap it all, increased lengths-of-stay exposed patients to higher risks of hospital-acquired infections, particularly amongst the elderly, which in turn put additional strain on the system.
To reinforce her message, Burns invited Green to share the preliminary findings from a bed occupancy exercise she had conducted. Green applied a methodology designed to identify the number of stable patients occupying hospital beds, an approach known as “point prevalence”. The technique involved sending a team that consisted of a ward sister, an occupational therapist, a physiotherapist, and a social worker to assess the medical stability of patients on each ward. The early results, presented at the workshop, suggested that more than 17% of their patients did not need to be in an acute hospital bed and could be cared for in a different environment. Green emphasized the need to provide the expected date of discharge during the admission procedure, with daily updates, as a platform for more effective discharge performance.
The remaining third of the day was devoted to group work, facilitated by Burns and three Assistant Directors of Nursing. The four groups, each focusing on a different aspect of the discharge process, came up with several action recommendations. One group proposed a “scaled-down” version of the point prevalence approach to track performance improvements on a monthly basis, as well as a list of relevant performance indicators. (For the proposed metrics, see Appendix 4). Another group suggested adopting wards that had scored poorly on the point prevalence study as pilot sites and argued for an education programme to help the nursing staff understand and implement effective and timely discharge planning. A third group looked at how to integrate matrons’ new responsibilities and objectives into their annual performance evaluations and proposed allocating three fixed sessions per week to the management of discharge performance (to allow matrons to lead this activity). Finally, the fourth group considered nurse-led discharge, noting that it had been in operation for five years

Copyright © 2007 INSEAD 02/2007-5354 5
on one of the maternity wards, proposing ways to introduce it more broadly, and stressing the need to define clear discharge criteria for each ward, as well as criteria for “hand backs” to medical practitioners.
At the end of the session, Burns and Green asked who would be interested in working on some of these initiatives. Many matrons, including Helen Edwards and Nikki Thorton, volunteered. Yet not all were enthused by the prospect, as evidenced by the reaction of one matron who attended: “I just thought, ‘Oh no!’ Discharge planning is boring. And the fact that if you’re pushing patients out quicker [it creates] more workload because you get another acute admission that’s poorly…. You have a lot of paperwork to do on a new admission.”
Burns realized she had her work cut out for her to get all the nurses behind this initiative. To maintain the momentum, she shared the action plan from the workshop with her colleagues from the Executive Director Group and asked them to sign off on it. She made three presentations to gain the support of the general managers, the medical staff committee, and the medical directorate, and then, through the hospital general managers, invited all senior physicians to a meeting at which the Chief Executive had agreed to endorse the initiative. The meeting was announced six weeks in advance to allow the senior medical staff to cancel or re-arrange their clinics.
Burns also co-opted the Director of Information Management and Technology (IM&T) to help develop the information systems needed, working alongside the Assistant Director of Practice Development, who would provide the baseline data needed to monitor progress (length of stay, re-admission rates, etc.). Finally, she named Green to chair the steering group, which would meet weekly to oversee the initiative. As both were based at Clover Hospital, Green and Burns interacted regularly, both formally and informally.
Having dedicated about 20% of her time in the prior two months to launching the project, Burns felt it was time to step back a little, explaining: “It needed to be done right at the very beginning. We needed to be able to demonstrate that we’d done the diagnostics, that we understood the operational problems. I needed to go into the senior medical staff committees and to reassure them that we would share the information with them, [and keep] them regularly up to date, so valuable time was spent.” From now on, she would reserve her time for developing links with the external agencies; more efficient throughput had to be matched by exit improvements, or it could prove counterproductive.
Toward a More Effective Operation
Following the matrons’ workshop, the discharge performance steering group started its own meetings in June 2003, occasionally attended by the Chief Executive. For half an hour each week, one of the Hospital Managers (Clover), the Assistant Director of Practice Development, and the Director of IM&T joined Sue Green and the matrons in charge of discharge projects to review the developments. At one of the first meetings the Chief Executive conceded he was unhappy with the input from their Social Services colleagues but stressed that he wanted the Trust to get “its own house in order” before complaining to Social Services about its inefficiencies.
Also participating in the steering group was the newly appointed “Discharge Manager,” a position created exclusively to facilitate the discharge process and liaise with outside
Copyright © 2007 INSEAD 02/2007-5354 6
agencies, such as Social Services. Effective immediately, this person would be supported by a discharge co-ordinator, whose job would be to handle complex discharges and to be cascaded out once recurring funding could be secured. Another new role that would support the discharge process, albeit indirectly, was the position of “site manager” (six per hospital to provide 24-hour coverage 7 days a week). The appointment of senior nurses to these positions made it possible to change the bed management duties—and ensure patients were placed on appropriate wards—while alleviating matrons of that responsibility, as promised.
As the date approached for the meeting with the senior physicians, it became clear that many had not been warned or invited by their general managers—and it was too late to cancel their clinics. At that point, the decision was made to cancel the meeting.
Meanwhile, Green was investing her time in several ways. Her main priority was to support the matrons and retain their focus on discharge improvements: “I am continually having to motivate them and make sure that [it stays] high on their agenda, so I don’t let them forget it.” To achieve that, however, she also had to work on the general managers, over whom she had no authority: “I have to get the general managers on board to support them working with me on [the project] and agree it’s a priority. So it’s very important that I develop good relationships with the general managers … and that I have credibility with them. I’ve got to convince them of the importance of the outcomes that we can deliver for them and get them to agree to provide the time for the matrons to work with me.” Prior to the workshop, matrons did not have weekly timetables, which were subsequently introduced to help allocate three fixed sessions per week to discharge activities. As for the lead matrons, those seven who were driving the various discharge improvement projects dedicated 30% of their planned time to the issue, causing occasional tensions with their line managers.
Green also knew that she had to involve and support the front-line nurses. Through regular presentations to the nurses’ forum and through the matrons, as well as with her physical presence on the wards, she needed to ensure that “Sisters on every ward are monitoring on a monthly basis the percentage of patients that are medically stable, making sure that all have discharge plans, making sure that we communicate well with the relatives and patients, that they understand the care plans, that the plans get reviewed on a daily basis, that all staff understand the schemes.” She was also busy training the matrons and ward sisters to conduct “mini” point prevalence assessments, due to start on a monthly basis in July.
It was not an easy context in which to drive such an initiative. For ten years or so, nurses had increasingly been asked to take on work, including medical tasks, previously performed by physicians. Indeed, this workload increase had intensified with the recent push to reduce the number of hours that junior physicians were working. Some nurses were reluctant to take on extra work because it involved additional training and reduced the time available for more traditional nursing roles, like talking to and counselling patients and working with relatives. It also raised major liability concerns if anything were to go wrong.
The context was further complicated because a variety of change initiatives were running in parallel. Some were potentially complimentary to the discharge effort, such as the Emergency Care Collaborative, which promoted benchmarking visits that could enable one member of the benchmarking team to collect information on specific discharge practices. The Transfer of Care scheme, launched by Social Services, was designed to achieve a better understanding of the patient’s needs upon discharge. Other initiatives were less obviously complimentary; for

Copyright © 2007 INSEAD 02/2007-5354 7
example, the large-scale Premier Project initiative looked for potential cost savings, particularly through the rationalisation of purchasing, but it meant that matrons were more heavily involved in the pilot testing of new supplies.
Meanwhile, with new discharge legislation on the horizon, Burns spent much of July and August leading discussions with Social Services and local politicians regarding the Community Care Act. This legislation proposed to resolve the problem of delayed discharges by fining Social Services approximately £100 for every day that a patient waited unnecessarily for a care package to be put into place. Many observers predicted that the bill would sour an already strained relationship between hospital trusts and social services.2 But in the region, the parties took a different approach to the problem. First, they established a common definition of what constituted a “delayed discharge.” Second, instead of sanctioning delays, they agreed to invest some of Social Services’ annual reimbursement funding (£300,000) into trying to avoid delays through improved discharge systems, earlier notification, and financial support for the hospitals’ six discharge co-ordinators. Access to this funding would provide much needed assistance to Burns and her team, which had no formal budget allocated to improving discharge performance. To be ready for the legislation, a shadow version of the Reinvestment Plan was put into place in October 2003.
The timing coincided with a second matrons’ workshop, organized by Green, that also was open to staff from external agencies. Its purpose was to take stock of progress on two fronts: the discharge planning process as a whole and, more specifically, the drive to introduce nurse-led discharges.
Discharge Planning
The discharge planning initiative benefited because the lead matron, Helen Edwards, had previously been her hospital’s link matron for issues surrounding discharge. It was natural for her to build on that experience, and within a couple of weeks after the first matrons’ workshop, she had already produced a report entitled “Changing Culture & Improving Discharge Performance,” which outlined the scope of the initiative for the ward sisters and nurses. The report stressed that it was a major priority for the Trust and that discharge planning started from the moment a patient was admitted.
The report cited several preliminary measures already undertaken: a review of the “Going home from hospital” information booklet, the introduction of discharge planning notice boards for patients and caregivers on each ward, a poster campaign advising patients that they should not expect to stay in an acute bed once their acute illness had passed. Ward staff were also encouraged to make better use of the discharge lounge, and matrons were given monthly reports regarding the use of the lounge by different ward areas.
Edwards also created cartoon posters with golden bullets to show how discharge planning fit into the Trust’s overall priorities. She shared these with all the ward sisters who reported to her and asked them to display the posters so the staff would become familiar with them. Very quickly, other ward sisters, those who did not report to her, started contacting her to ask if
2 A health select committee consultation paper found that 80% of 250 affected organisations—councils,
primary care and NHS trusts—said the bill would harm relations between the NHS and social services. (Batty, D., “Who cares,” The Guardian, 13 February 2003, p. 21)

Copyright © 2007 INSEAD 02/2007-5354 8
they could also have them. Within two weeks, they were displayed on every ward in the hospital.
At the same time, Edwards and the newly appointed Discharge Manager were organizing the first full-day workshop to promote ownership of discharge planning. Starting in July 2003 and involving all the ward sisters (to ensure they understood their pivotal role in the process), the monthly workshops entailed group work and discussion about discharge planning, such as encouraging ward sisters to attend ward rounds and challenge discharge planning practices on their wards, as well as discussions about how the performance objectives of ward sisters would be modified to incorporate this new issue.
The ward sisters were encouraged to send their staff to the workshops, and Edwards was surprised at the enthusiastic response from the nurses. Only a couple of negative reactions occurred, including one from a nurse on Edward’s own staff who saw the initiative as an unwelcome supplement to his already heavy workload. Edwards was angry, stressing that this initiative was about working smarter rather than harder, but she suggested that he come and shadow her to see the bed situation for himself: “I took him to A&E where there were trolley waits, there were children, older people and he was just, well, amazed.… I took him to the bed bureau and he looked at the list of people needing to come in and, to be honest, he just went completely the other way! Now, he’ll ring the bed bureau himself when he has a free bed so that they send a new patient down.”
The success with the nurses persuaded Edwards to open up the workshops to medics, social workers, and therapists to raise awareness of the issue as a joint problem. Flyers were sent out to emphasize the multidisciplinary nature of these workshops, but though one therapist attended, there was no uptake from Social Services or the medical side.
Despite having a good relationship with the physicians in her hospital, Edwards was not entirely surprised by the negative medical response: “They’ll stamp their feet and dig their heels in and say ‘No, we’re not doing this’, but ultimately it’s about selling it to them and it takes quite a bit of time.” For example, the senior physician on one of the three wards for which Edwards had direct responsibility initially had been very resistant toward the whole effort, but she persuaded him to pilot the discharge co-ordinator scheme. In the process the physician became an advocate of discharge planning and supported Edwards when she later spoke to his two junior colleagues. One of the junior physicians agreed to provide an estimated date of discharge for his patients but said that he didn’t see the point. The other said that he definitely would not be doing so because it was “increasing his workload and a waste of time”. He refused to “pluck a discharge date for somebody who might deteriorate”. Yet it was for this very reason that daily reviews were also being introduced.
So Edwards asked the two ward sisters to “keep badgering him” and set estimated dates of discharge themselves if he didn’t mind. His response was clear: “You can do what you want, but I’m not doing it!” They pushed back repeatedly, showing him that the other two physicians were now cooperating and asking him again to give it a try. At that point, he wrote to the Chief Executive, with copies to Edwards and the ward sister, saying that he thought it was a waste of time. The Chief Executive fired back a response, insisting that “resistance was futile”, offering his full support to nursing, and listing the reasons why.

Copyright © 2007 INSEAD 02/2007-5354 9
In September 2003, Edwards received the results of a “utilisation management” exercise launched by Burns two months earlier. The assessment showed that up to 30% of the patients did not need admission to an acute hospital, though for half of these there was no suitable alternative in the community. It confirmed Edward’s suspicions that admissions’ procedures needed tightening and that capacity gains from a smoother throughput might be contributing to the problem, in that they reduced the pressure on junior physicians to screen out inappropriate admissions. More efficient discharge was one thing, but they also had to “sort out the front door”.
Edwards was able to secure funding from the recently agreed upon Reinvestment Plan and then to put senior physicians and physiotherapists into the A&E department to help assess patients. In parallel, and under pressure from nursing, the physicians set up the Acute Care Pathway group to redesign the admission pathways, for which matrons were often solicited to be part of the various project groups. A related change was the renaming of the medical admissions ward, which became the emergency assessment unit.
At the same time, some of the wards had been trying to pilot the “single assessment process,” a national recommendation intended to reduce duplication in the collection of patient information. This initiative was proving complex to implement, as it involved a multidisciplinary team. Therefore, Burns put its implementation on hold until the ongoing changes were better established. Similarly, the Transfer of Care scheme was discontinued in October 2003 after the pilot phase. Although Social Services came back proposing a modified version, Burns turned down their request, explaining: “There are just too many things going on. We’re going to be good at those we’ve put in place and then we’ll consider another stage.”
Among other things, the shadow form of the Community Care (delayed discharge) Act was coming downstream in October 2003, which required new communication procedures between the hospitals and Social Services. For any patient likely to require Social Services input upon discharge, the hospital had to send out official notification on admission to allow Social Services to prepare. Another official notification was required 24 hours before the patient’s expected discharge.
By the time of the second matrons’ workshop in mid-October 2003, there were signs of progress on several fronts. For example, the discharge co-ordinators had quickly proved a success. One ward sister who had been particularly negative at the start, saying she would rather have an additional nurse, had seen the benefit other wards were deriving from having someone dedicated to co-ordinating and planning the discharge process. Edwards was also able to report improvements in lounge usage, as well as pilots underway to analyse the further impact of extended opening hours. Furthermore, the monthly point prevalence assessments showed that the numbers of patients inappropriately occupying hospital beds was dropping steadily in two of the three hospitals. (For their comparative performance, see Appendix 5). And the percentage of patients with estimated dates of departure was climbing rapidly; even on the ward with the recalcitrant junior physician it had risen to over 90% from around 10% only a few weeks previously. Edwards noted wryly: “He doesn’t like doing it and they do have to prompt him with a cattle prod sometimes, but he is doing it.” There was much cause for celebration. Conversely, on the nurse-led discharge initiative, progress had not been so smooth.

Copyright © 2007 INSEAD 02/2007-5354 10
Nurse-Led Discharge
Subsequent to the first matrons’ workshop in April 2003, the immediate challenge for the nurse-led discharge (NLD) project had been policy development. A set of guidelines was needed to clearly establish the remit of nurses in terms of discharging patients, as well as the education and training requirements, the necessary competencies, and the extent of nurses’ responsibility. This document would be formally approved by the Board. With her extensive experience with procedure writing, the Assistant Director of Nursing from the Bronte Hospital volunteered to take overall responsibility for the initiative, along with one of the matrons from the maternity unit in the same hospital.
Over several weeks they conducted a literature search but identified only a few isolated pockets of practice in the United Kingdom, mostly in maternity and gynaecology units. They also contacted other trusts to find if they had anything to share, including one in Newark that had been wrestling with policy development for close to a year. But, for Edwards, “That was too slow. We wanted to move more quickly and, at that point, we decided, forget about what other people are doing, let’s just sort out what we think is right.” A relatively short set of policy guidelines was prepared, and the Executive Director Group signed off on them in August 2003, providing vicarious liability if anything went wrong.
By the time of the second workshop in October 2003 it was evident that the NLD project had not developed sufficient momentum, partly as a consequence of the absence of bed pressure problems at the Bronte site, which failed to foster a strong sense of urgency. It was also related to the lack of experience among midwives (who advised on the guidelines) about discharging patients with complex medical and social needs. Green asked for a volunteer to take the lead on the training and piloting stage of the NLD project. Nikki Thorton, a matron from Clover Hospital who was already closely involved with the project, volunteered. Knowing that she was “very much an activist”, Green was happy for her to drive the project.
Thorton’s first priority was to develop a training programme for all the nurses going through NLD. In late October 2003, she proposed the first of her monthly training sessions, inviting nurses from all wards to attend but with no idea about what kind of response she would get. As it turned out, she averaged 20 nurses per session. The first two hours of training involved Thorton herself providing information about issues such as record keeping, history taking, patient consent, and accountability. The next two hours were spent developing competencies; nurses from each specialty drew up a list of the medical criteria that a patient in their area would need to fulfil to be considered fit for discharge. This work was essential to offer something tangible to the physicians and gain their approval.
After three training sessions, Thorton had covered the full range of specialties and decided to write each physician in the three hospitals to explain the whole process. Unfortunately, her timing coincided with a reshuffling of matrons’ responsibilities within her hospital, and the secretarial support Thorton had been using for the NLD project was removed by her general manager. By the time Green heard about it and could offer some assistance, Thorton had already done the secretarial work herself: “I found that hard, trying to do my day job and trying to get the clerical side sorted. But all the physicians were sent a copy of the policy and a list of the proposed discharge criteria for their area, with a request to contact me if they had any problems.”

Copyright © 2007 INSEAD 02/2007-5354 11
Thorton’s proposals went unchallenged: “Nobody got in touch, so I assumed that everything was going to be okay.” The next stage was to get the physicians involved, first in showing the nurses what to do, then observing them, and finally signing the certificate to say that a nurse was competent to carry out NLD. It was only at this point that the objections began to surface. It started with one of the respiratory nurses who, after attending the training, approached the physician to ask him how he thought they might approach it, only to be told that “Under no circumstances was a nurse going to discharge his patients.”
In addition to the respiratory specialist and a cardiologist refusing to participate, other physicians clearly had not read Thorton’s letter or had assumed it would not affect them: “It was only when the nurses started trying to identify suitable patients for nurse-led discharge that they said, ‘What do you mean by nurse-led discharge?’”
This resistance was a serious setback, in that physicians formed a very powerful group within the organisation and could easily block any change initiative they did not like. Thorton asked two specialist physicians, a neurologist and geriatrician, who had signalled their interest in the project to put down in writing why they were supporting it. They wrote that it promised to reduce the workload for junior physicians and ensure quicker patient turnover, which, for specialists with long waiting lists of patients, had an obvious benefit.
The main problem, Thorton felt, was with the specialists who dealt mainly with emergency admissions, and it was the emergency admissions that really needed to improve because of the trolley waits in A&E: “The physicians that covered emergency medicine and the acute admissions didn’t seem all that bothered by the process, whereas the surgery side of it were really keen on it.”
Thorton chose to identify two senior physicians, one from surgery and one from medicine, who might support the project. She chose “the ones I got on well with and the ones I thought were going to be strong enough to deal with their colleagues”. She asked them to bring up the issue of NLD at their fortnightly medical group meetings and to be clear that “This is going to happen whether they like it or not and if one physician doesn’t like it, there’s going to be another physician who’s going to sign off those nurses anyway.”
With more of the physicians showing signs of coming around and some participating in the observation of nurses, Thorton encountered another wave of resistance, this time from a less expected quarter. Two or three weeks after they had enthusiastically participated in training, Thorton followed up with a group of nurses to ask how the NLD was progressing. “Oh, well we haven’t really done any yet,” she was told. When she probed, they admitted that they were concerned that the Trust would not support them in cases of re-admission, though they had not raised any questions about liability when the issue had been covered in training. “I don’t know where it’s come from,” explained Thorton. “Some say it’s from the physicians, but I have no evidence of that.”
Thorton reassured them that the Trust would support them “absolutely and completely … provided the nurse could justify her decision”. She also wrote to all matrons, giving them a list of the nurses who had undergone NLD training and telling the matrons, “When you go in on your wards, try to support them [to take the next step] … because I can’t physically support all of them.” In addition, she decided to put in place a clinical incidence reporting

Copyright © 2007 INSEAD 02/2007-5354 12
system to “pick up re-admissions and look at why they’ve come in” and determine whether it was related to the patient’s previous problem.
By April 2004, more than 120 of the 2,500 nurses and midwives had gone through NLD training, and at the professional forum meeting two of the ward sisters gave an account of how NLD had changed their jobs. They acknowledged that making their first discharge decision had been quite a trial but also noted that they had quickly grown in confidence and had released 40 patients in the previous month alone. They explained how they would identify patients as suitable for NLD on admission (or even pre-admission, in the case of a scheduled procedure) before outlining the NLD procedure to the patient and requesting the patient’s consent. The ward sisters felt that it enabled them to build up a better relationship with the patient and gave them a sense of providing “total patient care”. After the intervention, the patient would return to the ward with a treatment plan and notes from the physician so the nurse could proceed with discharge, provided that the patient’s convalescence followed the expected trajectory.
In cases in which the patient needed to take a prescription home, the nurses would get the physician to prescribe it on the previous evening, making it possible to discharge the patient the next morning at 7:00 AM and allowing the hospital to call in a new waiting list patient or accept an acute admission the same day. Prescriptions were the last remaining hurdle for NLD. Although there were prescription courses for nurses, the Trust was too stretched, both financially and in terms of staffing, to release nurses for the necessary six-month training.
Thorton’s immediate concern was to get more nurses signed off as competent for NLD. She decided to call a temporary halt to the training sessions, explaining “I don’t want to get more and more nurses through training when they can’t really get their competences signed off because the physicians haven’t got the time.” Her idea to get around this problem, once enough nurses were experienced in NLD, was to have nurses sign off for other nurses.
Taking a Health Check
In October 2003, the initiative had experienced a potentially devastating blow when Rodger Andrews, the Chief Executive who was strongly behind the discharge effort, was forced to take sick leave. An acting CE had taken over, but there was not the same impetus to make progress reports to the general management forum that had existed under Andrews. A new Chief Executive, John Smith, was not appointed until April 2004. Three weeks into Smiths’ tenure, the four members of the senior nursing team were invited to share their thoughts regarding the past and future of the discharge project.
Matron Nikki Thorton had several satisfactions to list. She pointed to the number of nurses who were well on their way to becoming competent to discharge patients, especially in the surgical specialties. So far, not one patient had refused to give consent for NLD, nor had there been any cases of re-admission linked to early discharge. Most encouragingly, she reported mounting interest from other Trusts, eight of which had contacted her for details, advice, or training on NLD.
Thorton also noted the beneficial side effects of her project in terms of integrating the work of matrons across the three hospitals and the status of nurses: “Generally I think nurses are being

Copyright © 2007 INSEAD 02/2007-5354 13
given more respect and an acknowledgment for the knowledge and the ability they bring to what they’re doing, which has been a long time coming, really.”
She was a little perplexed at the disparity of uptake between different wards, noting that the initiative was up and running extremely well on one neurology ward but meeting much more resistance in another. Looking back, she realised that she had underestimated the amount of support needed by ward staff to make discharge decisions and could have done a better job of “making sure the support structures were in place” prior to initiating training.
As a next step, she envisaged “getting the physicians on board, getting the nurses on board, where the successes have been, and doing a presentation to the wider medical community. So they can sell it … let the champions sell it to the others.” Looking ahead, she remained very upbeat: “I think that within three months we’ll see a massive upsurge. At least three-quarters of the nurses – that’s my goal – are going to be carrying out nurse-led discharge.… At least one in each ward, on each shift.”
Matron Helen Edwards was particularly proud of the changes in work practices and attitudes, which had resulted in more proactive, energized discharge planning: “Now, you can ask nurses what’s happening with the patient and they’ll know. Their care plans are reviewed daily. The mini points prevalence that we do each month is done by the ward sisters, and the results speak for themselves.” The percentage of stable patients in acute beds was down to 7.5%, and usage of the discharge lounge had improved 100%. The Trust was also closing in on several other discharge targets. (For achievements compared with targets, see Appendix 4). And a proposal had just been launched to obtain money from charitable funds to refurbish the discharge lounge.
Edwards was somewhat frustrated that Social Services was still operating at a slower pace than the project required: “When they’re called in, they do step up a level. But we want them to step up a level 24 hours a day, 7 days a week. Having said that, our understanding of each other’s ways of working has improved a lot.”
Her forthcoming challenges, she felt, would be to try to link up better with Thorton in terms of helping nurses become discharge competent and, more generally, consolidating the improvements obtained: “[Discharge planning] overtook a lot of other issues that I was dealing with. It was a chief priority for my workload, but now, it’s like ‘dare I let go of these reins and step back?’ But I don’t think I can take my eye off it yet, because although people are more motivated, it’s easy for them to slip back.”
Assistant Director of Nursing Sue Green welcomed the much-improved relations with external agencies, a result of joint schemes, notification procedures, and multidisciplinary meetings: “Things are better. It doesn’t feel so much like a blame thing. There’s more joint ownership of problems.” She noted, for example, that the reimbursement protocol had been implemented successfully with no disputes or appeals. She was also satisfied that she had managed to keep the staff focussed on improving discharge planning, beyond the first exciting months of the project and despite competing pressures.
However, she regretted the poor performance of Bronte Hospital on several of the key performance indicators, which was dragging down the Trust’s overall performance (see Appendix 5). Asked to comment on this lag, she offered two explanations.

Copyright © 2007 INSEAD 02/2007-5354 14
Bronte had never experienced the same kind of admission pressure as the other two hospitals. It had always had a slightly more efficient casualty service and did not have a problem with bed utilisation. “When we merged, some of the response from Bronte was ‘We really don’t need this project quite as much.’ But the reality was that we were trying to implement some standardisation across the Trust and bring the different hospitals together.” The problem was probably compounded by the systematic stress that Rodger Andrews, who had been in charge at Bronte before the merger, put on the problems at the Clover and Friar sites. Green also noted,
“Also, Tracey’s [Burns’s] visibility is mainly on the Clover site. She spends three days a week there. Myself and Helen [Edwards] are also based at Clover, though both of us worked at Friar before the merger, and therefore, we still had the networks and the tentacles into Friar and to be honest we abused those and played on them.… And, of course, Nikki [Thorton] is the matron for A&E for both Clover and Friar. So there’s something, I think, about visible presence keeping the project going.”
Looking forward, she was cautiously optimistic: “Some of the new physicians that come through are great. They come in with super ideas and want to change the world. But we’ve also got a number of dinosaurs within the organisation who are very powerful still … and we don’t yet have a critical mass of the younger, more dynamic physicians.” She echoed Edwards’ concerns: “Although discharge planning is now a reality and everybody’s very much aware of how important it is and they’re all doing what we ask of them, I just feel that if I started to prioritise something else, it would start to slide again. So it’s not yet the right time [for me] to withdraw from this project.”
Director of Nursing Tracey Burns drew special satisfaction from the reinvestment plan agreed upon with Social Services –“despite the politics” – and from helping keep the discharge project on track across chief executives. She also felt that their efforts had helped raise the profile of nursing, as she had hoped it would: “Helen [Edwards] had to come to the Trust board last Friday to do a presentation. To have matrons coming in to Trust boards is another visible sign of what nursing is doing.”
Her regrets revolved primarily around the failure to get the medical side involved in the project—and particularly allowing the early meeting with senior clinicians to be cancelled: “I often reflect on whether I should have tried to manage it in partnership with the Medical Director and whether that would have given us any different results? Would they have led on the changes at the front-end admissions, sooner? It might have generated a system solution.” Taking a wider perspective, she conceded that “Perhaps it would have been a good way to demonstrate how physicians and nurses can work together. That’s probably been a lost opportunity.”
Burns was also frustrated that after identifying the right metrics, they had not succeeded in establishing clear baseline data for re-admission rates or length of stay, making it difficult to assess their progress. (For the list of metrics actually implemented, see Appendix 4). The Assistant Director of Practice Development left the organisation before completing the project, and looking back, Burns believed “[W]e underestimated the need for administrative and analytical support.” The number of patients with an estimated date of discharge and other

Copyright © 2007 INSEAD 02/2007-5354 15
key metrics had been collected manually. And with a new patient administration system coming online in 2005, it no longer seemed worthwhile to invest in a provisional system.
Another lesson that Burns took away from the experience was that complex organisational change typically resulted in a variety of processes running in parallel. Looking back, she felt she could have done a better job of mapping the change processes to avoid some duplication. She also believed that she had occasionally allowed external agendas to become distracting, notably by letting the Transfer of Care scheme go ahead: “It was too much, too soon, rushed and ill-thought through.”
Looking ahead, she indicated the essential challenges lay in juggling different demands and priorities: “The targets are often competing in different directions, so you’re told you must hit your waiting list targets, but at the same time you must bring down the expenditure by £20-odd million within 12 months and you must streamline activities. And streamlining clearly means moving staff across sites. There’s all the staff consultation that needs to be undertaken, you need to train them so if you’re moving nurses from surgery into orthopaedics you need orthopaedic training … and doing all of those things at the same time is exhausting.”
However, she felt that their achievements in the past 12 months demonstrated the kinds of contributions nursing could make as a professional group and hoped that nurses’ enhanced influence over the patient journey would result in higher job satisfaction and retention rates. Longer term, she also believed that their efforts to introduce NLD across the Trust would help set the stage for the process to become a standard throughout the NHS in the future.
Epilogue: The Risk of Relapse
Despite the significant improvements across a broad range of discharge measures, the gains were not reflected in public opinions about the Trust. The situation was made even worse in August 2004, when the Trust lost its only star in the annual ratings. This score put it among the nine worst performing trusts in the country, with almost 1 in 5 people having to wait more than five hours in A&E admissions for a bed, twice as many cancelled operations as the national average, and delays in outpatient appointments.
Facing the press, John Smith, the new Chief Executive, tried to remain upbeat: “We have taken a firm grip on our finances and are putting in place measures that will enable us to move towards financial stability by March 2006… Staff have worked extremely hard to ensure that over 90% of patients who arrive at Accident and Emergency are seen within four hours, and we continue to work hard across the Trust to improve this figure.” He concluded: “We must now look to the future. This year’s rating is an opportunity for us to draw a line in the sand and move forward.”v
The Royal College of Nursing had previously warned that a no-star rating could seriously exacerbate recruitment and retention problems, creating “sink” hospitals where nobody wanted to work or be treated.vi Burns clearly understood that the zero rating would make her job more difficult and suspected she would have to start monitoring job satisfaction among nursing staff: “It’s tough not only because you have to maintain the public confidence and staff morale, but also because, as one of only two acute trusts in the country not to have a star,

Copyright © 2007 INSEAD 02/2007-5354 16
we have an awful lot of public scrutiny now. It’s like working in a fish bowl. Everybody is looking in. Everybody is questioning.”
The financial recovery programme put into place involved two ward closures at Bronte Hospital. Perhaps the only bright spot to emerge from this action was that, by November 2004, Bronte had become “very positively engaged” in the discharge issue. As Burns noted: “Even though they had efficient procedures in casualty, those procedures were very severely challenged once they had fewer beds to admit patients, and therefore, they have now fully embraced all of the discharge initiative.”

Copyright © 2007 INSEAD 02/2007-5354 17
Appendix 1 Overview of the King Edgar Hospitals NHS Trust
Trust Board (Chairman andNon-executive directors)
Executive Director Group (including Chief Executive, GroupMedical Director and Directors of Nursing, Finance & HR)
Bronte Hospital Clover Hospital Friar Hospital
Site management team(Includes General Manager,Medical Director, AssistantDirector of Nursing)
Unlike the other hospitals,Bronte does not have anAssistant General Manager
Available Beds: 363
Site management teamSue Green is Assistant Directorof Nursing at Clover
Matrons Helen Edwards andNikki Thorton are both based atClover (though Thorton’s day-to-day responsibilities also coverFriar site)
Available Beds: 532
Site management team
Available Beds: 396
17 km to the Westof Clover
17 km to the Eastof Clover
Trust employs 6,800 staff, 2,500 ofwhom are nurses or midwives.

Copyright © 2007 INSEAD 02/2007-5354 18
Appendix 2 The Road to Recovery: Standard Patient Flows
Reasons for Delayed Discharge, September 2003
Reasons for Delay Bronte Clover Friar King Edgar . Trust
Awaiting funding 10 3 2 15
Self funding 2 2
Awaiting placement 3 3 4 10
Choice 10 6 1 17
Equipment 3 3
Awaiting physiotherapy assessment or OT assessment 2 2 4 8
Awaiting home visit 5 1 1 7
Re-housing 2 2
Awaiting adaptations 4 1 2 7
Awaiting s/s assessment 12 6 12 30
Awaiting care package 3 5 8
Awaiting psychiatric assessment 1 2 5 8
Awaiting tests 4 2 6
Awaiting transfer 1 11 2 14
Planned & Emergency Admissions
Wait time targets
Triage
Other service in community
Admitted to A&E, wait for intervention
Other wards in hospital
Medical or surgical intervention
Intensive care recovery
Recovery
Discharge
Patient returns home
Coordination
Emergency
Planned
Planned & Emergency Admissions
Wait time targets
Triage
Other service in community
Admitted to A&E, wait for intervention
Other wards in hospital
Medical or surgical intervention
Intensive care recovery
Recovery
Discharge
Patient returns home
Coordination
Emergency
Planned

Copyright © 2007 INSEAD 02/2007-5354 19
Appendix 3 NHS as a Political Football
The National Health Service is arguably Britain’s most cherished institution, in large part because of the circumstances of its inception. Benefiting from the mood of national solidarity that prevailed after World War II and a Labour Party landslide, the charismatic health secretary Aneurin Bevan pushed through a plan offering universal access to health care, funded by taxes and “free at the point of delivery.”vii In the process, the institution became closely associated with the Labour Party and a guaranteed vote winner in general elections.
Far from levelling off, as initially expected, demand for healthcare continued to grow. So though the share of national income allocated to the NHS increased appreciably over the subsequent decades, it still had difficulty keeping pace with the ever-rising public expectations and the advent of expensive new treatments. Large-scale investigations into the efficiency of the NHS in the mid 1950s and late 1970s found little evidence of extravagance or waste and no reason to move away from a health service funded through taxation. With heavy demands on finite resources, waiting lists became the main instrument of rationing.viii
Such was the public affection for the NHS that even Margaret Thatcher’s Conservative government, at the height of its privatisation drive, chose not to extend its radical programme to a sector that, according to opinion polls, continued to enjoy deep and widespread support. They focussed instead on improved management and the introduction of an “internal” or “quasi” market to the NHS, which separated the responsibility for purchasing services (assigned to health authorities) from the responsibility for providing them (assigned to NHS trusts).
By the mid-1990s, decades of chronic underinvestment were catching up with the NHS, and the numbers of patients awaiting treatment reached a record high (1,096,000).ix After 18 years in opposition, the Labour Party was able to blame those strains on the Conservative government, and it swept back to power in 1997, pledging to “Save the NHS” and cut waiting lists by 100,000. Most people had little means to judge the quality of treatment except according to how long they had to wait for it, so the issue of waiting lists resonated with the public: it was an understandable performance indicator.
However, reducing the waiting lists proved more difficult than anticipated, requiring more than a mere injection of cash. In 2000, the project to save the NHS began in earnest with the launch of the NHS Plan. Prime Minister Tony Blair took personal charge of the plan, promising that Britain would rise from near the bottom of the European Union health-spending league to at least the middle by 2005. His mantra became “no investment without modernisation.”x
With Blair staking his political credibility and his party’s re-election on NHS improvements, every indication of progress or decline became newsworthy. That pressure, amplified by the star rating scheme and the new reporting requirements, quickly cascaded down to local politicians. Breaches in standards sometimes resulted in adverse media coverage and political embarrassment. Thus, the performance of the NHS, and the people who worked for it, came under scrutiny as never before.

Copyright © 2007 INSEAD 02/2007-5354 20
Appendix 4 New Metrics
Proposed metrics and targets generated by group work from the Matrons’ First Workshop (28 April 2003):
Metric
Current Performance (28/04/03)
Objective & Timescale
Performance Achieved (28/04/04)
Percentage of elective patients with a pre-admission indicative discharge date
Not measured Aiming for 95% in 3 months
Achieved 65% at 3 months and 96% at 5 months
Percentage of acute patients with an indicative discharge date agreed within 24 hours
56% Aiming for 80% in 3 months and 95% in 5 months
Achieved 66.5% at 3 months and 94% at 5 months
Percentage of medically stable patients no longer requiring a hospital bed
17% Aiming for 12.5% in 3 months and less than 8% in 5 months
Achieved 15.5% at 3 months, 12% at 5 months, 8% at 6 months and 7% at 10 months
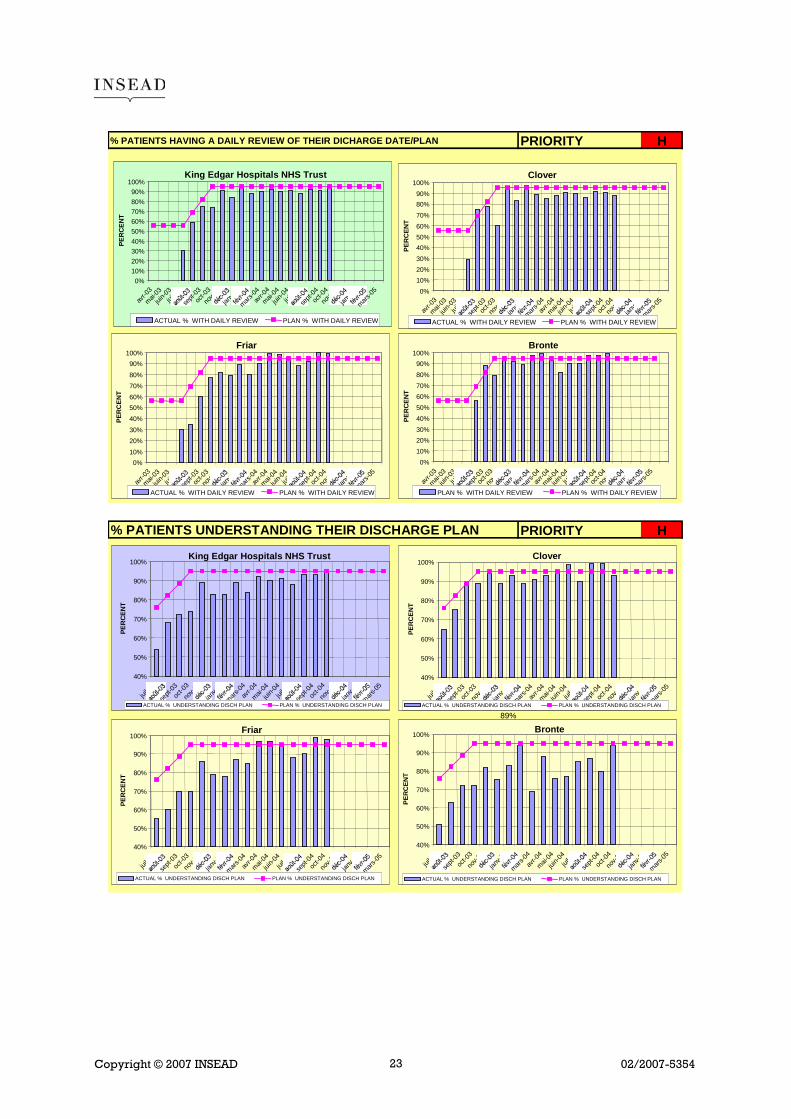
Percentage of patients who understand their discharge plan
Not measured Aiming for 80% in 3 months and 95% in 5 months
Achieved 72% at 3 months, 89% at 5 months and 92% at 9 months
Percentage of patients having a daily review of their discharge plan
Not measured Aiming for 80% in 3 months and 95% in 5 months
Achieved 75% at 3 months, 91% at 5 months and 94% at 6 months
Average ward length of stay (by ward) Not measured Not implemented Average length of stay (by physician) Not measured Not implemented Re-admission rates
Not measured Not implemented
Incidence of complaints relating to discharge performance
Monitored as a Trust target and not per ward
Only 0.01% of all complaints were related to discharge planning
Reliability of the indicative date of discharge Not measured Not implemented The incidence of ‘hand bank’3 Not measured Not implemented The incidence of clinical incidents4 Not measured Not implemented
3 Incidence of “hand backs” refers to the discharge decision being handed back to the medical staff, such as if
a patient’s condition deteriorated. 4 “Clinical incidents” refer to instances in which patients suffer an untoward clinical event related to their
discharge.

Copyright © 2007 INSEAD 02/2007-5354 21
% MEDICALLY FIT PATIENTS NO LONGER REQUIRING AN ACUTE HOSPITAL BED PRIORITYY
H
215
King Edgar Trust
0%
5%
10%
15%
20%
25%
30%
35%
40%
45%
50%
juil-03 sept-03oct-03nov-03 janv-04mars-04avr-04mai-04juin-04juil-04 sept-04oct-04nov-04 janv-05mars-05
PERCENT
ACTUAL % PATIENTS NOT NEEDING A BED PLAN % PATIENTS NOT NEEDING A BED
Clover
0%
5%
10%
15%
20%
25%
30%
35%
40%
45%
50%
juil-03 sept-03oct-03nov-03 janv-04mars-04avr-04mai-04juin-04juil-04 sept-04oct-04nov-04 janv-05mars-05
PERCENT
ACTUAL % PATIENTS NOT NEEDING A BED PLAN % PATIENTS NOT NEEDING A BED
Friar
0%
5%
10%
15%
20%25%
30%
35%
40%
45%
50%
juil-03 sept-03oct-03nov-03 janv-04mars-04avr-04mai-04juin-04juil-04 sept-04oct-04nov-04 janv-05mars-05
PERCENT
ACTUAL % PATIENTS NOT NEEDING A BED PLAN % PATIENTS NOT NEEDING A BED
Bronte
0%
5%
10%
15%
20%
25%
30%
35%
40%
45%50%
juil-03 sept-03oct-03nov-03 janv-04mars-04avr-04mai-04juin-04juil-04 sept-04oct-04nov-04 janv-05mars-05
PERCENT
ACTUAL % PATIENTS NOT NEEDING A BED PLAN % PATIENTS NOT NEEDING A BED
% MEDICALLY FIT PATIENTS NO LONGER REQUIRING AN ACUTE HOSPITAL BED PRIORITYY
H
215
King Edgar Trust
0%
5%
10%
15%
20%
25%
30%
35%
40%
45%
50%
juil-03 sept-03oct-03nov-03 janv-04mars-04avr-04mai-04juin-04juil-04 sept-04oct-04nov-04 janv-05mars-05
PERCENT
ACTUAL % PATIENTS NOT NEEDING A BED PLAN % PATIENTS NOT NEEDING A BED
45%
50%
juil-03 sept-03oct-03nov-03 janv-04mars-04avr-04mai-04juin-04juil-04 sept-04oct-04nov-04 janv-05mars-05
PERCENT
ACTUAL % PATIENTS NOT NEEDING A BED PLAN % PATIENTS NOT NEEDING A BED
Clover
0%
5%
10%
15%
20%
25%
30%
35%
40%
45%
50%
juil-03 sept-03oct-03nov-03 janv-04mars-04avr-04mai-04juin-04juil-04 sept-04oct-04nov-04 janv-05mars-05
PERCENT
ACTUAL % PATIENTS NOT NEEDING A BED PLAN % PATIENTS NOT NEEDING A BED
Friar
0%
5%
10%
15%
20%25%
30%
35%
40%
45%
50%
juil-03 sept-03oct-03nov-03 janv-04mars-04avr-04mai-04juin-04
Friar
0%
5%
10%
15%
20%25%
30%
35%
40%
45%
50%
juil-03 sept-03oct-03nov-03 janv-04mars-04avr-04mai-04juin-04juil-04 sept-04oct-04nov-04 janv-05mars-05
PERCENT
ACTUAL % PATIENTS NOT NEEDING A BED PLAN % PATIENTS NOT NEEDING A BED
juil-04 sept-04oct-04nov-04 janv-05mars-05
PERCENT
ACTUAL % PATIENTS NOT NEEDING A BED PLAN % PATIENTS NOT NEEDING A BED
Bronte
0%
5%
10%
15%
20%
25%
30%
35%
40%
45%50%
juil-03 sept-03oct-03nov-03 janv-04mars-04avr-04mai-04juin-04juil-04 sept-04oct-04nov-04 janv-05mars-05
PERCENT
ACTUAL % PATIENTS NOT NEEDING A BED PLAN % PATIENTS NOT NEEDING A BED

Copyright © 2007 INSEAD 02/2007-5354 22
Appendix 5 Comparative Improvements in the Three Hospitals
% ELECTIVE PATIENTS WITH A PRE ADMISSION DISCHARGE DATE PRIORITY H
King Edgar Hospitals NHS Trust
40%
50%
60%
70%
80%
90%
100%
juil-0
3
sept-
03oc
t-03
nov-0
3
janv-0
4
mars-04
avr-0
4
mai-04
juin-0
4jui
l-04
sept-
04oc
t-04
nov-0
4
janv-0
5
mars-05
PER
CEN
T
ACTUAL % WITH DISCH.DATE PLAN % WITH DISCH.DATE
Clover
40%
50%
60%
70%
80%
90%
100%
juil-0
3
sept-
03oc
t-03
nov-0
3
janv-0
4
mars-04
avr-0
4
mai-04
juin-0
4jui
l-04
sept-
04oc
t-04
nov-0
4
janv-0
5
mars-05
PER
CEN
T
ACTUAL % WITH DISCH.DATE PLAN % WITH DISCH.DATE
Friar
40%
50%
60%
70%
80%
90%
100%
juil-0
3
sept-
03oc
t-03
nov-0
3
janv-0
4
mars-04
avr-0
4
mai-04
juin-0
4jui
l-04
sept-
04oc
t-04
nov-0
4
janv-0
5
mars-05
PER
CEN
T
ACTUAL % WITH DISCH.DATE PLAN % WITH DISCH.DATE
Bronte
40%
50%
60%
70%
80%
90%
100%
juil-0
3
sept-
03oc
t-03
nov-0
3
janv-0
4
mars-04
avr-0
4
mai-04
juin-0
4jui
l-04
sept-
04oc
t-04
nov-0
4
janv-0
5
mars-05
PER
CEN
T
% WITH DISCH.DATE % WITH DISCH.DATE
% ELECTIVE PATIENTS WITH A PRE ADMISSION DISCHARGE DATE PRIORITY H
King Edgar Hospitals NHS Trust
40%
50%
60%
70%
80%
90%
100%
juil-0
3
sept-
03oc
t-03
nov-0
3
janv-0
4
mars-04
avr-0
4
mai-04
juin-0
4jui
l-04
sept-
04oc
t-04
nov-0
4
janv-0
5
mars-05
PER
CEN
T
ACTUAL % WITH DISCH.DATE PLAN % WITH DISCH.DATE
Clover
40%
50%
60%
70%
80%
90%
100%
juil-0
3
sept-
03oc
t-03
nov-0
3
janv-0
4
mars-04
avr-0
4
mai-04
juin-0
4jui
l-04
sept-
04oc
t-04
nov-0
4
janv-0
5
mars-05
PER
CEN
T
ACTUAL % WITH DISCH.DATE PLAN % WITH DISCH.DATE
Friar
40%
50%
60%
70%
80%
90%
100%
juil-0
3
sept-
03oc
t-03
nov-0
3
janv-0
4
mars-04
avr-0
4
mai-04
juin-0
4jui
l-04
sept-
04oc
t-04
nov-0
4
janv-0
5
mars-05
PER
CEN
T
ACTUAL % WITH DISCH.DATE PLAN % WITH DISCH.DATE
Friar
40%
50%
60%
70%
80%
90%
100%
juil-0
3
sept-
03oc
t-03
nov-0
3
janv-0
4
mars-04
avr-0
4
mai-04
juin-0
4jui
l-04
sept-
04oc
t-04
nov-0
4
janv-0
5
mars-05
PER
CEN
T
ACTUAL % WITH DISCH.DATE PLAN % WITH DISCH.DATE
Bronte
40%
50%
60%
70%
80%
90%
100%
juil-0
3
sept-
03oc
t-03
nov-0
3
janv-0
4
mars-04
avr-0
4
mai-04
juin-0
4jui
l-04
sept-
04oc
t-04
nov-0
4
janv-0
5
mars-05
PER
CEN
T
% WITH DISCH.DATE % WITH DISCH.DATE
% ACUTE PATIENTS WITH INDICATIVE DISCHARGE DATE WITHIN 24 HRS PRIORITY H
64%
76%
74%
32%
King Edgar Hospitals NHS Trust
0%10%
20%30%40%50%60%70%80%
90%100%
juil-0
3
sept-
03oc
t-03
nov-0
3
janv-0
4
mars-04
avr-0
4
mai-04
juin-0
4jui
l-04
sept-
04oc
t-04
nov-0
4
janv-0
5
mars-05
PER
CEN
T
ACTUAL % ACUTE WITH DISCH.DATE PLAN % ACUTE WITH DISCH.DATE
Clover
0%10%
20%30%
40%50%
60%70%
80%90%
100%
juil-0
3
sept-
03oc
t-03
nov-0
3
janv-0
4
mars-04
avr-0
4
mai-04
juin-0
4jui
l-04
sept-
04oc
t-04
nov-0
4
janv-0
5
mars-05
PER
CEN
T
ACTUAL % ACUTE WITH DISCH.DATE PLAN % ACUTE WITH DISCH.DATE
Friar
0%
20%
40%
60%
80%
100%
120%
juil-0
3
sept-
03oc
t-03
nov-0
3
janv-0
4
mars-04
avr-0
4
mai-04
juin-0
4jui
l-04
sept-
04oc
t-04
nov-0
4
janv-0
5
mars-05
PER
CEN
T
ACTUAL % ACUTE WITH DISCH.DATE PLAN % ACUTE WITH DISCH.DATE
Bronte
0%
10%20%
30%40%
50%
60%70%80%
90%
100%
juil-0
3
sept-
03oc
t-03
nov-0
3
janv-0
4
mars-04
avr-0
4
mai-04
juin-0
4jui
l-04
sept-
04oc
t-04
nov-0
4
janv-0
5
mars-05
PER
CEN
T
ACTUAL % ACUTE WITH DISCH.DATE PLAN % ACUTE WITH DISCH.DATE
Copyright © 2007 INSEAD 02/2007-5354 23
% PATIENTS HAVING A DAILY REVIEW OF THEIR DICHARGE DATE/PLAN PRIORITY H
King Edgar Hospitals NHS Trust
0%10%20%30%40%50%60%70%80%90%
100%
avr-0
3
mai-03
juin-0
3jui
l-03
sept-
03oc
t-03
nov-0
3
janv-0
4
mars-04av
r-04
mai-04
juin-0
4jui
l-04
sept-
04oc
t-04
nov-0
4
janv-0
5
mars-05
PER
CEN
T
ACTUAL % WITH DAILY REVIEW PLAN % WITH DAILY REVIEW
Clover
0%10%20%30%40%50%60%70%80%90%
100%
avr-0
3
mai-03
juin-0
3jui
l-03
sept-
03oc
t-03
nov-0
3
janv-0
4
mars-04
avr-0
4
mai-04
juin-0
4jui
l-04
sept-
04oc
t-04
nov-0
4
janv-0
5
mars-05
PER
CEN
T
ACTUAL % WITH DAILY REVIEW PLAN % WITH DAILY REVIEW
Friar
0%10%
20%30%
40%50%60%70%80%
90%100%
avr-0
3
mai-03
juin-0
3jui
l-03
sept-
03oc
t-03
nov-0
3
janv-0
4
mars-04av
r-04
mai-04
juin-0
4jui
l-04
sept-
04oc
t-04
nov-0
4
janv-0
5
mars-05
PER
CEN
T
ACTUAL % WITH DAILY REVIEW PLAN % WITH DAILY REVIEW
Bronte
0%10%20%30%40%50%60%70%80%90%
100%
avr-0
3
mai-03
juin-0
3jui
l-03
sept-
03oc
t-03
nov-0
3
janv-0
4
mars-04av
r-04
mai-04
juin-0
4jui
l-04
sept-
04oc
t-04
nov-0
4
janv-0
5
mars-05
PER
CEN
T
PLAN % WITH DAILY REVIEW PLAN % WITH DAILY REVIEW
% PATIENTS UNDERSTANDING THEIR DISCHARGE PLAN PRIORITY H
74%
89%
70%
72%
King Edgar Hospitals NHS Trust
40%
50%
60%
70%
80%
90%
100%
juil-0
3
sept-
03oc
t-03
nov-0
3
janv-0
4
mars-04
avr-0
4
mai-04
juin-0
4jui
l-04
sept-
04oc
t-04
nov-0
4
janv-0
5
mars-05
PER
CEN
T
ACTUAL % UNDERSTANDING DISCH PLAN PLAN % UNDERSTANDING DISCH PLAN
Clover
40%
50%
60%
70%
80%
90%
100%
juil-0
3
sept-
03oc
t-03
nov-0
3
janv-0
4
mars-04
avr-0
4
mai-04
juin-0
4jui
l-04
sept-
04oc
t-04
nov-0
4
janv-0
5
mars-05
PER
CEN
T
ACTUAL % UNDERSTANDING DISCH PLAN PLAN % UNDERSTANDING DISCH PLAN
Friar
40%
50%
60%
70%
80%
90%
100%
juil-0
3
sept-
03oc
t-03
nov-0
3
janv-0
4
mars-04
avr-0
4
mai-04
juin-0
4jui
l-04
sept-
04oc
t-04
nov-0
4
janv-0
5
mars-05
PER
CEN
T
ACTUAL % UNDERSTANDING DISCH PLAN PLAN % UNDERSTANDING DISCH PLAN
Bronte
40%
50%
60%
70%
80%
90%
100%
juil-0
3
sept-
03oc
t-03
nov-0
3
janv-0
4
mars-04
avr-0
4
mai-04
juin-0
4jui
l-04
sept-
04oc
t-04
nov-0
4
janv-0
5
mars-05
PER
CEN
T
ACTUAL % UNDERSTANDING DISCH PLAN PLAN % UNDERSTANDING DISCH PLAN

Copyright © 2007 INSEAD 02/2007-5354 24
% MEDICALLY FIT PATIENTS WITH THE 'MEDICALLY FIT' DATE RECORDED PRIORITY H
215
King Edgar Hospitals NHS Trust
20%
30%
40%
50%
60%
70%
80%
90%
100%
juil-0
3
sept-
03oc
t-03
nov-0
3
janv-0
4
mars-04
avr-0
4
mai-04
juin-0
4jui
l-04
sept-
04oc
t-04
nov-0
4
janv-0
5
mars-05
PER
CEN
T
ACTUAL % PATIENTS WITH FIT DATE RCD PLAN % PATIENTS WITH FIT DATE RCD
Clover
20%
30%
40%
50%
60%
70%
80%
90%
100%
juil-0
3
sept-
03oc
t-03
nov-0
3
janv-0
4
mars-04
avr-0
4
mai-04
juin-0
4jui
l-04
sept-
04oc
t-04
nov-0
4
janv-0
5
mars-05
PER
CEN
T
ACTUAL % PATIENTS WITH FIT DATE RCD PLAN % PATIENTS WITH FIT DATE RCD
Friar
20%
30%
40%
50%
60%
70%
80%
90%
100%
juil-0
3
sept-
03oc
t-03
nov-0
3
janv-0
4
mars-04
avr-0
4
mai-04
juin-0
4jui
l-04
sept-
04oc
t-04
nov-0
4
janv-0
5
mars-05
PER
CEN
T
ACTUAL % PATIENTS WITH FIT DATE RCD PLAN % PATIENTS WITH FIT DATE RCD
Bronte
20%
30%
40%
50%
60%
70%
80%
90%
100%
juil-0
3
sept-
03oc
t-03
nov-0
3
janv-0
4
mars-04
avr-0
4
mai-04
juin-0
4jui
l-04
sept-
04oc
t-04
nov-0
4
janv-0
5
mars-05
PER
CEN
T
ACTUAL % PATIENTS WITH FIT DATE RCD PLAN % PATIENTS WITH FIT DATE RCD
i Anon. (2002) “Waiting list targets criticised”, Health Newswire Consumer, September 18. ii Revill, J. (2003) “Hospitals faking cuts in casualty wait times”, The Observer, May 11: p. 1. iii Ibid. iv Anon. (2002) “Blocked thinking”, Yorkshire Post, February 21: p. 3. v Waugh, R. (2004) “Health trust fails to shine in ratings”, Yorkshire Post, July 21: p. 1. vi Batty, D. (2003) “Q&A: NHS star ratings”, SocietyGuardian.co.uk, July 16. vii Anon. (1998) “Bevan’s baby hits middle age”, The Economist, July 4: p. 55. viii Ham, C. (1998) “NHS 1948-1998”, The Guardian, July 1: 10. ix Brown, C. (1997) “More than one million waiting for NHS hospital treatment”, The Independent, February
20: p. 2. x Laurance, J. (2003) “The Blair Years: Health”, The Independent, July 30: p. 4.

To order INSEAD case studies please contact one of the three distributors below:
ecch, UK and USA Centrale des Cas et de Médias Pédagogiques
ecch UK Registered Office: ecch USA Registered Office: www.ecch.com www.ecch.com www.ccip.fr/ccmp/ Tel: +44 (0)1234 750903 Tel: +1 781 239 5884 Tel: 33 (0) 1.49.23.57.25 Fax: +44 (0)1234 751125 Fax: +1 781 239 5885 Fax: 33 (0) 1.49.23.57.41 E-mail: [email protected] E-mail: [email protected] E-mail: [email protected]
Boulevard de Constance, 77305 Fontainebleau Cedex, France. 1 Ayer Rajah Avenue, Singapore 138676 Tel: 33 (0)1 60 72 40 00 Fax: 33 (0)1 60 74 55 00/01 www.insead.edu Tel: 65 6799 5388 Fax: 65 6799 5399 Printed by INSEAD