Embed Size (px)
Citation preview
www.teekay.com
Leading From Strength
Marine Money Conference June 18, 2003
Leading From StrengthLeading From Strength
Marine Money Conference Marine Money Conference June 18, 2003June 18, 2003
NYSE: TK

Teekay Shipping Corporation 2
Forward Looking StatementsForward Looking Statements
This document contains forward-looking statements (as defined in Section 21E of the Securities Exchange Act of 1934, as amended) which reflect management’s current views with respect to certain future events and performance, including statements regarding tanker charter rates, seasonal variations in the tanker market, and the balance of supply and demand in the crude tanker market. The following factors are among those that could cause actual results to differ materially from the forward-looking statements, which involve risks and uncertainties, and that should be considered in evaluating any such statement: changes in production of or demand for oil and petroleum products, either generally or in particular regions; greater or less than anticipated levels of tanker newbuilding orders or greater or less than anticipated rates of tanker scrapping; changes in trading patterns significantly impacting overall tanker tonnage requirements; and changes in the typical seasonal variations in tanker charter rates, and changes in the offshore production of oil.

Teekay Shipping Corporation 3
§ The world’s leading marine oil transportation franchise, founded in 1973
§ Global organization with 4,200 employees in 15 offices and onboard 150 vessels
§ Leading industry consolidator; more than tripled in size since 1998
§ Growing cash generating power – approximately $10 mid-cycle CEPS equating to $4.50 EPS, upon the delivery of new vessels on order
Teekay Shipping CorporationTeekay Shipping Corporation

Teekay Shipping Corporation 4
The Transformation of TeekayThe Transformation of Teekay
Regional Leader in
Mid-size Tankers
World Leader in
Marine Oil Transportation
1998 2003
n 150 ships carrying over 10% of the world’s sea borne oil trade
n 45 ships

5
$10,000
$15,000
$20,000
$25,000
$30,000
$35,000
$40,000
$45,000
1998 1999 2000 2001 2002 2003
Rea
lized
Afr
amax
TC
E
Acquired UNS L/T Contracts
Raised Flexible Financing
Reduced Debt
Bought Back SharesOrdered
Newbuildings
AcquiredBona
Actively Managing the CycleActively Managing the Cycle
Ordered Newbuildings
AcquiredNavion
ConocoPhillips L/T Contracts
Issued Convertible Pref. Shares

Teekay Shipping Corporation 6
Acquisition of Acquisition of NavionNavion
Key Highlights:§ Acquired Navion ASA for $800 million
Offshore Loading§ Adds significant earnings stability of approximately
$1.00 EPS annually
Conventional Tankers§ Increased operating leverage by $0.13 per share§ Broadened conventional tanker service offering§ Right of first refusal on Statoil’s conventional cargos

Teekay Shipping Corporation 7
2004:Spot Rate Increase $1,000 TCE/day
EPS Increase$0.70/year
Growing Earnings PowerGrowing Earnings Power
-
1.00
2.00
3.00
4.00
5.00
6.00
7.00
8.00
9.00
10.00
11.00
12.00
$10,000 $12,000 $14,000 $16,000 $18,000 $20,000 $22,000 $24,000 $26,000 $28,000 $30,000
Aframax Rates ($ per day)
Ear
nin
gs
Per
Sh
are
($)
FY1999 FY 2002 9 Months 2003 Proforma 2004
Increasing earnings power
Declining net income break-even TCE rate
Growing operating leverage

Teekay Shipping Corporation 8
Unique Blend of Base ProfitabilityUnique Blend of Base Profitabilityand Operating Leverageand Operating Leverage
Teekay has two complementary businesses:
1. Growing Profitable Long-term Fixed-rate Contract Business
• Shuttle Tankers• ConocoPhillips• Australia
2. Leading Spot Tanker Franchise

Teekay Shipping Corporation 9
The World Leader in The World Leader in Offshore LoadingOffshore Loading
§ Approximately half of Teekay’s capital is now invested in “floating pipelines”
§ Navion - the leading offshore loading logistics provider
§ UNS - the leading shuttle tanker owning entity
§ Significant long-term stable cash flow
§ High profitability

Teekay Shipping Corporation 10
Predictable & Stable EarningsPredictable & Stable Earnings
EBITDA from Fixed-rate Long-term Contracts
0
2040
60
80100
120
140160
180
200
220
240
260
280
300
1998 1999 2000 2001 2002 2003 2004
($) m
illio
ns
Offshore Loading ConocoPhillips Australia
n Average contract length approximately 7 years
n Levered IRR > 20%

Teekay Shipping Corporation 11
Unique Blend of Base ProfitabilityUnique Blend of Base Profitabilityand Operating Leverageand Operating Leverage
Teekay has two complementary businesses:
1. Growing Profitable Long-term Contract Business
2. Leading Spot Tanker Franchise
• Aframax• Navion Shipping

Teekay Shipping Corporation 12
Superior Cash Flow Generation Superior Cash Flow Generation from Spot Businessfrom Spot Business
0
100
200
300
400
500
600
700
800
Low-cycle ($13,000/day)
Mid-cycle ($18,000/day)
High-cycle ($27,500/day)
($) m
illio
ns
Fixed-Rate EBITDA Spot-based EBITDA
Spot Rate Increase$1,000 TCE/day
EBITDA Increase$30 million annually and EPS increase by $0.70
* Proforma 2004 EBITDA
Proforma 2004 EPS $1.00 $4.50 $11.15
Spot –based EBITDA
Fixed-rate EBITDA
Teekay Shipping Corporation 13
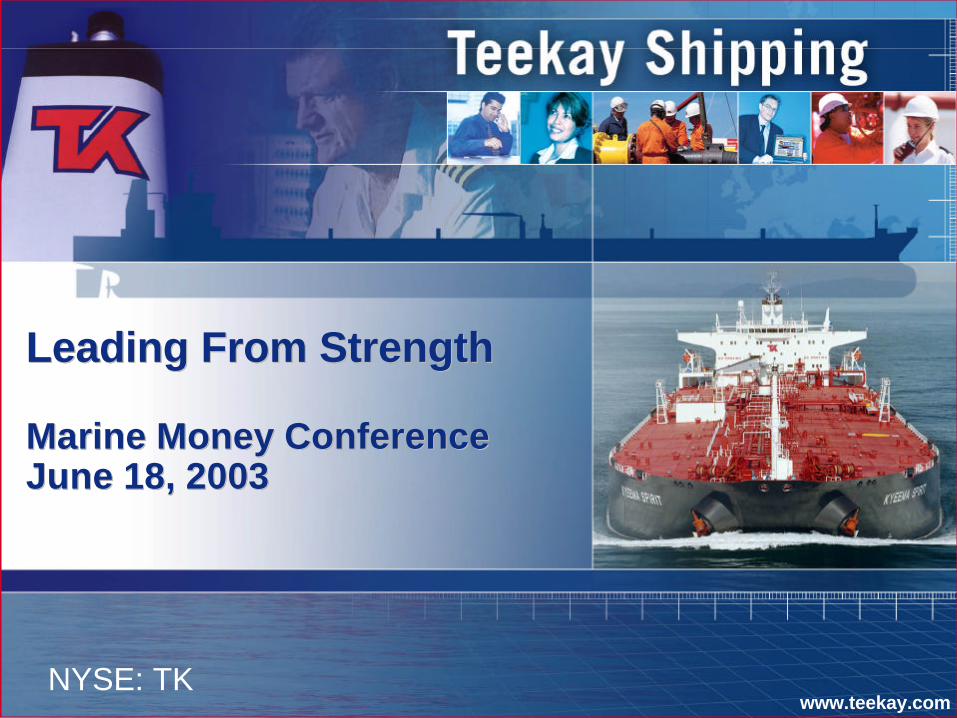
Teekay is an Integrated Logistics Teekay is an Integrated Logistics ProviderProvider
Owned Ships
Time Chartered-in
Ships
Managed Ships
Long-term Fixed-rate time charter
COA
Spot Charter
Offshore Loading
Conventional Tankers
Traditional Ship Owners
TEEKAY
Logistics / Outsourcing
Tailored mix of fixed-rate and market related
pricing
Floating Storage
and Offtake

Teekay Shipping Corporation 14
PrePre--eminent Market Positioneminent Market Position
§ Largest Spot Operator of Medium-Sized Tankers§ 69 owned vessels*
§ 35 chartered-in vessels*
§ 7 commercially managed vessels
§ Uniform, Interchangeable Fleet
§ Unique Global Organization
§ Portfolio of strategic contracts with blue chip customer base
High Capacity Utilization + Scale = Sustainable Competitive Advantage
*Includes newbuild vessels on order

Teekay Shipping Corporation 15
§ Financial flexibility
§ Total liquidity of $690 million at March 31, 2003
§ Highest credit rating in industry (S&P: BB+, Moody’s: Ba1)
§ Strong cash flow throughout the cycle
§ Largest equity market capitalization in the industry
§ Ability to raise capital and invest throughout the cycle
Financial Strength is Financial Strength is a Competitive Advantagea Competitive Advantage

Teekay Shipping Corporation 16
Profitable Throughout the CycleProfitable Throughout the Cycle
Proforma based on current fleet plus delivery of newbuilds plus Navion. Note: See appendix for explanation and reconciliation of EBITDA
Net Income
-$50
$50
$150
$250
$350
$450
$550
Low Market ($13,000/day) Average Market ($19,000/day) High Market ($27,500/day)
Net
Inco
me
($m
illio
ns)
Historical
Proforma 2004
Earnings Per Share
-$1.00
$1.00
$3.00
$5.00
$7.00
$9.00
$11.00
$13.00
Low Market ($13,000/day) Average Market ($19,000/day) High Market ($27,500/day)
Historical
Proforma 2004
EBITDA
$0
$100
$200
$300
$400
$500
$600
$700
$800
Low Market ($13,000/day) Average Market ($19,000/day) High Market ($27,500/day)
($m
illi
on
s)
Historical
Proforma 2004

Teekay Shipping Corporation 17
§ Regulations summarized:§ the accelerated phase out of single-hull tankers between now and 2010;
§ Category 1 vessels trading life is reduced from 30 year to 23 years;
§ the requirement for heavy oils to be transported on double-hull tankers only; and
§ the imposition of a rigorous inspection regime for single-hull tankers older than 15 years.
§ Impact on the tanker market:
§ the overall impact is expected to be positive for the shipping industry.
§ approximately 13 percent of the world tanker fleet will immediately be excluded from the European market upon implementation of the regulations
§ expected to lead to stratification of the tanker market, and consequently a tighter regional demand-supply balance
§ the accelerated phase out of the oldest tonnage in the world fleet will lead to greater demand for modern tonnage and tighter tanker supply
Recent EU RegulationsRecent EU Regulations
Magnified if adopted globally by the IMO

Teekay Shipping Corporation 18
§ Younger fleet; an average age of 9 years compared to 12 years for the world tanker fleet.
§ 15 single hull vessels with an average age of 13 years, able to trade to the latest possible date, 2010.
§ Fleet renewal program has 15 newbuildingsscheduled for delivery over 2003-2005.
§ Teekay’s double-bottom and double-sided ships will be able to trade beyond 2010
§ Over two-thirds (104 vessels) of Teekay’s fleet will be double hull by 2005
Teekay Will BenefitTeekay Will Benefit

Teekay Shipping Corporation 19
InvestmentInvestment HighlightsHighlights§ The largest tanker company measured by market
capitalization, enterprise value, and fleet size
§ An integrated logistics provider, not just an owner
§ Profitable throughout the cycle; large base of long-term fixed-rate business coupled with significant spot market upside
§ Well positioned to benefit from favorable industry dynamics
§ Financial strength to pursue continued profitable growth

Teekay Shipping Corporation 20
§ EBITDA represents net income (loss) before interest expense, income tax expense, depreciation and amortization expense, minority interest, foreign exchange gains (losses) and gains (losses) on disposition of assets. EBITDA is included because such data is used by certain investors to measure a company's financial performance. EBITDA is not required by accounting principles generally accepted in the United States and should not be considered as an alternative to net income or any other indicator of the Company's performance required by accounting principles generally accepted in the United States.
§ The following table reconciles the Company's Income from vessel operations with EBITDA for the periods presented on slide 10:
Appendix Appendix –– EBITDA ReconciliationEBITDA Reconciliation
Reconciliation of EBITDA from fixed-rate long-term contracts ($000s)
Year Ended December 31, 2000
Year Ended December 31, 2001
Year Ended December 31, 2002
ActualIncome from vessel operations 16,622 49,615 56,863 Depreciation and Amortization 7,020 37,024 43,889 EBITDA 23,642 86,639 100,752
Year Ended December 31, 2003
Year Ended December 31, 2004
ProformaIncome from vessel operations 170,000 170,000 Depreciation and Amortization 70,000 90,000 EBITDA 240,000 260,000

Teekay Shipping Corporation 21
§ EBITDA represents net income (loss) before interest expense, income tax expense, depreciation and amortization expense, minority interest, foreign exchange gains (losses) and gains (losses) on disposition of assets. EBITDA is included because such data is used by certain investors to measure a company's financial performance. EBITDA is not required by accounting principles generally accepted in the United States and should not be considered as an alternative to net income or any other indicator of the Company's performance required by accounting principles generally accepted in the United States.
§ The following table reconciles the Company's net income (loss) with EBITDA for the periods presented on slide 16:
Appendix Appendix –– EBITDA ReconciliationEBITDA Reconciliation
Reconiliation of EBITDAYear Ended March 31,
1998Nine Months Ended December 31, 1999
Year Ended December 31, 2001
ActualNet income (loss) 70,504 (19,595) 336,518 Interest expense 56,269 44,996 66,249 Income tax expense 1,500 6,963 Depreciation and Amortization 94,941 68,299 136,283 Other (12,132) 675 (6,689) EBITDA 209,582 95,875 539,324
ProformaNet income 209,790 39,690 450,765 Interest expense 93,000 93,000 93,000 Income tax expense 12,200 12,200 12,200 Depreciation and Amortization 200,000 200,000 200,000 EBITDA 514,990 344,890 755,965
www.teekay.comNYSE: TK