Embed Size (px)
Citation preview

Catalogue no. 84-215-X ISSN 1913-7826
Leading causes of death in CanadaMarch 2009

Standard table symbolsThe following symbols are used in Statistics Canada publications:
. not available for any reference period
.. not available for a specific reference period
... not applicable 0 true zero or a value rounded to zero 0s value rounded to 0 (zero) where there is a meaningful distinction between true zero and the value that was rounded p preliminary r revised x suppressed to meet the confidentiality requirements of the Statistics Act E use with caution F too unreliable to be published * significantly different from reference category (p < 0.05)
How to obtain more informationFor information about this product or the wide range of services and data available from Statistics Canada, visit our website, www.statcan.gc.ca. You can also contact us by email at [email protected] telephone, from Monday to Friday, 8:30 a.m. to 4:30 p.m., at the following numbers:
• Statistical Information Service 1-800-263-1136 • National telecommunications device for the hearing impaired 1-800-363-7629 • Fax line 1-514-283-9350
Depository Services Program
• Inquiries line 1-800-635-7943 • Fax line 1-800-565-7757
Note of appreciationCanada owes the success of its statistical system to a long-standing partnership between Statistics Canada, the citizens of Canada, its businesses, governments and other institutions. Accurate and timely statistical information could not be produced without their continued co-operation and goodwill.
Standards of service to the publicStatistics Canada is committed to serving its clients in a prompt, reliable and courteous manner. To this end, Statistics Canada has developed standards of service that its employees observe. To obtain a copy of these service standards, please contact Statistics Canada toll-free at 1-800-263-1136. The service standards are also published on www.statcan.gc.ca under “Contact us” > “Standards of service to the public.”
Published by authority of the Minister responsible for Statistics Canada
© Minister of Industry, 2009
All rights reserved. Use of this publication is governed by the Statistics Canada Open Licence Agreement.
An HTML version is also available.
Cette publication est aussi disponible en français.

Leading causes of death in Canada, 2005
Archived Content
Information identified as archived is provided for reference, research or recordkeeping purposes. It is not subject to the Government of CanadaWeb Standards and has not been altered or updated since it was archived. Please "contact us" to request a format other than those available.
This publication lists statistical tables of ten leading causes of death in Canada for selected age groups by sex; tenleading causes of infant death; andten leading causes of death for provinces and territories by sex. Causes of deathclassified by the International Classification of Diseases, Tenth Revision (ICD-10) are ranked according to the number ofdeaths assigned to rankable causes.
Statistics Canada, Catalogue no. 84-215-X 3

Introduction
Ranking causes of death is an informative way to present mortality statistics, supplementing other measures of mortality such as death rates andlife table. Statistical tables in this publication were prepared to serve as a reference tool for health professionals and anyone requiring informationon current mortality patterns in Canada.
The present publication replaces the Leading Causes of Death at Different Ages, Canada, catalogue no. 84F0503XPB.
Previous leading causes of death publications of Statistics Canada were based on earlier versions of International Statistical Classification ofDiseases (ICD). For this publication, causes of death are coded to the 10th revision of the World Health Organization’s International StatisticalClassification of Diseases and Related Health Problems (ICD–10)1.
There are three series of data tables in this publication. First series of tables presents the ten leading causes of death in Canada for 10 age groups(all ages, 1 to 14, and ten–year age groups from 15 to 24 to 85 and over) by sex and for the most recent five years. The reference year for theranking is the most recent year. Further information is available for leading causes of death ranked by five–year age groups in CANSIM table 102–0561.
Second series of tables presents the ten leading causes of infant death (less than one year old) in Canada by sex for the most recent five years.The reference year for the ranking is the most recent year. Further information is available for more leading causes of infant death in CANSIM table102–0562.
The third series of tables presents the ten leading causes of death for Canada and each province or territory by sex, for 2005. The ‘Canada’ leveldata is the reference for the ranking of these ten leading causes of death. Further information is available for an expanded list of leading causes ofdeath by province and territory in CANSIM table 102–0563.
From the approximately 8,000 ICD–10 codes valid for underlying causes of death, aggregated groups of causes of death called “short lists” weredeveloped for use in the summary list of causes of death and to rank the leading causes of death. The short lists of ICD-10 used to rank theleading causes of death and the methodology used to select the rankable causes were developed by the National Center for Health Statistics(NCHS) of the U.S Department of Health and Human Services2.
The number of deaths is used as the ranking criteria because it most accurately reflects the frequency of cause-specific mortality. The 50 rankablecauses of death, as shown in Appendix 1, were selected from the short list of 113 selected causes of death developed by NCHS for use with ICD–10. Causes of death are ranked according to the number of deaths assigned to each of the 50 rankable causes shown in the Appendix 1.
The 71 rankable causes of infant death, as shown in Appendix 2, were selected from the short list of 130 selected causes of infant death developedby NCHS for use with ICD–10. Causes of infant death are ranked according to the number of deaths assigned to each of the 71 rankable causespresented in the Appendix 2.
The ranking of leading causes has limitations; it describes the rank order, by number of deaths, of each cause of death from a selected list ofcauses. The ranking alone cannot measure the relative risk of death. Further, any comparisons of leading causes by region or by year do not takeinto account the differences in the population age structure.
Footnotes
1. World Health Organization (WHO). International Statistical Classification of Diseases and Related Health Problems, Tenth Revision,Volumes 1 and 2 (ICD–10). Geneva, 1992.
2. Heron, M. Deaths: Leading Causes of Death for 2004. National Vital Statistics Reports (National Center for Health Statistics) 2007; 56 (5).
Statistics Canada, Catalogue no. 84-215-X 4

Highlights
The methodology used in this publication to select the leading causes of death was developed by the National Center for Health Statistics (NCHS)of the U.S Department of Health and Human Service .
Overview
In 2005, the 10 leading causes of death in Canada were the same as the previous year, accounting for 78% of all deaths, a decrease ofabout one percentage point from 2004. Cancer, heart disease and stroke, the three leading causes of death, were responsible for 58% of alldeaths in Canada. From 2004 to 2005, the relative burden of deaths due to unintentional injuries had the largest increase (6%), followed by Chronic lowerrespiratory diseases (5%) and Alzheimer’s disease (4%). In contrast, the relative burden of stroke had the sharpest decline (-4%). From 2001 to 2005, the number of deaths increased as Canadian population aged, but mortality rates decreased. The age–standardizedmortality rates dropped sharply for stroke (20%), followed by heart disease (15%) and cancer (5%) in the same period.
Sex differences
The proportional representation of the 10 leading causes of death was higher for males compared to females. In 2005, the relative burden ofthe 10 leading causes of male deaths was 80% compared to 77% of female deaths. From 2004 to 2005, the ranking of the three leading causes of death—cancer, heart disease, and stroke—remained unchanged for females.However, unintentional injuries placed third as leading cause of male deaths in 2005, mainly due to the increase in the number deaths (7%)combined with a decrease of deaths due to stroke (-3%). In 2005, hypertension emerged as a 10 leading cause of death for females. Between 2001 and 2005, female deaths due to hypertensionincreased in importance by climbing from the 17 leading cause of female deaths to the 10 . In 2005, the largest difference in the ranking between the sexes was for hypertension (19 for males and 10 for females), Alzheimer’sdisease (10 for males and 5 for females), suicide (7 for males and 12 for females) and unintentional injuries (3 for males and 7 forfemales). From 2004 and 2005, among the 10 leading causes of deaths, the largest relative increase for males was for unintentional injuries followedby Alzheimer’s disease, suicide and Chronic lower respiratory diseases, whereas for females it was hypertension, Chronic lower respiratorydiseases and Influenza and pneumonia.
Age patterns
The proportional representation of the 10 leading causes of death in 2005 varied among age groups. The heaviest relative burden was forthose aged 55 to 64 and 15 to 24 with 85% of all deaths. Deaths due to the 10 leading causes were the least concentrated for the youngestand the oldest, those aged 1 to 14 (70%) followed by 85 and over (76%). In 2005, the ranking of the first and second leading causes of death remained the same as in 2004 across age groups. For those aged 1 to 44 years, unintentional injuries or suicide or both were the two leading causes of death in 2005, they were responsiblefor 42% of deaths. For those aged 45 and over, cancer and heart disease were the two leading causes of death, their relative burden was 54% in 2005. For those aged 55 to 64, unintentional injuries ranked as the third leading cause of death in 2005, displacing diabetes to the fourth rank.
1
2
thth th
th thth th th th rd th
Statistics Canada, Catalogue no. 84-215-X 5
For those aged 85 and older, Chronic lower respiratory diseases emerged from the sixth in 2004 to the fourth rank in 2005, displacingAlzheimer’s disease and Influenza and pneumonia. For those aged 25 to 34, HIV emerged from seventh in 2004 to the sixth leading cause of death in 2005 displacing congenital anomalies.Cerebrovascular diseases also emerged from ninth to seventh rank, displacing congenital anomalies and diabetes. For those aged 35 to 44, liver disease ranked 6 in 2005 outranked Cerebrovascular diseases to the 7 rank while Influenza and pneumoniaranked 10 displacing congenital anomalies.
Geographic differences
The relative burden of the 10 leading causes of death in 2005 varied among the provinces and territories. The heaviest relative burden wasfor Nunavut with 90% of all deaths followed by Yukon (85%). The Atlantic provinces (Newfoundland and Labrador, Prince Edward Island,Nova Scotia and New Brunswick), Quebec and Ontario had a relative burden higher than the national level of 78%. For the Westernprovinces (Manitoba, Saskatchewan, Alberta and British Columbia) and Northwest Territories the relative burden was lower than the nationallevel. Cancer was still the leading causes of death for all provinces and territories in 2005, except for Prince Edward Island, where it rankedsecond. With the exception of Prince Edward Island, heart disease was the second leading causes of death for all provinces and Yukon in 2005. In the Northwest Territories, unintentional injuries emerged from the fourth rank in 2004 to the second in 2005 displacing heart disease andsuicide. Compared to 2004, suicide was still the second leading cause of death for Nunavut. In 2005, unintentional injuries emerged in higher ranks in three provinces and one territory, but dropped in ranks in Prince Edward Islandand Nunavut. Chronic Lower respiratory diseases also moved up in rank in Prince Edward Island, New Brunswick and in the three territories in 2005.
Footnotes
1.Heron, M. Deaths: Leading Causes of Death for 2004. National Vital Statistics Reports (National Center for Health Statistics) 2007; 56 (5).
2. Age–standardized mortality rate eliminates the effect of changes in population structure over time, thus the comparison of these mortality rateswill reflect the actual changes in mortality.
th thth
Statistics Canada, Catalogue no. 84-215-X 6

Table 1 Ten leading Causes of death, Canada, 2004 and 2005
Cause of death2005 2004 2004–2005
Rank Number % Rank Number % % change
Total, All causes of death ... 230,132 100.0 ... 226,584 100.0 1.6
10 leading causes of death ... 179,866 78.2 ... 178,842 78.9 0.6
Malignant neoplasms (cancer) 1 67,343 29.3 1 66,947 29.5 0.6
Diseases of heart (heart disease) 2 51,574 22.4 2 52,000 22.9 -0.8
Cerebrovascular diseases (stroke) 3 14,054 6.1 3 14,626 6.5 -3.9
Chronic lower respiratory diseases 4 10,515 4.6 4 10,041 4.4 4.7
Accidents (unintentional injuries) 5 9,506 4.1 5 8,986 4.0 5.8
Diabetes mellitus (diabetes) 6 7,881 3.4 6 7,823 3.5 0.7
Influenza and pneumonia 7 5,845 2.5 7 5,729 2.5 2.0
Alzheimer's disease 8 5,762 2.5 8 5,536 2.4 4.1
Intentional self-harm (suicide) 9 3,743 1.6 9 3,613 1.6 3.6
Nephritis, nephrotic syndrome and nephrosis (kidney disease) 10 3,643 1.6 10 3,541 1.6 2.9
Note: The order of the causes of death in this table is based on the ranking of the 10 leading causes in 2005. Source: Statistics Canada. CANSIM Table 102-0561.
Statistics Canada, Catalogue no. 84-215-X 7

Table 2 Ten leading causes of death, males, Canada, 2004 and 2005
Cause of death2005 2004 2004–2005
Rank Number % Rank Number % % change
Total, All causes of death ... 116,006 100.0 ... 114,513 100.0 1.3
10 leading causes of death ... 92,202 79.5 ... 91,654 80.0 0.6
Malignant neoplasms (cancer) 1 35,481 30.6 1 35,156 30.7 0.9
Diseases of heart (heart disease) 2 26,675 23.0 2 27,076 23.6 -1.5
Accidents (unintentional injuries) 3 5,807 5.0 4 5,416 4.7 7.2
Cerebrovascular diseases (stroke) 4 5,767 5.0 3 5,959 5.2 -3.2
Chronic lower respiratory diseases 5 5,563 4.8 5 5,324 4.6 4.5
Diabetes mellitus (diabetes) 6 3,981 3.4 6 4,020 3.5 -1.0
Intentional self-harm (suicide) 7 2,857 2.5 7 2,734 2.4 4.5
Influenza and pneumonia 8 2,521 2.2 8 2,557 2.2 -1.4
Nephritis, nephrotic syndrome and nephrosis (kidney disease) 9 1,859 1.6 9 1,816 1.6 2.4
Alzheimer's disease 10 1,691 1.5 10 1,596 1.4 6.0
Note: The order of the causes of death in this table is based on the ranking of the 10 leading causes in 2005. Source: Statistics Canada. CANSIM Table 102-0561.
Statistics Canada, Catalogue no. 84-215-X 8

Table 3 Ten leading causes of death, females, Canada, 2004 and 2005
Cause of death2005 2004 2004–2005
Rank Number % Rank Number % % change
Total, All causes of death ... 114,126 100.0 ... 112,071 100.0 1.8
10 leading causes of death ... 87,708 76.9 ... 87,188 77.8 0.6
Malignant neoplasms (cancer) 1 31,862 27.9 1 31,791 28.4 0.2
Diseases of heart (heart disease) 2 24,899 21.8 2 24,924 22.2 -0.1
Cerebrovascular diseases (stroke) 3 8,287 7.3 3 8,667 7.7 -4.4
Chronic lower respiratory diseases 4 4,952 4.3 4 4,717 4.2 5.0
Alzheimer's disease 5 4,071 3.6 5 3,940 3.5 3.3
Diabetes mellitus (diabetes) 6 3,900 3.4 6 3,803 3.4 2.6
Accidents (unintentional injuries) 7 3,699 3.2 7 3,570 3.2 3.6
Influenza and pneumonia 8 3,324 2.9 8 3,172 2.8 4.8
Nephritis, nephrotic syndrome and nephrosis (kidney disease) 9 1,784 1.6 9 1,725 1.5 3.4
Essential (primary) hypertension and hypertensive renal disease (hypertension) 10 930 0.8 12 866 0.8 7.4
Note: The order of the causes of death in this table is based on the ranking of the 10 leading causes in 2005. Source: Statistics Canada. CANSIM Table 102-0561.
Statistics Canada, Catalogue no. 84-215-X 9

Table 4 Ranking and number of deaths for the 10 leading causes by age group, Canada,2005
Rank All ages 1 to 14 15 to 24 25 to 34 35 to 44 45 to 54 55 to 64 65 to74 75 to 84 85 and over
1 Cancer 67,343
Unintentionalinjuries 233
Unintentionalinjuries 1,015
Unintentionalinjuries 827
Cancer 1,490
Cancer 5,418
Cancer 11,440
Cancer 17,373
Cancer 20,973
Heartdisease 19,616
2Heartdisease 51,574
Cancer 116
Suicide 509
Suicide 511
Unintentionalinjuries 971
Heartdisease 2,154
Heartdisease 4,491
Heartdisease 7,914
Heartdisease 16,479
Cancer 10,026
3Cerebro- vascular 14,054
Congenitalabnormalities 68
Cancer 156
Cancer 346
Suicide 876
Unintentionalinjuries 1,117
Unintentionalinjuries 821
Chroniclowerrespiratory 1,973
Cerebro- vascular 4,850
Cerebro- vascular 6,018
4
Chroniclowerrespiratory 10,515
Suicide 44
Homicide 136
Heart disease173
Heartdisease 639
Suicide 883
Diabetesmellitus 816
Cerebro- vascular 1,811
Chroniclowerrespiratory 4,314
Chroniclowerrespiratory 3,405
5Unintentionalinjuries 9,506
Heart disease31
Heart disease67
Homicide 142
HIV 181
Liver disease440
Cerebro- vascular 781
Diabetesmellitus 1,539
Diabetesmellitus 2,800
Alzheimer'sdisease 3,360
6Diabetesmellitus 7,881
Homicide 22
Congenitalabnormalities 34
HIV 51
Liver disease148
Cerebro-vascular 388
Chroniclowerrespiratory 628
Unintentionalinjuries 815
Alzheimer'sdisease 1,992
InfluenzaandPneumonia 3,106
7
InfluenzaandPneumonia 5,845
Influenza andPneumonia 17
Diabetesmellitus 18
Cerebro- vascular 39
Cerebro- vascular 143
Diabetesmellitus 363
Liver disease603
Liver disease610
InfluenzaandPneumonia 1,688
Diabetesmellitus 2,187
8Alzheimer'sdisease 5,762
Cerebro- vascular 10
Influenza andPneumonia 13
Congenitalabnormalities 32
Diabetesmellitus 127
HIV 146
Suicide 460
InfluenzaandPneumonia 526
Unintentionalinjuries 1,601
Unintentionalinjuries 2,076
9 Suicide 3,743
Benignneoplasms 7
Cerebro- vascular 11
Diabetesmellitus 30
Homicide 103
ViralHepatitis 144
InfluenzaandPneumonia 266
Nephritis 492
Nephritis 1,312
Nephritis 1,551
10 Nephritis 3,643
Conditionsfromperinatalperiod 6
Chronic lowerrespiratory 8
Influenza andPneumonia 16 Influenza
andPneumonia 72
InfluenzaandPneumonia 132 Nephritis
172
Aorticaneurysm 406
Parkinson'sdisease 888
Hypertention735
Liverdisease 16
Chroniclowerrespiratory 132
1. Include deaths of infants less than one year old. 2. Indicates a tie in the number of deaths. The next rank is incremented by an equivalent number of equal ranks. Source : StatisticsCanada. CANSIM Table 102-0561.
1
22
22
Statistics Canada, Catalogue no. 84-215-X 10
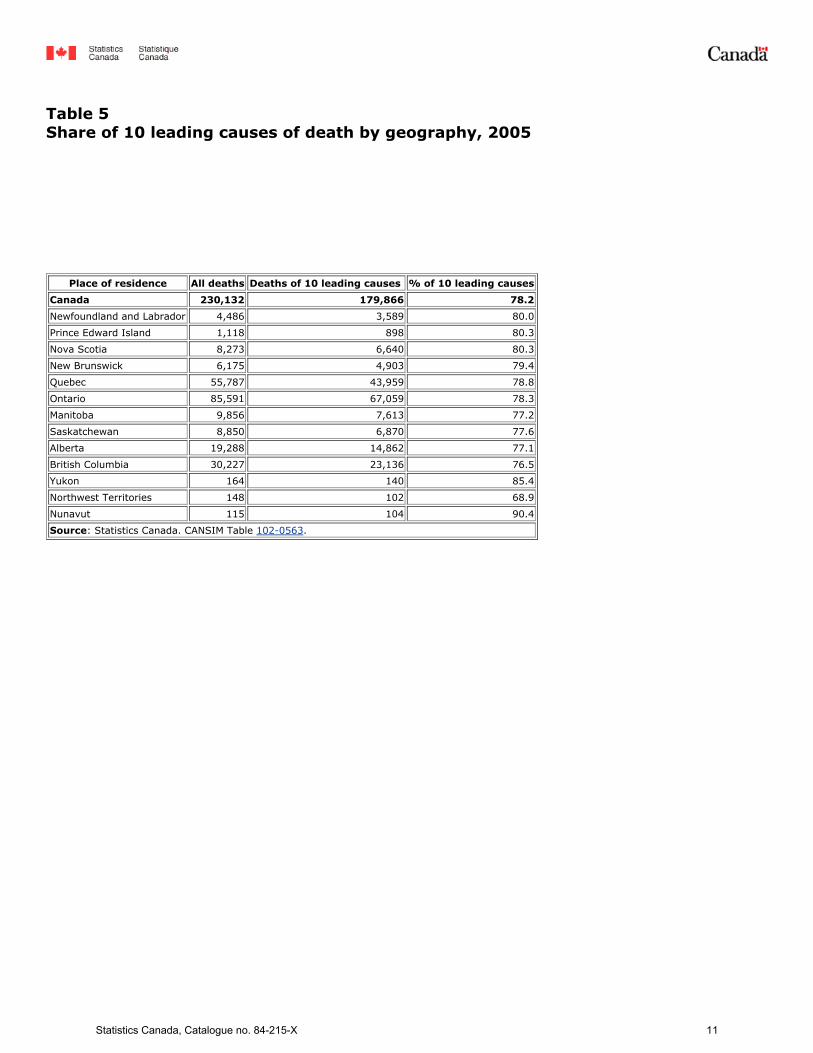
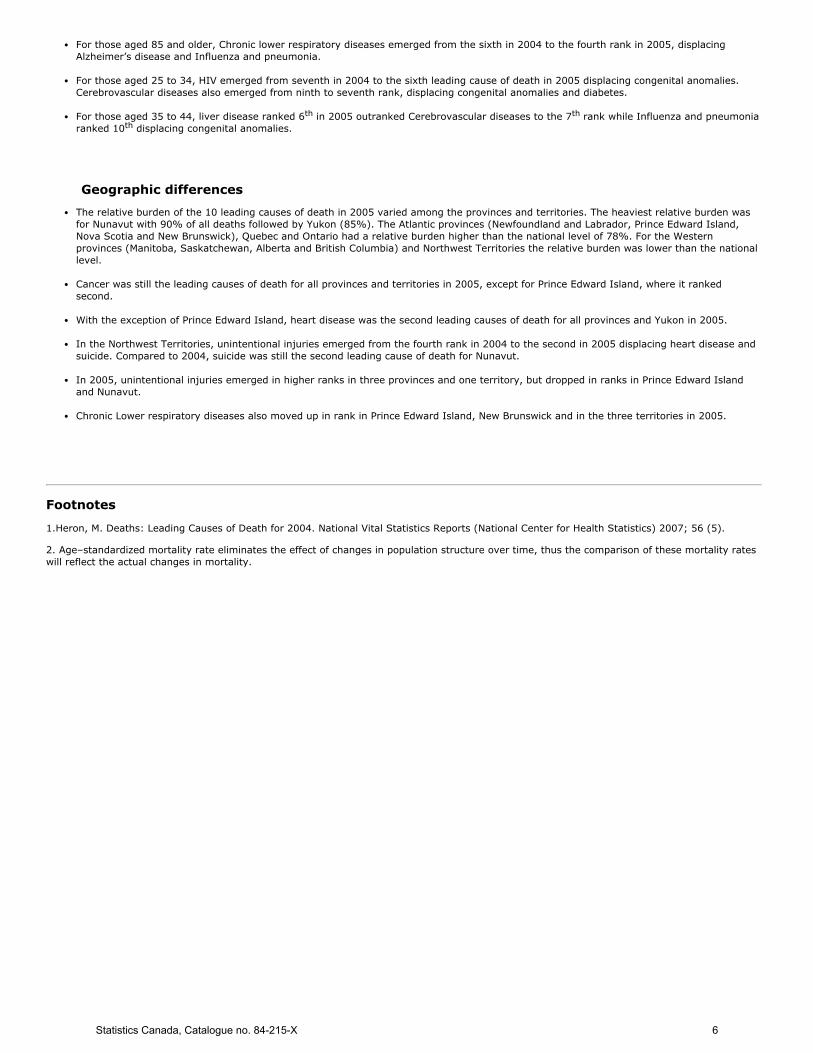
Table 5 Share of 10 leading causes of death by geography, 2005
Place of residence All deaths Deaths of 10 leading causes % of 10 leading causes
Canada 230,132 179,866 78.2
Newfoundland and Labrador 4,486 3,589 80.0
Prince Edward Island 1,118 898 80.3
Nova Scotia 8,273 6,640 80.3
New Brunswick 6,175 4,903 79.4
Quebec 55,787 43,959 78.8
Ontario 85,591 67,059 78.3
Manitoba 9,856 7,613 77.2
Saskatchewan 8,850 6,870 77.6
Alberta 19,288 14,862 77.1
British Columbia 30,227 23,136 76.5
Yukon 164 140 85.4
Northwest Territories 148 102 68.9
Nunavut 115 104 90.4
Source: Statistics Canada. CANSIM Table 102-0563.
Statistics Canada, Catalogue no. 84-215-X 11

Appendix 1 List of 113 selected causes of death1,2 Cause of death (based on the InternationalClassification of Diseases, Tenth Revision, 1992)3
1# Salmonella infections (A01 to A02)
2# Shigellosis and amoebiasis (A03, A06)
3 Certain other intestinal infections (A04, A07 to A09)
# Tuberculosis (A16 to A19)
4 Respiratory tuberculosis (A16)
5 Other tuberculosis (A17 to A19)
6# Whooping cough (A37)
7# Scarlet fever and erysipelas (A38, A46)
8# Meningococcal infection (A39)
9# Septicaemia (A40 to A41)
10# Syphilis (A50 to A53)
11# Acute poliomyelitis (A80)
12# Arthropod-borne viral encephalitis (A83 to A84, A85.2)
13# Measles (B05)
14# Viral hepatitis (B15 to B19)
15# Human immunodeficiency virus (HIV) disease (B20 to B24)
16# Malaria (B50 to B54)
17 Other and unspecified infectious and parasiticdiseases and their sequelae
(A00, A05, A20 to A36, A42 to A44, A48 to A49, A54 to A79, A81 to A82, A85.0 toA85.1, A85.8, A86–B04, B06–B09, B25–B49, B55–B99)
# Malignant neoplasms (C00 to C97)
18 Malignant neoplasms of lip, oral cavity and pharynx (C00 to C14)
19 Malignant neoplasm of oesophagus (C15)
20 Malignant neoplasm of stomach (C16)
21 Malignant neoplasms of colon, rectum and anus (C18 to C21)
22 Malignant neoplasms of liver and intrahepatic bileducts (C22)
23 Malignant neoplasm of pancreas (C25)
24 Malignant neoplasm of larynx (C32)
25 Malignant neoplasms of trachea, bronchus and lung (C33 to C34)
26 Malignant melanoma of skin (C43)
27 Malignant neoplasm of breast (C50)
28 Malignant neoplasm of cervix uteri (C53)
29 Malignant neoplasms of corpus uteri and uterus,part unspecified (C54 to C55)
30 Malignant neoplasm of ovary (C56)
31 Malignant neoplasm of prostate (C61)
32 Malignant neoplasms of kidney and renal pelvis (C64 to C65)
33 Malignant neoplasm of bladder (C67)
34 Malignant neoplasms of meninges, brain and otherparts of central nervous system (C70 to C72)
Malignant neoplasms of lymphoid, haematopoieticand related tissue (C81 to C96)
35 Hodgkin’s disease (C81)
36 Non-Hodgkin’s lymphoma (C82 to C85)
37 Leukaemia (C91 to C95)
38 Multiple myeloma and immunoproliferativeneoplasms (C88, C90)
Statistics Canada, Catalogue no. 84-215-X 12
39 Other and unspecified malignant neoplasms oflymphoid, haematopoietic and related tissue
(C96)
40 All other and unspecified malignant neoplasms (C17, C23 to C24, C26 to C31, C37 to C41, C44 to C49, C51 to C52,C57 to C60, C62to C63, C66, C68 to C69, C73 to C80, C97)
41# In situ neoplasms, benign neoplasms and neoplasmsof uncertain or unknown behavior (D00 to D48)
42# Anaemias (D50 to D64)
43# Diabetes mellitus (E10 to E14)
# Nutritional deficiencies (E40 to E64)
44 Malnutrition (E40 to E46)
45 Other nutritional deficiencies (E50 to E64)
46# Meningitis (G00,G03)
47# Parkinson’s disease (G20 to G21)
48# Alzheimer’s disease (G30)
Major cardiovascular diseases (I00 to I78)
# Diseases of heart (I00 to I09, I11, I13, I20 to I51)
49 Acute rheumatic fever and chronic rheumatic heartdiseases (I00 to I09)
50 Hypertensive heart disease (I11)
51 Hypertensive heart and renal disease (I13)
Ischaemic heart diseases (I20 to I25)
52 Acute myocardial infarction (I21 to I22)
53 Other acute ischaemic heart diseases (I24)
Other forms of chronic ischaemic heart disease (I20, I25)
54 Atherosclerotic cardiovascular disease, so described (I25.0)
55 All other forms of chronic ischaemic heart disease (I20, I25.1 to I25.9)
Other heart diseases (I26 to I51)
56 Acute and subacute endocarditis (I33)
57 Diseases of pericardium and acute myocarditis (I30 to I31, I40)
58 Heart failure (I50)
59 All other forms of heart disease (I26 to I28, I34 to I38, I42 to I49, I51)
60# Essential (primary) hypertension and hypertensiverenal disease (I10, I12)
61# Cerebrovascular diseases (I60 to I69)
62# Atherosclerosis (I70)
Other diseases of circulatory system (I71 to I78)
63# Aortic aneurysm and dissection (I71)
64 Other diseases of arteries, arterioles and capillaries (I72 to I78)
65 Other disorders of circulatory system (I80 to I99)
# Influenza and pneumonia (J10 to J18)
66 Influenza (J10 to J11)
67 Pneumonia (J12 to J18)
Other acute lower respiratory infections (J20 to J22)
68# Acute bronchitis and bronchiolitis (J20 to J21)
69 Unspecified acute lower respiratory infection (J22)
# Chronic lower respiratory diseases (J40 to J47)
70 Bronchitis, chronic and unspecified (J40 to J42)
71 Emphysema (J43)
72 Asthma (J45 to J46)
73 Other chronic lower respiratory diseases (J44, J47)
74# Pneumoconioses and chemical effects (J60 to J66, J68)
75# Pneumonitis due to solids and liquids (J69)
76 Other diseases of respiratory system (J00 to J06, J30 to J39, J67, J70 to J98)
77# Peptic ulcer (K25 to K28)
78# Diseases of appendix (K35 to K38)
79# Hernia (K40 to K46)
# Chronic liver disease and cirrhosis (K70, K73 to K74)
80 Alcoholic liver disease (K70)
81 Other chronic liver disease and cirrhosis (K73 to K74)
82# Cholelithiasis and other disorders of gallbladder (K80 to K82)
Statistics Canada, Catalogue no. 84-215-X 13

# Nephritis, nephrotic syndrome and nephrosis (N00 to N07,N17 to N19,N25 to N27)
83 Acute and rapidly progressive nephritic andnephrotic syndrome (N00 to N01, N04)
84Chronic glomerulonephritis, nephritis andnephropathy not specified as acute or chronic, andrenal sclerosis unspecified
(N02 to N03, N05 to N07,N26)
85 Renal failure (N17 to N19)
86 Other disorders of kidney (N25, N27)
87# Infections of kidney (N10 to N12, N13.6, N15.1)
88# Hyperplasia of prostate (N40)
89# Inflammatory diseases of female pelvic organs (N70 to N76)
# Pregnancy, childbirth and the puerperium (O00 to O99)
90 Pregnancy with abortive outcome (O00 to O07)
91 Other complications of pregnancy, childbirth and thepuerperium (O10 to O99)
92# Certain conditions originating in the perinatal period (P00 to P96)
93# Congenital malformations, deformations andchromosomal abnormalities (Q00 to Q99)
94 Symptoms, signs and abnormal clinical andlaboratory findings, not elsewhere classified (R00 to R99)
95 All other diseases (Residual)
# Accidents (unintentional injuries) (V01 to X59, Y85 to Y86)
Transport accidents (V01 to V99, Y85)
96 Motor vehicle accidents(V02 to V04, V09.0, V09.2, V12 to V14, V19.0 to V19.2, V19.4 to V19.6, V20V79,V80.3 to V80.5, V81.0 to V81.1, V82.0 to V82.1, V83 to V86, V87.0 to V87.8,V88.0 to V88.8, V89.0, V89.2)
97 Other land transport accidents(V01, V05 to V06, V09.1, V09.3 to V09.9, V10 to V11, V15 to V18, V19.3, V19.8 toV19.9,V80.0 to V80.2, V80.6 to V80.9, V81.2 to V81.9, V82.2 to V82.9, V87.9,V88.9, V89.1, V89.3, V89.9)
98 Water, air and space, and other and unspecifiedtransport accidents and their sequelae (V90 to V99, Y85)
Non transport accidents (W00 to X59, Y86)
99 Falls (W00 to W19)
100 Accidental discharge of firearms (W32 to W34)
101 Accidental drowning and submersion (W65 to W74)
102 Accidental exposure to smoke, fire and flames (X00 to X09)
103 Accidental poisoning and exposure to noxioussubstances (X40 to X49)
104 Other and unspecified non transport accidents andtheir sequelae (W20 to W31, W35 to W64, W75 to W99,X10 to X39, X50 to X59, Y86)
# Intentional self-harm (suicide) (X60 to X84, Y87.0)
105 Intentional self–harm (suicide) by discharge offirearms (X72 to X74)
106 Intentional self–harm (suicide) by other andunspecified means and their sequelae (X60 to X71, X75 to X84, Y87.0)
# Assault (homicide) (X85 to Y09, Y87.1)
107 Assault (homicide) by discharge of firearms (X93 to X95)
108 Assault (homicide) by other and unspecified meansand their sequelae (X85 to X92, X96 to Y09, Y87.1)
109# Legal intervention (Y35, Y89.0)
Events of undetermined intent (Y10 to Y34, Y87.2, Y89.9)
110 Discharge of firearms, undetermined intent (Y22 to Y24)
111 Other and unspecified events of undetermined intentand their sequelae (Y10 to Y21, Y25 to Y34, Y87.2, Y89.9)
112# Operations of war and their sequelae (Y36, Y89.1)
113# Complications of medical and surgical care (Y40 to Y84, Y88)
1. National Center for Health Statistics, United States. Table B in “Instruction Manual; Part 9; ICD–10 Cause–of–Death Lists for TabulatingMortality Statistics”.
2. World Health Organization (WHO), International Classification of Diseases and Related Health Problems, Tenth Revision (ICD–10).
3. The causes designated by # are ranked to determine leading causes of death for specified population groups.
Statistics Canada, Catalogue no. 84-215-X 14
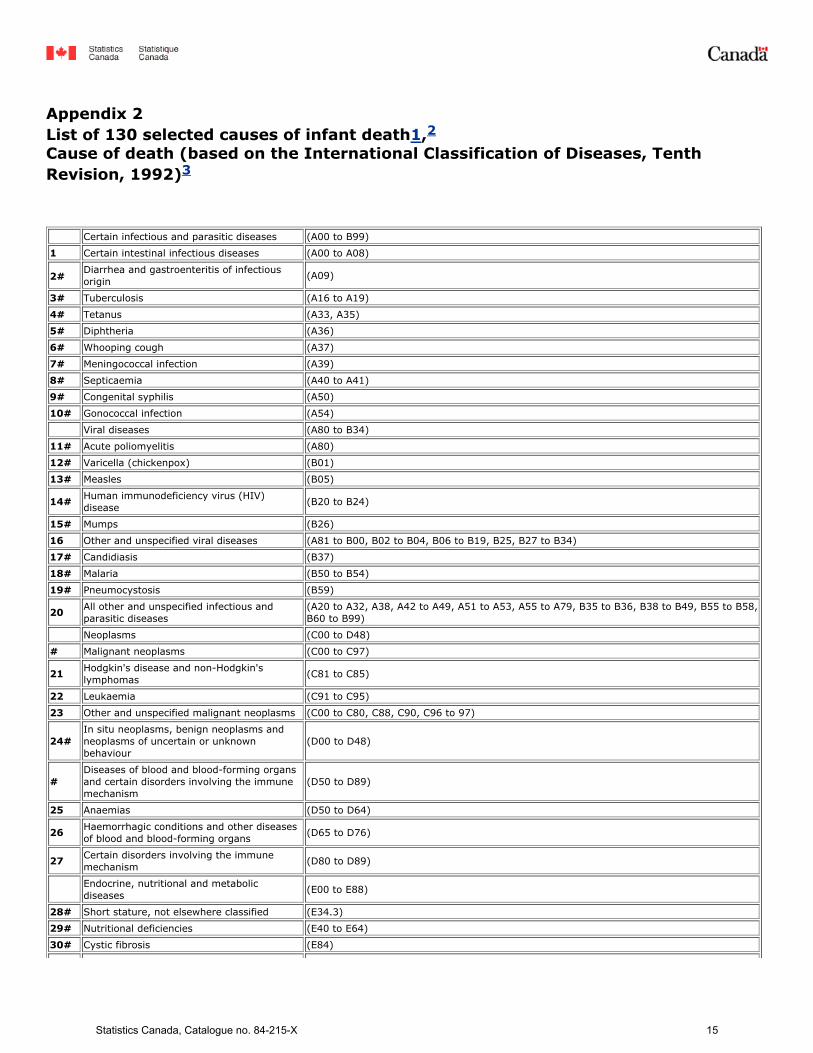
Appendix 2 List of 130 selected causes of infant death1,2 Cause of death (based on the International Classification of Diseases, TenthRevision, 1992)3
Certain infectious and parasitic diseases (A00 to B99)
1 Certain intestinal infectious diseases (A00 to A08)
2#Diarrhea and gastroenteritis of infectiousorigin (A09)
3# Tuberculosis (A16 to A19)
4# Tetanus (A33, A35)
5# Diphtheria (A36)
6# Whooping cough (A37)
7# Meningococcal infection (A39)
8# Septicaemia (A40 to A41)
9# Congenital syphilis (A50)
10# Gonococcal infection (A54)
Viral diseases (A80 to B34)
11# Acute poliomyelitis (A80)
12# Varicella (chickenpox) (B01)
13# Measles (B05)
14# Human immunodeficiency virus (HIV)disease (B20 to B24)
15# Mumps (B26)
16 Other and unspecified viral diseases (A81 to B00, B02 to B04, B06 to B19, B25, B27 to B34)
17# Candidiasis (B37)
18# Malaria (B50 to B54)
19# Pneumocystosis (B59)
20 All other and unspecified infectious andparasitic diseases
(A20 to A32, A38, A42 to A49, A51 to A53, A55 to A79, B35 to B36, B38 to B49, B55 to B58,B60 to B99)
Neoplasms (C00 to D48)
# Malignant neoplasms (C00 to C97)
21 Hodgkin's disease and non-Hodgkin'slymphomas (C81 to C85)
22 Leukaemia (C91 to C95)
23 Other and unspecified malignant neoplasms (C00 to C80, C88, C90, C96 to 97)
24#In situ neoplasms, benign neoplasms andneoplasms of uncertain or unknownbehaviour
(D00 to D48)
#Diseases of blood and blood-forming organsand certain disorders involving the immunemechanism
(D50 to D89)
25 Anaemias (D50 to D64)
26 Haemorrhagic conditions and other diseasesof blood and blood-forming organs (D65 to D76)
27 Certain disorders involving the immunemechanism (D80 to D89)
Endocrine, nutritional and metabolicdiseases (E00 to E88)
28# Short stature, not elsewhere classified (E34.3)
29# Nutritional deficiencies (E40 to E64)
30# Cystic fibrosis (E84)
Statistics Canada, Catalogue no. 84-215-X 15
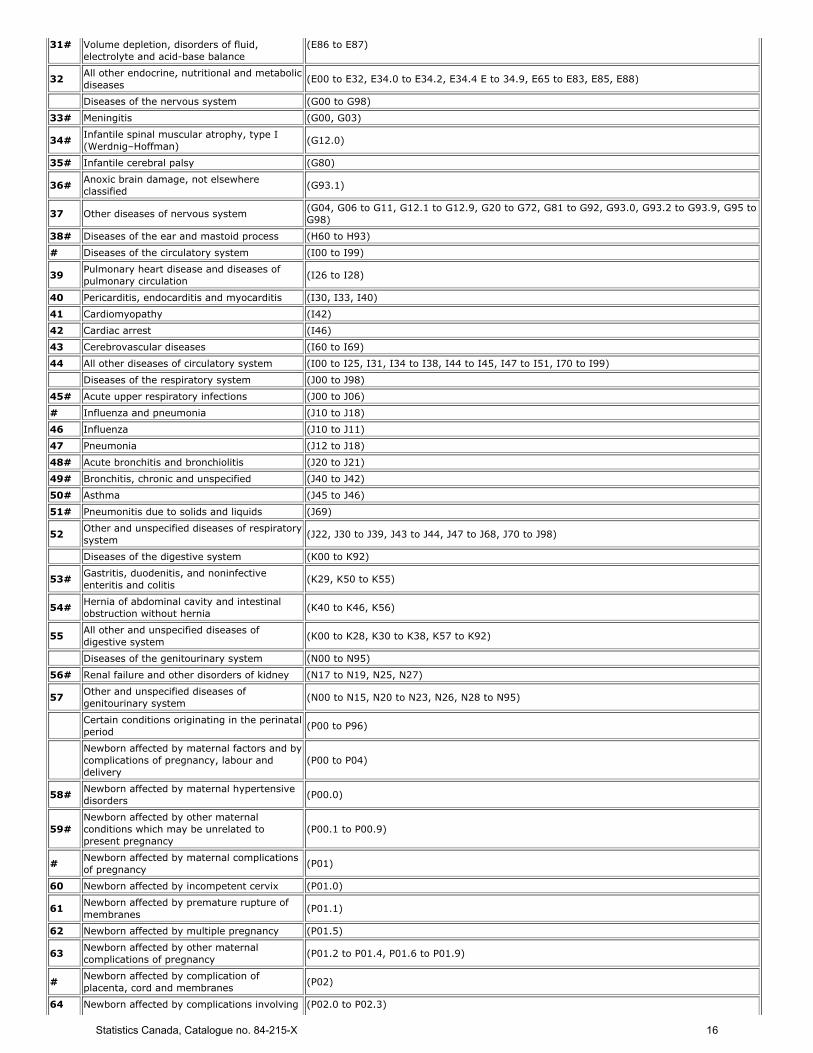
31# Volume depletion, disorders of fluid,electrolyte and acid-base balance
(E86 to E87)
32 All other endocrine, nutritional and metabolicdiseases (E00 to E32, E34.0 to E34.2, E34.4 E to 34.9, E65 to E83, E85, E88)
Diseases of the nervous system (G00 to G98)
33# Meningitis (G00, G03)
34# Infantile spinal muscular atrophy, type I(Werdnig–Hoffman) (G12.0)
35# Infantile cerebral palsy (G80)
36# Anoxic brain damage, not elsewhereclassified (G93.1)
37 Other diseases of nervous system (G04, G06 to G11, G12.1 to G12.9, G20 to G72, G81 to G92, G93.0, G93.2 to G93.9, G95 toG98)
38# Diseases of the ear and mastoid process (H60 to H93)
# Diseases of the circulatory system (I00 to I99)
39 Pulmonary heart disease and diseases ofpulmonary circulation (I26 to I28)
40 Pericarditis, endocarditis and myocarditis (I30, I33, I40)
41 Cardiomyopathy (I42)
42 Cardiac arrest (I46)
43 Cerebrovascular diseases (I60 to I69)
44 All other diseases of circulatory system (I00 to I25, I31, I34 to I38, I44 to I45, I47 to I51, I70 to I99)
Diseases of the respiratory system (J00 to J98)
45# Acute upper respiratory infections (J00 to J06)
# Influenza and pneumonia (J10 to J18)
46 Influenza (J10 to J11)
47 Pneumonia (J12 to J18)
48# Acute bronchitis and bronchiolitis (J20 to J21)
49# Bronchitis, chronic and unspecified (J40 to J42)
50# Asthma (J45 to J46)
51# Pneumonitis due to solids and liquids (J69)
52 Other and unspecified diseases of respiratorysystem (J22, J30 to J39, J43 to J44, J47 to J68, J70 to J98)
Diseases of the digestive system (K00 to K92)
53# Gastritis, duodenitis, and noninfectiveenteritis and colitis (K29, K50 to K55)
54# Hernia of abdominal cavity and intestinalobstruction without hernia (K40 to K46, K56)
55 All other and unspecified diseases ofdigestive system (K00 to K28, K30 to K38, K57 to K92)
Diseases of the genitourinary system (N00 to N95)
56# Renal failure and other disorders of kidney (N17 to N19, N25, N27)
57 Other and unspecified diseases ofgenitourinary system (N00 to N15, N20 to N23, N26, N28 to N95)
Certain conditions originating in the perinatalperiod (P00 to P96)
Newborn affected by maternal factors and bycomplications of pregnancy, labour anddelivery
(P00 to P04)
58# Newborn affected by maternal hypertensivedisorders (P00.0)
59#Newborn affected by other maternalconditions which may be unrelated topresent pregnancy
(P00.1 to P00.9)
# Newborn affected by maternal complicationsof pregnancy (P01)
60 Newborn affected by incompetent cervix (P01.0)
61 Newborn affected by premature rupture ofmembranes (P01.1)
62 Newborn affected by multiple pregnancy (P01.5)
63 Newborn affected by other maternalcomplications of pregnancy (P01.2 to P01.4, P01.6 to P01.9)
# Newborn affected by complication ofplacenta, cord and membranes (P02)
64 Newborn affected by complications involving (P02.0 to P02.3)
Statistics Canada, Catalogue no. 84-215-X 16

placenta
65 Newborn affected by complications involvingcord (P02.4 to P02.6)
66 Newborn affected by chorioamnionitis (P02.7)
67 Newborn affected by other and unspecifiedabnormalities of membranes (P02.8 to P02.9)
68# Newborn affected by other complications oflabour and delivery (P03)
69# Newborn affected by noxious influencestransmitted via placenta or breast milk (P04)
Disorders related to length of gestation andfetal malnutrition (P05 to P08)
70# Slow fetal growth and fetal malnutrition (P05)
# Disorders related to short gestation and lowbirth weight, not elsewhere classified (P07)
71 Extremely low birth weight or extremeimmaturity (P07.0, P07.2)
72 Other low birth weight or preterm (P07.1, P07.3)
73# Disorders related to long gestation and highbirth weight (P08)
74# Birth trauma (P10 to P15)
# Intrauterine hypoxia and birth asphyxia (P20 to P21)
75 Intrauterine hypoxia (P20)
76 Birth asphyxia (P21)
77# Respiratory distress of newborn (P22)
Other respiratory conditions originating inthe perinatal period (P23 to P28)
78# Congenital pneumonia (P23)
79# Neonatal aspiration syndromes (P24)
80# Interstitial emphysema and relatedconditions originating in the perinatal period (P25)
81# Pulmonary hemorrhage originating in theperinatal period (P26)
82# Chronic respiratory disease originating in theperinatal period (P27)
83# Atelectasis (P28.0 to P28.1)
84 All other respiratory conditions originating inthe perinatal period (P28.2 to P28.9)
Infections specific to the perinatal period (P35 to P39)
85# Bacterial sepsis of newborn (P36)
86# Omphalitis of newborn with or without mildhaemorrhage (P38)
87 All other infections specific to the perinatalperiod (P35, P37, P39)
Haemorrhagic and haematological disordersof newborn (P50 to P61)
88# Neonatal haemorrhage (P50 to P52, P54)
89# Haemorrhagic disease of newborn (P53)
90# Haemolytic disease of newborn due toisoimmunization and other perinatal jaundice (P55 to P59)
91# Haematological disorders (P60 to P61)
92# Syndrome of infant of a diabetic mother andneonatal diabetes mellitus (P70.0 to P70.2)
93# Necrotizing enterocolitis of newborn (P77)
94# Hydrops fetalis not due to haemolyticdisease (P83.2)
95 Other perinatal conditions (P29, P70.3 to P70.9, P71 to P76, P78 to P81, P83.0 to P83.1, P83.3 to P83.9, P90 to P96)
# Congenital malformations, deformations andchromosomal abnormalities (Q00 to Q99)
96 Anencephaly and similar malformations (Q00)
97 Congenital hydrocephalus (Q03)
98 Spina bifida (Q05)
99 Other congenital malformations of nervoussystem (Q01 to Q02, Q04, Q06 to Q07)
100 Congenital malformations of heart (Q20 to Q24)
Statistics Canada, Catalogue no. 84-215-X 17
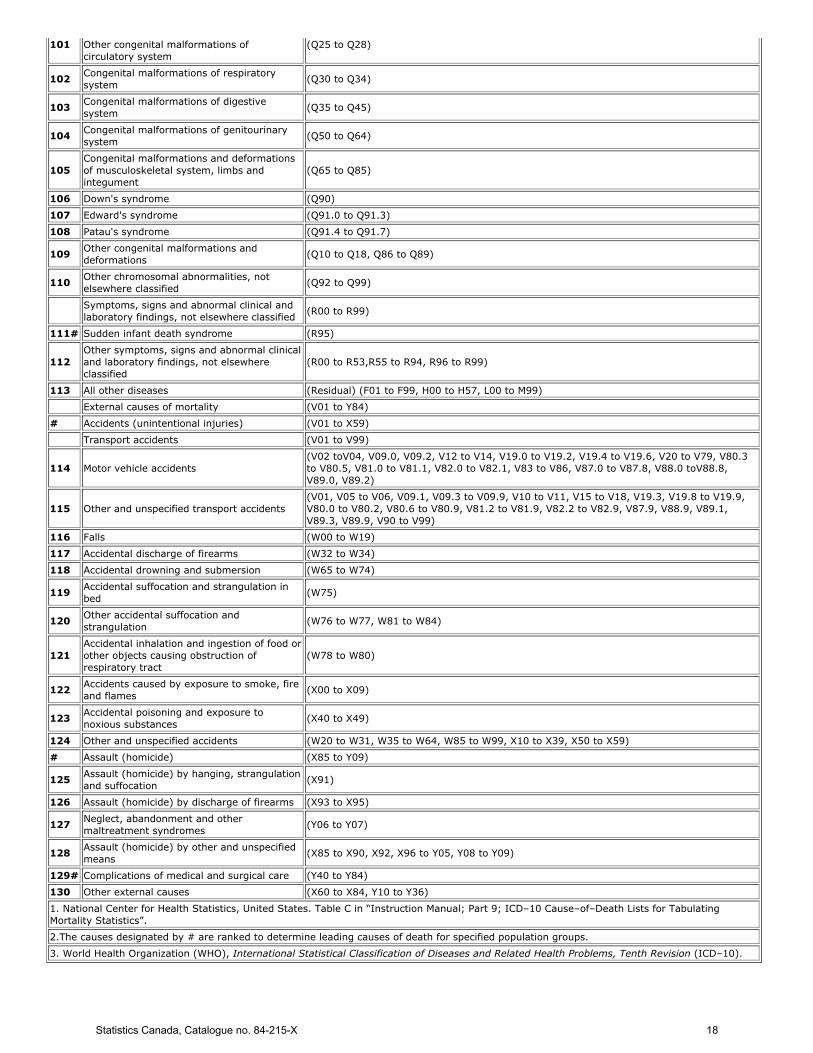
101 Other congenital malformations ofcirculatory system
(Q25 to Q28)
102 Congenital malformations of respiratorysystem (Q30 to Q34)
103 Congenital malformations of digestivesystem (Q35 to Q45)
104 Congenital malformations of genitourinarysystem (Q50 to Q64)
105Congenital malformations and deformationsof musculoskeletal system, limbs andintegument
(Q65 to Q85)
106 Down's syndrome (Q90)
107 Edward's syndrome (Q91.0 to Q91.3)
108 Patau's syndrome (Q91.4 to Q91.7)
109 Other congenital malformations anddeformations (Q10 to Q18, Q86 to Q89)
110 Other chromosomal abnormalities, notelsewhere classified (Q92 to Q99)
Symptoms, signs and abnormal clinical andlaboratory findings, not elsewhere classified (R00 to R99)
111# Sudden infant death syndrome (R95)
112Other symptoms, signs and abnormal clinicaland laboratory findings, not elsewhereclassified
(R00 to R53,R55 to R94, R96 to R99)
113 All other diseases (Residual) (F01 to F99, H00 to H57, L00 to M99)
External causes of mortality (V01 to Y84)
# Accidents (unintentional injuries) (V01 to X59)
Transport accidents (V01 to V99)
114 Motor vehicle accidents(V02 toV04, V09.0, V09.2, V12 to V14, V19.0 to V19.2, V19.4 to V19.6, V20 to V79, V80.3to V80.5, V81.0 to V81.1, V82.0 to V82.1, V83 to V86, V87.0 to V87.8, V88.0 toV88.8,V89.0, V89.2)
115 Other and unspecified transport accidents(V01, V05 to V06, V09.1, V09.3 to V09.9, V10 to V11, V15 to V18, V19.3, V19.8 to V19.9,V80.0 to V80.2, V80.6 to V80.9, V81.2 to V81.9, V82.2 to V82.9, V87.9, V88.9, V89.1,V89.3, V89.9, V90 to V99)
116 Falls (W00 to W19)
117 Accidental discharge of firearms (W32 to W34)
118 Accidental drowning and submersion (W65 to W74)
119 Accidental suffocation and strangulation inbed (W75)
120 Other accidental suffocation andstrangulation (W76 to W77, W81 to W84)
121Accidental inhalation and ingestion of food orother objects causing obstruction ofrespiratory tract
(W78 to W80)
122 Accidents caused by exposure to smoke, fireand flames (X00 to X09)
123 Accidental poisoning and exposure tonoxious substances (X40 to X49)
124 Other and unspecified accidents (W20 to W31, W35 to W64, W85 to W99, X10 to X39, X50 to X59)
# Assault (homicide) (X85 to Y09)
125 Assault (homicide) by hanging, strangulationand suffocation (X91)
126 Assault (homicide) by discharge of firearms (X93 to X95)
127 Neglect, abandonment and othermaltreatment syndromes (Y06 to Y07)
128 Assault (homicide) by other and unspecifiedmeans (X85 to X90, X92, X96 to Y05, Y08 to Y09)
129# Complications of medical and surgical care (Y40 to Y84)
130 Other external causes (X60 to X84, Y10 to Y36)
1. National Center for Health Statistics, United States. Table C in “Instruction Manual; Part 9; ICD–10 Cause–of–Death Lists for TabulatingMortality Statistics”.
2.The causes designated by # are ranked to determine leading causes of death for specified population groups.
3. World Health Organization (WHO), International Statistical Classification of Diseases and Related Health Problems, Tenth Revision (ICD–10).
Statistics Canada, Catalogue no. 84-215-X 18

Appendix 3.1 Postcensal Population Estimates by sex and age group, Canada, Provinces and Territories, July 1, 20011
Sex Age Group Canada Newfoundlandand Labrador
PrinceEdwardIsland
NovaScotia
NewBrunswick Quebec Ontario Manitoba Saskatchewan Alberta British
Colombia Yukon NorthwestTerritories Nunavut
Bothsexes
Total 31,110,565 533,816 138,904 942,884 755,953 7,417,732 11,894,863 1,149,118 1,017,087 3,059,107 4,101,579 30,181 41,226 28,115
under 12 333,744 4,716 1,380 8,909 7,195 73,695 131,709 14,002 12,275 37,619 40,577 344 613 710
1 to 42 1,398,258 21,106 6,185 39,239 31,742 309,032 547,419 57,999 50,717 155,264 172,991 1,415 2,526 2,623
5 to 9 2,032,339 29,275 9,109 56,764 45,212 462,385 802,169 81,701 73,033 211,909 250,924 2,077 3,984 3,797
10 to 14 2,078,584 35,285 10,083 62,955 49,001 462,940 800,912 84,372 79,244 222,158 262,142 2,359 3,808 3,325
15 to 19 2,086,259 39,837 10,437 64,184 51,163 466,296 784,857 81,756 78,657 226,435 274,456 2,363 3,191 2,627
20 to 24 2,118,330 37,530 9,596 62,247 51,214 513,246 780,549 77,873 73,679 230,341 274,603 1,831 3,191 2,430
25 to 29 2,121,052 36,264 8,855 62,168 52,379 485,934 822,897 78,464 65,629 229,704 271,057 1,943 3,409 2,349
30 to 34 2,278,202 38,209 9,063 65,723 53,359 511,116 909,498 78,301 62,881 234,346 307,176 2,406 3,679 2,445
35 to 39 2,656,911 43,783 11,041 78,683 62,770 625,564 1,053,151 89,208 75,210 260,314 348,362 2,876 3,880 2,069
40 to 44 2,658,039 45,458 11,040 79,787 63,293 654,744 1,004,800 91,063 79,071 269,539 351,208 2,973 3,625 1,438
45 to 49 2,385,918 44,731 10,383 72,945 60,430 593,775 879,324 83,209 72,755 235,623 325,983 2,758 2,718 1,284
50 to 54 2,116,140 40,486 10,033 68,192 55,522 530,169 788,502 73,809 60,088 189,903 293,539 2,305 2,308 1,284
55 to 59 1,626,156 30,465 7,081 52,569 40,990 435,447 601,080 56,370 45,981 137,018 215,400 1,661 1,489 605
60 to 64 1,292,973 23,019 5,953 41,461 32,392 331,794 490,940 45,270 39,713 107,565 172,293 1,108 1,030 435
65 to 69 1,140,665 19,270 5,331 35,909 27,832 289,720 437,406 40,563 37,615 94,254 151,122 669 647 327
70 to 74 1,013,943 16,304 4,460 30,763 24,308 255,304 391,469 37,364 35,476 80,609 136,708 501 474 203
75 to 79 817,631 12,806 3,697 25,513 20,855 197,601 317,650 33,430 30,255 61,725 113,383 314 298 104
80 to 84 524,892 8,782 2,674 19,019 14,306 121,618 194,767 23,193 22,994 40,957 76,202 158 179 43
85 to 89 289,094 4,510 1,679 10,597 8,071 65,285 104,935 13,864 14,391 22,622 42,941 90 102 7
90 and over 141,435 1,980 824 5,257 3,919 32,067 50,829 7,307 7,423 11,202 20,512 30 75 10
Males
Total 15,405,773 264,280 68,156 461,765 373,858 3,661,529 5,871,433 569,915 504,537 1,543,447 2,035,397 15,466 21,302 14,688
under 12 171,153 2,432 687 4,578 3,692 37,798 67,559 7,106 6,306 19,316 20,839 175 305 360
1 to 42 716,059 10,647 3,270 19,861 16,479 158,739 279,992 29,784 25,562 79,402 88,857 764 1,292 1,410
5 to 9 1,041,135 15,115 4,724 28,986 22,904 235,259 411,582 41,34 37,336 109,396 129,031 1,038 1,925 2,005
10 to 14 1,066,080 18,016 5,046 32,394 25,175 236,628 411,811 43,427 40,441 113,896 134,389 1,254 1,904 1,699
15 to 19 1,071,130 20,373 5,254 33,036 26,212 239,046 403,543 41,842 40,586 115,597 141,313 1,217 1,788 1,323
20 to 24 1,081,519 18,820 4,860 31,277 26,380 262,871 397,409 39,727 38,064 119,269 139,109 938 1,586 1,209
25 to 29 1,074,671 18,482 4,364 30,839 26,507 249,418 413,345 40,340 32,836 118,837 135,845 926 1,730 1,202
30 to 34 1,150,015 18,794 4,530 32,429 26,955 261,642 455,052 40,092 31,637 120,589 154,030 1,175 1,831 1,259
35 to 39 1,340,929 21,316 5,504 39,102 31,545 319,387 529,863 45,317 37,699 131,789 174,891 1,408 1,998 1,110
40 to 44 1,330,433 22,476 5,430 39,521 31,777 329,214 500,192 45,967 39,968 136,501 175,223 1,507 1,890 767
45 to 49 1,189,755 22,202 5,125 36,145 30,140 296,600 434,170 41,484 37,169 121,053 162,101 1,397 1,517 652
50 to 54 1,054,215 20,357 4,942 33,978 27,829 263,025 389,524 36,756 30,348 97,072 147,166 1,243 1,249 726
55 to 59 804,518 15,337 3,625 25,962 20,550 214,243 295,307 28,114 22,912 68,768 107,552 944 871 333
60 to 64 632,102 11,545 2,935 20,282 15,975 160,802 238,980 22,216 19,398 53,648 84,968 589 532 232
65 to 69 549,046 9,441 2,545 17,354 13,246 136,249 209,928 19,641 18,215 46,557 75,031 333 313 193
70 to 74 464,892 7,631 2,058 14,001 10,894 112,622 179,859 17,017 16,537 38,364 65,277 288 246 98
75 to 79 340,578 5,659 1,577 10,509 8,685 78,831 132,010 13,978 13,297 26,666 48,995 162 143 66
80 to 84 196,492 3,482 916 6,921 5,325 42,565 73,611 8,757 8,959 15,875 29,880 62 109 30
85 to 89 94,151 1,575 522 3,290 2,645 19,233 34,665 4,496 5,079 7,648 14,918 35 41 4
90 and over 36,900 580 242 1,300 943 7,357 13,031 2,020 2,188 3,204 5,982 11 32 10
Females Total 15,704,792 269,536 70,748 481,119 382,095 3,756,203 6,023,430 579,203 512,550 1,515,660 2,066,182 14,715 19,924 13,427
under 12 162,591 2,284 693 4,331 3,503 35,897 64,150 6,896 5,969 18,303 19,738 169 308 350
1 to 42 682,199 10,459 2,915 19,378 15,263 150,293 267,427 28,215 25,155 75,862 84,134 651 1,234 1,213
5 to 9 991,204 14,160 4,385 27,778 22,308 227,126 390,587 39,867 35,697 102,513 121,893 1,039 2,059 1,792
10 to 14 1,012,504 17,269 5,037 30,561 23,826 226,312 389,101 40,945 38,803 108,262 127,753 1,105 1,904 1,626
15 to 19 1,015,129 19,464 5,183 31,148 24,951 227,250 381,314 39,914 38,071 110,838 133,143 1,146 1,403 1,304
20 to 24 1,036,811 18,710 4,736 30,970 24,834 250,375 383,140 38,146 35,615 111,072 135,494 893 1,605 1,221
25 to 29 1,046,381 17,782 4,491 31,329 25,872 236,516 409,552 38,124 32,793 110,867 135,212 1,017 1,679 1,147
30 to 34 1,128,187 19,415 4,533 33,294 26,404 249,474 454,446 38,209 31,244 113,757 153,146 1,231 1,848 1,186
35 to 39 1,315,982 22,467 5,537 39,581 31,225 306,177 523,288 43,891 37,511 128,525 173,471 1,468 1,882 959
40 to 44 1,327,606 22,982 5,610 40,266 31,516 325,530 504,608 45,096 39,103 133,038 175,985 1,466 1,735 671
45 to 49 1,196,163 22,529 5,258 36,800 30,290 297,175 445,154 41,725 35,586 114,570 163,882 1,361 1,201 632
50 to 54 1,061,925 20,129 5,091 34,214 27,693 267,144 398,978 37,053 29,740 92,831 146,373 1,062 1,059 558
55 to 59 821,638 15,128 3,456 26,607 20,440 221,204 305,773 28,256 23,069 68,250 107,848 717 618 272
60 to 64 660,871 11,474 3,018 21,179 16,417 170,992 251,960 23,054 20,315 53,917 87,325 519 498 203
65 to 69 591,619 9,829 2,786 18,555 14,586 153,471 227,478 20,922 19,400 47,697 76,091 336 334 134
Statistics Canada, Catalogue no. 84-215-X 19

70 to 74 549,051 8,673 2,402 16,762 13,414 142,682 211,610 20,347 18,939 42,245 71,431 213 228 105
75 to 79 477,053 7,147 2,120 15,004 12,170 118,770 185,640 19,452 16,958 35,059 64,388 152 155 38
80 to 84 328,400 5,300 1,758 12,098 8,981 79,053 121,156 14,436 14,035 25,082 46,322 96 70 13
85 to 89 194,943 2,935 1,157 7,307 5,426 46,052 70,270 9,368 9,312 14,974 28,023 55 61 3
90 and over 104,535 1,400 582 3,957 2,976 24,710 37,798 5,287 5,235 7,998 14,530 19 43 0
1. These postcensal population estimates, which are based on the 1996 census, are adjusted for net census undercoverage and include non–permanent residents.
2. 2001 population counts for the "under 1" and "1 to 4" categories were adjusted for new births by Health Statistics Division.
Sources: "Annual Demographic Statistics, 2002" (Catalogue number 91–213–XPB) and Health Statistics Division, Statistics Canada.
Statistics Canada, Catalogue no. 84-215-X 20
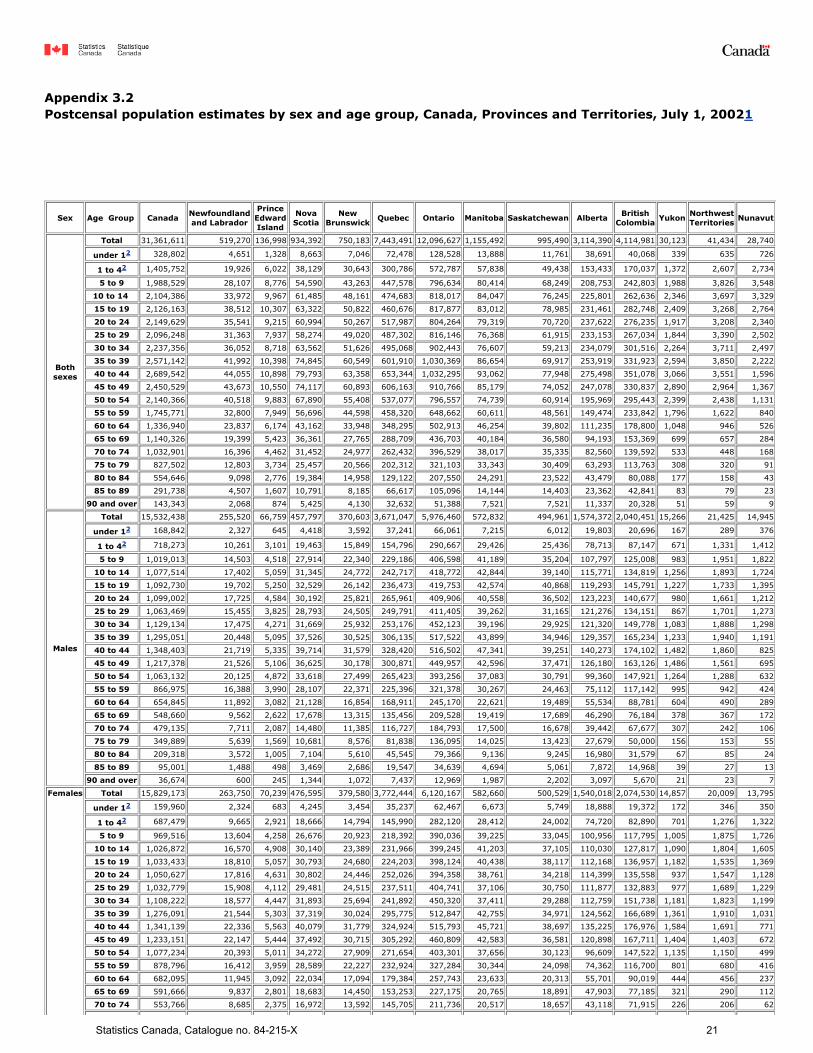
Appendix 3.2 Postcensal population estimates by sex and age group, Canada, Provinces and Territories, July 1, 20021
Sex Age Group Canada Newfoundlandand Labrador
PrinceEdwardIsland
NovaScotia
NewBrunswick Quebec Ontario Manitoba Saskatchewan Alberta British
Colombia Yukon NorthwestTerritories Nunavut
Bothsexes
Total 31,361,611 519,270 136,998 934,392 750,183 7,443,491 12,096,627 1,155,492 995,490 3,114,390 4,114,981 30,123 41,434 28,740
under 12 328,802 4,651 1,328 8,663 7,046 72,478 128,528 13,888 11,761 38,691 40,068 339 635 726
1 to 42 1,405,752 19,926 6,022 38,129 30,643 300,786 572,787 57,838 49,438 153,433 170,037 1,372 2,607 2,734
5 to 9 1,988,529 28,107 8,776 54,590 43,263 447,578 796,634 80,414 68,249 208,753 242,803 1,988 3,826 3,548
10 to 14 2,104,386 33,972 9,967 61,485 48,161 474,683 818,017 84,047 76,245 225,801 262,636 2,346 3,697 3,329
15 to 19 2,126,163 38,512 10,307 63,322 50,822 460,676 817,877 83,012 78,985 231,461 282,748 2,409 3,268 2,764
20 to 24 2,149,629 35,541 9,215 60,994 50,267 517,987 804,264 79,319 70,720 237,622 276,235 1,917 3,208 2,340
25 to 29 2,096,248 31,363 7,937 58,274 49,020 487,302 816,146 76,368 61,915 233,153 267,034 1,844 3,390 2,502
30 to 34 2,237,356 36,052 8,718 63,562 51,626 495,068 902,443 76,607 59,213 234,079 301,516 2,264 3,711 2,497
35 to 39 2,571,142 41,992 10,398 74,845 60,549 601,910 1,030,369 86,654 69,917 253,919 331,923 2,594 3,850 2,222
40 to 44 2,689,542 44,055 10,898 79,793 63,358 653,344 1,032,295 93,062 77,948 275,498 351,078 3,066 3,551 1,596
45 to 49 2,450,529 43,673 10,550 74,117 60,893 606,163 910,766 85,179 74,052 247,078 330,837 2,890 2,964 1,367
50 to 54 2,140,366 40,518 9,883 67,890 55,408 537,077 796,557 74,739 60,914 195,969 295,443 2,399 2,438 1,131
55 to 59 1,745,771 32,800 7,949 56,696 44,598 458,320 648,662 60,611 48,561 149,474 233,842 1,796 1,622 840
60 to 64 1,336,940 23,837 6,174 43,162 33,948 348,295 502,913 46,254 39,802 111,235 178,800 1,048 946 526
65 to 69 1,140,326 19,399 5,423 36,361 27,765 288,709 436,703 40,184 36,580 94,193 153,369 699 657 284
70 to 74 1,032,901 16,396 4,462 31,452 24,977 262,432 396,529 38,017 35,335 82,560 139,592 533 448 168
75 to 79 827,502 12,803 3,734 25,457 20,566 202,312 321,103 33,343 30,409 63,293 113,763 308 320 91
80 to 84 554,646 9,098 2,776 19,384 14,958 129,122 207,550 24,291 23,522 43,479 80,088 177 158 43
85 to 89 291,738 4,507 1,607 10,791 8,185 66,617 105,096 14,144 14,403 23,362 42,841 83 79 23
90 and over 143,343 2,068 874 5,425 4,130 32,632 51,388 7,521 7,521 11,337 20,328 51 59 9
Males
Total 15,532,438 255,520 66,759 457,797 370,603 3,671,047 5,976,460 572,832 494,961 1,574,372 2,040,451 15,266 21,425 14,945
under 12 168,842 2,327 645 4,418 3,592 37,241 66,061 7,215 6,012 19,803 20,696 167 289 376
1 to 42 718,273 10,261 3,101 19,463 15,849 154,796 290,667 29,426 25,436 78,713 87,147 671 1,331 1,412
5 to 9 1,019,013 14,503 4,518 27,914 22,340 229,186 406,598 41,189 35,204 107,797 125,008 983 1,951 1,822
10 to 14 1,077,514 17,402 5,059 31,345 24,772 242,717 418,772 42,844 39,140 115,771 134,819 1,256 1,893 1,724
15 to 19 1,092,730 19,702 5,250 32,529 26,142 236,473 419,753 42,574 40,868 119,293 145,791 1,227 1,733 1,395
20 to 24 1,099,002 17,725 4,584 30,192 25,821 265,961 409,906 40,558 36,502 123,223 140,677 980 1,661 1,212
25 to 29 1,063,469 15,455 3,825 28,793 24,505 249,791 411,405 39,262 31,165 121,276 134,151 867 1,701 1,273
30 to 34 1,129,134 17,475 4,271 31,669 25,932 253,176 452,123 39,196 29,925 121,320 149,778 1,083 1,888 1,298
35 to 39 1,295,051 20,448 5,095 37,526 30,525 306,135 517,522 43,899 34,946 129,357 165,234 1,233 1,940 1,191
40 to 44 1,348,403 21,719 5,335 39,714 31,579 328,420 516,502 47,341 39,251 140,273 174,102 1,482 1,860 825
45 to 49 1,217,378 21,526 5,106 36,625 30,178 300,871 449,957 42,596 37,471 126,180 163,126 1,486 1,561 695
50 to 54 1,063,132 20,125 4,872 33,618 27,499 265,423 393,256 37,083 30,791 99,360 147,921 1,264 1,288 632
55 to 59 866,975 16,388 3,990 28,107 22,371 225,396 321,378 30,267 24,463 75,112 117,142 995 942 424
60 to 64 654,845 11,892 3,082 21,128 16,854 168,911 245,170 22,621 19,489 55,534 88,781 604 490 289
65 to 69 548,660 9,562 2,622 17,678 13,315 135,456 209,528 19,419 17,689 46,290 76,184 378 367 172
70 to 74 479,135 7,711 2,087 14,480 11,385 116,727 184,793 17,500 16,678 39,442 67,677 307 242 106
75 to 79 349,889 5,639 1,569 10,681 8,576 81,838 136,095 14,025 13,423 27,679 50,000 156 153 55
80 to 84 209,318 3,572 1,005 7,104 5,610 45,545 79,366 9,136 9,245 16,980 31,579 67 85 24
85 to 89 95,001 1,488 498 3,469 2,686 19,547 34,639 4,694 5,061 7,872 14,968 39 27 13
90 and over 36,674 600 245 1,344 1,072 7,437 12,969 1,987 2,202 3,097 5,670 21 23 7
Females Total 15,829,173 263,750 70,239 476,595 379,580 3,772,444 6,120,167 582,660 500,529 1,540,018 2,074,530 14,857 20,009 13,795
under 12 159,960 2,324 683 4,245 3,454 35,237 62,467 6,673 5,749 18,888 19,372 172 346 350
1 to 42 687,479 9,665 2,921 18,666 14,794 145,990 282,120 28,412 24,002 74,720 82,890 701 1,276 1,322
5 to 9 969,516 13,604 4,258 26,676 20,923 218,392 390,036 39,225 33,045 100,956 117,795 1,005 1,875 1,726
10 to 14 1,026,872 16,570 4,908 30,140 23,389 231,966 399,245 41,203 37,105 110,030 127,817 1,090 1,804 1,605
15 to 19 1,033,433 18,810 5,057 30,793 24,680 224,203 398,124 40,438 38,117 112,168 136,957 1,182 1,535 1,369
20 to 24 1,050,627 17,816 4,631 30,802 24,446 252,026 394,358 38,761 34,218 114,399 135,558 937 1,547 1,128
25 to 29 1,032,779 15,908 4,112 29,481 24,515 237,511 404,741 37,106 30,750 111,877 132,883 977 1,689 1,229
30 to 34 1,108,222 18,577 4,447 31,893 25,694 241,892 450,320 37,411 29,288 112,759 151,738 1,181 1,823 1,199
35 to 39 1,276,091 21,544 5,303 37,319 30,024 295,775 512,847 42,755 34,971 124,562 166,689 1,361 1,910 1,031
40 to 44 1,341,139 22,336 5,563 40,079 31,779 324,924 515,793 45,721 38,697 135,225 176,976 1,584 1,691 771
45 to 49 1,233,151 22,147 5,444 37,492 30,715 305,292 460,809 42,583 36,581 120,898 167,711 1,404 1,403 672
50 to 54 1,077,234 20,393 5,011 34,272 27,909 271,654 403,301 37,656 30,123 96,609 147,522 1,135 1,150 499
55 to 59 878,796 16,412 3,959 28,589 22,227 232,924 327,284 30,344 24,098 74,362 116,700 801 680 416
60 to 64 682,095 11,945 3,092 22,034 17,094 179,384 257,743 23,633 20,313 55,701 90,019 444 456 237
65 to 69 591,666 9,837 2,801 18,683 14,450 153,253 227,175 20,765 18,891 47,903 77,185 321 290 112
70 to 74 553,766 8,685 2,375 16,972 13,592 145,705 211,736 20,517 18,657 43,118 71,915 226 206 62
Statistics Canada, Catalogue no. 84-215-X 21
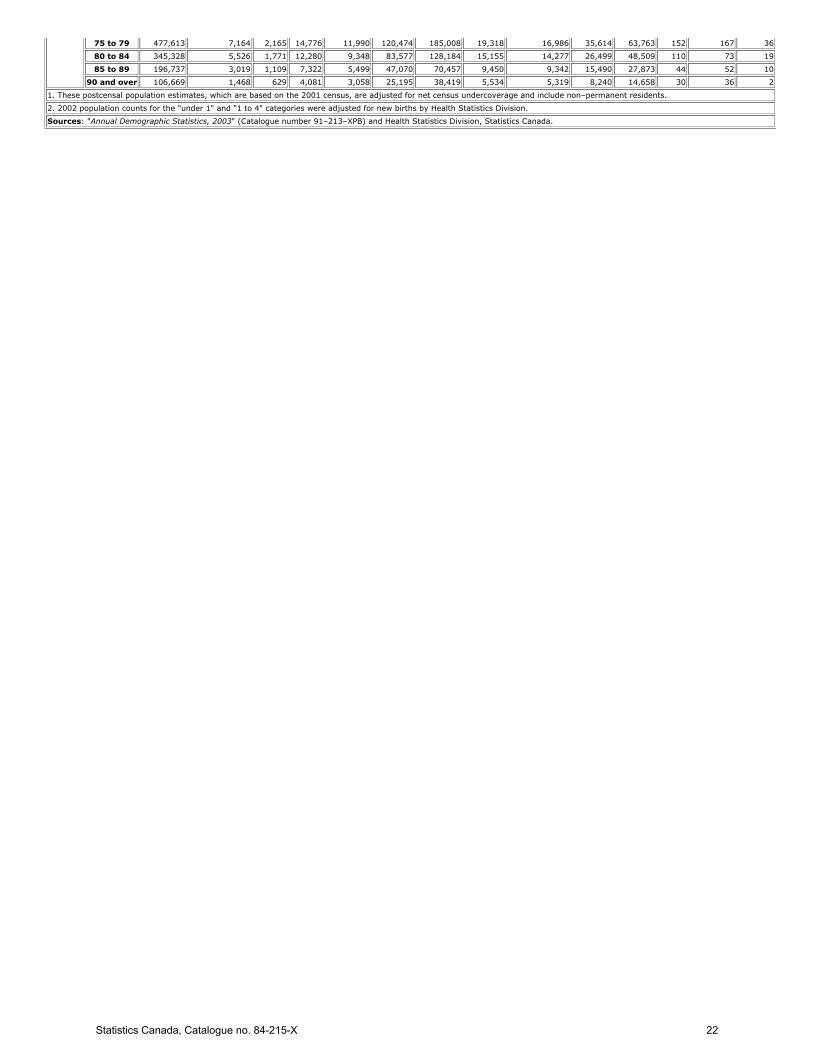
75 to 79 477,613 7,164 2,165 14,776 11,990 120,474 185,008 19,318 16,986 35,614 63,763 152 167 36
80 to 84 345,328 5,526 1,771 12,280 9,348 83,577 128,184 15,155 14,277 26,499 48,509 110 73 19
85 to 89 196,737 3,019 1,109 7,322 5,499 47,070 70,457 9,450 9,342 15,490 27,873 44 52 10
90 and over 106,669 1,468 629 4,081 3,058 25,195 38,419 5,534 5,319 8,240 14,658 30 36 2
1. These postcensal population estimates, which are based on the 2001 census, are adjusted for net census undercoverage and include non–permanent residents.
2. 2002 population counts for the "under 1" and "1 to 4" categories were adjusted for new births by Health Statistics Division.
Sources: "Annual Demographic Statistics, 2003" (Catalogue number 91–213–XPB) and Health Statistics Division, Statistics Canada.
Statistics Canada, Catalogue no. 84-215-X 22

Appendix 3.3 Postcensal population estimates by sex and age group, Canada, Provinces and Territories, July 1, 20031
Sex Age Group Canada Newfoundlandand Labrador
PrinceEdwardIsland
NovaScotia
NewBrunswick Quebec Ontario Manitoba Saskatchewan Alberta British
Colombia Yukon NorthwestTerritories Nunavut
Bothsexes
Total 31,660,466 518,350 137,266 936,165 750,896 7,492,333 12,256,645 1,161,552 994,428 3,158,641 4,152,289 30,554 42,206 29,141
under 12 335,202 4,629 1,417 8,650 7,117 73,905 130,927 13,940 12,038 40,287 40,496 335 701 758
1 to 42 1,373,521 19,673 5,708 36,919 29,590 295,565 555,438 56,795 48,121 152,901 166,222 1,378 2,567 2,646
5 to 9 1,952,646 27,182 8,485 52,913 42,133 432,825 789,773 79,211 66,431 206,173 238,189 1,953 3,708 3,670
10 to 14 2,120,210 33,005 9,900 60,918 47,723 483,210 828,786 84,668 75,329 225,261 262,032 2,344 3,765 3,269
15 to 19 2,123,255 37,093 10,275 63,441 49,939 456,468 823,163 83,311 77,679 232,293 280,936 2,435 3,356 2,866
20 to 24 2,190,472 35,610 9,389 62,159 50,551 515,366 827,361 80,391 72,173 243,575 286,057 2,054 3,395 2,391
25 to 29 2,121,910 31,291 7,889 57,661 48,526 502,163 822,882 77,173 62,528 237,990 265,980 1,858 3,449 2,520
30 to 34 2,232,647 34,848 8,608 62,905 51,151 492,102 903,367 76,785 59,218 236,778 298,400 2,283 3,734 2,468
35 to 39 2,485,753 41,097 9,976 71,113 58,116 575,830 1,005,328 83,108 65,766 245,571 321,315 2,484 3,750 2,299
40 to 44 2,722,710 43,910 11,047 80,307 63,402 653,599 1,058,856 93,710 77,783 277,445 354,353 3,022 3,628 1,648
45 to 49 2,518,066 43,864 10,753 75,583 62,006 621,905 939,726 86,765 75,482 255,806 338,776 2,947 3,010 1,443
50 to 54 2,178,375 41,149 9,857 68,055 55,959 545,610 809,156 75,721 62,772 203,076 300,912 2,477 2,491 1,140
55 to 59 1,842,680 34,632 8,582 60,085 47,470 476,443 687,828 63,953 50,738 159,349 249,023 1,915 1,825 837
60 to 64 1,396,842 24,989 6,363 45,125 35,345 366,122 523,698 47,929 40,552 116,487 187,543 1,135 1,040 514
65 to 69 1,149,464 19,745 5,459 36,812 28,000 289,686 440,950 40,155 36,385 95,486 155,075 737 660 314
70 to 74 1,040,932 16,683 4,621 31,692 25,010 264,712 399,327 37,711 34,870 83,834 141,262 563 475 172
75 to 79 841,173 12,932 3,623 25,535 20,846 207,591 326,328 33,007 30,353 64,931 115,300 302 334 91
80 to 84 584,241 9,219 2,875 19,627 15,264 135,794 222,184 25,256 23,631 45,528 84,432 198 181 52
85 to 89 298,136 4,604 1,579 10,871 8,351 68,825 107,156 14,123 14,653 23,818 43,936 93 94 33
90 and over 152,231 2,195 860 5,794 4,397 34,612 54,411 7,840 7,926 12,052 22,050 41 43 10
Males
Total 15,679,001 254,887 66,809 458,371 370,728 3,696,813 6,054,565 576,167 494,074 1,595,715 2,058,563 15,445 21,782 15,082
under 12 171,691 2,341 710 4,476 3,560 37,936 67,124 7,133 6,109 20,626 20,763 176 348 389
1 to 42 702,758 9,921 2,893 18,608 15,377 152,066 282,704 29,121 24,680 78,519 85,546 679 1,251 1,393
5 to 9 1,000,126 14,064 4,356 27,097 21,632 221,729 402,518 40,710 34,244 106,548 122,552 956 1,867 1,853
10 to 14 1,086,111 16,901 5,032 31,190 24,583 247,208 424,362 43,214 38,646 115,394 134,712 1,233 1,944 1,692
15 to 19 1,090,073 18,996 5,220 32,472 25,709 233,978 422,453 42,633 40,257 119,502 144,399 1,247 1,752 1,455
20 to 24 1,120,041 17,802 4,655 31,012 26,087 264,448 421,473 41,184 37,261 125,782 146,246 1,067 1,799 1,225
25 to 29 1,075,917 15,541 3,775 28,354 24,166 257,536 413,915 39,558 31,526 123,953 133,664 871 1,756 1,302
30 to 34 1,127,209 16,785 4,276 31,138 25,538 252,212 453,007 39,218 29,851 122,746 148,166 1,109 1,904 1,259
35 to 39 1,250,331 20,004 4,872 35,503 29,300 293,162 503,304 42,344 32,888 125,264 159,388 1,181 1,884 1,237
40 to 44 1,366,129 21,670 5,405 40,050 31,729 328,889 530,862 47,578 39,141 140,663 176,031 1,422 1,855 834
45 to 49 1,252,859 21,577 5,184 37,356 30,944 309,382 465,483 43,574 38,069 130,775 166,708 1,505 1,600 702
50 to 54 1,079,639 20,332 4,865 33,647 27,541 269,527 398,064 37,437 31,796 103,026 150,152 1,322 1,299 631
55 to 59 913,862 17,428 4,313 29,740 23,691 234,020 340,180 31,901 25,619 79,831 124,629 1,031 1,065 414
60 to 64 684,714 12,373 3,141 22,037 17,553 177,851 255,675 23,465 19,947 58,094 93,118 636 542 282
65 to 69 553,269 9,755 2,656 17,968 13,475 136,373 211,664 19,367 17,481 46,786 76,802 406 357 179
70 to 74 485,226 7,884 2,169 14,739 11,522 118,662 186,768 17,459 16,427 40,204 68,714 307 253 118
75 to 79 359,682 5,686 1,531 10,735 8,727 85,022 139,937 13,984 13,519 28,763 51,402 158 161 57
80 to 84 222,542 3,714 1,022 7,254 5,707 48,620 85,512 9,556 9,255 17,847 33,842 84 98 31
85 to 89 97,409 1,499 506 3,531 2,764 20,327 35,488 4,671 5,092 7,993 15,446 34 37 21
90 and over 39,413 614 228 1,464 1,123 7,865 14,072 2,060 2,266 3,399 6,283 21 10 8
Females Total 15,981,465 263,463 70,457 477,794 380,168 3,795,520 6,202,080 585,385 500,354 1,562,926 2,093,726 15,109 20,424 14,059
under 12 163,511 2,288 707 4,174 3,557 35,969 63,803 6,807 5,929 19,661 19,733 159 353 369
1 to 42 670,763 9,752 2,815 18,311 14,213 143,499 272,734 27,674 23,441 74,382 80,676 699 1,316 1,253
5 to 9 952,520 13,118 4,129 25,816 20,501 211,096 387,255 38,501 32,187 99,625 115,637 997 1,841 1,817
10 to 14 1,034,099 16,104 4,868 29,728 23,140 236,002 404,424 41,454 36,683 109,867 127,320 1,111 1,821 1,577
15 to 19 1,033,182 18,097 5,055 30,969 24,230 222,490 400,710 40,678 37,422 112,791 136,537 1,188 1,604 1,411
20 to 24 1,070,431 17,808 4,734 31,147 24,464 250,918 405,888 39,207 34,912 117,793 139,811 987 1,596 1,166
25 to 29 1,045,993 15,750 4,114 29,307 24,360 244,627 408,967 37,615 31,002 114,037 132,316 987 1,693 1,218
30 to 34 1,105,438 18,063 4,332 31,767 25,613 239,890 450,360 37,567 29,367 114,032 150,234 1,174 1,830 1,209
35 to 39 1,235,422 21,093 5,104 35,610 28,816 282,668 502,024 40,764 32,878 120,307 161,927 1,303 1,866 1,062
40 to 44 1,356,581 22,240 5,642 40,257 31,673 324,710 527,994 46,132 38,642 136,782 178,322 1,600 1,773 814
45 to 49 1,265,207 22,287 5,569 38,227 31,062 312,523 474,243 43,191 37,413 125,031 172,068 1,442 1,410 741
50 to 54 1,098,736 20,817 4,992 34,408 28,418 276,083 411,092 38,284 30,976 100,050 150,760 1,155 1,192 509
55 to 59 928,818 17,204 4,269 30,345 23,779 242,423 347,648 32,052 25,119 79,518 124,394 884 760 423
60 to 64 712,128 12,616 3,222 23,088 17,792 188,271 268,023 24,464 20,605 58,393 94,425 499 498 232
65 to 69 596,195 9,990 2,803 18,844 14,525 153,313 229,286 20,788 18,904 48,700 78,273 331 303 135
70 to 74 555,706 8,799 2,452 16,953 13,488 146,050 212,559 20,252 18,443 43,630 72,548 256 222 54
Statistics Canada, Catalogue no. 84-215-X 23

75 to 79 481,491 7,246 2,092 14,800 12,119 122,569 186,391 19,023 16,834 36,168 63,898 144 173 34
80 to 84 361,699 5,505 1,853 12,373 9,557 87,174 136,672 15,700 14,376 27,681 50,590 114 83 21
85 to 89 200,727 3,105 1,073 7,340 5,587 48,498 71,668 9,452 9,561 15,825 28,490 59 57 12
90 and over 112,818 1,581 632 4,330 3,274 26,747 40,339 5,780 5,660 8,653 15,767 20 33 2
1. These postcensal population estimates, which are based on the 2001 census, are adjusted for net census undercoverage and include non–permanent residents.
2. 2003 population counts for the "under 1" and "1 to 4" categories were adjusted for new births by Health Statistics Division.
Sources: "Annual Demographic Statistics, 2004" (Catalogue number 91–213–XPB) and Health Statistics Division, Statistics Canada.
Statistics Canada, Catalogue no. 84-215-X 24
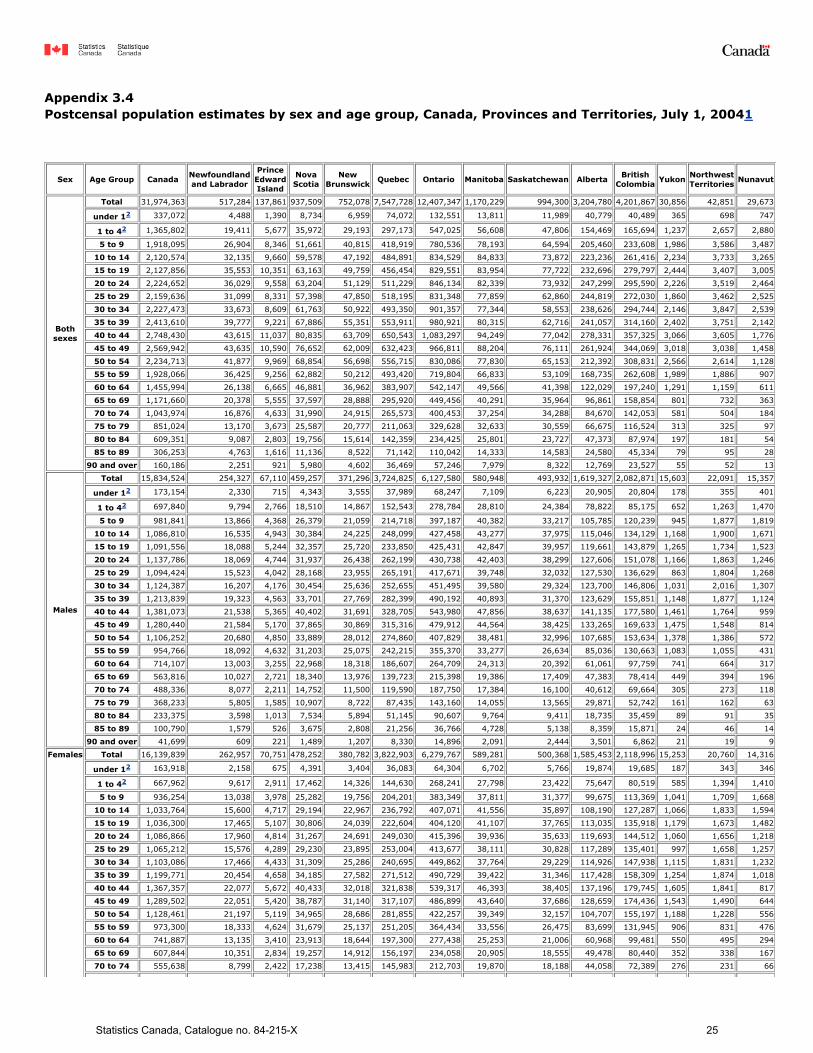
Appendix 3.4 Postcensal population estimates by sex and age group, Canada, Provinces and Territories, July 1, 20041
Sex Age Group Canada Newfoundlandand Labrador
PrinceEdwardIsland
NovaScotia
NewBrunswick Quebec Ontario Manitoba Saskatchewan Alberta British
Colombia Yukon NorthwestTerritories Nunavut
Bothsexes
Total 31,974,363 517,284 137,861 937,509 752,078 7,547,728 12,407,347 1,170,229 994,300 3,204,780 4,201,867 30,856 42,851 29,673
under 12 337,072 4,488 1,390 8,734 6,959 74,072 132,551 13,811 11,989 40,779 40,489 365 698 747
1 to 42 1,365,802 19,411 5,677 35,972 29,193 297,173 547,025 56,608 47,806 154,469 165,694 1,237 2,657 2,880
5 to 9 1,918,095 26,904 8,346 51,661 40,815 418,919 780,536 78,193 64,594 205,460 233,608 1,986 3,586 3,487
10 to 14 2,120,574 32,135 9,660 59,578 47,192 484,891 834,529 84,833 73,872 223,236 261,416 2,234 3,733 3,265
15 to 19 2,127,856 35,553 10,351 63,163 49,759 456,454 829,551 83,954 77,722 232,696 279,797 2,444 3,407 3,005
20 to 24 2,224,652 36,029 9,558 63,204 51,129 511,229 846,134 82,339 73,932 247,299 295,590 2,226 3,519 2,464
25 to 29 2,159,636 31,099 8,331 57,398 47,850 518,195 831,348 77,859 62,860 244,819 272,030 1,860 3,462 2,525
30 to 34 2,227,473 33,673 8,609 61,763 50,922 493,350 901,357 77,344 58,553 238,626 294,744 2,146 3,847 2,539
35 to 39 2,413,610 39,777 9,221 67,886 55,351 553,911 980,921 80,315 62,716 241,057 314,160 2,402 3,751 2,142
40 to 44 2,748,430 43,615 11,037 80,835 63,709 650,543 1,083,297 94,249 77,042 278,331 357,325 3,066 3,605 1,776
45 to 49 2,569,942 43,635 10,590 76,652 62,009 632,423 966,811 88,204 76,111 261,924 344,069 3,018 3,038 1,458
50 to 54 2,234,713 41,877 9,969 68,854 56,698 556,715 830,086 77,830 65,153 212,392 308,831 2,566 2,614 1,128
55 to 59 1,928,066 36,425 9,256 62,882 50,212 493,420 719,804 66,833 53,109 168,735 262,608 1,989 1,886 907
60 to 64 1,455,994 26,138 6,665 46,881 36,962 383,907 542,147 49,566 41,398 122,029 197,240 1,291 1,159 611
65 to 69 1,171,660 20,378 5,555 37,597 28,888 295,920 449,456 40,291 35,964 96,861 158,854 801 732 363
70 to 74 1,043,974 16,876 4,633 31,990 24,915 265,573 400,453 37,254 34,288 84,670 142,053 581 504 184
75 to 79 851,024 13,170 3,673 25,587 20,777 211,063 329,628 32,633 30,559 66,675 116,524 313 325 97
80 to 84 609,351 9,087 2,803 19,756 15,614 142,359 234,425 25,801 23,727 47,373 87,974 197 181 54
85 to 89 306,253 4,763 1,616 11,136 8,522 71,142 110,042 14,333 14,583 24,580 45,334 79 95 28
90 and over 160,186 2,251 921 5,980 4,602 36,469 57,246 7,979 8,322 12,769 23,527 55 52 13
Males
Total 15,834,524 254,327 67,110 459,257 371,296 3,724,825 6,127,580 580,948 493,932 1,619,327 2,082,871 15,603 22,091 15,357
under 12 173,154 2,330 715 4,343 3,555 37,989 68,247 7,109 6,223 20,905 20,804 178 355 401
1 to 42 697,840 9,794 2,766 18,510 14,867 152,543 278,784 28,810 24,384 78,822 85,175 652 1,263 1,470
5 to 9 981,841 13,866 4,368 26,379 21,059 214,718 397,187 40,382 33,217 105,785 120,239 945 1,877 1,819
10 to 14 1,086,810 16,535 4,943 30,384 24,225 248,099 427,458 43,277 37,975 115,046 134,129 1,168 1,900 1,671
15 to 19 1,091,556 18,088 5,244 32,357 25,720 233,850 425,431 42,847 39,957 119,661 143,879 1,265 1,734 1,523
20 to 24 1,137,786 18,069 4,744 31,937 26,438 262,199 430,738 42,403 38,299 127,606 151,078 1,166 1,863 1,246
25 to 29 1,094,424 15,523 4,042 28,168 23,955 265,191 417,671 39,748 32,032 127,530 136,629 863 1,804 1,268
30 to 34 1,124,387 16,207 4,176 30,454 25,636 252,655 451,495 39,580 29,324 123,700 146,806 1,031 2,016 1,307
35 to 39 1,213,839 19,323 4,563 33,701 27,769 282,399 490,192 40,893 31,370 123,629 155,851 1,148 1,877 1,124
40 to 44 1,381,073 21,538 5,365 40,402 31,691 328,705 543,980 47,856 38,637 141,135 177,580 1,461 1,764 959
45 to 49 1,280,440 21,584 5,170 37,865 30,869 315,316 479,912 44,564 38,425 133,265 169,633 1,475 1,548 814
50 to 54 1,106,252 20,680 4,850 33,889 28,012 274,860 407,829 38,481 32,996 107,685 153,634 1,378 1,386 572
55 to 59 954,766 18,092 4,632 31,203 25,075 242,215 355,370 33,277 26,634 85,036 130,663 1,083 1,055 431
60 to 64 714,107 13,003 3,255 22,968 18,318 186,607 264,709 24,313 20,392 61,061 97,759 741 664 317
65 to 69 563,816 10,027 2,721 18,340 13,976 139,723 215,398 19,386 17,409 47,383 78,414 449 394 196
70 to 74 488,336 8,077 2,211 14,752 11,500 119,590 187,750 17,384 16,100 40,612 69,664 305 273 118
75 to 79 368,233 5,805 1,585 10,907 8,722 87,435 143,160 14,055 13,565 29,871 52,742 161 162 63
80 to 84 233,375 3,598 1,013 7,534 5,894 51,145 90,607 9,764 9,411 18,735 35,459 89 91 35
85 to 89 100,790 1,579 526 3,675 2,808 21,256 36,766 4,728 5,138 8,359 15,871 24 46 14
90 and over 41,699 609 221 1,489 1,207 8,330 14,896 2,091 2,444 3,501 6,862 21 19 9
Females Total 16,139,839 262,957 70,751 478,252 380,782 3,822,903 6,279,767 589,281 500,368 1,585,453 2,118,996 15,253 20,760 14,316
under 12 163,918 2,158 675 4,391 3,404 36,083 64,304 6,702 5,766 19,874 19,685 187 343 346
1 to 42 667,962 9,617 2,911 17,462 14,326 144,630 268,241 27,798 23,422 75,647 80,519 585 1,394 1,410
5 to 9 936,254 13,038 3,978 25,282 19,756 204,201 383,349 37,811 31,377 99,675 113,369 1,041 1,709 1,668
10 to 14 1,033,764 15,600 4,717 29,194 22,967 236,792 407,071 41,556 35,897 108,190 127,287 1,066 1,833 1,594
15 to 19 1,036,300 17,465 5,107 30,806 24,039 222,604 404,120 41,107 37,765 113,035 135,918 1,179 1,673 1,482
20 to 24 1,086,866 17,960 4,814 31,267 24,691 249,030 415,396 39,936 35,633 119,693 144,512 1,060 1,656 1,218
25 to 29 1,065,212 15,576 4,289 29,230 23,895 253,004 413,677 38,111 30,828 117,289 135,401 997 1,658 1,257
30 to 34 1,103,086 17,466 4,433 31,309 25,286 240,695 449,862 37,764 29,229 114,926 147,938 1,115 1,831 1,232
35 to 39 1,199,771 20,454 4,658 34,185 27,582 271,512 490,729 39,422 31,346 117,428 158,309 1,254 1,874 1,018
40 to 44 1,367,357 22,077 5,672 40,433 32,018 321,838 539,317 46,393 38,405 137,196 179,745 1,605 1,841 817
45 to 49 1,289,502 22,051 5,420 38,787 31,140 317,107 486,899 43,640 37,686 128,659 174,436 1,543 1,490 644
50 to 54 1,128,461 21,197 5,119 34,965 28,686 281,855 422,257 39,349 32,157 104,707 155,197 1,188 1,228 556
55 to 59 973,300 18,333 4,624 31,679 25,137 251,205 364,434 33,556 26,475 83,699 131,945 906 831 476
60 to 64 741,887 13,135 3,410 23,913 18,644 197,300 277,438 25,253 21,006 60,968 99,481 550 495 294
65 to 69 607,844 10,351 2,834 19,257 14,912 156,197 234,058 20,905 18,555 49,478 80,440 352 338 167
70 to 74 555,638 8,799 2,422 17,238 13,415 145,983 212,703 19,870 18,188 44,058 72,389 276 231 66
Statistics Canada, Catalogue no. 84-215-X 25

75 to 79 482,791 7,365 2,088 14,680 12,055 123,628 186,468 18,578 16,994 36,804 63,782 152 163 34
80 to 84 375,976 5,489 1,790 12,222 9,720 91,214 143,818 16,037 14,316 28,638 52,515 108 90 19
85 to 89 205,463 3,184 1,090 7,461 5,714 49,886 73,276 9,605 9,445 16,221 29,463 55 49 14
90 and over 118,487 1,642 700 4,491 3,395 28,139 42,350 5,888 5,878 9,268 16,665 34 33 4
1. These postcensal population estimates, which are based on the 2001 census, are adjusted for net census undercoverage and include non–permanent residents.
2. 2004 population counts for the "under 1" and "1 to 4" categories were adjusted for new births by Health Statistics Division.
Sources: "Annual Demographic Statistics, 2005" (Catalogue number 91–213–XPB) and Health Statistics Division, Statistics Canada.
Statistics Canada, Catalogue no. 84-215-X 26

Appendix 3.5 Postcensal population estimates by sex and age group, Canada, Provinces and Territories, July 1, 20051
Sex Age Group Canada Newfoundlandand Labrador
PrinceEdwardIsland
NovaScotia
NewBrunswick Quebec Ontario Manitoba Saskatchewan Alberta British
Colombia Yukon NorthwestTerritories Nunavut
Bothsexes
Total 32,299,496 513,962 138,176 936,130 751,481 7,597,768 12,558,669 1,174,148 989,957 3,277,582 4,257,833 31,121 42,629 30,040
under 12 342,176 4,501 1,340 8,557 6,892 76,346 133,760 14,145 11,967 42,110 40,827 320 712 699
1 to 42 1,360,230 18,861 5,600 35,194 28,461 297,055 541,825 55,522 47,377 158,231 165,317 1,317 2,600 2,870
5 to 9 1,884,736 26,392 8,175 50,408 39,827 406,376 769,904 76,793 62,860 205,655 229,409 1,925 3,491 3,521
10 to 14 2,107,333 30,676 9,378 57,641 46,092 478,765 837,452 84,132 71,680 222,021 260,339 2,208 3,671 3,278
15 to 19 2,147,742 34,587 10,320 62,967 49,238 463,826 840,226 84,613 76,917 236,344 279,792 2,404 3,442 3,066
20 to 24 2,245,729 35,168 9,698 63,371 50,806 501,299 861,490 83,412 74,041 254,590 303,512 2,317 3,483 2,542
25 to 29 2,197,797 30,847 8,435 57,359 47,693 530,523 840,117 78,018 63,190 255,263 278,510 1,825 3,464 2,553
30 to 34 2,227,420 32,560 8,543 60,281 50,300 497,660 899,210 77,154 58,307 243,851 291,215 2,055 3,719 2,565
35 to 39 2,367,474 38,271 8,756 64,853 52,972 534,505 966,349 77,911 59,847 241,633 314,174 2,412 3,652 2,139
40 to 44 2,747,206 43,210 10,914 80,106 63,399 644,391 1,094,534 93,092 74,981 277,294 356,928 2,945 3,639 1,773
45 to 49 2,620,511 43,381 10,689 77,142 62,255 640,472 994,366 89,578 76,159 268,772 350,127 3,047 3,013 1,510
50 to 54 2,302,530 42,331 10,037 70,128 57,787 571,002 856,380 79,786 67,637 223,238 317,767 2,666 2,602 1,169
55 to 59 2,012,118 38,077 9,826 65,303 52,580 507,176 751,941 69,704 55,491 179,021 278,021 2,075 1,989 914
60 to 64 1,515,291 27,391 6,900 48,902 38,430 403,040 560,582 51,321 42,343 127,641 205,487 1,405 1,208 641
65 to 69 1,194,137 20,942 5,665 38,296 29,690 303,143 456,243 40,533 36,002 99,189 162,377 880 767 410
70 to 74 1,043,265 16,978 4,718 32,419 24,938 264,806 400,118 36,692 33,552 85,230 142,483 608 523 200
75 to 79 864,867 13,456 3,675 25,628 20,639 215,768 334,139 32,586 30,305 69,059 118,839 355 325 93
80 to 84 625,838 8,920 2,848 19,633 15,855 148,244 242,212 26,060 23,748 48,580 89,280 208 195 55
85 to 89 323,028 5,056 1,687 11,650 8,844 74,711 117,205 14,695 14,839 26,157 47,974 93 91 26
90 and over 170,068 2,357 972 6,292 4,783 38,660 60,616 8,401 8,714 13,703 25,455 56 43 16
Males
Total 15,995,582 252,539 67,228 457,947 370,911 3,749,788 6,201,435 583,156 491,910 1,656,259 2,111,174 15,681 21,994 15,560
under 12 175,376 2,307 682 4,452 3,514 39,202 68,734 7,168 6,035 21,493 20,912 162 377 338
1 to 42 695,847 9,613 2,726 17,749 14,440 152,105 276,956 28,366 24,535 80,850 85,074 680 1,225 1,528
5 to 9 964,274 13,567 4,283 25,640 20,587 208,657 391,314 39,719 32,249 105,706 117,972 909 1,825 1,846
10 to 14 1,080,498 15,859 4,820 29,353 23,649 244,824 429,221 42,943 36,773 114,467 133,901 1,138 1,889 1,661
15 to 19 1,100,600 17,545 5,197 32,225 25,437 237,170 430,848 43,114 39,551 121,409 143,532 1,259 1,748 1,565
20 to 24 1,148,777 17,658 4,860 32,216 26,245 256,787 438,153 42,925 38,542 131,379 155,673 1,215 1,845 1,279
25 to 29 1,112,389 15,350 4,064 28,076 24,019 271,269 421,188 39,816 32,077 132,673 139,938 843 1,810 1,266
30 to 34 1,123,931 15,777 4,125 29,567 25,323 254,528 450,008 39,555 29,273 126,365 145,147 953 2,010 1,300
35 to 39 1,190,816 18,530 4,295 32,135 26,569 273,079 482,397 39,679 29,935 124,442 155,666 1,168 1,809 1,112
40 to 44 1,380,919 21,197 5,379 39,946 31,531 326,546 549,568 47,091 37,492 140,492 177,591 1,384 1,743 959
45 to 49 1,307,643 21,491 5,187 38,043 31,037 319,709 494,831 45,484 38,540 136,484 172,947 1,482 1,536 872
50 to 54 1,139,579 20,890 4,907 34,301 28,497 281,877 421,056 39,472 34,209 113,262 157,709 1,414 1,363 622
55 to 59 995,199 18,858 4,884 32,444 26,114 249,100 370,233 34,603 27,787 90,363 138,181 1,127 1,093 412
60 to 64 744,087 13,598 3,372 24,090 19,068 196,119 274,075 25,347 20,910 64,001 101,655 804 713 335
65 to 69 574,704 10,334 2,767 18,574 14,497 143,532 218,416 19,474 17,416 48,545 80,012 498 420 219
70 to 74 488,911 8,180 2,238 15,049 11,443 119,750 187,684 17,180 15,796 40,882 69,994 321 270 124
75 to 79 378,033 5,916 1,615 11,006 8,734 90,067 146,793 14,171 13,522 31,293 54,508 172 171 65
80 to 84 241,938 3,560 1,054 7,679 6,036 53,959 94,275 9,986 9,493 19,410 36,259 104 89 34
85 to 89 107,303 1,673 535 3,807 2,905 22,618 39,669 4,862 5,193 8,950 17,011 23 44 13
90 and over 44,758 636 238 1,595 1,266 8,890 16,016 2,201 2,582 3,793 7,492 25 14 10
Females Total 16,303,914 261,423 70,948 478,183 380,570 3,847,980 6,357,234 590,992 498,047 1,621,323 2,146,659 15,440 20,635 14,480
under 12 166,800 2,194 658 4,105 3,378 37,144 65,026 6,977 5,932 20,617 19,915 158 335 61
1 to 42 664,383 9,248 2,874 17,445 14,021 144,950 264,869 27,156 22,842 77,381 80,243 637 1,375 1,342
5 to 9 920,462 12,825 3,892 24,768 19,240 197,719 378,590 37,074 30,611 99,949 111,437 1,016 1,666 1,675
10 to 14 1,026,835 14,817 4,558 28,288 22,443 233,941 408,231 41,189 34,907 107,554 126,438 1,070 1,782 1,617
15 to 19 1,047,142 17,042 5,123 30,742 23,801 226,656 409,378 41,499 37,366 114,935 136,260 1,145 1,694 1,501
20 to 24 1,096,952 17,510 4,838 31,155 24,561 244,512 423,337 40,487 35,499 123,211 147,839 1,102 1,638 1,263
25 to 29 1,085,408 15,497 4,371 29,283 23,674 259,254 418,929 38,202 31,113 122,590 138,572 982 1,654 1,287
30 to 34 1,103,489 16,783 4,418 30,714 24,977 243,132 449,202 37,599 29,034 117,486 146,068 1,102 1,709 1,265
35 to 39 1,176,658 19,741 4,461 32,718 26,403 261,426 483,952 38,232 29,912 117,191 158,508 1,244 1,843 1,027
40 to 44 1,366,287 22,013 5,535 40,160 31,868 317,845 544,966 46,001 37,489 136,802 179,337 1,561 1,896 814
45 to 49 1,312,868 21,890 5,502 39,099 31,218 320,763 499,535 44,094 37,619 132,288 177,180 1,565 1,477 638
50 to 54 1,162,951 21,441 5,130 35,827 29,290 289,125 435,324 40,314 33,428 109,976 160,058 1,252 1,239 547
55 to 59 1,016,919 19,219 4,942 32,859 26,466 258,076 381,708 35,101 27,704 88,658 139,840 948 896 502
60 to 64 771,204 13,793 3,528 24,812 19,362 206,921 286,507 25,974 21,433 63,640 103,832 601 495 306
65 to 69 619,433 10,608 2,898 19,722 15,193 159,611 237,827 21,059 18,586 50,644 82,365 382 347 191
70 to 74 554,354 8,798 2,480 17,370 13,495 145,056 212,434 19,512 17,756 44,348 72,489 287 253 76
Statistics Canada, Catalogue no. 84-215-X 27

75 to 79 486,834 7,540 2,060 14,622 11,905 125,701 187,346 18,415 16,783 37,766 64,331 183 154 28
80 to 84 383,900 5,360 1,794 11,954 9,819 94,285 147,937 16,074 14,255 29,170 53,021 104 106 21
85 to 89 215,725 3,383 1,152 7,843 5,939 52,093 77,536 9,833 9,646 17,207 30,963 70 47 13
90 and over 125,310 1,721 734 4,697 3,517 29,770 44,600 6,200 6,132 9,910 17,963 31 29 6
1. These Postcensal population estimates, which are based on the 2001 census, are adjusted for net census undercoverage and include non–permanent residents.
2. 2005 population counts for the "under 1" and "1 to 4" categories were adjusted for new births by Health Statistics Division.
Sources: "Annual Demographic Statistics, 2006" (Catalogue number 91–213–SCB) and Health Statistics Division, Statistics Canada.
Statistics Canada, Catalogue no. 84-215-X 28

Table 1-1Ten leading causes of death by selected age groups, by sex, Canada 1 — All ages2
Deaths
2005 2004 2003 2002 2001
rank 3 number rank 3 number rank 3 number rank 3 number rank 3 number
Both sexesTotal, all causes of death (A00-Y89) ... 230,132 ... 226,584 ... 226,169 ... 223,603 ... 219,538Malignant neoplasms (C00-C97) 1 67,343 1 66,947 1 65,990 1 65,103 1 63,774Diseases of heart (I00-I09, I11, I13, I20-I51) 2 51,574 2 52,000 2 52,974 2 53,355 2 53,717Cerebrovascular diseases (I60-I69) 3 14,054 3 14,626 3 15,283 3 15,453 3 15,452Chronic lower respiratory diseases (J40-J47) 4 10,515 4 10,041 4 10,162 4 9,877 4 9,773Accidents (unintentional injuries) (V01-X59, Y85-Y86) 5 9,506 5 8,986 5 9,047 5 9,050 5 8,521Diabetes mellitus (E10-E14) 6 7,881 6 7,823 6 7,970 6 7,868 6 7,097Influenza and pneumonia (J10-J18) 7 5,845 7 5,729 8 4,957 8 4,725 8 4,776Alzheimer’s disease (G30) 8 5,762 8 5,536 7 5,504 7 5,515 7 5,477Intentional self-harm (suicide) (X60-X84, Y87.0) 9 3,743 9 3,613 9 3,765 9 3,650 9 3,692Nephritis, nephrotic syndrome and nephrosis (N00-N07,
N17-N19, N25-N27) 10 3,643 10 3,541 10 3,503 10 3,437 10 3,221
rank 3 percent rank 3 percent rank 3 percent rank 3 percent rank 3 percent
Total, all causes of death (A00-Y89) ... 100.0 ... 100.0 ... 100.0 ... 100.0 ... 100.0Malignant neoplasms (C00-C97) 1 29.3 1 29.5 1 29.2 1 29.1 1 29.0Diseases of heart (I00-I09, I11, I13, I20-I51) 2 22.4 2 22.9 2 23.4 2 23.9 2 24.5Cerebrovascular diseases (I60-I69) 3 6.1 3 6.5 3 6.8 3 6.9 3 7.0Chronic lower respiratory diseases (J40-J47) 4 4.6 4 4.4 4 4.5 4 4.4 4 4.5Accidents (unintentional injuries) (V01-X59, Y85-Y86) 5 4.1 5 4.0 5 4.0 5 4.0 5 3.9Diabetes mellitus (E10-E14) 6 3.4 6 3.5 6 3.5 6 3.5 6 3.2Influenza and pneumonia (J10-J18) 7 2.5 7 2.5 8 2.2 8 2.1 8 2.2Alzheimer’s disease (G30) 8 2.5 8 2.4 7 2.4 7 2.5 7 2.5Intentional self-harm (suicide) (X60-X84, Y87.0) 9 1.6 9 1.6 9 1.7 9 1.6 9 1.7Nephritis, nephrotic syndrome and nephrosis (N00-N07,
N17-N19, N25-N27) 10 1.6 10 1.6 10 1.5 10 1.5 10 1.5
rank 3age-specific
rate 4 rank 3age-specific
rate 4 rank 3age-specific
rate 4 rank 3age-specific
rate 4 rank 3age-specific
rate 4
Total, all causes of death (A00-Y89) ... 712.5 ... 708.6 ... 714.4 ... 713.0 ... 705.7Malignant neoplasms (C00-C97) 1 208.5 1 209.4 1 208.4 1 207.6 1 205.0Diseases of heart (I00-I09, I11, I13, I20-I51) 2 159.7 2 162.6 2 167.3 2 170.1 2 172.7Cerebrovascular diseases (I60-I69) 3 43.5 3 45.7 3 48.3 3 49.3 3 49.7Chronic lower respiratory diseases (J40-J47) 4 32.6 4 31.4 4 32.1 4 31.5 4 31.4Accidents (unintentional injuries) (V01-X59, Y85-Y86) 5 29.4 5 28.1 5 28.6 5 28.9 5 27.4Diabetes mellitus (E10-E14) 6 24.4 6 24.5 6 25.2 6 25.1 6 22.8Influenza and pneumonia (J10-J18) 7 18.1 7 17.9 8 15.7 8 15.1 8 15.4Alzheimer’s disease (G30) 8 17.8 8 17.3 7 17.4 7 17.6 7 17.6Intentional self-harm (suicide) (X60-X84, Y87.0) 9 11.6 9 11.3 9 11.9 9 11.6 9 11.9Nephritis, nephrotic syndrome and nephrosis (N00-N07,
N17-N19, N25-N27) 10 11.3 10 11.1 10 11.1 10 11.0 10 10.4
See footnotes at the end of the table.
Statistics Canada, Catalogue no. 84-215-X 29
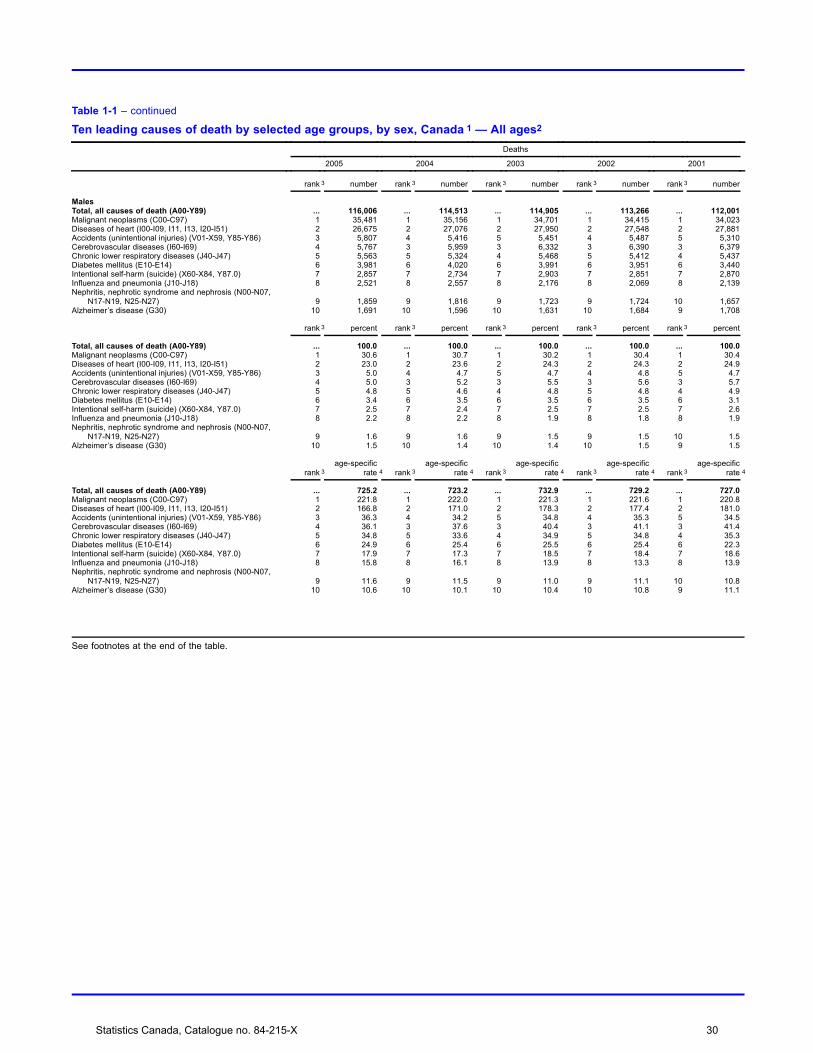
Table 1-1 – continued
Ten leading causes of death by selected age groups, by sex, Canada 1 — All ages2
Deaths
2005 2004 2003 2002 2001
rank 3 number rank 3 number rank 3 number rank 3 number rank 3 number
MalesTotal, all causes of death (A00-Y89) ... 116,006 ... 114,513 ... 114,905 ... 113,266 ... 112,001Malignant neoplasms (C00-C97) 1 35,481 1 35,156 1 34,701 1 34,415 1 34,023Diseases of heart (I00-I09, I11, I13, I20-I51) 2 26,675 2 27,076 2 27,950 2 27,548 2 27,881Accidents (unintentional injuries) (V01-X59, Y85-Y86) 3 5,807 4 5,416 5 5,451 4 5,487 5 5,310Cerebrovascular diseases (I60-I69) 4 5,767 3 5,959 3 6,332 3 6,390 3 6,379Chronic lower respiratory diseases (J40-J47) 5 5,563 5 5,324 4 5,468 5 5,412 4 5,437Diabetes mellitus (E10-E14) 6 3,981 6 4,020 6 3,991 6 3,951 6 3,440Intentional self-harm (suicide) (X60-X84, Y87.0) 7 2,857 7 2,734 7 2,903 7 2,851 7 2,870Influenza and pneumonia (J10-J18) 8 2,521 8 2,557 8 2,176 8 2,069 8 2,139Nephritis, nephrotic syndrome and nephrosis (N00-N07,
N17-N19, N25-N27) 9 1,859 9 1,816 9 1,723 9 1,724 10 1,657Alzheimer’s disease (G30) 10 1,691 10 1,596 10 1,631 10 1,684 9 1,708
rank 3 percent rank 3 percent rank 3 percent rank 3 percent rank 3 percent
Total, all causes of death (A00-Y89) ... 100.0 ... 100.0 ... 100.0 ... 100.0 ... 100.0Malignant neoplasms (C00-C97) 1 30.6 1 30.7 1 30.2 1 30.4 1 30.4Diseases of heart (I00-I09, I11, I13, I20-I51) 2 23.0 2 23.6 2 24.3 2 24.3 2 24.9Accidents (unintentional injuries) (V01-X59, Y85-Y86) 3 5.0 4 4.7 5 4.7 4 4.8 5 4.7Cerebrovascular diseases (I60-I69) 4 5.0 3 5.2 3 5.5 3 5.6 3 5.7Chronic lower respiratory diseases (J40-J47) 5 4.8 5 4.6 4 4.8 5 4.8 4 4.9Diabetes mellitus (E10-E14) 6 3.4 6 3.5 6 3.5 6 3.5 6 3.1Intentional self-harm (suicide) (X60-X84, Y87.0) 7 2.5 7 2.4 7 2.5 7 2.5 7 2.6Influenza and pneumonia (J10-J18) 8 2.2 8 2.2 8 1.9 8 1.8 8 1.9Nephritis, nephrotic syndrome and nephrosis (N00-N07,
N17-N19, N25-N27) 9 1.6 9 1.6 9 1.5 9 1.5 10 1.5Alzheimer’s disease (G30) 10 1.5 10 1.4 10 1.4 10 1.5 9 1.5
rank 3age-specific
rate 4 rank 3age-specific
rate 4 rank 3age-specific
rate 4 rank 3age-specific
rate 4 rank 3age-specific
rate 4
Total, all causes of death (A00-Y89) ... 725.2 ... 723.2 ... 732.9 ... 729.2 ... 727.0Malignant neoplasms (C00-C97) 1 221.8 1 222.0 1 221.3 1 221.6 1 220.8Diseases of heart (I00-I09, I11, I13, I20-I51) 2 166.8 2 171.0 2 178.3 2 177.4 2 181.0Accidents (unintentional injuries) (V01-X59, Y85-Y86) 3 36.3 4 34.2 5 34.8 4 35.3 5 34.5Cerebrovascular diseases (I60-I69) 4 36.1 3 37.6 3 40.4 3 41.1 3 41.4Chronic lower respiratory diseases (J40-J47) 5 34.8 5 33.6 4 34.9 5 34.8 4 35.3Diabetes mellitus (E10-E14) 6 24.9 6 25.4 6 25.5 6 25.4 6 22.3Intentional self-harm (suicide) (X60-X84, Y87.0) 7 17.9 7 17.3 7 18.5 7 18.4 7 18.6Influenza and pneumonia (J10-J18) 8 15.8 8 16.1 8 13.9 8 13.3 8 13.9Nephritis, nephrotic syndrome and nephrosis (N00-N07,
N17-N19, N25-N27) 9 11.6 9 11.5 9 11.0 9 11.1 10 10.8Alzheimer’s disease (G30) 10 10.6 10 10.1 10 10.4 10 10.8 9 11.1
See footnotes at the end of the table.
Statistics Canada, Catalogue no. 84-215-X 30
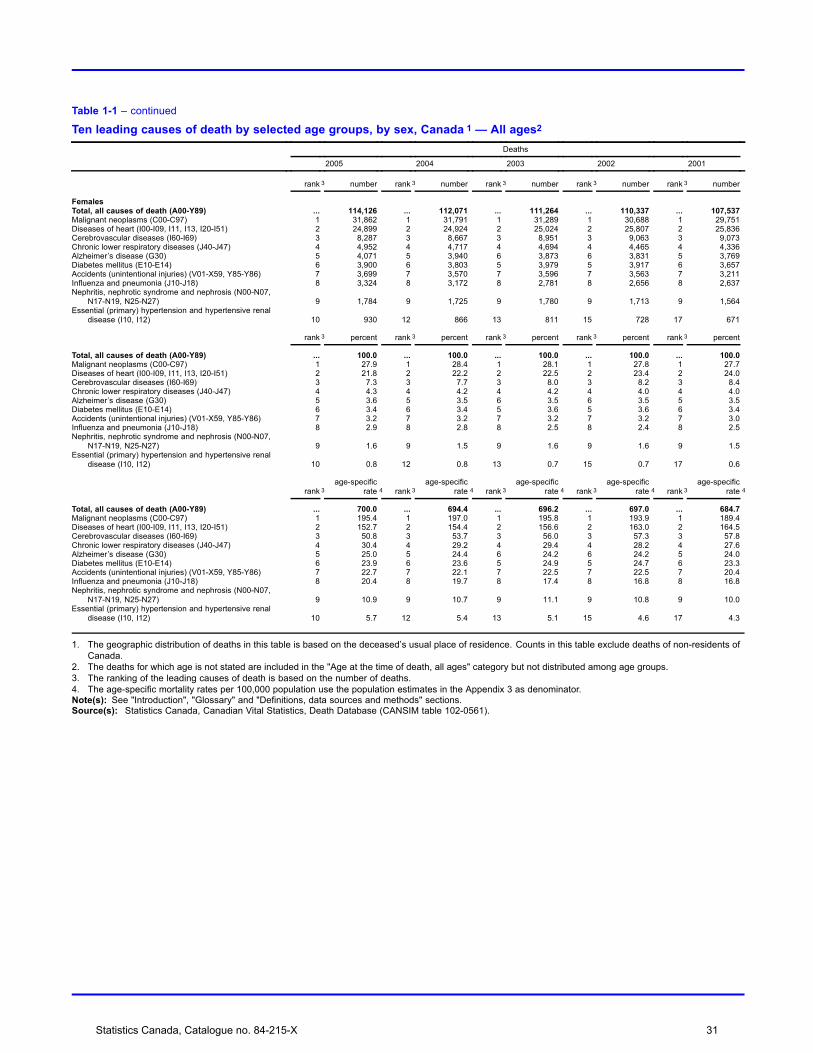
Table 1-1 – continued
Ten leading causes of death by selected age groups, by sex, Canada 1 — All ages2
Deaths
2005 2004 2003 2002 2001
rank 3 number rank 3 number rank 3 number rank 3 number rank 3 number
FemalesTotal, all causes of death (A00-Y89) ... 114,126 ... 112,071 ... 111,264 ... 110,337 ... 107,537Malignant neoplasms (C00-C97) 1 31,862 1 31,791 1 31,289 1 30,688 1 29,751Diseases of heart (I00-I09, I11, I13, I20-I51) 2 24,899 2 24,924 2 25,024 2 25,807 2 25,836Cerebrovascular diseases (I60-I69) 3 8,287 3 8,667 3 8,951 3 9,063 3 9,073Chronic lower respiratory diseases (J40-J47) 4 4,952 4 4,717 4 4,694 4 4,465 4 4,336Alzheimer’s disease (G30) 5 4,071 5 3,940 6 3,873 6 3,831 5 3,769Diabetes mellitus (E10-E14) 6 3,900 6 3,803 5 3,979 5 3,917 6 3,657Accidents (unintentional injuries) (V01-X59, Y85-Y86) 7 3,699 7 3,570 7 3,596 7 3,563 7 3,211Influenza and pneumonia (J10-J18) 8 3,324 8 3,172 8 2,781 8 2,656 8 2,637Nephritis, nephrotic syndrome and nephrosis (N00-N07,
N17-N19, N25-N27) 9 1,784 9 1,725 9 1,780 9 1,713 9 1,564Essential (primary) hypertension and hypertensive renal
disease (I10, I12) 10 930 12 866 13 811 15 728 17 671
rank 3 percent rank 3 percent rank 3 percent rank 3 percent rank 3 percent
Total, all causes of death (A00-Y89) ... 100.0 ... 100.0 ... 100.0 ... 100.0 ... 100.0Malignant neoplasms (C00-C97) 1 27.9 1 28.4 1 28.1 1 27.8 1 27.7Diseases of heart (I00-I09, I11, I13, I20-I51) 2 21.8 2 22.2 2 22.5 2 23.4 2 24.0Cerebrovascular diseases (I60-I69) 3 7.3 3 7.7 3 8.0 3 8.2 3 8.4Chronic lower respiratory diseases (J40-J47) 4 4.3 4 4.2 4 4.2 4 4.0 4 4.0Alzheimer’s disease (G30) 5 3.6 5 3.5 6 3.5 6 3.5 5 3.5Diabetes mellitus (E10-E14) 6 3.4 6 3.4 5 3.6 5 3.6 6 3.4Accidents (unintentional injuries) (V01-X59, Y85-Y86) 7 3.2 7 3.2 7 3.2 7 3.2 7 3.0Influenza and pneumonia (J10-J18) 8 2.9 8 2.8 8 2.5 8 2.4 8 2.5Nephritis, nephrotic syndrome and nephrosis (N00-N07,
N17-N19, N25-N27) 9 1.6 9 1.5 9 1.6 9 1.6 9 1.5Essential (primary) hypertension and hypertensive renal
disease (I10, I12) 10 0.8 12 0.8 13 0.7 15 0.7 17 0.6
rank 3age-specific
rate 4 rank 3age-specific
rate 4 rank 3age-specific
rate 4 rank 3age-specific
rate 4 rank 3age-specific
rate 4
Total, all causes of death (A00-Y89) ... 700.0 ... 694.4 ... 696.2 ... 697.0 ... 684.7Malignant neoplasms (C00-C97) 1 195.4 1 197.0 1 195.8 1 193.9 1 189.4Diseases of heart (I00-I09, I11, I13, I20-I51) 2 152.7 2 154.4 2 156.6 2 163.0 2 164.5Cerebrovascular diseases (I60-I69) 3 50.8 3 53.7 3 56.0 3 57.3 3 57.8Chronic lower respiratory diseases (J40-J47) 4 30.4 4 29.2 4 29.4 4 28.2 4 27.6Alzheimer’s disease (G30) 5 25.0 5 24.4 6 24.2 6 24.2 5 24.0Diabetes mellitus (E10-E14) 6 23.9 6 23.6 5 24.9 5 24.7 6 23.3Accidents (unintentional injuries) (V01-X59, Y85-Y86) 7 22.7 7 22.1 7 22.5 7 22.5 7 20.4Influenza and pneumonia (J10-J18) 8 20.4 8 19.7 8 17.4 8 16.8 8 16.8Nephritis, nephrotic syndrome and nephrosis (N00-N07,
N17-N19, N25-N27) 9 10.9 9 10.7 9 11.1 9 10.8 9 10.0Essential (primary) hypertension and hypertensive renal
disease (I10, I12) 10 5.7 12 5.4 13 5.1 15 4.6 17 4.3
1. The geographic distribution of deaths in this table is based on the deceased’s usual place of residence. Counts in this table exclude deaths of non-residents ofCanada.
2. The deaths for which age is not stated are included in the "Age at the time of death, all ages" category but not distributed among age groups.3. The ranking of the leading causes of death is based on the number of deaths.4. The age-specific mortality rates per 100,000 population use the population estimates in the Appendix 3 as denominator.Note(s): See "Introduction", "Glossary" and "Definitions, data sources and methods" sections.Source(s): Statistics Canada, Canadian Vital Statistics, Death Database (CANSIM table 102-0561).
Statistics Canada, Catalogue no. 84-215-X 31

Table 1-2Ten leading causes of death by selected age groups, by sex, Canada 1 — 1 to 14 years2
Deaths
2005 2004 2003 2002 2001
rank 3 number rank 3 number rank 3 number rank 3 number rank 3 number
Both sexesTotal, all causes of death (A00-Y89) ... 791 ... 740 ... 811 ... 882 ... 871Accidents (unintentional injuries) (V01-X59, Y85-Y86) 1 233 1 229 1 265 1 299 1 286Malignant neoplasms (C00-C97) 2 116 2 133 2 114 2 125 2 146Congenital malformations, deformations and chromosomal
abnormalities (Q00-Q99) 3 68 3 65 3 67 3 75 3 76Intentional self-harm (suicide) (X60-X84, Y87.0) 4 44 4 28 5 27 4 35 5 27Diseases of heart (I00-I09, I11, I13, I20-I51) 5 31 5 26 4 31 6 25 6 26Assault (homicide) (X85-Y09, Y87.1) 6 22 6 24 7 20 5 28 4 30Influenza and pneumonia (J10-J18) 7 17 7 9 6 25 7 14 11 6Cerebrovascular diseases (I60-I69) 8 10 11 4 15 3 10 11 9 12In situ neoplasms, benign neoplasms and neoplasms of
uncertain or unknown behaviour (D00-D48) 9 7 7 9 8 16 7 14 8 13Certain conditions originating in the perinatal period
(P00-P96) 10 6 11 4 10 9 13 5 11 6
rank 3 percent rank 3 percent rank 3 percent rank 3 percent rank 3 percent
Total, all causes of death (A00-Y89) ... 100.0 ... 100.0 ... 100.0 ... 100.0 ... 100.0Accidents (unintentional injuries) (V01-X59, Y85-Y86) 1 29.5 1 30.9 1 32.7 1 33.9 1 32.8Malignant neoplasms (C00-C97) 2 14.7 2 18.0 2 14.1 2 14.2 2 16.8Congenital malformations, deformations and chromosomal
abnormalities (Q00-Q99) 3 8.6 3 8.8 3 8.3 3 8.5 3 8.7Intentional self-harm (suicide) (X60-X84, Y87.0) 4 5.6 4 3.8 5 3.3 4 4.0 5 3.1Diseases of heart (I00-I09, I11, I13, I20-I51) 5 3.9 5 3.5 4 3.8 6 2.8 6 3.0Assault (homicide) (X85-Y09, Y87.1) 6 2.8 6 3.2 7 2.5 5 3.2 4 3.4Influenza and pneumonia (J10-J18) 7 2.1 7 1.2 6 3.1 7 1.6 11 0.7Cerebrovascular diseases (I60-I69) 8 1.3 11 0.5 15 0.4 10 1.2 9 1.4In situ neoplasms, benign neoplasms and neoplasms of
uncertain or unknown behaviour (D00-D48) 9 0.9 7 1.2 8 2.0 7 1.6 8 1.5Certain conditions originating in the perinatal period
(P00-P96) 10 0.8 11 0.5 10 1.1 13 0.6 11 0.7
rank 3age-specific
rate 4 rank 3age-specific
rate 4 rank 3age-specific
rate 4 rank 3age-specific
rate 4 rank 3age-specific
rate 4
Total, all causes of death (A00-Y89) ... 14.8 ... 13.7 ... 14.9 ... 16.0 ... 15.8Accidents (unintentional injuries) (V01-X59, Y85-Y86) 1 4.4 1 4.2 1 4.9 1 5.4 1 5.2Malignant neoplasms (C00-C97) 2 2.2 2 2.5 2 2.1 2 2.3 2 2.7Congenital malformations, deformations and chromosomal
abnormalities (Q00-Q99) 3 1.3 3 1.2 3 1.2 3 1.4 3 1.4Intentional self-harm (suicide) (X60-X84, Y87.0) 4 0.8 4 0.5 5 0.5 4 0.6 5 0.5Diseases of heart (I00-I09, I11, I13, I20-I51) 5 0.6 5 0.5 4 0.6 6 0.5 6 0.5Assault (homicide) (X85-Y09, Y87.1) 6 0.4 6 0.4 7 0.4 5 0.5 4 0.5Influenza and pneumonia (J10-J18) 7 0.3 7 0.2 6 0.5 7 0.3 11 0.1Cerebrovascular diseases (I60-I69) 8 0.2 11 0.1 15 0.1 10 0.2 9 0.2In situ neoplasms, benign neoplasms and neoplasms of
uncertain or unknown behaviour (D00-D48) 9 0.1 7 0.2 8 0.3 7 0.3 8 0.2Certain conditions originating in the perinatal period
(P00-P96) 10 0.1 11 0.1 10 0.2 13 0.1 11 0.1
See footnotes at the end of the table.
Statistics Canada, Catalogue no. 84-215-X 32

Table 1-2 – continued
Ten leading causes of death by selected age groups, by sex, Canada 1 — 1 to 14 years2
Deaths
2005 2004 2003 2002 2001
rank 3 number rank 3 number rank 3 number rank 3 number rank 3 number
MalesTotal, all causes of death (A00-Y89) ... 476 ... 437 ... 483 ... 499 ... 486Accidents (unintentional injuries) (V01-X59, Y85-Y86) 1 146 1 158 1 166 1 186 1 181Malignant neoplasms (C00-C97) 2 64 2 70 2 75 2 66 2 88Congenital malformations, deformations and chromosomal
abnormalities (Q00-Q99) 3 36 3 40 3 35 3 44 3 39Diseases of heart (I00-I09, I11, I13, I20-I51) 4 21 5 16 4 21 5 12 5 13Intentional self-harm (suicide) (X60-X84, Y87.0) 5 19 4 17 5 19 4 18 4 14Assault (homicide) (X85-Y09, Y87.1) 6 13 6 12 6 11 5 12 5 13Influenza and pneumonia (J10-J18) 7 9 7 7 6 11 7 7 11 4In situ neoplasms, benign neoplasms and neoplasms of
uncertain or unknown behaviour (D00-D48) 8 7 8 3 8 7 7 7 9 5Cerebrovascular diseases (I60-I69) 9 6 15 1 21 0 9 5 8 9Septicaemia (A40-A41) 10 4 8 3 13 3 9 5 7 11Anaemias (D50-D64) 10 4 15 1 10 6 12 3 15 2Pneumonitis due to solids and liquids (J69) 10 4 8 3 8 7 16 1 11 4
rank 3 percent rank 3 percent rank 3 percent rank 3 percent rank 3 percent
Total, all causes of death (A00-Y89) ... 100.0 ... 100.0 ... 100.0 ... 100.0 ... 100.0Accidents (unintentional injuries) (V01-X59, Y85-Y86) 1 30.7 1 36.2 1 34.4 1 37.3 1 37.2Malignant neoplasms (C00-C97) 2 13.4 2 16.0 2 15.5 2 13.2 2 18.1Congenital malformations, deformations and chromosomal
abnormalities (Q00-Q99) 3 7.6 3 9.2 3 7.2 3 8.8 3 8.0Diseases of heart (I00-I09, I11, I13, I20-I51) 4 4.4 5 3.7 4 4.3 5 2.4 5 2.7Intentional self-harm (suicide) (X60-X84, Y87.0) 5 4.0 4 3.9 5 3.9 4 3.6 4 2.9Assault (homicide) (X85-Y09, Y87.1) 6 2.7 6 2.7 6 2.3 5 2.4 5 2.7Influenza and pneumonia (J10-J18) 7 1.9 7 1.6 6 2.3 7 1.4 11 0.8In situ neoplasms, benign neoplasms and neoplasms of
uncertain or unknown behaviour (D00-D48) 8 1.5 8 0.7 8 1.4 7 1.4 9 1.0Cerebrovascular diseases (I60-I69) 9 1.3 15 0.2 21 0.0 9 1.0 8 1.9Septicaemia (A40-A41) 10 0.8 8 0.7 13 0.6 9 1.0 7 2.3Anaemias (D50-D64) 10 0.8 15 0.2 10 1.2 12 0.6 15 0.4Pneumonitis due to solids and liquids (J69) 10 0.8 8 0.7 8 1.4 16 0.2 11 0.8
rank 3age-specific
rate 4 rank 3age-specific
rate 4 rank 3age-specific
rate 4 rank 3age-specific
rate 4 rank 3age-specific
rate 4
Total, all causes of death (A00-Y89) ... 17.4 ... 15.8 ... 17.3 ... 17.7 ... 17.2Accidents (unintentional injuries) (V01-X59, Y85-Y86) 1 5.3 1 5.7 1 6.0 1 6.6 1 6.4Malignant neoplasms (C00-C97) 2 2.3 2 2.5 2 2.7 2 2.3 2 3.1Congenital malformations, deformations and chromosomal
abnormalities (Q00-Q99) 3 1.3 3 1.4 3 1.3 3 1.6 3 1.4Diseases of heart (I00-I09, I11, I13, I20-I51) 4 0.8 5 0.6 4 0.8 5 0.4 5 0.5Intentional self-harm (suicide) (X60-X84, Y87.0) 5 0.7 4 0.6 5 0.7 4 0.6 4 0.5Assault (homicide) (X85-Y09, Y87.1) 6 0.5 6 0.4 6 0.4 5 0.4 5 0.5Influenza and pneumonia (J10-J18) 7 0.3 7 0.3 6 0.4 7 0.2 11 0.1In situ neoplasms, benign neoplasms and neoplasms of
uncertain or unknown behaviour (D00-D48) 8 0.3 8 0.1 8 0.3 7 0.2 9 0.2Cerebrovascular diseases (I60-I69) 9 0.2 15 0.0 21 0.0 9 0.2 8 0.3Septicaemia (A40-A41) 10 0.1 8 0.1 13 0.1 9 0.2 7 0.4Anaemias (D50-D64) 10 0.1 15 0.0 10 0.2 12 0.1 15 0.1Pneumonitis due to solids and liquids (J69) 10 0.1 8 0.1 8 0.3 16 0.0 11 0.1
See footnotes at the end of the table.
Statistics Canada, Catalogue no. 84-215-X 33

Table 1-2 – continued
Ten leading causes of death by selected age groups, by sex, Canada 1 — 1 to 14 years2
Deaths
2005 2004 2003 2002 2001
rank 3 number rank 3 number rank 3 number rank 3 number rank 3 number
FemalesTotal, all causes of death (A00-Y89) ... 315 ... 303 ... 328 ... 383 ... 385Accidents (unintentional injuries) (V01-X59, Y85-Y86) 1 87 1 71 1 99 1 113 1 105Malignant neoplasms (C00-C97) 2 52 2 63 2 39 2 59 2 58Congenital malformations, deformations and chromosomal
abnormalities (Q00-Q99) 3 32 3 25 3 32 3 31 3 37Intentional self-harm (suicide) (X60-X84, Y87.0) 4 25 5 11 8 8 4 17 5 13Diseases of heart (I00-I09, I11, I13, I20-I51) 5 10 6 10 5 10 6 13 5 13Assault (homicide) (X85-Y09, Y87.1) 6 9 4 12 6 9 5 16 4 17Influenza and pneumonia (J10-J18) 7 8 12 2 4 14 7 7 14 2Cerebrovascular diseases (I60-I69) 8 4 9 3 12 3 10 6 10 3Certain conditions originating in the perinatal period
(P00-P96) 9 3 12 2 10 5 13 2 16 1Chronic lower respiratory diseases (J40-J47) 10 2 20 0 18 0 20 0 10 3
rank 3 percent rank 3 percent rank 3 percent rank 3 percent rank 3 percent
Total, all causes of death (A00-Y89) ... 100.0 ... 100.0 ... 100.0 ... 100.0 ... 100.0Accidents (unintentional injuries) (V01-X59, Y85-Y86) 1 27.6 1 23.4 1 30.2 1 29.5 1 27.3Malignant neoplasms (C00-C97) 2 16.5 2 20.8 2 11.9 2 15.4 2 15.1Congenital malformations, deformations and chromosomal
abnormalities (Q00-Q99) 3 10.2 3 8.3 3 9.8 3 8.1 3 9.6Intentional self-harm (suicide) (X60-X84, Y87.0) 4 7.9 5 3.6 8 2.4 4 4.4 5 3.4Diseases of heart (I00-I09, I11, I13, I20-I51) 5 3.2 6 3.3 5 3.0 6 3.4 5 3.4Assault (homicide) (X85-Y09, Y87.1) 6 2.9 4 4.0 6 2.7 5 4.2 4 4.4Influenza and pneumonia (J10-J18) 7 2.5 12 0.7 4 4.3 7 1.8 14 0.5Cerebrovascular diseases (I60-I69) 8 1.3 9 1.0 12 0.9 10 1.6 10 0.8Certain conditions originating in the perinatal period
(P00-P96) 9 1.0 12 0.7 10 1.5 13 0.5 16 0.3Chronic lower respiratory diseases (J40-J47) 10 0.6 20 0.0 18 0.0 20 0.0 10 0.8
rank 3age-specific
rate 4 rank 3age-specific
rate 4 rank 3age-specific
rate 4 rank 3age-specific
rate 4 rank 3age-specific
rate 4
Total, all causes of death (A00-Y89) ... 12.1 ... 11.5 ... 12.3 ... 14.3 ... 14.3Accidents (unintentional injuries) (V01-X59, Y85-Y86) 1 3.3 1 2.7 1 3.7 1 4.2 1 3.9Malignant neoplasms (C00-C97) 2 2.0 2 2.4 2 1.5 2 2.2 2 2.2Congenital malformations, deformations and chromosomal
abnormalities (Q00-Q99) 3 1.2 3 0.9 3 1.2 3 1.2 3 1.4Intentional self-harm (suicide) (X60-X84, Y87.0) 4 1.0 5 0.4 8 0.3 4 0.6 5 0.5Diseases of heart (I00-I09, I11, I13, I20-I51) 5 0.4 6 0.4 5 0.4 6 0.5 5 0.5Assault (homicide) (X85-Y09, Y87.1) 6 0.3 4 0.5 6 0.3 5 0.6 4 0.6Influenza and pneumonia (J10-J18) 7 0.3 12 0.1 4 0.5 7 0.3 14 0.1Cerebrovascular diseases (I60-I69) 8 0.2 9 0.1 12 0.1 10 0.2 10 0.1Certain conditions originating in the perinatal period
(P00-P96) 9 0.1 12 0.1 10 0.2 13 0.1 16 0.0Chronic lower respiratory diseases (J40-J47) 10 0.1 20 0.0 18 0.0 20 0.0 10 0.1
1. The geographic distribution of deaths in this table is based on the deceased’s usual place of residence. Counts in this table exclude deaths of non-residents ofCanada.
2. For "Age at time of death, 1 to 14 years", mortality rate calculation uses population estimates for 0 to 14 year olds less the live births of the calendar year.3. The ranking of the leading causes of death is based on the number of deaths.4. The age-specific mortality rates per 100,000 population use the population estimates in the Appendix 3 as denominator.Note(s): See "Introduction", "Glossary" and "Definitions, data sources and methods" sections.Source(s): Statistics Canada, Canadian Vital Statistics, Death Database (CANSIM table 102-0561).
Statistics Canada, Catalogue no. 84-215-X 34

Table 1-3Ten leading causes of death by selected age groups, by sex, Canada 1 — 15 to 24 years
Deaths
2005 2004 2003 2002 2001
rank 2 number rank 2 number rank 2 number rank 2 number rank 2 number
Both sexesTotal, all causes of death (A00-Y89) ... 2,328 ... 2,221 ... 2,299 ... 2,216 ... 2,300Accidents (unintentional injuries) (V01-X59, Y85-Y86) 1 1,015 1 944 1 973 1 968 1 992Intentional self-harm (suicide) (X60-X84, Y87.0) 2 509 2 480 2 522 2 492 2 503Malignant neoplasms (C00-C97) 3 156 3 159 3 172 3 165 3 152Assault (homicide) (X85-Y09, Y87.1) 4 136 4 111 4 126 4 101 4 108Diseases of heart (I00-I09, I11, I13, I20-I51) 5 67 5 58 5 62 5 52 5 60Congenital malformations, deformations and chromosomal
abnormalities (Q00-Q99) 6 34 6 37 6 39 6 44 6 49Diabetes mellitus (E10-E14) 7 18 9 9 10 8 12 7 7 16Influenza and pneumonia (J10-J18) 8 13 8 10 7 9 7 15 11 8Cerebrovascular diseases (I60-I69) 9 11 7 15 7 9 9 11 8 13Chronic lower respiratory diseases (J40-J47) 10 8 10 6 7 9 10 8 8 13
rank 2 percent rank 2 percent rank 2 percent rank 2 percent rank 2 percent
Total, all causes of death (A00-Y89) ... 100.0 ... 100.0 ... 100.0 ... 100.0 ... 100.0Accidents (unintentional injuries) (V01-X59, Y85-Y86) 1 43.6 1 42.5 1 42.3 1 43.7 1 43.1Intentional self-harm (suicide) (X60-X84, Y87.0) 2 21.9 2 21.6 2 22.7 2 22.2 2 21.9Malignant neoplasms (C00-C97) 3 6.7 3 7.2 3 7.5 3 7.4 3 6.6Assault (homicide) (X85-Y09, Y87.1) 4 5.8 4 5.0 4 5.5 4 4.6 4 4.7Diseases of heart (I00-I09, I11, I13, I20-I51) 5 2.9 5 2.6 5 2.7 5 2.3 5 2.6Congenital malformations, deformations and chromosomal
abnormalities (Q00-Q99) 6 1.5 6 1.7 6 1.7 6 2.0 6 2.1Diabetes mellitus (E10-E14) 7 0.8 9 0.4 10 0.3 12 0.3 7 0.7Influenza and pneumonia (J10-J18) 8 0.6 8 0.5 7 0.4 7 0.7 11 0.3Cerebrovascular diseases (I60-I69) 9 0.5 7 0.7 7 0.4 9 0.5 8 0.6Chronic lower respiratory diseases (J40-J47) 10 0.3 10 0.3 7 0.4 10 0.4 8 0.6
rank 2age-specific
rate 3 rank 2age-specific
rate 3 rank 2age-specific
rate 3 rank 2age-specific
rate 3 rank 2age-specific
rate 3
Total, all causes of death (A00-Y89) ... 53.0 ... 51.0 ... 53.3 ... 51.8 ... 54.7Accidents (unintentional injuries) (V01-X59, Y85-Y86) 1 23.1 1 21.7 1 22.6 1 22.6 1 23.6Intentional self-harm (suicide) (X60-X84, Y87.0) 2 11.6 2 11.0 2 12.1 2 11.5 2 12.0Malignant neoplasms (C00-C97) 3 3.6 3 3.7 3 4.0 3 3.9 3 3.6Assault (homicide) (X85-Y09, Y87.1) 4 3.1 4 2.6 4 2.9 4 2.4 4 2.6Diseases of heart (I00-I09, I11, I13, I20-I51) 5 1.5 5 1.3 5 1.4 5 1.2 5 1.4Congenital malformations, deformations and chromosomal
abnormalities (Q00-Q99) 6 0.8 6 0.9 6 0.9 6 1.0 6 1.2Diabetes mellitus (E10-E14) 7 0.4 9 0.2 10 0.2 12 0.2 7 0.4Influenza and pneumonia (J10-J18) 8 0.3 8 0.2 7 0.2 7 0.4 11 0.2Cerebrovascular diseases (I60-I69) 9 0.3 7 0.3 7 0.2 9 0.3 8 0.3Chronic lower respiratory diseases (J40-J47) 10 0.2 10 0.1 7 0.2 10 0.2 8 0.3
See footnotes at the end of the table.
Statistics Canada, Catalogue no. 84-215-X 35

Table 1-3 – continued
Ten leading causes of death by selected age groups, by sex, Canada 1 — 15 to 24 yearsDeaths
2005 2004 2003 2002 2001
rank 2 number rank 2 number rank 2 number rank 2 number rank 2 number
MalesTotal, all causes of death (A00-Y89) ... 1,645 ... 1,604 ... 1,669 ... 1,559 ... 1,671Accidents (unintentional injuries) (V01-X59, Y85-Y86) 1 753 1 701 1 745 1 709 1 763Intentional self-harm (suicide) (X60-X84, Y87.0) 2 378 2 379 2 409 2 384 2 398Assault (homicide) (X85-Y09, Y87.1) 3 114 4 93 4 102 4 76 4 91Malignant neoplasms (C00-C97) 4 87 3 96 3 103 3 81 3 93Diseases of heart (I00-I09, I11, I13, I20-I51) 5 44 5 33 5 38 5 35 5 33Congenital malformations, deformations and chromosomal
abnormalities (Q00-Q99) 6 16 6 24 6 24 6 19 6 26Diabetes mellitus (E10-E14) 7 10 9 4 9 4 10 5 7 10Influenza and pneumonia (J10-J18) 8 9 8 6 8 6 7 8 11 4Cerebrovascular diseases (I60-I69) 9 8 7 9 9 4 9 7 9 8Septicaemia (A40-A41) 10 5 15 2 11 3 17 1 15 2
rank 2 percent rank 2 percent rank 2 percent rank 2 percent rank 2 percent
Total, all causes of death (A00-Y89) ... 100.0 ... 100.0 ... 100.0 ... 100.0 ... 100.0Accidents (unintentional injuries) (V01-X59, Y85-Y86) 1 45.8 1 43.7 1 44.6 1 45.5 1 45.7Intentional self-harm (suicide) (X60-X84, Y87.0) 2 23.0 2 23.6 2 24.5 2 24.6 2 23.8Assault (homicide) (X85-Y09, Y87.1) 3 6.9 4 5.8 4 6.1 4 4.9 4 5.4Malignant neoplasms (C00-C97) 4 5.3 3 6.0 3 6.2 3 5.2 3 5.6Diseases of heart (I00-I09, I11, I13, I20-I51) 5 2.7 5 2.1 5 2.3 5 2.2 5 2.0Congenital malformations, deformations and chromosomal
abnormalities (Q00-Q99) 6 1.0 6 1.5 6 1.4 6 1.2 6 1.6Diabetes mellitus (E10-E14) 7 0.6 9 0.2 9 0.2 10 0.3 7 0.6Influenza and pneumonia (J10-J18) 8 0.5 8 0.4 8 0.4 7 0.5 11 0.2Cerebrovascular diseases (I60-I69) 9 0.5 7 0.6 9 0.2 9 0.4 9 0.5Septicaemia (A40-A41) 10 0.3 15 0.1 11 0.2 17 0.1 15 0.1
rank 2age-specific
rate 3 rank 2age-specific
rate 3 rank 2age-specific
rate 3 rank 2age-specific
rate 3 rank 2age-specific
rate 3
Total, all causes of death (A00-Y89) ... 73.1 ... 71.9 ... 75.5 ... 71.1 ... 77.6Accidents (unintentional injuries) (V01-X59, Y85-Y86) 1 33.5 1 31.4 1 33.7 1 32.3 1 35.4Intentional self-harm (suicide) (X60-X84, Y87.0) 2 16.8 2 17.0 2 18.5 2 17.5 2 18.5Assault (homicide) (X85-Y09, Y87.1) 3 5.1 4 4.2 4 4.6 4 3.5 4 4.2Malignant neoplasms (C00-C97) 4 3.9 3 4.3 3 4.7 3 3.7 3 4.3Diseases of heart (I00-I09, I11, I13, I20-I51) 5 2.0 5 1.5 5 1.7 5 1.6 5 1.5Congenital malformations, deformations and chromosomal
abnormalities (Q00-Q99) 6 0.7 6 1.1 6 1.1 6 0.9 6 1.2Diabetes mellitus (E10-E14) 7 0.4 9 0.2 9 0.2 10 0.2 7 0.5Influenza and pneumonia (J10-J18) 8 0.4 8 0.3 8 0.3 7 0.4 11 0.2Cerebrovascular diseases (I60-I69) 9 0.4 7 0.4 9 0.2 9 0.3 9 0.4Septicaemia (A40-A41) 10 0.2 15 0.1 11 0.1 17 0.0 15 0.1
See footnotes at the end of the table.
Statistics Canada, Catalogue no. 84-215-X 36

Table 1-3 – continued
Ten leading causes of death by selected age groups, by sex, Canada 1 — 15 to 24 yearsDeaths
2005 2004 2003 2002 2001
rank 2 number rank 2 number rank 2 number rank 2 number rank 2 number
FemalesTotal, all causes of death (A00-Y89) ... 683 ... 617 ... 630 ... 657 ... 629Accidents (unintentional injuries) (V01-X59, Y85-Y86) 1 262 1 243 1 228 1 259 1 229Intentional self-harm (suicide) (X60-X84, Y87.0) 2 131 2 101 2 113 2 108 2 105Malignant neoplasms (C00-C97) 3 69 3 63 3 69 3 84 3 59Diseases of heart (I00-I09, I11, I13, I20-I51) 4 23 4 25 4 24 6 17 4 27Assault (homicide) (X85-Y09, Y87.1) 5 22 5 18 4 24 4 25 6 17Congenital malformations, deformations and chromosomal
abnormalities (Q00-Q99) 6 18 6 13 6 15 4 25 5 23Diabetes mellitus (E10-E14) 7 8 8 5 11 4 13 2 7 6Chronic lower respiratory diseases (J40-J47) 8 5 11 3 7 7 8 6 7 6Pregnancy, childbirth and the puerperium (O00-O99) 8 5 8 5 16 2 15 1 10 4Human immunodeficiency virus [HIV] disease (B20-B24) 10 4 13 2 18 1 20 0 17 1Influenza and pneumonia (J10-J18) 10 4 10 4 14 3 7 7 10 4
rank 2 percent rank 2 percent rank 2 percent rank 2 percent rank 2 percent
Total, all causes of death (A00-Y89) ... 100.0 ... 100.0 ... 100.0 ... 100.0 ... 100.0Accidents (unintentional injuries) (V01-X59, Y85-Y86) 1 38.4 1 39.4 1 36.2 1 39.4 1 36.4Intentional self-harm (suicide) (X60-X84, Y87.0) 2 19.2 2 16.4 2 17.9 2 16.4 2 16.7Malignant neoplasms (C00-C97) 3 10.1 3 10.2 3 11.0 3 12.8 3 9.4Diseases of heart (I00-I09, I11, I13, I20-I51) 4 3.4 4 4.1 4 3.8 6 2.6 4 4.3Assault (homicide) (X85-Y09, Y87.1) 5 3.2 5 2.9 4 3.8 4 3.8 6 2.7Congenital malformations, deformations and chromosomal
abnormalities (Q00-Q99) 6 2.6 6 2.1 6 2.4 4 3.8 5 3.7Diabetes mellitus (E10-E14) 7 1.2 8 0.8 11 0.6 13 0.3 7 1.0Chronic lower respiratory diseases (J40-J47) 8 0.7 11 0.5 7 1.1 8 0.9 7 1.0Pregnancy, childbirth and the puerperium (O00-O99) 8 0.7 8 0.8 16 0.3 15 0.2 10 0.6Human immunodeficiency virus [HIV] disease (B20-B24) 10 0.6 13 0.3 18 0.2 20 0.0 17 0.2Influenza and pneumonia (J10-J18) 10 0.6 10 0.6 14 0.5 7 1.1 10 0.6
rank 2age-specific
rate 3 rank 2age-specific
rate 3 rank 2age-specific
rate 3 rank 2age-specific
rate 3 rank 2age-specific
rate 3
Total, all causes of death (A00-Y89) ... 31.9 ... 29.1 ... 29.9 ... 31.5 ... 30.7Accidents (unintentional injuries) (V01-X59, Y85-Y86) 1 12.2 1 11.4 1 10.8 1 12.4 1 11.2Intentional self-harm (suicide) (X60-X84, Y87.0) 2 6.1 2 4.8 2 5.4 2 5.2 2 5.1Malignant neoplasms (C00-C97) 3 3.2 3 3.0 3 3.3 3 4.0 3 2.9Diseases of heart (I00-I09, I11, I13, I20-I51) 4 1.1 4 1.2 4 1.1 6 0.8 4 1.3Assault (homicide) (X85-Y09, Y87.1) 5 1.0 5 0.8 4 1.1 4 1.2 6 0.8Congenital malformations, deformations and chromosomal
abnormalities (Q00-Q99) 6 0.8 6 0.6 6 0.7 4 1.2 5 1.1Diabetes mellitus (E10-E14) 7 0.4 8 0.2 11 0.2 13 0.1 7 0.3Chronic lower respiratory diseases (J40-J47) 8 0.2 11 0.1 7 0.3 8 0.3 7 0.3Pregnancy, childbirth and the puerperium (O00-O99) 8 0.2 8 0.2 16 0.1 15 0.0 10 0.2Human immunodeficiency virus [HIV] disease (B20-B24) 10 0.2 13 0.1 18 0.0 20 0.0 17 0.0Influenza and pneumonia (J10-J18) 10 0.2 10 0.2 14 0.1 7 0.3 10 0.2
1. The geographic distribution of deaths in this table is based on the deceased’s usual place of residence. Counts in this table exclude deaths of non-residents ofCanada.
2. The ranking of the leading causes of death is based on the number of deaths.3. The age-specific mortality rates per 100,000 population use the population estimates in the Appendix 3 as denominator.Note(s): See "Introduction", "Glossary" and "Definitions, data sources and methods" sections.Source(s): Statistics Canada, Canadian Vital Statistics, Death Database (CANSIM table 102-0561).
Statistics Canada, Catalogue no. 84-215-X 37

Table 1-4Ten leading causes of death by selected age groups, by sex, Canada 1 — 25 to 34 years
Deaths
2005 2004 2003 2002 2001
rank 2 number rank 2 number rank 2 number rank 2 number rank 2 number
Both sexesTotal, all causes of death (A00-Y89) ... 2,806 ... 2,718 ... 2,693 ... 2,709 ... 2,854Accidents (unintentional injuries) (V01-X59, Y85-Y86) 1 827 1 766 1 778 1 768 1 827Intentional self-harm (suicide) (X60-X84, Y87.0) 2 511 2 591 2 540 2 590 2 614Malignant neoplasms (C00-C97) 3 346 3 358 3 347 3 357 3 395Diseases of heart (I00-I09, I11, I13, I20-I51) 4 173 4 153 4 145 4 136 4 135Assault (homicide) (X85-Y09, Y87.1) 5 142 5 118 5 85 5 106 5 94Human immunodeficiency virus [HIV] disease (B20-B24) 6 51 7 35 6 48 6 40 6 56Cerebrovascular diseases (I60-I69) 7 39 9 33 9 28 8 39 7 44Congenital malformations, deformations and chromosomal
abnormalities (Q00-Q99) 8 32 6 41 7 40 6 40 8 39Diabetes mellitus (E10-E14) 9 30 8 34 8 36 9 36 9 31Influenza and pneumonia (J10-J18) 10 16 10 22 12 17 11 17 14 13Chronic liver disease and cirrhosis (K70, K73-K74) 10 16 11 15 10 25 10 20 10 19
rank 2 percent rank 2 percent rank 2 percent rank 2 percent rank 2 percent
Total, all causes of death (A00-Y89) ... 100.0 ... 100.0 ... 100.0 ... 100.0 ... 100.0Accidents (unintentional injuries) (V01-X59, Y85-Y86) 1 29.5 1 28.2 1 28.9 1 28.3 1 29.0Intentional self-harm (suicide) (X60-X84, Y87.0) 2 18.2 2 21.7 2 20.1 2 21.8 2 21.5Malignant neoplasms (C00-C97) 3 12.3 3 13.2 3 12.9 3 13.2 3 13.8Diseases of heart (I00-I09, I11, I13, I20-I51) 4 6.2 4 5.6 4 5.4 4 5.0 4 4.7Assault (homicide) (X85-Y09, Y87.1) 5 5.1 5 4.3 5 3.2 5 3.9 5 3.3Human immunodeficiency virus [HIV] disease (B20-B24) 6 1.8 7 1.3 6 1.8 6 1.5 6 2.0Cerebrovascular diseases (I60-I69) 7 1.4 9 1.2 9 1.0 8 1.4 7 1.5Congenital malformations, deformations and chromosomal
abnormalities (Q00-Q99) 8 1.1 6 1.5 7 1.5 6 1.5 8 1.4Diabetes mellitus (E10-E14) 9 1.1 8 1.3 8 1.3 9 1.3 9 1.1Influenza and pneumonia (J10-J18) 10 0.6 10 0.8 12 0.6 11 0.6 14 0.5Chronic liver disease and cirrhosis (K70, K73-K74) 10 0.6 11 0.6 10 0.9 10 0.7 10 0.7
rank 2age-specific
rate 3 rank 2age-specific
rate 3 rank 2age-specific
rate 3 rank 2age-specific
rate 3 rank 2age-specific
rate 3
Total, all causes of death (A00-Y89) ... 63.4 ... 62.0 ... 61.8 ... 62.5 ... 64.9Accidents (unintentional injuries) (V01-X59, Y85-Y86) 1 18.7 1 17.5 1 17.9 1 17.7 1 18.8Intentional self-harm (suicide) (X60-X84, Y87.0) 2 11.5 2 13.5 2 12.4 2 13.6 2 14.0Malignant neoplasms (C00-C97) 3 7.8 3 8.2 3 8.0 3 8.2 3 9.0Diseases of heart (I00-I09, I11, I13, I20-I51) 4 3.9 4 3.5 4 3.3 4 3.1 4 3.1Assault (homicide) (X85-Y09, Y87.1) 5 3.2 5 2.7 5 2.0 5 2.4 5 2.1Human immunodeficiency virus [HIV] disease (B20-B24) 6 1.2 7 0.8 6 1.1 6 0.9 6 1.3Cerebrovascular diseases (I60-I69) 7 0.9 9 0.8 9 0.6 8 0.9 7 1.0Congenital malformations, deformations and chromosomal
abnormalities (Q00-Q99) 8 0.7 6 0.9 7 0.9 6 0.9 8 0.9Diabetes mellitus (E10-E14) 9 0.7 8 0.8 8 0.8 9 0.8 9 0.7Influenza and pneumonia (J10-J18) 10 0.4 10 0.5 12 0.4 11 0.4 14 0.3Chronic liver disease and cirrhosis (K70, K73-K74) 10 0.4 11 0.3 10 0.6 10 0.5 10 0.4
See footnotes at the end of the table.
Statistics Canada, Catalogue no. 84-215-X 38

Table 1-4 – continued
Ten leading causes of death by selected age groups, by sex, Canada 1 — 25 to 34 yearsDeaths
2005 2004 2003 2002 2001
rank 2 number rank 2 number rank 2 number rank 2 number rank 2 number
MalesTotal, all causes of death (A00-Y89) ... 1,963 ... 1,882 ... 1,821 ... 1,868 ... 1,987Accidents (unintentional injuries) (V01-X59, Y85-Y86) 1 643 1 587 1 609 1 611 1 660Intentional self-harm (suicide) (X60-X84, Y87.0) 2 415 2 477 2 426 2 466 2 500Malignant neoplasms (C00-C97) 3 176 3 174 3 162 3 176 3 192Diseases of heart (I00-I09, I11, I13, I20-I51) 4 123 4 106 4 105 4 91 4 78Assault (homicide) (X85-Y09, Y87.1) 5 116 5 86 5 61 5 76 5 72Human immunodeficiency virus [HIV] disease (B20-B24) 6 32 6 23 6 31 6 30 6 43Diabetes mellitus (E10-E14) 7 22 9 18 8 17 8 22 7 26Congenital malformations, deformations and chromosomal
abnormalities (Q00-Q99) 8 21 6 23 7 22 9 16 8 23Cerebrovascular diseases (I60-I69) 9 20 8 19 11 11 7 23 9 18Chronic liver disease and cirrhosis (K70, K73-K74) 10 10 12 7 9 13 12 10 10 13
rank 2 percent rank 2 percent rank 2 percent rank 2 percent rank 2 percent
Total, all causes of death (A00-Y89) ... 100.0 ... 100.0 ... 100.0 ... 100.0 ... 100.0Accidents (unintentional injuries) (V01-X59, Y85-Y86) 1 32.8 1 31.2 1 33.4 1 32.7 1 33.2Intentional self-harm (suicide) (X60-X84, Y87.0) 2 21.1 2 25.3 2 23.4 2 24.9 2 25.2Malignant neoplasms (C00-C97) 3 9.0 3 9.2 3 8.9 3 9.4 3 9.7Diseases of heart (I00-I09, I11, I13, I20-I51) 4 6.3 4 5.6 4 5.8 4 4.9 4 3.9Assault (homicide) (X85-Y09, Y87.1) 5 5.9 5 4.6 5 3.3 5 4.1 5 3.6Human immunodeficiency virus [HIV] disease (B20-B24) 6 1.6 6 1.2 6 1.7 6 1.6 6 2.2Diabetes mellitus (E10-E14) 7 1.1 9 1.0 8 0.9 8 1.2 7 1.3Congenital malformations, deformations and chromosomal
abnormalities (Q00-Q99) 8 1.1 6 1.2 7 1.2 9 0.9 8 1.2Cerebrovascular diseases (I60-I69) 9 1.0 8 1.0 11 0.6 7 1.2 9 0.9Chronic liver disease and cirrhosis (K70, K73-K74) 10 0.5 12 0.4 9 0.7 12 0.5 10 0.7
rank 2age-specific
rate 3 rank 2age-specific
rate 3 rank 2age-specific
rate 3 rank 2age-specific
rate 3 rank 2age-specific
rate 3
Total, all causes of death (A00-Y89) ... 87.8 ... 84.8 ... 82.7 ... 85.2 ... 89.3Accidents (unintentional injuries) (V01-X59, Y85-Y86) 1 28.8 1 26.5 1 27.6 1 27.9 1 29.7Intentional self-harm (suicide) (X60-X84, Y87.0) 2 18.6 2 21.5 2 19.3 2 21.3 2 22.5Malignant neoplasms (C00-C97) 3 7.9 3 7.8 3 7.4 3 8.0 3 8.6Diseases of heart (I00-I09, I11, I13, I20-I51) 4 5.5 4 4.8 4 4.8 4 4.2 4 3.5Assault (homicide) (X85-Y09, Y87.1) 5 5.2 5 3.9 5 2.8 5 3.5 5 3.2Human immunodeficiency virus [HIV] disease (B20-B24) 6 1.4 6 1.0 6 1.4 6 1.4 6 1.9Diabetes mellitus (E10-E14) 7 1.0 9 0.8 8 0.8 8 1.0 7 1.2Congenital malformations, deformations and chromosomal
abnormalities (Q00-Q99) 8 0.9 6 1.0 7 1.0 9 0.7 8 1.0Cerebrovascular diseases (I60-I69) 9 0.9 8 0.9 11 0.5 7 1.0 9 0.8Chronic liver disease and cirrhosis (K70, K73-K74) 10 0.4 12 0.3 9 0.6 12 0.5 10 0.6
See footnotes at the end of the table.
Statistics Canada, Catalogue no. 84-215-X 39

Table 1-4 – continued
Ten leading causes of death by selected age groups, by sex, Canada 1 — 25 to 34 yearsDeaths
2005 2004 2003 2002 2001
rank 2 number rank 2 number rank 2 number rank 2 number rank 2 number
FemalesTotal, all causes of death (A00-Y89) ... 843 ... 836 ... 872 ... 841 ... 867Accidents (unintentional injuries) (V01-X59, Y85-Y86) 1 184 2 179 2 169 2 157 2 167Malignant neoplasms (C00-C97) 2 170 1 184 1 185 1 181 1 203Intentional self-harm (suicide) (X60-X84, Y87.0) 3 96 3 114 3 114 3 124 3 114Diseases of heart (I00-I09, I11, I13, I20-I51) 4 50 4 47 4 40 4 45 4 57Assault (homicide) (X85-Y09, Y87.1) 5 26 5 32 5 24 5 30 6 22Human immunodeficiency virus [HIV] disease (B20-B24) 6 19 9 12 8 17 9 10 8 13Cerebrovascular diseases (I60-I69) 6 19 8 14 8 17 7 16 5 26Pregnancy, childbirth and the puerperium (O00-O99) 8 15 10 9 10 16 9 10 9 10Congenital malformations, deformations and chromosomal
abnormalities (Q00-Q99) 9 11 6 18 7 18 6 24 7 16Chronic lower respiratory diseases (J40-J47) 10 9 15 3 14 7 15 3 14 5
rank 2 percent rank 2 percent rank 2 percent rank 2 percent rank 2 percent
Total, all causes of death (A00-Y89) ... 100.0 ... 100.0 ... 100.0 ... 100.0 ... 100.0Accidents (unintentional injuries) (V01-X59, Y85-Y86) 1 21.8 2 21.4 2 19.4 2 18.7 2 19.3Malignant neoplasms (C00-C97) 2 20.2 1 22.0 1 21.2 1 21.5 1 23.4Intentional self-harm (suicide) (X60-X84, Y87.0) 3 11.4 3 13.6 3 13.1 3 14.7 3 13.1Diseases of heart (I00-I09, I11, I13, I20-I51) 4 5.9 4 5.6 4 4.6 4 5.4 4 6.6Assault (homicide) (X85-Y09, Y87.1) 5 3.1 5 3.8 5 2.8 5 3.6 6 2.5Human immunodeficiency virus [HIV] disease (B20-B24) 6 2.3 9 1.4 8 1.9 9 1.2 8 1.5Cerebrovascular diseases (I60-I69) 6 2.3 8 1.7 8 1.9 7 1.9 5 3.0Pregnancy, childbirth and the puerperium (O00-O99) 8 1.8 10 1.1 10 1.8 9 1.2 9 1.2Congenital malformations, deformations and chromosomal
abnormalities (Q00-Q99) 9 1.3 6 2.2 7 2.1 6 2.9 7 1.8Chronic lower respiratory diseases (J40-J47) 10 1.1 15 0.4 14 0.8 15 0.4 14 0.6
rank 2age-specific
rate 3 rank 2age-specific
rate 3 rank 2age-specific
rate 3 rank 2age-specific
rate 3 rank 2age-specific
rate 3
Total, all causes of death (A00-Y89) ... 38.5 ... 38.6 ... 40.5 ... 39.3 ... 39.9Accidents (unintentional injuries) (V01-X59, Y85-Y86) 1 8.4 2 8.3 2 7.9 2 7.3 2 7.7Malignant neoplasms (C00-C97) 2 7.8 1 8.5 1 8.6 1 8.5 1 9.3Intentional self-harm (suicide) (X60-X84, Y87.0) 3 4.4 3 5.3 3 5.3 3 5.8 3 5.2Diseases of heart (I00-I09, I11, I13, I20-I51) 4 2.3 4 2.2 4 1.9 4 2.1 4 2.6Assault (homicide) (X85-Y09, Y87.1) 5 1.2 5 1.5 5 1.1 5 1.4 6 1.0Human immunodeficiency virus [HIV] disease (B20-B24) 6 0.9 9 0.6 8 0.8 9 0.5 8 0.6Cerebrovascular diseases (I60-I69) 6 0.9 8 0.6 8 0.8 7 0.7 5 1.2Pregnancy, childbirth and the puerperium (O00-O99) 8 0.7 10 0.4 10 0.7 9 0.5 9 0.5Congenital malformations, deformations and chromosomal
abnormalities (Q00-Q99) 9 0.5 6 0.8 7 0.8 6 1.1 7 0.7Chronic lower respiratory diseases (J40-J47) 10 0.4 15 0.1 14 0.3 15 0.1 14 0.2
1. The geographic distribution of deaths in this table is based on the deceased’s usual place of residence. Counts in this table exclude deaths of non-residents ofCanada.
2. The ranking of the leading causes of death is based on the number of deaths.3. The age-specific mortality rates per 100,000 population use the population estimates in the Appendix 3 as denominator.Note(s): See "Introduction", "Glossary" and "Definitions, data sources and methods" sections.Source(s): Statistics Canada, Canadian Vital Statistics, Death Database (CANSIM table 102-0561).
Statistics Canada, Catalogue no. 84-215-X 40

Table 1-5Ten leading causes of death by selected age groups, by sex, Canada 1 — 35 to 44 years
Deaths
2005 2004 2003 2002 2001
rank 2 number rank 2 number rank 2 number rank 2 number rank 2 number
Both sexesTotal, all causes of death (A00-Y89) ... 6,051 ... 5,977 ... 6,315 ... 6,350 ... 6,478Malignant neoplasms (C00-C97) 1 1,490 1 1,606 1 1,613 1 1,637 1 1,747Accidents (unintentional injuries) (V01-X59, Y85-Y86) 2 971 2 954 2 1,042 2 1,155 2 1,060Intentional self-harm (suicide) (X60-X84, Y87.0) 3 876 3 799 3 897 3 847 3 893Diseases of heart (I00-I09, I11, I13, I20-I51) 4 639 4 700 4 700 4 655 4 647Human immunodeficiency virus [HIV] disease (B20-B24) 5 181 5 164 5 180 5 190 5 189Chronic liver disease and cirrhosis (K70, K73-K74) 6 148 7 124 6 151 7 161 6 155Cerebrovascular diseases (I60-I69) 7 143 6 127 7 145 6 169 7 152Diabetes mellitus (E10-E14) 8 127 8 110 8 111 8 123 8 126Assault (homicide) (X85-Y09, Y87.1) 9 103 9 97 9 91 9 81 9 111Influenza and pneumonia (J10-J18) 10 72 11 56 10 60 11 44 11 51
rank 2 percent rank 2 percent rank 2 percent rank 2 percent rank 2 percent
Total, all causes of death (A00-Y89) ... 100.0 ... 100.0 ... 100.0 ... 100.0 ... 100.0Malignant neoplasms (C00-C97) 1 24.6 1 26.9 1 25.5 1 25.8 1 27.0Accidents (unintentional injuries) (V01-X59, Y85-Y86) 2 16.0 2 16.0 2 16.5 2 18.2 2 16.4Intentional self-harm (suicide) (X60-X84, Y87.0) 3 14.5 3 13.4 3 14.2 3 13.3 3 13.8Diseases of heart (I00-I09, I11, I13, I20-I51) 4 10.6 4 11.7 4 11.1 4 10.3 4 10.0Human immunodeficiency virus [HIV] disease (B20-B24) 5 3.0 5 2.7 5 2.9 5 3.0 5 2.9Chronic liver disease and cirrhosis (K70, K73-K74) 6 2.4 7 2.1 6 2.4 7 2.5 6 2.4Cerebrovascular diseases (I60-I69) 7 2.4 6 2.1 7 2.3 6 2.7 7 2.3Diabetes mellitus (E10-E14) 8 2.1 8 1.8 8 1.8 8 1.9 8 1.9Assault (homicide) (X85-Y09, Y87.1) 9 1.7 9 1.6 9 1.4 9 1.3 9 1.7Influenza and pneumonia (J10-J18) 10 1.2 11 0.9 10 1.0 11 0.7 11 0.8
rank 2age-specific
rate 3 rank 2age-specific
rate 3 rank 2age-specific
rate 3 rank 2age-specific
rate 3 rank 2age-specific
rate 3
Total, all causes of death (A00-Y89) ... 118.3 ... 115.8 ... 121.2 ... 120.7 ... 121.9Malignant neoplasms (C00-C97) 1 29.1 1 31.1 1 31.0 1 31.1 1 32.9Accidents (unintentional injuries) (V01-X59, Y85-Y86) 2 19.0 2 18.5 2 20.0 2 22.0 2 19.9Intentional self-harm (suicide) (X60-X84, Y87.0) 3 17.1 3 15.5 3 17.2 3 16.1 3 16.8Diseases of heart (I00-I09, I11, I13, I20-I51) 4 12.5 4 13.6 4 13.4 4 12.5 4 12.2Human immunodeficiency virus [HIV] disease (B20-B24) 5 3.5 5 3.2 5 3.5 5 3.6 5 3.6Chronic liver disease and cirrhosis (K70, K73-K74) 6 2.9 7 2.4 6 2.9 7 3.1 6 2.9Cerebrovascular diseases (I60-I69) 7 2.8 6 2.5 7 2.8 6 3.2 7 2.9Diabetes mellitus (E10-E14) 8 2.5 8 2.1 8 2.1 8 2.3 8 2.4Assault (homicide) (X85-Y09, Y87.1) 9 2.0 9 1.9 9 1.7 9 1.5 9 2.1Influenza and pneumonia (J10-J18) 10 1.4 11 1.1 10 1.2 11 0.8 11 1.0
See footnotes at the end of the table.
Statistics Canada, Catalogue no. 84-215-X 41
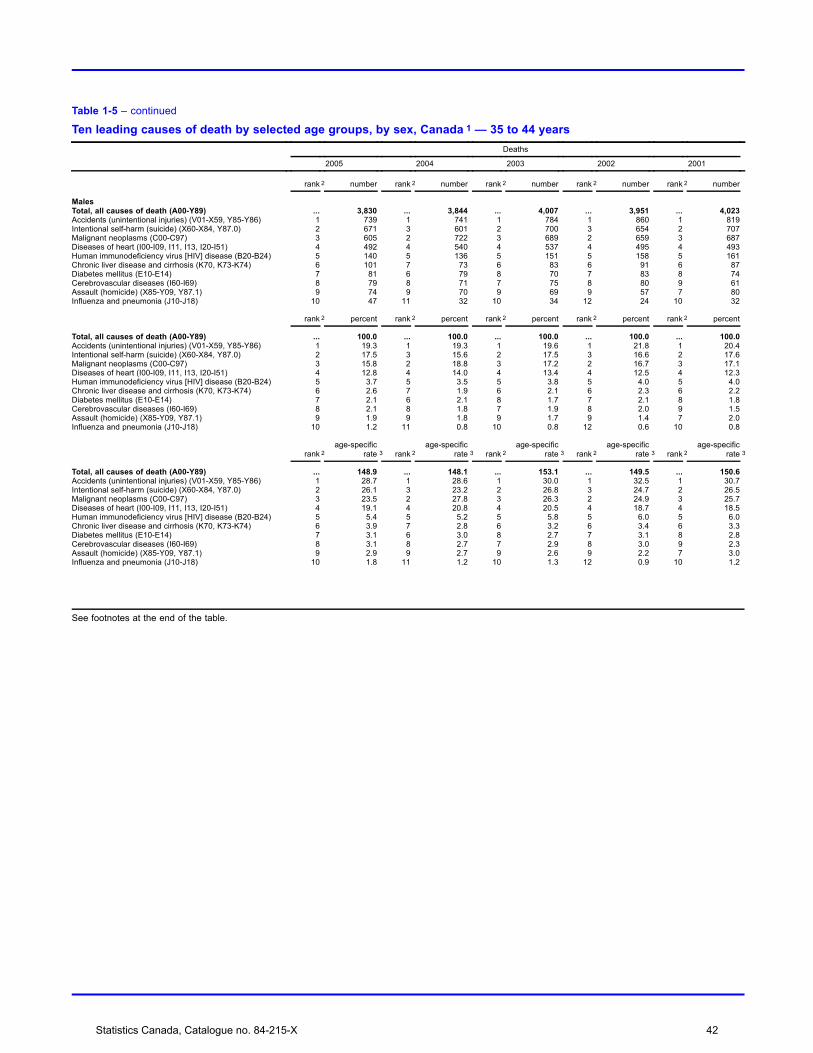
Table 1-5 – continued
Ten leading causes of death by selected age groups, by sex, Canada 1 — 35 to 44 yearsDeaths
2005 2004 2003 2002 2001
rank 2 number rank 2 number rank 2 number rank 2 number rank 2 number
MalesTotal, all causes of death (A00-Y89) ... 3,830 ... 3,844 ... 4,007 ... 3,951 ... 4,023Accidents (unintentional injuries) (V01-X59, Y85-Y86) 1 739 1 741 1 784 1 860 1 819Intentional self-harm (suicide) (X60-X84, Y87.0) 2 671 3 601 2 700 3 654 2 707Malignant neoplasms (C00-C97) 3 605 2 722 3 689 2 659 3 687Diseases of heart (I00-I09, I11, I13, I20-I51) 4 492 4 540 4 537 4 495 4 493Human immunodeficiency virus [HIV] disease (B20-B24) 5 140 5 136 5 151 5 158 5 161Chronic liver disease and cirrhosis (K70, K73-K74) 6 101 7 73 6 83 6 91 6 87Diabetes mellitus (E10-E14) 7 81 6 79 8 70 7 83 8 74Cerebrovascular diseases (I60-I69) 8 79 8 71 7 75 8 80 9 61Assault (homicide) (X85-Y09, Y87.1) 9 74 9 70 9 69 9 57 7 80Influenza and pneumonia (J10-J18) 10 47 11 32 10 34 12 24 10 32
rank 2 percent rank 2 percent rank 2 percent rank 2 percent rank 2 percent
Total, all causes of death (A00-Y89) ... 100.0 ... 100.0 ... 100.0 ... 100.0 ... 100.0Accidents (unintentional injuries) (V01-X59, Y85-Y86) 1 19.3 1 19.3 1 19.6 1 21.8 1 20.4Intentional self-harm (suicide) (X60-X84, Y87.0) 2 17.5 3 15.6 2 17.5 3 16.6 2 17.6Malignant neoplasms (C00-C97) 3 15.8 2 18.8 3 17.2 2 16.7 3 17.1Diseases of heart (I00-I09, I11, I13, I20-I51) 4 12.8 4 14.0 4 13.4 4 12.5 4 12.3Human immunodeficiency virus [HIV] disease (B20-B24) 5 3.7 5 3.5 5 3.8 5 4.0 5 4.0Chronic liver disease and cirrhosis (K70, K73-K74) 6 2.6 7 1.9 6 2.1 6 2.3 6 2.2Diabetes mellitus (E10-E14) 7 2.1 6 2.1 8 1.7 7 2.1 8 1.8Cerebrovascular diseases (I60-I69) 8 2.1 8 1.8 7 1.9 8 2.0 9 1.5Assault (homicide) (X85-Y09, Y87.1) 9 1.9 9 1.8 9 1.7 9 1.4 7 2.0Influenza and pneumonia (J10-J18) 10 1.2 11 0.8 10 0.8 12 0.6 10 0.8
rank 2age-specific
rate 3 rank 2age-specific
rate 3 rank 2age-specific
rate 3 rank 2age-specific
rate 3 rank 2age-specific
rate 3
Total, all causes of death (A00-Y89) ... 148.9 ... 148.1 ... 153.1 ... 149.5 ... 150.6Accidents (unintentional injuries) (V01-X59, Y85-Y86) 1 28.7 1 28.6 1 30.0 1 32.5 1 30.7Intentional self-harm (suicide) (X60-X84, Y87.0) 2 26.1 3 23.2 2 26.8 3 24.7 2 26.5Malignant neoplasms (C00-C97) 3 23.5 2 27.8 3 26.3 2 24.9 3 25.7Diseases of heart (I00-I09, I11, I13, I20-I51) 4 19.1 4 20.8 4 20.5 4 18.7 4 18.5Human immunodeficiency virus [HIV] disease (B20-B24) 5 5.4 5 5.2 5 5.8 5 6.0 5 6.0Chronic liver disease and cirrhosis (K70, K73-K74) 6 3.9 7 2.8 6 3.2 6 3.4 6 3.3Diabetes mellitus (E10-E14) 7 3.1 6 3.0 8 2.7 7 3.1 8 2.8Cerebrovascular diseases (I60-I69) 8 3.1 8 2.7 7 2.9 8 3.0 9 2.3Assault (homicide) (X85-Y09, Y87.1) 9 2.9 9 2.7 9 2.6 9 2.2 7 3.0Influenza and pneumonia (J10-J18) 10 1.8 11 1.2 10 1.3 12 0.9 10 1.2
See footnotes at the end of the table.
Statistics Canada, Catalogue no. 84-215-X 42

Table 1-5 – continued
Ten leading causes of death by selected age groups, by sex, Canada 1 — 35 to 44 yearsDeaths
2005 2004 2003 2002 2001
rank 2 number rank 2 number rank 2 number rank 2 number rank 2 number
FemalesTotal, all causes of death (A00-Y89) ... 2,221 ... 2,133 ... 2,308 ... 2,399 ... 2,455Malignant neoplasms (C00-C97) 1 885 1 884 1 924 1 978 1 1,060Accidents (unintentional injuries) (V01-X59, Y85-Y86) 2 232 2 213 2 258 2 295 2 241Intentional self-harm (suicide) (X60-X84, Y87.0) 3 205 3 198 3 197 3 193 3 186Diseases of heart (I00-I09, I11, I13, I20-I51) 4 147 4 160 4 163 4 160 4 154Cerebrovascular diseases (I60-I69) 5 64 5 56 5 70 5 89 5 91Chronic liver disease and cirrhosis (K70, K73-K74) 6 47 6 51 6 68 6 70 6 68Diabetes mellitus (E10-E14) 7 46 7 31 7 41 7 40 7 52Human immunodeficiency virus [HIV] disease (B20-B24) 8 41 8 28 9 29 8 32 10 28Congenital malformations, deformations and chromosomal
abnormalities (Q00-Q99) 9 34 10 25 8 32 9 26 9 29Assault (homicide) (X85-Y09, Y87.1) 10 29 9 27 11 22 10 24 8 31
rank 2 percent rank 2 percent rank 2 percent rank 2 percent rank 2 percent
Total, all causes of death (A00-Y89) ... 100.0 ... 100.0 ... 100.0 ... 100.0 ... 100.0Malignant neoplasms (C00-C97) 1 39.8 1 41.4 1 40.0 1 40.8 1 43.2Accidents (unintentional injuries) (V01-X59, Y85-Y86) 2 10.4 2 10.0 2 11.2 2 12.3 2 9.8Intentional self-harm (suicide) (X60-X84, Y87.0) 3 9.2 3 9.3 3 8.5 3 8.0 3 7.6Diseases of heart (I00-I09, I11, I13, I20-I51) 4 6.6 4 7.5 4 7.1 4 6.7 4 6.3Cerebrovascular diseases (I60-I69) 5 2.9 5 2.6 5 3.0 5 3.7 5 3.7Chronic liver disease and cirrhosis (K70, K73-K74) 6 2.1 6 2.4 6 2.9 6 2.9 6 2.8Diabetes mellitus (E10-E14) 7 2.1 7 1.5 7 1.8 7 1.7 7 2.1Human immunodeficiency virus [HIV] disease (B20-B24) 8 1.8 8 1.3 9 1.3 8 1.3 10 1.1Congenital malformations, deformations and chromosomal
abnormalities (Q00-Q99) 9 1.5 10 1.2 8 1.4 9 1.1 9 1.2Assault (homicide) (X85-Y09, Y87.1) 10 1.3 9 1.3 11 1.0 10 1.0 8 1.3
rank 2age-specific
rate 3 rank 2age-specific
rate 3 rank 2age-specific
rate 3 rank 2age-specific
rate 3 rank 2age-specific
rate 3
Total, all causes of death (A00-Y89) ... 87.3 ... 83.1 ... 89.0 ... 91.7 ... 92.9Malignant neoplasms (C00-C97) 1 34.8 1 34.4 1 35.6 1 37.4 1 40.1Accidents (unintentional injuries) (V01-X59, Y85-Y86) 2 9.1 2 8.3 2 10.0 2 11.3 2 9.1Intentional self-harm (suicide) (X60-X84, Y87.0) 3 8.1 3 7.7 3 7.6 3 7.4 3 7.0Diseases of heart (I00-I09, I11, I13, I20-I51) 4 5.8 4 6.2 4 6.3 4 6.1 4 5.8Cerebrovascular diseases (I60-I69) 5 2.5 5 2.2 5 2.7 5 3.4 5 3.4Chronic liver disease and cirrhosis (K70, K73-K74) 6 1.8 6 2.0 6 2.6 6 2.7 6 2.6Diabetes mellitus (E10-E14) 7 1.8 7 1.2 7 1.6 7 1.5 7 2.0Human immunodeficiency virus [HIV] disease (B20-B24) 8 1.6 8 1.1 9 1.1 8 1.2 10 1.1Congenital malformations, deformations and chromosomal
abnormalities (Q00-Q99) 9 1.3 10 1.0 8 1.2 9 1.0 9 1.1Assault (homicide) (X85-Y09, Y87.1) 10 1.1 9 1.1 11 0.8 10 0.9 8 1.2
1. The geographic distribution of deaths in this table is based on the deceased’s usual place of residence. Counts in this table exclude deaths of non-residents ofCanada.
2. The ranking of the leading causes of death is based on the number of deaths.3. The age-specific mortality rates per 100,000 population use the population estimates in the Appendix 3 as denominator.Note(s): See "Introduction", "Glossary" and "Definitions, data sources and methods" sections.Source(s): Statistics Canada, Canadian Vital Statistics, Death Database (CANSIM table 102-0561).
Statistics Canada, Catalogue no. 84-215-X 43

Table 1-6Ten leading causes of death by selected age groups, by sex, Canada 1 — 45 to 54 years
Deaths
2005 2004 2003 2002 2001
rank 2 number rank 2 number rank 2 number rank 2 number rank 2 number
Both sexesTotal, all causes of death (A00-Y89) ... 13,765 ... 13,505 ... 13,596 ... 13,139 ... 13,108Malignant neoplasms (C00-C97) 1 5,418 1 5,448 1 5,518 1 5,360 1 5,337Diseases of heart (I00-I09, I11, I13, I20-I51) 2 2,154 2 2,213 2 2,221 2 2,160 2 2,216Accidents (unintentional injuries) (V01-X59, Y85-Y86) 3 1,117 3 1,002 3 969 3 1,012 3 931Intentional self-harm (suicide) (X60-X84, Y87.0) 4 883 4 839 4 858 4 815 4 846Chronic liver disease and cirrhosis (K70, K73-K74) 5 440 5 423 5 445 5 425 5 423Cerebrovascular diseases (I60-I69) 6 388 6 358 6 372 6 379 6 389Diabetes mellitus (E10-E14) 7 363 7 314 7 313 7 348 7 330Human immunodeficiency virus [HIV] disease (B20-B24) 8 146 10 135 9 136 10 115 9 120Viral hepatitis (B15-B19) 9 144 8 144 10 135 9 122 11 95Influenza and pneumonia (J10-J18) 10 132 11 111 11 99 11 103 10 103Chronic lower respiratory diseases (J40-J47) 10 132 9 137 8 137 8 132 8 127
rank 2 percent rank 2 percent rank 2 percent rank 2 percent rank 2 percent
Total, all causes of death (A00-Y89) ... 100.0 ... 100.0 ... 100.0 ... 100.0 ... 100.0Malignant neoplasms (C00-C97) 1 39.4 1 40.3 1 40.6 1 40.8 1 40.7Diseases of heart (I00-I09, I11, I13, I20-I51) 2 15.6 2 16.4 2 16.3 2 16.4 2 16.9Accidents (unintentional injuries) (V01-X59, Y85-Y86) 3 8.1 3 7.4 3 7.1 3 7.7 3 7.1Intentional self-harm (suicide) (X60-X84, Y87.0) 4 6.4 4 6.2 4 6.3 4 6.2 4 6.5Chronic liver disease and cirrhosis (K70, K73-K74) 5 3.2 5 3.1 5 3.3 5 3.2 5 3.2Cerebrovascular diseases (I60-I69) 6 2.8 6 2.7 6 2.7 6 2.9 6 3.0Diabetes mellitus (E10-E14) 7 2.6 7 2.3 7 2.3 7 2.6 7 2.5Human immunodeficiency virus [HIV] disease (B20-B24) 8 1.1 10 1.0 9 1.0 10 0.9 9 0.9Viral hepatitis (B15-B19) 9 1.0 8 1.1 10 1.0 9 0.9 11 0.7Influenza and pneumonia (J10-J18) 10 1.0 11 0.8 11 0.7 11 0.8 10 0.8Chronic lower respiratory diseases (J40-J47) 10 1.0 9 1.0 8 1.0 8 1.0 8 1.0
rank 2age-specific
rate 3 rank 2age-specific
rate 3 rank 2age-specific
rate 3 rank 2age-specific
rate 3 rank 2age-specific
rate 3
Total, all causes of death (A00-Y89) ... 279.6 ... 281.1 ... 289.5 ... 286.2 ... 291.2Malignant neoplasms (C00-C97) 1 110.1 1 113.4 1 117.5 1 116.8 1 118.5Diseases of heart (I00-I09, I11, I13, I20-I51) 2 43.8 2 46.1 2 47.3 2 47.0 2 49.2Accidents (unintentional injuries) (V01-X59, Y85-Y86) 3 22.7 3 20.9 3 20.6 3 22.0 3 20.7Intentional self-harm (suicide) (X60-X84, Y87.0) 4 17.9 4 17.5 4 18.3 4 17.8 4 18.8Chronic liver disease and cirrhosis (K70, K73-K74) 5 8.9 5 8.8 5 9.5 5 9.3 5 9.4Cerebrovascular diseases (I60-I69) 6 7.9 6 7.5 6 7.9 6 8.3 6 8.6Diabetes mellitus (E10-E14) 7 7.4 7 6.5 7 6.7 7 7.6 7 7.3Human immunodeficiency virus [HIV] disease (B20-B24) 8 3.0 10 2.8 9 2.9 10 2.5 9 2.7Viral hepatitis (B15-B19) 9 2.9 8 3.0 10 2.9 9 2.7 11 2.1Influenza and pneumonia (J10-J18) 10 2.7 11 2.3 11 2.1 11 2.2 10 2.3Chronic lower respiratory diseases (J40-J47) 10 2.7 9 2.9 8 2.9 8 2.9 8 2.8
See footnotes at the end of the table.
Statistics Canada, Catalogue no. 84-215-X 44

Table 1-6 – continued
Ten leading causes of death by selected age groups, by sex, Canada 1 — 45 to 54 yearsDeaths
2005 2004 2003 2002 2001
rank 2 number rank 2 number rank 2 number rank 2 number rank 2 number
MalesTotal, all causes of death (A00-Y89) ... 8,333 ... 8,196 ... 8,304 ... 8,010 ... 8,048Malignant neoplasms (C00-C97) 1 2,566 1 2,488 1 2,605 1 2,535 1 2,499Diseases of heart (I00-I09, I11, I13, I20-I51) 2 1,679 2 1,775 2 1,778 2 1,694 2 1,770Accidents (unintentional injuries) (V01-X59, Y85-Y86) 3 842 3 764 3 713 3 744 3 705Intentional self-harm (suicide) (X60-X84, Y87.0) 4 670 4 609 4 617 4 638 4 640Chronic liver disease and cirrhosis (K70, K73-K74) 5 300 5 297 5 316 5 301 5 291Diabetes mellitus (E10-E14) 6 227 6 215 6 210 6 229 6 223Cerebrovascular diseases (I60-I69) 7 196 7 204 7 197 7 196 7 208Human immunodeficiency virus [HIV] disease (B20-B24) 8 120 8 113 8 120 8 102 8 105Viral hepatitis (B15-B19) 9 105 9 106 9 106 9 95 9 80Influenza and pneumonia (J10-J18) 10 84 11 64 11 60 11 73 11 66
rank 2 percent rank 2 percent rank 2 percent rank 2 percent rank 2 percent
Total, all causes of death (A00-Y89) ... 100.0 ... 100.0 ... 100.0 ... 100.0 ... 100.0Malignant neoplasms (C00-C97) 1 30.8 1 30.4 1 31.4 1 31.6 1 31.1Diseases of heart (I00-I09, I11, I13, I20-I51) 2 20.1 2 21.7 2 21.4 2 21.1 2 22.0Accidents (unintentional injuries) (V01-X59, Y85-Y86) 3 10.1 3 9.3 3 8.6 3 9.3 3 8.8Intentional self-harm (suicide) (X60-X84, Y87.0) 4 8.0 4 7.4 4 7.4 4 8.0 4 8.0Chronic liver disease and cirrhosis (K70, K73-K74) 5 3.6 5 3.6 5 3.8 5 3.8 5 3.6Diabetes mellitus (E10-E14) 6 2.7 6 2.6 6 2.5 6 2.9 6 2.8Cerebrovascular diseases (I60-I69) 7 2.4 7 2.5 7 2.4 7 2.4 7 2.6Human immunodeficiency virus [HIV] disease (B20-B24) 8 1.4 8 1.4 8 1.4 8 1.3 8 1.3Viral hepatitis (B15-B19) 9 1.3 9 1.3 9 1.3 9 1.2 9 1.0Influenza and pneumonia (J10-J18) 10 1.0 11 0.8 11 0.7 11 0.9 11 0.8
rank 2age-specific
rate 3 rank 2age-specific
rate 3 rank 2age-specific
rate 3 rank 2age-specific
rate 3 rank 2age-specific
rate 3
Total, all causes of death (A00-Y89) ... 340.5 ... 343.4 ... 356.0 ... 351.2 ... 358.7Malignant neoplasms (C00-C97) 1 104.9 1 104.2 1 111.7 1 111.2 1 111.4Diseases of heart (I00-I09, I11, I13, I20-I51) 2 68.6 2 74.4 2 76.2 2 74.3 2 78.9Accidents (unintentional injuries) (V01-X59, Y85-Y86) 3 34.4 3 32.0 3 30.6 3 32.6 3 31.4Intentional self-harm (suicide) (X60-X84, Y87.0) 4 27.4 4 25.5 4 26.5 4 28.0 4 28.5Chronic liver disease and cirrhosis (K70, K73-K74) 5 12.3 5 12.4 5 13.5 5 13.2 5 13.0Diabetes mellitus (E10-E14) 6 9.3 6 9.0 6 9.0 6 10.0 6 9.9Cerebrovascular diseases (I60-I69) 7 8.0 7 8.5 7 8.4 7 8.6 7 9.3Human immunodeficiency virus [HIV] disease (B20-B24) 8 4.9 8 4.7 8 5.1 8 4.5 8 4.7Viral hepatitis (B15-B19) 9 4.3 9 4.4 9 4.5 9 4.2 9 3.6Influenza and pneumonia (J10-J18) 10 3.4 11 2.7 11 2.6 11 3.2 11 2.9
See footnotes at the end of the table.
Statistics Canada, Catalogue no. 84-215-X 45

Table 1-6 – continued
Ten leading causes of death by selected age groups, by sex, Canada 1 — 45 to 54 yearsDeaths
2005 2004 2003 2002 2001
rank 2 number rank 2 number rank 2 number rank 2 number rank 2 number
FemalesTotal, all causes of death (A00-Y89) ... 5,432 ... 5,309 ... 5,292 ... 5,129 ... 5,060Malignant neoplasms (C00-C97) 1 2,852 1 2,960 1 2,913 1 2,825 1 2,838Diseases of heart (I00-I09, I11, I13, I20-I51) 2 475 2 438 2 443 2 466 2 446Accidents (unintentional injuries) (V01-X59, Y85-Y86) 3 275 3 238 3 256 3 268 3 226Intentional self-harm (suicide) (X60-X84, Y87.0) 4 213 4 230 4 241 5 177 4 206Cerebrovascular diseases (I60-I69) 5 192 5 154 5 175 4 183 5 181Chronic liver disease and cirrhosis (K70, K73-K74) 6 140 6 126 6 129 6 124 6 132Diabetes mellitus (E10-E14) 7 136 7 99 7 103 7 119 7 107Chronic lower respiratory diseases (J40-J47) 8 66 8 63 8 63 8 55 8 59Influenza and pneumonia (J10-J18) 9 48 9 47 10 39 11 30 10 37Congenital malformations, deformations and chromosomal
abnormalities (Q00-Q99) 10 42 10 46 9 44 10 31 13 27
rank 2 percent rank 2 percent rank 2 percent rank 2 percent rank 2 percent
Total, all causes of death (A00-Y89) ... 100.0 ... 100.0 ... 100.0 ... 100.0 ... 100.0Malignant neoplasms (C00-C97) 1 52.5 1 55.8 1 55.0 1 55.1 1 56.1Diseases of heart (I00-I09, I11, I13, I20-I51) 2 8.7 2 8.3 2 8.4 2 9.1 2 8.8Accidents (unintentional injuries) (V01-X59, Y85-Y86) 3 5.1 3 4.5 3 4.8 3 5.2 3 4.5Intentional self-harm (suicide) (X60-X84, Y87.0) 4 3.9 4 4.3 4 4.6 5 3.5 4 4.1Cerebrovascular diseases (I60-I69) 5 3.5 5 2.9 5 3.3 4 3.6 5 3.6Chronic liver disease and cirrhosis (K70, K73-K74) 6 2.6 6 2.4 6 2.4 6 2.4 6 2.6Diabetes mellitus (E10-E14) 7 2.5 7 1.9 7 1.9 7 2.3 7 2.1Chronic lower respiratory diseases (J40-J47) 8 1.2 8 1.2 8 1.2 8 1.1 8 1.2Influenza and pneumonia (J10-J18) 9 0.9 9 0.9 10 0.7 11 0.6 10 0.7Congenital malformations, deformations and chromosomal
abnormalities (Q00-Q99) 10 0.8 10 0.9 9 0.8 10 0.6 13 0.5
rank 2age-specific
rate 3 rank 2age-specific
rate 3 rank 2age-specific
rate 3 rank 2age-specific
rate 3 rank 2age-specific
rate 3
Total, all causes of death (A00-Y89) ... 219.4 ... 219.6 ... 223.9 ... 222.0 ... 224.1Malignant neoplasms (C00-C97) 1 115.2 1 122.4 1 123.2 1 122.3 1 125.7Diseases of heart (I00-I09, I11, I13, I20-I51) 2 19.2 2 18.1 2 18.7 2 20.2 2 19.8Accidents (unintentional injuries) (V01-X59, Y85-Y86) 3 11.1 3 9.8 3 10.8 3 11.6 3 10.0Intentional self-harm (suicide) (X60-X84, Y87.0) 4 8.6 4 9.5 4 10.2 5 7.7 4 9.1Cerebrovascular diseases (I60-I69) 5 7.8 5 6.4 5 7.4 4 7.9 5 8.0Chronic liver disease and cirrhosis (K70, K73-K74) 6 5.7 6 5.2 6 5.5 6 5.4 6 5.8Diabetes mellitus (E10-E14) 7 5.5 7 4.1 7 4.4 7 5.2 7 4.7Chronic lower respiratory diseases (J40-J47) 8 2.7 8 2.6 8 2.7 8 2.4 8 2.6Influenza and pneumonia (J10-J18) 9 1.9 9 1.9 10 1.6 11 1.3 10 1.6Congenital malformations, deformations and chromosomal
abnormalities (Q00-Q99) 10 1.7 10 1.9 9 1.9 10 1.3 13 1.2
1. The geographic distribution of deaths in this table is based on the deceased’s usual place of residence. Counts in this table exclude deaths of non-residents ofCanada.
2. The ranking of the leading causes of death is based on the number of deaths.3. The age-specific mortality rates per 100,000 population use the population estimates in the Appendix 3 as denominator.Note(s): See "Introduction", "Glossary" and "Definitions, data sources and methods" sections.Source(s): Statistics Canada, Canadian Vital Statistics, Death Database (CANSIM table 102-0561).
Statistics Canada, Catalogue no. 84-215-X 46

Table 1-7Ten leading causes of death by selected age groups, by sex, Canada 1 — 55 to 64 years
Deaths
2005 2004 2003 2002 2001
rank 2 number rank 2 number rank 2 number rank 2 number rank 2 number
Both sexesTotal, all causes of death (A00-Y89) ... 24,147 ... 23,750 ... 23,100 ... 22,571 ... 21,496Malignant neoplasms (C00-C97) 1 11,440 1 11,317 1 10,974 1 10,784 1 10,289Diseases of heart (I00-I09, I11, I13, I20-I51) 2 4,491 2 4,520 2 4,521 2 4,295 2 4,274Accidents (unintentional injuries) (V01-X59, Y85-Y86) 3 821 4 755 5 664 5 714 5 609Diabetes mellitus (E10-E14) 4 816 3 851 3 858 3 807 4 687Cerebrovascular diseases (I60-I69) 5 781 5 719 4 743 4 737 3 711Chronic lower respiratory diseases (J40-J47) 6 628 7 582 7 573 7 587 6 545Chronic liver disease and cirrhosis (K70, K73-K74) 7 603 6 589 6 585 6 600 7 544Intentional self-harm (suicide) (X60-X84, Y87.0) 8 460 8 449 8 479 8 441 8 412Influenza and pneumonia (J10-J18) 9 266 9 225 10 167 10 155 10 158Nephritis, nephrotic syndrome and nephrosis (N00-N07,
N17-N19, N25-N27) 10 172 10 173 9 181 9 160 9 168
rank 2 percent rank 2 percent rank 2 percent rank 2 percent rank 2 percent
Total, all causes of death (A00-Y89) ... 100.0 ... 100.0 ... 100.0 ... 100.0 ... 100.0Malignant neoplasms (C00-C97) 1 47.4 1 47.7 1 47.5 1 47.8 1 47.9Diseases of heart (I00-I09, I11, I13, I20-I51) 2 18.6 2 19.0 2 19.6 2 19.0 2 19.9Accidents (unintentional injuries) (V01-X59, Y85-Y86) 3 3.4 4 3.2 5 2.9 5 3.2 5 2.8Diabetes mellitus (E10-E14) 4 3.4 3 3.6 3 3.7 3 3.6 4 3.2Cerebrovascular diseases (I60-I69) 5 3.2 5 3.0 4 3.2 4 3.3 3 3.3Chronic lower respiratory diseases (J40-J47) 6 2.6 7 2.5 7 2.5 7 2.6 6 2.5Chronic liver disease and cirrhosis (K70, K73-K74) 7 2.5 6 2.5 6 2.5 6 2.7 7 2.5Intentional self-harm (suicide) (X60-X84, Y87.0) 8 1.9 8 1.9 8 2.1 8 2.0 8 1.9Influenza and pneumonia (J10-J18) 9 1.1 9 0.9 10 0.7 10 0.7 10 0.7Nephritis, nephrotic syndrome and nephrosis (N00-N07,
N17-N19, N25-N27) 10 0.7 10 0.7 9 0.8 9 0.7 9 0.8
rank 2age-specific
rate 3 rank 2age-specific
rate 3 rank 2age-specific
rate 3 rank 2age-specific
rate 3 rank 2age-specific
rate 3
Total, all causes of death (A00-Y89) ... 684.6 ... 701.8 ... 713.1 ... 732.2 ... 736.4Malignant neoplasms (C00-C97) 1 324.3 1 334.4 1 338.8 1 349.8 1 352.5Diseases of heart (I00-I09, I11, I13, I20-I51) 2 127.3 2 133.6 2 139.6 2 139.3 2 146.4Accidents (unintentional injuries) (V01-X59, Y85-Y86) 3 23.3 4 22.3 5 20.5 5 23.2 5 20.9Diabetes mellitus (E10-E14) 4 23.1 3 25.1 3 26.5 3 26.2 4 23.5Cerebrovascular diseases (I60-I69) 5 22.1 5 21.2 4 22.9 4 23.9 3 24.4Chronic lower respiratory diseases (J40-J47) 6 17.8 7 17.2 7 17.7 7 19.0 6 18.7Chronic liver disease and cirrhosis (K70, K73-K74) 7 17.1 6 17.4 6 18.1 6 19.5 7 18.6Intentional self-harm (suicide) (X60-X84, Y87.0) 8 13.0 8 13.3 8 14.8 8 14.3 8 14.1Influenza and pneumonia (J10-J18) 9 7.5 9 6.6 10 5.2 10 5.0 10 5.4Nephritis, nephrotic syndrome and nephrosis (N00-N07,
N17-N19, N25-N27) 10 4.9 10 5.1 9 5.6 9 5.2 9 5.8
See footnotes at the end of the table.
Statistics Canada, Catalogue no. 84-215-X 47
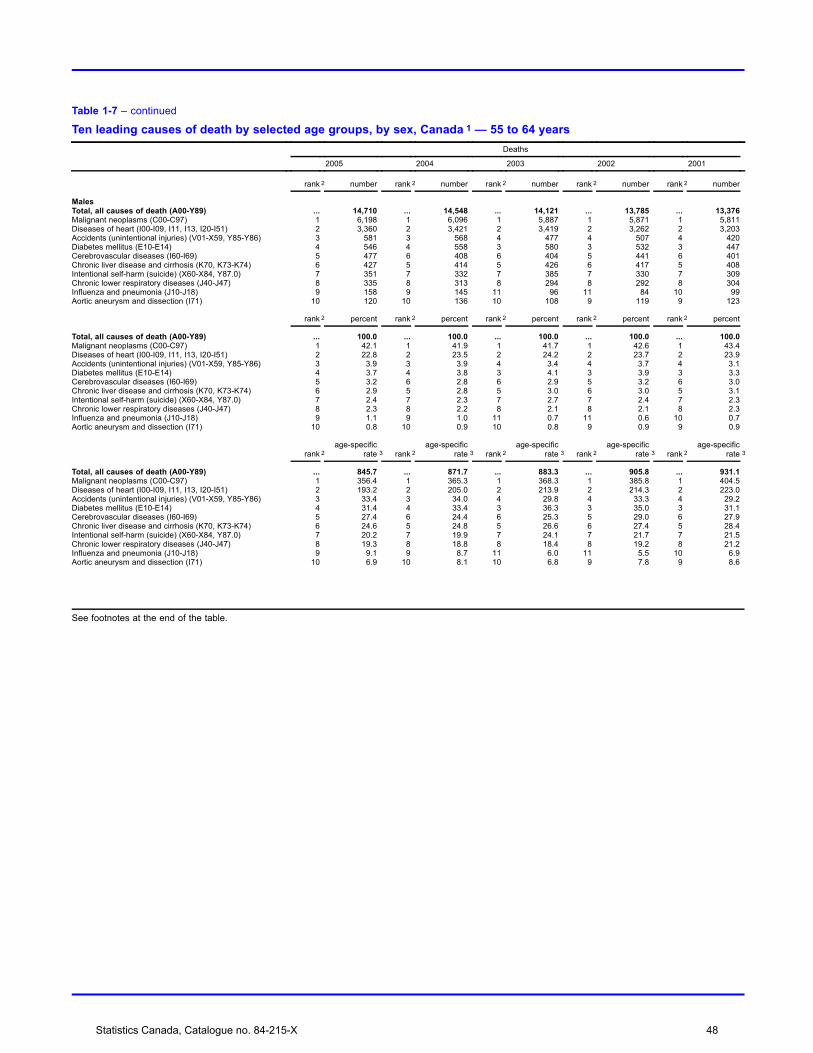
Table 1-7 – continued
Ten leading causes of death by selected age groups, by sex, Canada 1 — 55 to 64 yearsDeaths
2005 2004 2003 2002 2001
rank 2 number rank 2 number rank 2 number rank 2 number rank 2 number
MalesTotal, all causes of death (A00-Y89) ... 14,710 ... 14,548 ... 14,121 ... 13,785 ... 13,376Malignant neoplasms (C00-C97) 1 6,198 1 6,096 1 5,887 1 5,871 1 5,811Diseases of heart (I00-I09, I11, I13, I20-I51) 2 3,360 2 3,421 2 3,419 2 3,262 2 3,203Accidents (unintentional injuries) (V01-X59, Y85-Y86) 3 581 3 568 4 477 4 507 4 420Diabetes mellitus (E10-E14) 4 546 4 558 3 580 3 532 3 447Cerebrovascular diseases (I60-I69) 5 477 6 408 6 404 5 441 6 401Chronic liver disease and cirrhosis (K70, K73-K74) 6 427 5 414 5 426 6 417 5 408Intentional self-harm (suicide) (X60-X84, Y87.0) 7 351 7 332 7 385 7 330 7 309Chronic lower respiratory diseases (J40-J47) 8 335 8 313 8 294 8 292 8 304Influenza and pneumonia (J10-J18) 9 158 9 145 11 96 11 84 10 99Aortic aneurysm and dissection (I71) 10 120 10 136 10 108 9 119 9 123
rank 2 percent rank 2 percent rank 2 percent rank 2 percent rank 2 percent
Total, all causes of death (A00-Y89) ... 100.0 ... 100.0 ... 100.0 ... 100.0 ... 100.0Malignant neoplasms (C00-C97) 1 42.1 1 41.9 1 41.7 1 42.6 1 43.4Diseases of heart (I00-I09, I11, I13, I20-I51) 2 22.8 2 23.5 2 24.2 2 23.7 2 23.9Accidents (unintentional injuries) (V01-X59, Y85-Y86) 3 3.9 3 3.9 4 3.4 4 3.7 4 3.1Diabetes mellitus (E10-E14) 4 3.7 4 3.8 3 4.1 3 3.9 3 3.3Cerebrovascular diseases (I60-I69) 5 3.2 6 2.8 6 2.9 5 3.2 6 3.0Chronic liver disease and cirrhosis (K70, K73-K74) 6 2.9 5 2.8 5 3.0 6 3.0 5 3.1Intentional self-harm (suicide) (X60-X84, Y87.0) 7 2.4 7 2.3 7 2.7 7 2.4 7 2.3Chronic lower respiratory diseases (J40-J47) 8 2.3 8 2.2 8 2.1 8 2.1 8 2.3Influenza and pneumonia (J10-J18) 9 1.1 9 1.0 11 0.7 11 0.6 10 0.7Aortic aneurysm and dissection (I71) 10 0.8 10 0.9 10 0.8 9 0.9 9 0.9
rank 2age-specific
rate 3 rank 2age-specific
rate 3 rank 2age-specific
rate 3 rank 2age-specific
rate 3 rank 2age-specific
rate 3
Total, all causes of death (A00-Y89) ... 845.7 ... 871.7 ... 883.3 ... 905.8 ... 931.1Malignant neoplasms (C00-C97) 1 356.4 1 365.3 1 368.3 1 385.8 1 404.5Diseases of heart (I00-I09, I11, I13, I20-I51) 2 193.2 2 205.0 2 213.9 2 214.3 2 223.0Accidents (unintentional injuries) (V01-X59, Y85-Y86) 3 33.4 3 34.0 4 29.8 4 33.3 4 29.2Diabetes mellitus (E10-E14) 4 31.4 4 33.4 3 36.3 3 35.0 3 31.1Cerebrovascular diseases (I60-I69) 5 27.4 6 24.4 6 25.3 5 29.0 6 27.9Chronic liver disease and cirrhosis (K70, K73-K74) 6 24.6 5 24.8 5 26.6 6 27.4 5 28.4Intentional self-harm (suicide) (X60-X84, Y87.0) 7 20.2 7 19.9 7 24.1 7 21.7 7 21.5Chronic lower respiratory diseases (J40-J47) 8 19.3 8 18.8 8 18.4 8 19.2 8 21.2Influenza and pneumonia (J10-J18) 9 9.1 9 8.7 11 6.0 11 5.5 10 6.9Aortic aneurysm and dissection (I71) 10 6.9 10 8.1 10 6.8 9 7.8 9 8.6
See footnotes at the end of the table.
Statistics Canada, Catalogue no. 84-215-X 48

Table 1-7 – continued
Ten leading causes of death by selected age groups, by sex, Canada 1 — 55 to 64 yearsDeaths
2005 2004 2003 2002 2001
rank 2 number rank 2 number rank 2 number rank 2 number rank 2 number
FemalesTotal, all causes of death (A00-Y89) ... 9,437 ... 9,202 ... 8,979 ... 8,786 ... 8,120Malignant neoplasms (C00-C97) 1 5,242 1 5,221 1 5,087 1 4,913 1 4,478Diseases of heart (I00-I09, I11, I13, I20-I51) 2 1,131 2 1,099 2 1,102 2 1,033 2 1,071Cerebrovascular diseases (I60-I69) 3 304 3 311 3 339 3 296 3 310Chronic lower respiratory diseases (J40-J47) 4 293 5 269 4 279 4 295 4 241Diabetes mellitus (E10-E14) 5 270 4 293 5 278 5 275 5 240Accidents (unintentional injuries) (V01-X59, Y85-Y86) 6 240 6 187 6 187 6 207 6 189Chronic liver disease and cirrhosis (K70, K73-K74) 7 176 7 175 7 159 7 183 7 136Intentional self-harm (suicide) (X60-X84, Y87.0) 8 109 8 117 8 94 8 111 8 103Influenza and pneumonia (J10-J18) 9 108 9 80 9 71 9 71 10 59In situ neoplasms, benign neoplasms and neoplasms of
uncertain or unknown behaviour (D00-D48) 10 63 12 47 11 57 12 45 12 52
rank 2 percent rank 2 percent rank 2 percent rank 2 percent rank 2 percent
Total, all causes of death (A00-Y89) ... 100.0 ... 100.0 ... 100.0 ... 100.0 ... 100.0Malignant neoplasms (C00-C97) 1 55.5 1 56.7 1 56.7 1 55.9 1 55.1Diseases of heart (I00-I09, I11, I13, I20-I51) 2 12.0 2 11.9 2 12.3 2 11.8 2 13.2Cerebrovascular diseases (I60-I69) 3 3.2 3 3.4 3 3.8 3 3.4 3 3.8Chronic lower respiratory diseases (J40-J47) 4 3.1 5 2.9 4 3.1 4 3.4 4 3.0Diabetes mellitus (E10-E14) 5 2.9 4 3.2 5 3.1 5 3.1 5 3.0Accidents (unintentional injuries) (V01-X59, Y85-Y86) 6 2.5 6 2.0 6 2.1 6 2.4 6 2.3Chronic liver disease and cirrhosis (K70, K73-K74) 7 1.9 7 1.9 7 1.8 7 2.1 7 1.7Intentional self-harm (suicide) (X60-X84, Y87.0) 8 1.2 8 1.3 8 1.0 8 1.3 8 1.3Influenza and pneumonia (J10-J18) 9 1.1 9 0.9 9 0.8 9 0.8 10 0.7In situ neoplasms, benign neoplasms and neoplasms of
uncertain or unknown behaviour (D00-D48) 10 0.7 12 0.5 11 0.6 12 0.5 12 0.6
rank 2age-specific
rate 3 rank 2age-specific
rate 3 rank 2age-specific
rate 3 rank 2age-specific
rate 3 rank 2age-specific
rate 3
Total, all causes of death (A00-Y89) ... 527.8 ... 536.5 ... 547.2 ... 562.9 ... 547.7Malignant neoplasms (C00-C97) 1 293.2 1 304.4 1 310.0 1 314.8 1 302.1Diseases of heart (I00-I09, I11, I13, I20-I51) 2 63.3 2 64.1 2 67.2 2 66.2 2 72.2Cerebrovascular diseases (I60-I69) 3 17.0 3 18.1 3 20.7 3 19.0 3 20.9Chronic lower respiratory diseases (J40-J47) 4 16.4 5 15.7 4 17.0 4 18.9 4 16.3Diabetes mellitus (E10-E14) 5 15.1 4 17.1 5 16.9 5 17.6 5 16.2Accidents (unintentional injuries) (V01-X59, Y85-Y86) 6 13.4 6 10.9 6 11.4 6 13.3 6 12.7Chronic liver disease and cirrhosis (K70, K73-K74) 7 9.8 7 10.2 7 9.7 7 11.7 7 9.2Intentional self-harm (suicide) (X60-X84, Y87.0) 8 6.1 8 6.8 8 5.7 8 7.1 8 6.9Influenza and pneumonia (J10-J18) 9 6.0 9 4.7 9 4.3 9 4.5 10 4.0In situ neoplasms, benign neoplasms and neoplasms of
uncertain or unknown behaviour (D00-D48) 10 3.5 12 2.7 11 3.5 12 2.9 12 3.5
1. The geographic distribution of deaths in this table is based on the deceased’s usual place of residence. Counts in this table exclude deaths of non-residents ofCanada.
2. The ranking of the leading causes of death is based on the number of deaths.3. The age-specific mortality rates per 100,000 population use the population estimates in the Appendix 3 as denominator.Note(s): See "Introduction", "Glossary" and "Definitions, data sources and methods" sections.Source(s): Statistics Canada, Canadian Vital Statistics, Death Database (CANSIM table 102-0561).
Statistics Canada, Catalogue no. 84-215-X 49
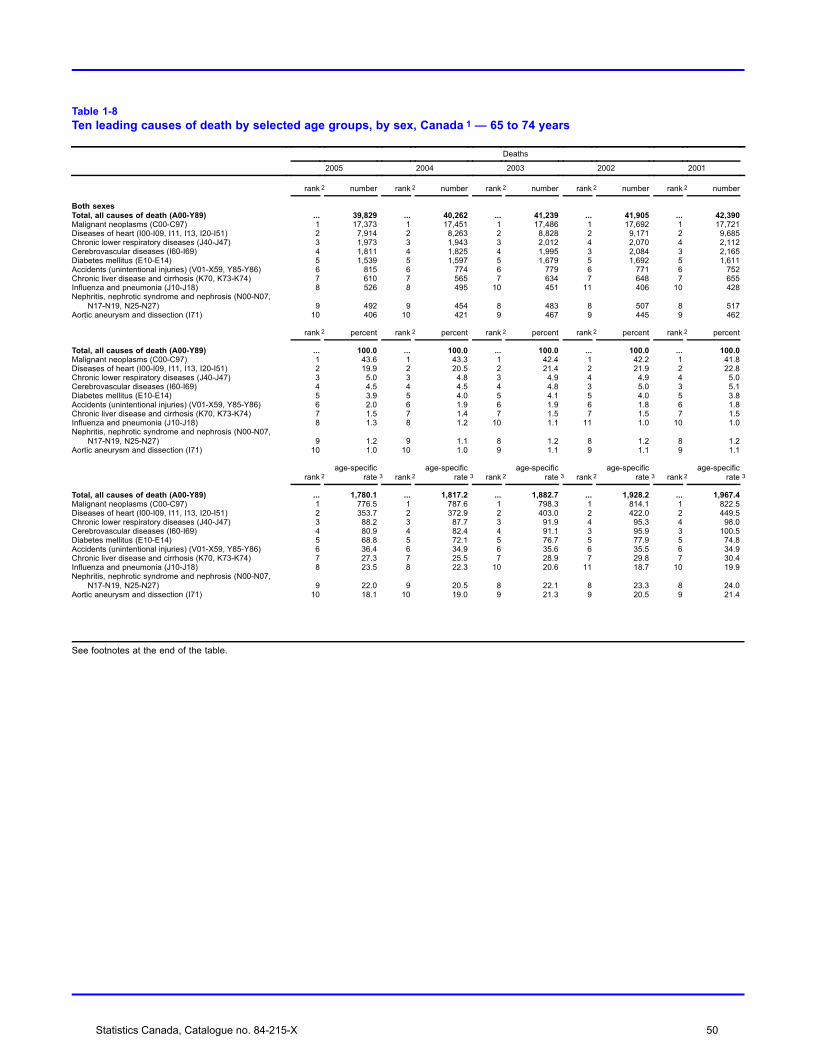
Table 1-8Ten leading causes of death by selected age groups, by sex, Canada 1 — 65 to 74 years
Deaths
2005 2004 2003 2002 2001
rank 2 number rank 2 number rank 2 number rank 2 number rank 2 number
Both sexesTotal, all causes of death (A00-Y89) ... 39,829 ... 40,262 ... 41,239 ... 41,905 ... 42,390Malignant neoplasms (C00-C97) 1 17,373 1 17,451 1 17,486 1 17,692 1 17,721Diseases of heart (I00-I09, I11, I13, I20-I51) 2 7,914 2 8,263 2 8,828 2 9,171 2 9,685Chronic lower respiratory diseases (J40-J47) 3 1,973 3 1,943 3 2,012 4 2,070 4 2,112Cerebrovascular diseases (I60-I69) 4 1,811 4 1,825 4 1,995 3 2,084 3 2,165Diabetes mellitus (E10-E14) 5 1,539 5 1,597 5 1,679 5 1,692 5 1,611Accidents (unintentional injuries) (V01-X59, Y85-Y86) 6 815 6 774 6 779 6 771 6 752Chronic liver disease and cirrhosis (K70, K73-K74) 7 610 7 565 7 634 7 648 7 655Influenza and pneumonia (J10-J18) 8 526 8 495 10 451 11 406 10 428Nephritis, nephrotic syndrome and nephrosis (N00-N07,
N17-N19, N25-N27) 9 492 9 454 8 483 8 507 8 517Aortic aneurysm and dissection (I71) 10 406 10 421 9 467 9 445 9 462
rank 2 percent rank 2 percent rank 2 percent rank 2 percent rank 2 percent
Total, all causes of death (A00-Y89) ... 100.0 ... 100.0 ... 100.0 ... 100.0 ... 100.0Malignant neoplasms (C00-C97) 1 43.6 1 43.3 1 42.4 1 42.2 1 41.8Diseases of heart (I00-I09, I11, I13, I20-I51) 2 19.9 2 20.5 2 21.4 2 21.9 2 22.8Chronic lower respiratory diseases (J40-J47) 3 5.0 3 4.8 3 4.9 4 4.9 4 5.0Cerebrovascular diseases (I60-I69) 4 4.5 4 4.5 4 4.8 3 5.0 3 5.1Diabetes mellitus (E10-E14) 5 3.9 5 4.0 5 4.1 5 4.0 5 3.8Accidents (unintentional injuries) (V01-X59, Y85-Y86) 6 2.0 6 1.9 6 1.9 6 1.8 6 1.8Chronic liver disease and cirrhosis (K70, K73-K74) 7 1.5 7 1.4 7 1.5 7 1.5 7 1.5Influenza and pneumonia (J10-J18) 8 1.3 8 1.2 10 1.1 11 1.0 10 1.0Nephritis, nephrotic syndrome and nephrosis (N00-N07,
N17-N19, N25-N27) 9 1.2 9 1.1 8 1.2 8 1.2 8 1.2Aortic aneurysm and dissection (I71) 10 1.0 10 1.0 9 1.1 9 1.1 9 1.1
rank 2age-specific
rate 3 rank 2age-specific
rate 3 rank 2age-specific
rate 3 rank 2age-specific
rate 3 rank 2age-specific
rate 3
Total, all causes of death (A00-Y89) ... 1,780.1 ... 1,817.2 ... 1,882.7 ... 1,928.2 ... 1,967.4Malignant neoplasms (C00-C97) 1 776.5 1 787.6 1 798.3 1 814.1 1 822.5Diseases of heart (I00-I09, I11, I13, I20-I51) 2 353.7 2 372.9 2 403.0 2 422.0 2 449.5Chronic lower respiratory diseases (J40-J47) 3 88.2 3 87.7 3 91.9 4 95.3 4 98.0Cerebrovascular diseases (I60-I69) 4 80.9 4 82.4 4 91.1 3 95.9 3 100.5Diabetes mellitus (E10-E14) 5 68.8 5 72.1 5 76.7 5 77.9 5 74.8Accidents (unintentional injuries) (V01-X59, Y85-Y86) 6 36.4 6 34.9 6 35.6 6 35.5 6 34.9Chronic liver disease and cirrhosis (K70, K73-K74) 7 27.3 7 25.5 7 28.9 7 29.8 7 30.4Influenza and pneumonia (J10-J18) 8 23.5 8 22.3 10 20.6 11 18.7 10 19.9Nephritis, nephrotic syndrome and nephrosis (N00-N07,
N17-N19, N25-N27) 9 22.0 9 20.5 8 22.1 8 23.3 8 24.0Aortic aneurysm and dissection (I71) 10 18.1 10 19.0 9 21.3 9 20.5 9 21.4
See footnotes at the end of the table.
Statistics Canada, Catalogue no. 84-215-X 50

Table 1-8 – continued
Ten leading causes of death by selected age groups, by sex, Canada 1 — 65 to 74 yearsDeaths
2005 2004 2003 2002 2001
rank 2 number rank 2 number rank 2 number rank 2 number rank 2 number
MalesTotal, all causes of death (A00-Y89) ... 23,705 ... 24,022 ... 24,776 ... 25,185 ... 25,361Malignant neoplasms (C00-C97) 1 10,004 1 10,007 1 10,093 1 10,243 1 10,309Diseases of heart (I00-I09, I11, I13, I20-I51) 2 5,279 2 5,522 2 5,970 2 6,083 2 6,389Chronic lower respiratory diseases (J40-J47) 3 1,080 3 1,112 4 1,114 4 1,152 4 1,210Cerebrovascular diseases (I60-I69) 4 1,034 4 1,036 3 1,122 3 1,168 3 1,237Diabetes mellitus (E10-E14) 5 918 5 966 5 999 5 1,008 5 904Accidents (unintentional injuries) (V01-X59, Y85-Y86) 6 513 6 483 6 491 6 489 6 497Chronic liver disease and cirrhosis (K70, K73-K74) 7 414 7 378 7 433 7 437 7 427Influenza and pneumonia (J10-J18) 8 304 9 287 10 252 10 252 10 237Nephritis, nephrotic syndrome and nephrosis (N00-N07,
N17-N19, N25-N27) 9 296 10 277 9 274 9 289 9 319Aortic aneurysm and dissection (I71) 10 276 8 297 8 327 8 321 8 331
rank 2 percent rank 2 percent rank 2 percent rank 2 percent rank 2 percent
Total, all causes of death (A00-Y89) ... 100.0 ... 100.0 ... 100.0 ... 100.0 ... 100.0Malignant neoplasms (C00-C97) 1 42.2 1 41.7 1 40.7 1 40.7 1 40.6Diseases of heart (I00-I09, I11, I13, I20-I51) 2 22.3 2 23.0 2 24.1 2 24.2 2 25.2Chronic lower respiratory diseases (J40-J47) 3 4.6 3 4.6 4 4.5 4 4.6 4 4.8Cerebrovascular diseases (I60-I69) 4 4.4 4 4.3 3 4.5 3 4.6 3 4.9Diabetes mellitus (E10-E14) 5 3.9 5 4.0 5 4.0 5 4.0 5 3.6Accidents (unintentional injuries) (V01-X59, Y85-Y86) 6 2.2 6 2.0 6 2.0 6 1.9 6 2.0Chronic liver disease and cirrhosis (K70, K73-K74) 7 1.7 7 1.6 7 1.7 7 1.7 7 1.7Influenza and pneumonia (J10-J18) 8 1.3 9 1.2 10 1.0 10 1.0 10 0.9Nephritis, nephrotic syndrome and nephrosis (N00-N07,
N17-N19, N25-N27) 9 1.2 10 1.2 9 1.1 9 1.1 9 1.3Aortic aneurysm and dissection (I71) 10 1.2 8 1.2 8 1.3 8 1.3 8 1.3
rank 2age-specific
rate 3 rank 2age-specific
rate 3 rank 2age-specific
rate 3 rank 2age-specific
rate 3 rank 2age-specific
rate 3
Total, all causes of death (A00-Y89) ... 2,228.7 ... 2,283.1 ... 2,385.8 ... 2,450.4 ... 2,501.2Malignant neoplasms (C00-C97) 1 940.6 1 951.1 1 971.9 1 996.6 1 1,016.7Diseases of heart (I00-I09, I11, I13, I20-I51) 2 496.3 2 524.8 2 574.9 2 591.8 2 630.1Chronic lower respiratory diseases (J40-J47) 3 101.5 3 105.7 4 107.3 4 112.1 4 119.3Cerebrovascular diseases (I60-I69) 4 97.2 4 98.5 3 108.0 3 113.6 3 122.0Diabetes mellitus (E10-E14) 5 86.3 5 91.8 5 96.2 5 98.1 5 89.2Accidents (unintentional injuries) (V01-X59, Y85-Y86) 6 48.2 6 45.9 6 47.3 6 47.6 6 49.0Chronic liver disease and cirrhosis (K70, K73-K74) 7 38.9 7 35.9 7 41.7 7 42.5 7 42.1Influenza and pneumonia (J10-J18) 8 28.6 9 27.3 10 24.3 10 24.5 10 23.4Nephritis, nephrotic syndrome and nephrosis (N00-N07,
N17-N19, N25-N27) 9 27.8 10 26.3 9 26.4 9 28.1 9 31.5Aortic aneurysm and dissection (I71) 10 25.9 8 28.2 8 31.5 8 31.2 8 32.6
See footnotes at the end of the table.
Statistics Canada, Catalogue no. 84-215-X 51

Table 1-8 – continued
Ten leading causes of death by selected age groups, by sex, Canada 1 — 65 to 74 yearsDeaths
2005 2004 2003 2002 2001
rank 2 number rank 2 number rank 2 number rank 2 number rank 2 number
FemalesTotal, all causes of death (A00-Y89) ... 16,124 ... 16,240 ... 16,463 ... 16,720 ... 17,029Malignant neoplasms (C00-C97) 1 7,369 1 7,444 1 7,393 1 7,449 1 7,412Diseases of heart (I00-I09, I11, I13, I20-I51) 2 2,635 2 2,741 2 2,858 2 3,088 2 3,296Chronic lower respiratory diseases (J40-J47) 3 893 3 831 3 898 3 918 4 902Cerebrovascular diseases (I60-I69) 4 777 4 789 4 873 4 916 3 928Diabetes mellitus (E10-E14) 5 621 5 631 5 680 5 684 5 707Accidents (unintentional injuries) (V01-X59, Y85-Y86) 6 302 6 291 6 288 6 282 6 255Influenza and pneumonia (J10-J18) 7 222 7 208 10 199 10 154 10 191Chronic liver disease and cirrhosis (K70, K73-K74) 8 196 9 187 9 201 9 211 7 228Nephritis, nephrotic syndrome and nephrosis (N00-N07,
N17-N19, N25-N27) 8 196 10 177 7 209 8 218 9 198Alzheimer’s disease (G30) 10 175 8 198 8 205 7 238 8 223
rank 2 percent rank 2 percent rank 2 percent rank 2 percent rank 2 percent
Total, all causes of death (A00-Y89) ... 100.0 ... 100.0 ... 100.0 ... 100.0 ... 100.0Malignant neoplasms (C00-C97) 1 45.7 1 45.8 1 44.9 1 44.6 1 43.5Diseases of heart (I00-I09, I11, I13, I20-I51) 2 16.3 2 16.9 2 17.4 2 18.5 2 19.4Chronic lower respiratory diseases (J40-J47) 3 5.5 3 5.1 3 5.5 3 5.5 4 5.3Cerebrovascular diseases (I60-I69) 4 4.8 4 4.9 4 5.3 4 5.5 3 5.4Diabetes mellitus (E10-E14) 5 3.9 5 3.9 5 4.1 5 4.1 5 4.2Accidents (unintentional injuries) (V01-X59, Y85-Y86) 6 1.9 6 1.8 6 1.7 6 1.7 6 1.5Influenza and pneumonia (J10-J18) 7 1.4 7 1.3 10 1.2 10 0.9 10 1.1Chronic liver disease and cirrhosis (K70, K73-K74) 8 1.2 9 1.2 9 1.2 9 1.3 7 1.3Nephritis, nephrotic syndrome and nephrosis (N00-N07,
N17-N19, N25-N27) 8 1.2 10 1.1 7 1.3 8 1.3 9 1.2Alzheimer’s disease (G30) 10 1.1 8 1.2 8 1.2 7 1.4 8 1.3
rank 2age-specific
rate 3 rank 2age-specific
rate 3 rank 2age-specific
rate 3 rank 2age-specific
rate 3 rank 2age-specific
rate 3
Total, all causes of death (A00-Y89) ... 1,373.7 ... 1,395.8 ... 1,429.2 ... 1,459.7 ... 1,492.9Malignant neoplasms (C00-C97) 1 627.8 1 639.8 1 641.8 1 650.3 1 649.8Diseases of heart (I00-I09, I11, I13, I20-I51) 2 224.5 2 235.6 2 248.1 2 269.6 2 289.0Chronic lower respiratory diseases (J40-J47) 3 76.1 3 71.4 3 78.0 3 80.1 4 79.1Cerebrovascular diseases (I60-I69) 4 66.2 4 67.8 4 75.8 4 80.0 3 81.4Diabetes mellitus (E10-E14) 5 52.9 5 54.2 5 59.0 5 59.7 5 62.0Accidents (unintentional injuries) (V01-X59, Y85-Y86) 6 25.7 6 25.0 6 25.0 6 24.6 6 22.4Influenza and pneumonia (J10-J18) 7 18.9 7 17.9 10 17.3 10 13.4 10 16.7Chronic liver disease and cirrhosis (K70, K73-K74) 8 16.7 9 16.1 9 17.4 9 18.4 7 20.0Nephritis, nephrotic syndrome and nephrosis (N00-N07,
N17-N19, N25-N27) 8 16.7 10 15.2 7 18.1 8 19.0 9 17.4Alzheimer’s disease (G30) 10 14.9 8 17.0 8 17.8 7 20.8 8 19.5
1. The geographic distribution of deaths in this table is based on the deceased’s usual place of residence. Counts in this table exclude deaths of non-residents ofCanada.
2. The ranking of the leading causes of death is based on the number of deaths.3. The age-specific mortality rates per 100,000 population use the population estimates in the Appendix 3 as denominator.Note(s): See "Introduction", "Glossary" and "Definitions, data sources and methods" sections.Source(s): Statistics Canada, Canadian Vital Statistics, Death Database (CANSIM table 102-0561).
Statistics Canada, Catalogue no. 84-215-X 52

Table 1-9Ten leading causes of death by selected age groups, by sex, Canada 1 — 75 to 84 years
Deaths
2005 2004 2003 2002 2001
rank 2 number rank 2 number rank 2 number rank 2 number rank 2 number
Both sexesTotal, all causes of death (A00-Y89) ... 70,125 ... 69,805 ... 69,471 ... 68,618 ... 67,011Malignant neoplasms (C00-C97) 1 20,973 1 20,891 1 20,230 1 19,747 1 19,116Diseases of heart (I00-I09, I11, I13, I20-I51) 2 16,479 2 16,816 2 17,440 2 17,590 2 17,763Cerebrovascular diseases (I60-I69) 3 4,850 3 5,222 3 5,425 3 5,533 3 5,550Chronic lower respiratory diseases (J40-J47) 4 4,314 4 4,234 4 4,190 4 4,072 4 4,102Diabetes mellitus (E10-E14) 5 2,800 5 2,833 5 2,867 5 2,853 5 2,547Alzheimer’s disease (G30) 6 1,992 6 1,924 6 1,931 6 1,950 6 1,927Influenza and pneumonia (J10-J18) 7 1,688 7 1,590 8 1,439 8 1,368 7 1,422Accidents (unintentional injuries) (V01-X59, Y85-Y86) 8 1,601 8 1,499 7 1,472 7 1,381 8 1,277Nephritis, nephrotic syndrome and nephrosis (N00-N07,
N17-N19, N25-N27) 9 1,312 9 1,271 9 1,281 9 1,310 9 1,199Parkinson’s disease (G20-G21) 10 888 10 806 10 840 10 817 11 782
rank 2 percent rank 2 percent rank 2 percent rank 2 percent rank 2 percent
Total, all causes of death (A00-Y89) ... 100.0 ... 100.0 ... 100.0 ... 100.0 ... 100.0Malignant neoplasms (C00-C97) 1 29.9 1 29.9 1 29.1 1 28.8 1 28.5Diseases of heart (I00-I09, I11, I13, I20-I51) 2 23.5 2 24.1 2 25.1 2 25.6 2 26.5Cerebrovascular diseases (I60-I69) 3 6.9 3 7.5 3 7.8 3 8.1 3 8.3Chronic lower respiratory diseases (J40-J47) 4 6.2 4 6.1 4 6.0 4 5.9 4 6.1Diabetes mellitus (E10-E14) 5 4.0 5 4.1 5 4.1 5 4.2 5 3.8Alzheimer’s disease (G30) 6 2.8 6 2.8 6 2.8 6 2.8 6 2.9Influenza and pneumonia (J10-J18) 7 2.4 7 2.3 8 2.1 8 2.0 7 2.1Accidents (unintentional injuries) (V01-X59, Y85-Y86) 8 2.3 8 2.1 7 2.1 7 2.0 8 1.9Nephritis, nephrotic syndrome and nephrosis (N00-N07,
N17-N19, N25-N27) 9 1.9 9 1.8 9 1.8 9 1.9 9 1.8Parkinson’s disease (G20-G21) 10 1.3 10 1.2 10 1.2 10 1.2 11 1.2
rank 2age-specific
rate 3 rank 2age-specific
rate 3 rank 2age-specific
rate 3 rank 2age-specific
rate 3 rank 2age-specific
rate 3
Total, all causes of death (A00-Y89) ... 4,704.2 ... 4,779.9 ... 4,873.7 ... 4,964.6 ... 4,991.4Malignant neoplasms (C00-C97) 1 1,406.9 1 1,430.5 1 1,419.2 1 1,428.7 1 1,423.9Diseases of heart (I00-I09, I11, I13, I20-I51) 2 1,105.5 2 1,151.5 2 1,223.5 2 1,272.7 2 1,323.1Cerebrovascular diseases (I60-I69) 3 325.3 3 357.6 3 380.6 3 400.3 3 413.4Chronic lower respiratory diseases (J40-J47) 4 289.4 4 289.9 4 293.9 4 294.6 4 305.5Diabetes mellitus (E10-E14) 5 187.8 5 194.0 5 201.1 5 206.4 5 189.7Alzheimer’s disease (G30) 6 133.6 6 131.7 6 135.5 6 141.1 6 143.5Influenza and pneumonia (J10-J18) 7 113.2 7 108.9 8 101.0 8 99.0 7 105.9Accidents (unintentional injuries) (V01-X59, Y85-Y86) 8 107.4 8 102.6 7 103.3 7 99.9 8 95.1Nephritis, nephrotic syndrome and nephrosis (N00-N07,
N17-N19, N25-N27) 9 88.0 9 87.0 9 89.9 9 94.8 9 89.3Parkinson’s disease (G20-G21) 10 59.6 10 55.2 10 58.9 10 59.1 11 58.2
See footnotes at the end of the table.
Statistics Canada, Catalogue no. 84-215-X 53

Table 1-9 – continued
Ten leading causes of death by selected age groups, by sex, Canada 1 — 75 to 84 yearsDeaths
2005 2004 2003 2002 2001
rank 2 number rank 2 number rank 2 number rank 2 number rank 2 number
MalesTotal, all causes of death (A00-Y89) ... 36,098 ... 36,014 ... 35,865 ... 35,076 ... 34,546Malignant neoplasms (C00-C97) 1 11,315 1 11,240 1 10,871 1 10,644 1 10,359Diseases of heart (I00-I09, I11, I13, I20-I51) 2 8,763 2 9,035 2 9,492 2 9,242 2 9,435Chronic lower respiratory diseases (J40-J47) 3 2,420 4 2,311 4 2,360 4 2,341 4 2,380Cerebrovascular diseases (I60-I69) 4 2,146 3 2,400 3 2,520 3 2,524 3 2,564Diabetes mellitus (E10-E14) 5 1,410 5 1,399 5 1,380 5 1,375 5 1,170Accidents (unintentional injuries) (V01-X59, Y85-Y86) 6 845 7 742 6 756 6 721 9 639Influenza and pneumonia (J10-J18) 7 839 6 830 7 722 9 679 6 736Alzheimer’s disease (G30) 8 732 8 682 8 698 8 694 7 710Nephritis, nephrotic syndrome and nephrosis (N00-N07,
N17-N19, N25-N27) 9 723 9 670 9 678 7 713 8 662Parkinson’s disease (G20-G21) 10 550 10 474 10 493 11 456 11 463
rank 2 percent rank 2 percent rank 2 percent rank 2 percent rank 2 percent
Total, all causes of death (A00-Y89) ... 100.0 ... 100.0 ... 100.0 ... 100.0 ... 100.0Malignant neoplasms (C00-C97) 1 31.3 1 31.2 1 30.3 1 30.3 1 30.0Diseases of heart (I00-I09, I11, I13, I20-I51) 2 24.3 2 25.1 2 26.5 2 26.3 2 27.3Chronic lower respiratory diseases (J40-J47) 3 6.7 4 6.4 4 6.6 4 6.7 4 6.9Cerebrovascular diseases (I60-I69) 4 5.9 3 6.7 3 7.0 3 7.2 3 7.4Diabetes mellitus (E10-E14) 5 3.9 5 3.9 5 3.8 5 3.9 5 3.4Accidents (unintentional injuries) (V01-X59, Y85-Y86) 6 2.3 7 2.1 6 2.1 6 2.1 9 1.8Influenza and pneumonia (J10-J18) 7 2.3 6 2.3 7 2.0 9 1.9 6 2.1Alzheimer’s disease (G30) 8 2.0 8 1.9 8 1.9 8 2.0 7 2.1Nephritis, nephrotic syndrome and nephrosis (N00-N07,
N17-N19, N25-N27) 9 2.0 9 1.9 9 1.9 7 2.0 8 1.9Parkinson’s disease (G20-G21) 10 1.5 10 1.3 10 1.4 11 1.3 11 1.3
rank 2age-specific
rate 3 rank 2age-specific
rate 3 rank 2age-specific
rate 3 rank 2age-specific
rate 3 rank 2age-specific
rate 3
Total, all causes of death (A00-Y89) ... 5,822.5 ... 5,986.3 ... 6,160.0 ... 6,272.5 ... 6,432.3Malignant neoplasms (C00-C97) 1 1,825.1 1 1,868.3 1 1,867.2 1 1,903.4 1 1,928.8Diseases of heart (I00-I09, I11, I13, I20-I51) 2 1,413.5 2 1,501.8 2 1,630.3 2 1,652.7 2 1,756.8Chronic lower respiratory diseases (J40-J47) 3 390.3 4 384.1 4 405.3 4 418.6 4 443.1Cerebrovascular diseases (I60-I69) 4 346.1 3 398.9 3 432.8 3 451.4 3 477.4Diabetes mellitus (E10-E14) 5 227.4 5 232.5 5 237.0 5 245.9 5 217.8Accidents (unintentional injuries) (V01-X59, Y85-Y86) 6 136.3 7 123.3 6 129.8 6 128.9 9 119.0Influenza and pneumonia (J10-J18) 7 135.3 6 138.0 7 124.0 9 121.4 6 137.0Alzheimer’s disease (G30) 8 118.1 8 113.4 8 119.9 8 124.1 7 132.2Nephritis, nephrotic syndrome and nephrosis (N00-N07,
N17-N19, N25-N27) 9 116.6 9 111.4 9 116.5 7 127.5 8 123.3Parkinson’s disease (G20-G21) 10 88.7 10 78.8 10 84.7 11 81.5 11 86.2
See footnotes at the end of the table.
Statistics Canada, Catalogue no. 84-215-X 54

Table 1-9 – continued
Ten leading causes of death by selected age groups, by sex, Canada 1 — 75 to 84 yearsDeaths
2005 2004 2003 2002 2001
rank 2 number rank 2 number rank 2 number rank 2 number rank 2 number
FemalesTotal, all causes of death (A00-Y89) ... 34,027 ... 33,791 ... 33,606 ... 33,542 ... 32,465Malignant neoplasms (C00-C97) 1 9,658 1 9,651 1 9,359 1 9,103 1 8,757Diseases of heart (I00-I09, I11, I13, I20-I51) 2 7,716 2 7,781 2 7,948 2 8,348 2 8,328Cerebrovascular diseases (I60-I69) 3 2,704 3 2,822 3 2,905 3 3,009 3 2,986Chronic lower respiratory diseases (J40-J47) 4 1,894 4 1,923 4 1,830 4 1,731 4 1,722Diabetes mellitus (E10-E14) 5 1,390 5 1,434 5 1,487 5 1,478 5 1,377Alzheimer’s disease (G30) 6 1,260 6 1,242 6 1,233 6 1,256 6 1,217Influenza and pneumonia (J10-J18) 7 849 7 760 7 717 7 689 7 686Accidents (unintentional injuries) (V01-X59, Y85-Y86) 8 756 8 757 8 716 8 660 8 638Nephritis, nephrotic syndrome and nephrosis (N00-N07,
N17-N19, N25-N27) 9 589 9 601 9 603 9 597 9 537Parkinson’s disease (G20-G21) 10 338 10 332 10 347 10 361 10 319
rank 2 percent rank 2 percent rank 2 percent rank 2 percent rank 2 percent
Total, all causes of death (A00-Y89) ... 100.0 ... 100.0 ... 100.0 ... 100.0 ... 100.0Malignant neoplasms (C00-C97) 1 28.4 1 28.6 1 27.8 1 27.1 1 27.0Diseases of heart (I00-I09, I11, I13, I20-I51) 2 22.7 2 23.0 2 23.7 2 24.9 2 25.7Cerebrovascular diseases (I60-I69) 3 7.9 3 8.4 3 8.6 3 9.0 3 9.2Chronic lower respiratory diseases (J40-J47) 4 5.6 4 5.7 4 5.4 4 5.2 4 5.3Diabetes mellitus (E10-E14) 5 4.1 5 4.2 5 4.4 5 4.4 5 4.2Alzheimer’s disease (G30) 6 3.7 6 3.7 6 3.7 6 3.7 6 3.7Influenza and pneumonia (J10-J18) 7 2.5 7 2.2 7 2.1 7 2.1 7 2.1Accidents (unintentional injuries) (V01-X59, Y85-Y86) 8 2.2 8 2.2 8 2.1 8 2.0 8 2.0Nephritis, nephrotic syndrome and nephrosis (N00-N07,
N17-N19, N25-N27) 9 1.7 9 1.8 9 1.8 9 1.8 9 1.7Parkinson’s disease (G20-G21) 10 1.0 10 1.0 10 1.0 10 1.1 10 1.0
rank 2age-specific
rate 3 rank 2age-specific
rate 3 rank 2age-specific
rate 3 rank 2age-specific
rate 3 rank 2age-specific
rate 3
Total, all causes of death (A00-Y89) ... 3,907.9 ... 3,934.8 ... 3,985.6 ... 4,075.9 ... 4,030.7Malignant neoplasms (C00-C97) 1 1,109.2 1 1,123.8 1 1,110.0 1 1,106.2 1 1,087.2Diseases of heart (I00-I09, I11, I13, I20-I51) 2 886.1 2 906.1 2 942.6 2 1,014.4 2 1,034.0Cerebrovascular diseases (I60-I69) 3 310.5 3 328.6 3 344.5 3 365.6 3 370.7Chronic lower respiratory diseases (J40-J47) 4 217.5 4 223.9 4 217.0 4 210.3 4 213.8Diabetes mellitus (E10-E14) 5 159.6 5 167.0 5 176.4 5 179.6 5 171.0Alzheimer’s disease (G30) 6 144.7 6 144.6 6 146.2 6 152.6 6 151.1Influenza and pneumonia (J10-J18) 7 97.5 7 88.5 7 85.0 7 83.7 7 85.2Accidents (unintentional injuries) (V01-X59, Y85-Y86) 8 86.8 8 88.1 8 84.9 8 80.2 8 79.2Nephritis, nephrotic syndrome and nephrosis (N00-N07,
N17-N19, N25-N27) 9 67.6 9 70.0 9 71.5 9 72.5 9 66.7Parkinson’s disease (G20-G21) 10 38.8 10 38.7 10 41.2 10 43.9 10 39.6
1. The geographic distribution of deaths in this table is based on the deceased’s usual place of residence. Counts in this table exclude deaths of non-residents ofCanada.
2. The ranking of the leading causes of death is based on the number of deaths.3. The age-specific mortality rates per 100,000 population use the population estimates in the Appendix 3 as denominator.Note(s): See "Introduction", "Glossary" and "Definitions, data sources and methods" sections.Source(s): Statistics Canada, Canadian Vital Statistics, Death Database (CANSIM table 102-0561).
Statistics Canada, Catalogue no. 84-215-X 55

Table 1-10 Ten leading causes of death by selected age groups, by sex, Canada1 — 85 yearsand over
Deaths
2005 2004 2003 2002 2001 rank 2 number rank 2 number rank 2 number rank 2 number rank 2 numberBoth sexes Total, all causes of death (A00-Y89) ... 68,424 ... 65,827 ... 64,876 ... 63,448 ... 61,288Diseases of heart (I00-I09, I11, I13, I20-I51) 1 19,616 1 19,231 1 19,006 1 19,253 1 18,890
Malignant neoplasms (C00-C97) 2 10,026 2 9,576 2 9,529 2 9,230 2 8,864Cerebrovascular diseases (I60-I69) 3 6,018 3 6,320 3 6,560 3 6,481 3 6,412Chronic lower respiratory diseases (J40-J47) 4 3,405 6 3,099 4 3,181 5 2,966 5 2,822
Alzheimer's disease (G30) 5 3,360 4 3,209 5 3,155 4 3,059 4 3,063Influenza and pneumonia (J10-J18) 6 3,106 5 3,199 6 2,678 6 2,589 6 2,571Diabetes mellitus (E10-E14) 7 2,187 7 2,071 7 2,094 7 2,001 8 1,748Accidents (unintentional injuries) (V01-X59, Y85-Y86) 8 2,076 8 2,042 8 2,079 8 1,947 7 1,760
Nephritis, nephrotic syndrome andnephrosis (N00-N07, N17-N19, N25-N27) 9 1,551 9 1,524 9 1,436 9 1,335 9 1,204
Essential (primary) hypertension andhypertensive renal disease (I10, I12) 10 735 11 671 11 606 11 581 12 461
rank 2 percent rank 2 percent rank 2 percent rank 2 percent rank 2 percentTotal, all causes of death (A00-Y89) ... 100.0 ... 100.0 ... 100.0 ... 100.0 ... 100.0Diseases of heart (I00-I09, I11, I13, I20-I51) 1 28.7 1 29.2 1 29.3 1 30.3 1 30.8
Malignant neoplasms (C00-C97) 2 14.7 2 14.5 2 14.7 2 14.5 2 14.5Cerebrovascular diseases (I60-I69) 3 8.8 3 9.6 3 10.1 3 10.2 3 10.5Chronic lower respiratory diseases (J40-J47) 4 5.0 6 4.7 4 4.9 5 4.7 5 4.6
Alzheimer's disease (G30) 5 4.9 4 4.9 5 4.9 4 4.8 4 5.0Influenza and pneumonia (J10-J18) 6 4.5 5 4.9 6 4.1 6 4.1 6 4.2Diabetes mellitus (E10-E14) 7 3.2 7 3.1 7 3.2 7 3.2 8 2.9Accidents (unintentional injuries) (V01-X59, Y85-Y86) 8 3.0 8 3.1 8 3.2 8 3.1 7 2.9
Nephritis, nephrotic syndrome andnephrosis (N00-N07, N17-N19, N25-N27) 9 2.3 9 2.3 9 2.2 9 2.1 9 2.0
Essential (primary) hypertension andhypertensive renal disease (I10, I12) 10 1.1 11 1.0 11 0.9 11 0.9 12 0.8
rank 2age-
specificrate 3
rank 2age-
specificrate 3
rank 2age-
specificrate 3
rank 2age-
specificrate 3
rank 2age-
specificrate 3
Total, all causes of death (A00-Y89) ... 13,876.4 ... 14,112.7 ... 14,405.1 ... 14,583.0 ... 14,235.5Diseases of heart (I00-I09, I11, I13, I20-I51) 1 3,978.1 1 4,122.9 1 4,220.1 1 4,425.2 1 4,387.6
Malignant neoplasms (C00-C97) 2 2,033.3 2 2,053.0 2 2,115.8 2 2,121.4 2 2,058.9Cerebrovascular diseases (I60-I69) 3 1,220.5 3 1,354.9 3 1,456.6 3 1,489.6 3 1,489.3Chronic lower respiratory diseases (J40-J47) 4 690.5 6 664.4 4 706.3 5 681.7 5 655.5
Alzheimer's disease (G30) 5 681.4 4 688.0 5 700.5 4 703.1 4 711.5Influenza and pneumonia (J10-J18) 6 629.9 5 685.8 6 594.6 6 595.1 6 597.2Diabetes mellitus (E10-E14) 7 443.5 7 444.0 7 465.0 7 459.9 8 406.0Accidents (unintentional injuries) (V01-X59, Y85-Y86) 8 421.0 8 437.8 8 461.6 8 447.5 7 408.8
Nephritis, nephrotic syndrome andnephrosis (N00-N07, N17-N19, N25-N27) 9 314.5 9 326.7 9 318.9 9 306.8 9 279.7
Statistics Canada, Catalogue no. 84-215-X 56

Deaths
2005 2004 2003 2002 2001Essential (primary) hypertension andhypertensive renal disease (I10, I12) 10 149.1 11 143.9 11 134.6 11 133.5 12 107.1
Deaths
2005 2004 2003 2002 2001 rank 2 number rank 2 number rank 2 number rank 2 number rank 2 numberMales Total, all causes of death (A00-Y89) ... 24,214 ... 23,009 ... 22,872 ... 22,352 ... 21,505Diseases of heart (I00-I09, I11, I13, I20-I51) 1 6,910 1 6,616 1 6,577 1 6,625 1 6,457
Malignant neoplasms (C00-C97) 2 4,463 2 4,258 2 4,214 2 4,137 2 3,981Cerebrovascular diseases (I60-I69) 3 1,799 3 1,808 3 1,997 3 1,940 3 1,872Chronic lower respiratory diseases (J40-J47) 4 1,629 4 1,488 4 1,594 4 1,519 4 1,440
Influenza and pneumonia (J10-J18) 5 1,057 5 1,166 5 980 5 927 5 944Diabetes mellitus (E10-E14) 6 767 6 779 7 728 7 697 8 586Alzheimer's disease (G30) 6 767 7 736 6 750 6 762 6 772Accidents (unintentional injuries) (V01-X59, Y85-Y86) 8 730 9 660 8 696 8 640 7 610
Nephritis, nephrotic syndrome andnephrosis (N00-N07, N17-N19, N25-N27) 9 659 8 694 9 576 9 552 9 513
Parkinson's disease (G20-G21) 10 320 10 276 10 253 10 260 10 257 rank 2 percent rank 2 percent rank 2 percent rank 2 percent rank 2 percentTotal, all causes of death (A00-Y89) ... 100.0 ... 100.0 ... 100.0 ... 100.0 ... 100.0Diseases of heart (I00-I09, I11, I13, I20-I51) 1 28.5 1 28.8 1 28.8 1 29.6 1 30.0
Malignant neoplasms (C00-C97) 2 18.4 2 18.5 2 18.4 2 18.5 2 18.5Cerebrovascular diseases (I60-I69) 3 7.4 3 7.9 3 8.7 3 8.7 3 8.7Chronic lower respiratory diseases (J40-J47) 4 6.7 4 6.5 4 7.0 4 6.8 4 6.7
Influenza and pneumonia (J10-J18) 5 4.4 5 5.1 5 4.3 5 4.1 5 4.4Diabetes mellitus (E10-E14) 6 3.2 6 3.4 7 3.2 7 3.1 8 2.7Alzheimer's disease (G30) 6 3.2 7 3.2 6 3.3 6 3.4 6 3.6Accidents (unintentional injuries) (V01-X59, Y85-Y86) 8 3.0 9 2.9 8 3.0 8 2.9 7 2.8
Nephritis, nephrotic syndrome andnephrosis (N00-N07, N17-N19, N25-N27) 9 2.7 8 3.0 9 2.5 9 2.5 9 2.4
Parkinson's disease (G20-G21) 10 1.3 10 1.2 10 1.1 10 1.2 10 1.2
rank 2age-
specificrate 3
rank 2age-
specificrate 3
rank 2age-
specificrate 3
rank 2age-
specificrate 3
rank 2age-
specificrate 3
Total, all causes of death (A00-Y89) ... 15,923.9 ... 16,147.9 ... 16,716.6 ... 16,975.1 ... 16,409.6Diseases of heart (I00-I09, I11, I13, I20-I51) 1 4,544.2 1 4,643.2 1 4,807.0 1 5,031.3 1 4,927.1
Malignant neoplasms (C00-C97) 2 2,935.0 2 2,988.3 2 3,079.9 2 3,141.8 2 3,037.7Cerebrovascular diseases (I60-I69) 3 1,183.1 3 1,268.9 3 1,459.6 3 1,473.3 3 1,428.5Chronic lower respiratory diseases (J40-J47) 4 1,071.3 4 1,044.3 4 1,165.0 4 1,153.6 4 1,098.8
Influenza and pneumonia (J10-J18) 5 695.1 5 818.3 5 716.3 5 704.0 5 720.3Diabetes mellitus (E10-E14) 6 504.4 6 546.7 7 532.1 7 529.3 8 447.2Alzheimer's disease (G30) 6 504.4 7 516.5 6 548.2 6 578.7 6 589.1Accidents (unintentional injuries) (V01-X59, Y85-Y86) 8 480.1 9 463.2 8 508.7 8 486.0 7 465.5
Nephritis, nephrotic syndrome andnephrosis (N00-N07, N17-N19, N25-N27) 9 433.4 8 487.1 9 421.0 9 419.2 9 391.5
Parkinson's disease (G20-G21) 10 210.4 10 193.7 10 184.9 10 197.5 10 196.1
Deaths
2005 2004 2003 2002 2001 rank 2 number rank 2 number rank 2 number rank 2 number rank 2 numberFemales Total, all causes of death (A00-Y89) ... 44,210 ... 42,818 ... 42,004 ... 41,096 ... 39,783Diseases of heart (I00-I09, I11, I13, I20-I51) 1 12,706 1 12,615 1 12,429 1 12,628 1 12,433
Malignant neoplasms (C00-C97) 2 5,563 2 5,318 2 5,315 2 5,093 2 4,883Cerebrovascular diseases (I60-I69) 3 4,219 3 4,512 3 4,563 3 4,541 3 4,540Alzheimer's disease (G30) 4 2,593 4 2,473 4 2,405 4 2,297 4 2,291Influenza and pneumonia (J10-J18) 5 2,049 5 2,033 5 1,698 5 1,662 5 1,627Chronic lower respiratory diseases (J40-J47) 6 1,776 6 1,611 6 1,587 6 1,447 6 1,382
Diabetes mellitus (E10-E14) 7 1,420 8 1,292 8 1,366 8 1,304 7 1,162
Statistics Canada, Catalogue no. 84-215-X 57

1. The geographic distribution of deaths in this table is based on the deceased's usual place of residence. Counts in this table excludedeaths of non-residents of Canada.
2. The ranking of the leading causes of death is based on the number of deaths.3. The age-specific mortality rates per 100,000 population use the population estimates in the Appendix 3 as denominator.Note(s): See "Introduction", "Glossary" and "Definitions, data sources and methods" sections.Source(s): Statistics Canada, Canadian Vital Statistics, Death Database (CANSIM table 102-0561).
Deaths
2005 2004 2003 2002 2001Accidents (unintentional injuries) (V01-X59, Y85-Y86) 8 1,346 7 1,382 7 1,383 7 1,307 8 1,150
Nephritis, nephrotic syndrome andnephrosis (N00-N07, N17-N19, N25-N27) 9 892 9 830 9 860 9 783 9 691
Essential (primary) hypertension andhypertensive renal disease (I10, I12) 10 550 10 507 10 468 11 426 11 356
rank 2 percent rank 2 percent rank 2 percent rank 2 percent rank 2 percentTotal, all causes of death (A00-Y89) ... 100.0 ... 100.0 ... 100.0 ... 100.0 ... 100.0Diseases of heart (I00-I09, I11, I13, I20-I51) 1 28.7 1 29.5 1 29.6 1 30.7 1 31.3
Malignant neoplasms (C00-C97) 2 12.6 2 12.4 2 12.7 2 12.4 2 12.3Cerebrovascular diseases (I60-I69) 3 9.5 3 10.5 3 10.9 3 11.0 3 11.4Alzheimer's disease (G30) 4 5.9 4 5.8 4 5.7 4 5.6 4 5.8Influenza and pneumonia (J10-J18) 5 4.6 5 4.7 5 4.0 5 4.0 5 4.1Chronic lower respiratory diseases (J40-J47) 6 4.0 6 3.8 6 3.8 6 3.5 6 3.5
Diabetes mellitus (E10-E14) 7 3.2 8 3.0 8 3.3 8 3.2 7 2.9Accidents (unintentional injuries) (V01-X59, Y85-Y86) 8 3.0 7 3.2 7 3.3 7 3.2 8 2.9
Nephritis, nephrotic syndrome andnephrosis (N00-N07, N17-N19, N25-N27) 9 2.0 9 1.9 9 2.0 9 1.9 9 1.7
Essential (primary) hypertension andhypertensive renal disease (I10, I12) 10 1.2 10 1.2 10 1.1 11 1.0 11 0.9
rank 2age-
specificrate 3
rank 2age-
specificrate 3
rank 2age-
specificrate 3
rank 2age-
specificrate 3
rank 2age-
specificrate 3
Total, all causes of death (A00-Y89) ... 12,963.5 ... 13,217.5 ... 13,396.5 ... 13,544.9 ... 13,284.1Diseases of heart (I00-I09, I11, I13, I20-I51) 1 3,725.7 1 3,894.1 1 3,964.0 1 4,162.1 1 4,151.6
Malignant neoplasms (C00-C97) 2 1,631.2 2 1,641.6 2 1,695.1 2 1,678.6 2 1,630.5Cerebrovascular diseases (I60-I69) 3 1,237.1 3 1,392.8 3 1,455.3 3 1,496.7 3 1,516.0Alzheimer's disease (G30) 4 760.3 4 763.4 4 767.0 4 757.1 4 765.0Influenza and pneumonia (J10-J18) 5 600.8 5 627.6 5 541.5 5 547.8 5 543.3Chronic lower respiratory diseases (J40-J47) 6 520.8 6 497.3 6 506.1 6 476.9 6 461.5
Diabetes mellitus (E10-E14) 7 416.4 8 398.8 8 435.7 8 429.8 7 388.0Accidents (unintentional injuries) (V01-X59, Y85-Y86) 8 394.7 7 426.6 7 441.1 7 430.8 8 384.0
Nephritis, nephrotic syndrome andnephrosis (N00-N07, N17-N19, N25-N27) 9 261.6 9 256.2 9 274.3 9 258.1 9 230.7
Essential (primary) hypertension andhypertensive renal disease (I10, I12) 10 161.3 10 156.5 10 149.3 11 140.4 11 118.9
Statistics Canada, Catalogue no. 84-215-X 58

Table 2Ten leading causes of infant death, by sex, Canada 1
Deaths
2005 2004 2003 2002 2001
rank 3 number rank 3 number rank 3 number rank 3 number rank 3 number
Both sexesTotal, all causes of infant death 2 (A00-Y89) ... 1,863 ... 1,775 ... 1,765 ... 1,762 ... 1,739Congenital malformations, deformations and
chromosomal abnormalities (Q00-Q99) 1 447 1 412 1 423 1 427 1 436Disorders related to short gestation and low birth
weight, not elsewhere classified (P07) 2 224 2 252 2 218 2 250 2 194Newborn affected by maternal complications of
pregnancy (P01) 3 170 3 143 3 120 3 111 3 131Sudden infant death syndrome (R95) 4 112 5 84 5 96 3 111 4 112Newborn affected by complications of placenta, cord
and membranes (P02) 5 93 4 106 4 98 5 90 5 86Intrauterine hypoxia and birth asphyxia (P20-P21) 6 79 6 71 6 82 6 56 6 69Newborn affected by other complications of labour and
delivery (P03) 7 58 7 64 8 52 8 45 10 37Neonatal haemorrhages (P50-P52, P54) 8 53 8 53 7 60 7 55 9 47Respiratory distress of newborn (P22) 9 46 9 46 9 44 9 40 8 48Bacterial sepsis of newborn (P36) 10 37 10 31 10 41 10 38 7 58
rank 3 percent rank 3 percent rank 3 percent rank 3 percent rank 3 percent
Total, all causes of infant death 2 (A00-Y89) ... 100.0 ... 100.0 ... 100.0 ... 100.0 ... 100.0Congenital malformations, deformations and
chromosomal abnormalities (Q00-Q99) 1 24.0 1 23.2 1 24.0 1 24.2 1 25.1Disorders related to short gestation and low birth
weight, not elsewhere classified (P07) 2 12.0 2 14.2 2 12.4 2 14.2 2 11.2Newborn affected by maternal complications of
pregnancy (P01) 3 9.1 3 8.1 3 6.8 3 6.3 3 7.5Sudden infant death syndrome (R95) 4 6.0 5 4.7 5 5.4 3 6.3 4 6.4Newborn affected by complications of placenta, cord
and membranes (P02) 5 5.0 4 6.0 4 5.6 5 5.1 5 4.9Intrauterine hypoxia and birth asphyxia (P20-P21) 6 4.2 6 4.0 6 4.6 6 3.2 6 4.0Newborn affected by other complications of labour and
delivery (P03) 7 3.1 7 3.6 8 2.9 8 2.6 10 2.1Neonatal haemorrhages (P50-P52, P54) 8 2.8 8 3.0 7 3.4 7 3.1 9 2.7Respiratory distress of newborn (P22) 9 2.5 9 2.6 9 2.5 9 2.3 8 2.8Bacterial sepsis of newborn (P36) 10 2.0 10 1.7 10 2.3 10 2.2 7 3.3
rank 3 infant rate 4,5 rank 3 infant rate 4,5 rank 3 infant rate 4,5 rank 3 infant rate 4,5 rank 3 infant rate 4,5
Total, all causes of infant death 2 (A00-Y89) ... 544.5 ... 526.6 ... 526.6 ... 535.9 ... 521.1Congenital malformations, deformations and
chromosomal abnormalities (Q00-Q99) 1 130.6 1 122.2 1 126.2 1 129.9 1 130.6Disorders related to short gestation and low birth
weight, not elsewhere classified (P07) 2 65.5 2 74.8 2 65.0 2 76.0 2 58.1Newborn affected by maternal complications of
pregnancy (P01) 3 49.7 3 42.4 3 35.8 3 33.8 3 39.3Sudden infant death syndrome (R95) 4 32.7 5 24.9 5 28.6 3 33.8 4 33.6Newborn affected by complications of placenta, cord
and membranes (P02) 5 27.2 4 31.4 4 29.2 5 27.4 5 25.8Intrauterine hypoxia and birth asphyxia (P20-P21) 6 23.1 6 21.1 6 24.5 6 17.0 6 20.7Newborn affected by other complications of labour and
delivery (P03) 7 17.0 7 19.0 8 15.5 8 13.7 10 11.1Neonatal haemorrhages (P50-P52, P54) 8 15.5 8 15.7 7 17.9 7 16.7 9 14.1Respiratory distress of newborn (P22) 9 13.4 9 13.6 9 13.1 9 12.2 8 14.4Bacterial sepsis of newborn (P36) 10 10.8 10 9.2 10 12.2 10 11.6 7 17.4
See footnotes at the end of the table.
Statistics Canada, Catalogue no. 84-215-X 59

Table 2 – continued
Ten leading causes of infant death, by sex, Canada 1
Deaths
2005 2004 2003 2002 2001
rank 3 number rank 3 number rank 3 number rank 3 number rank 3 number
MalesTotal, all causes of infant death 2 (A00-Y89) ... 1,030 ... 953 ... 983 ... 980 ... 997Congenital malformations, deformations and
chromosomal abnormalities (Q00-Q99) 1 241 1 203 1 224 1 217 1 246Disorders related to short gestation and low birth
weight, not elsewhere classified (P07) 2 114 2 121 2 115 2 148 2 119Newborn affected by maternal complications of
pregnancy (P01) 3 93 3 74 3 77 4 58 3 70Sudden infant death syndrome (R95) 4 72 4 57 5 59 3 68 4 69Newborn affected by complications of placenta, cord
and membranes (P02) 5 55 4 57 4 61 5 47 5 46Intrauterine hypoxia and birth asphyxia (P20-P21) 6 42 6 40 6 50 7 29 7 34Newborn affected by other complications of labour and
delivery (P03) 7 29 7 30 9 24 8 24 11 16Neonatal haemorrhages (P50-P52, P54) 7 29 7 30 7 38 6 32 9 29Bacterial sepsis of newborn (P36) 9 25 13 13 9 24 9 23 6 37Respiratory distress of newborn (P22) 10 22 9 28 8 28 9 23 8 30Necrotizing enterocolitis of newborn (P77) 10 22 10 16 12 14 18 7 14 12
rank 3 percent rank 3 percent rank 3 percent rank 3 percent rank 3 percent
Total, all causes of infant death 2 (A00-Y89) ... 100.0 ... 100.0 ... 100.0 ... 100.0 ... 100.0Congenital malformations, deformations and
chromosomal abnormalities (Q00-Q99) 1 23.4 1 21.3 1 22.8 1 22.1 1 24.7Disorders related to short gestation and low birth
weight, not elsewhere classified (P07) 2 11.1 2 12.7 2 11.7 2 15.1 2 11.9Newborn affected by maternal complications of
pregnancy (P01) 3 9.0 3 7.8 3 7.8 4 5.9 3 7.0Sudden infant death syndrome (R95) 4 7.0 4 6.0 5 6.0 3 6.9 4 6.9Newborn affected by complications of placenta, cord
and membranes (P02) 5 5.3 4 6.0 4 6.2 5 4.8 5 4.6Intrauterine hypoxia and birth asphyxia (P20-P21) 6 4.1 6 4.2 6 5.1 7 3.0 7 3.4Newborn affected by other complications of labour and
delivery (P03) 7 2.8 7 3.1 9 2.4 8 2.4 11 1.6Neonatal haemorrhages (P50-P52, P54) 7 2.8 7 3.1 7 3.9 6 3.3 9 2.9Bacterial sepsis of newborn (P36) 9 2.4 13 1.4 9 2.4 9 2.3 6 3.7Respiratory distress of newborn (P22) 10 2.1 9 2.9 8 2.8 9 2.3 8 3.0Necrotizing enterocolitis of newborn (P77) 10 2.1 10 1.7 12 1.4 18 0.7 14 1.2
rank 3 infant rate 4,5 rank 3 infant rate 4,5 rank 3 infant rate 4,5 rank 3 infant rate 4,5 rank 3 infant rate 4,5
Total, all causes of infant death 2 (A00-Y89) ... 587.3 ... 550.4 ... 572.5 ... 580.4 ... 582.5Congenital malformations, deformations and
chromosomal abnormalities (Q00-Q99) 1 137.4 1 117.2 1 130.5 1 128.5 1 143.7Disorders related to short gestation and low birth
weight, not elsewhere classified (P07) 2 65.0 2 69.9 2 67.0 2 87.7 2 69.5Newborn affected by maternal complications of
pregnancy (P01) 3 53.0 3 42.7 3 44.8 4 34.4 3 40.9Sudden infant death syndrome (R95) 4 41.1 4 32.9 5 34.4 3 40.3 4 40.3Newborn affected by complications of placenta, cord
and membranes (P02) 5 31.4 4 32.9 4 35.5 5 27.8 5 26.9Intrauterine hypoxia and birth asphyxia (P20-P21) 6 23.9 6 23.1 6 29.1 7 17.2 7 19.9Newborn affected by other complications of labour and
delivery (P03) 7 16.5 7 17.3 9 14.0 8 14.2 11 9.3Neonatal haemorrhages (P50-P52, P54) 7 16.5 7 17.3 7 22.1 6 19.0 9 16.9Bacterial sepsis of newborn (P36) 9 14.3 13 7.5 9 14.0 9 13.6 6 21.6Respiratory distress of newborn (P22) 10 12.5 9 16.2 8 16.3 9 13.6 8 17.5Necrotizing enterocolitis of newborn (P77) 10 12.5 10 9.2 12 8.2 18 4.1 14 7.0
See footnotes at the end of the table.
Statistics Canada, Catalogue no. 84-215-X 60
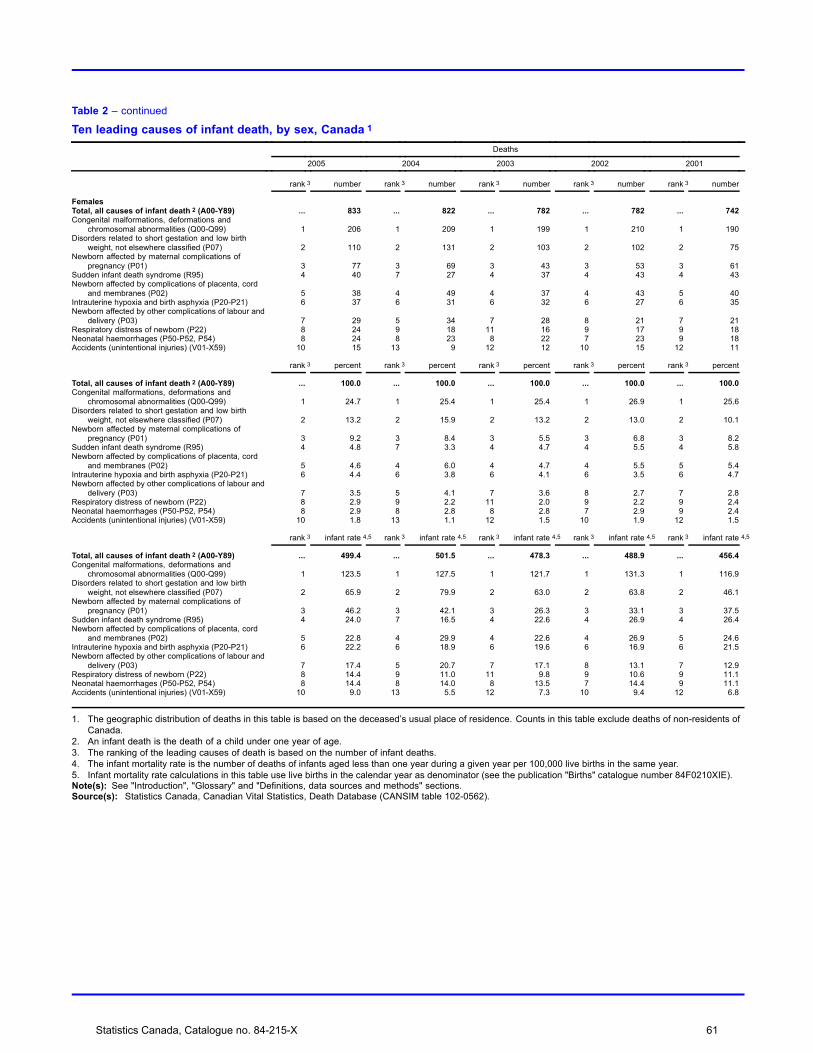
Table 2 – continued
Ten leading causes of infant death, by sex, Canada 1
Deaths
2005 2004 2003 2002 2001
rank 3 number rank 3 number rank 3 number rank 3 number rank 3 number
FemalesTotal, all causes of infant death 2 (A00-Y89) ... 833 ... 822 ... 782 ... 782 ... 742Congenital malformations, deformations and
chromosomal abnormalities (Q00-Q99) 1 206 1 209 1 199 1 210 1 190Disorders related to short gestation and low birth
weight, not elsewhere classified (P07) 2 110 2 131 2 103 2 102 2 75Newborn affected by maternal complications of
pregnancy (P01) 3 77 3 69 3 43 3 53 3 61Sudden infant death syndrome (R95) 4 40 7 27 4 37 4 43 4 43Newborn affected by complications of placenta, cord
and membranes (P02) 5 38 4 49 4 37 4 43 5 40Intrauterine hypoxia and birth asphyxia (P20-P21) 6 37 6 31 6 32 6 27 6 35Newborn affected by other complications of labour and
delivery (P03) 7 29 5 34 7 28 8 21 7 21Respiratory distress of newborn (P22) 8 24 9 18 11 16 9 17 9 18Neonatal haemorrhages (P50-P52, P54) 8 24 8 23 8 22 7 23 9 18Accidents (unintentional injuries) (V01-X59) 10 15 13 9 12 12 10 15 12 11
rank 3 percent rank 3 percent rank 3 percent rank 3 percent rank 3 percent
Total, all causes of infant death 2 (A00-Y89) ... 100.0 ... 100.0 ... 100.0 ... 100.0 ... 100.0Congenital malformations, deformations and
chromosomal abnormalities (Q00-Q99) 1 24.7 1 25.4 1 25.4 1 26.9 1 25.6Disorders related to short gestation and low birth
weight, not elsewhere classified (P07) 2 13.2 2 15.9 2 13.2 2 13.0 2 10.1Newborn affected by maternal complications of
pregnancy (P01) 3 9.2 3 8.4 3 5.5 3 6.8 3 8.2Sudden infant death syndrome (R95) 4 4.8 7 3.3 4 4.7 4 5.5 4 5.8Newborn affected by complications of placenta, cord
and membranes (P02) 5 4.6 4 6.0 4 4.7 4 5.5 5 5.4Intrauterine hypoxia and birth asphyxia (P20-P21) 6 4.4 6 3.8 6 4.1 6 3.5 6 4.7Newborn affected by other complications of labour and
delivery (P03) 7 3.5 5 4.1 7 3.6 8 2.7 7 2.8Respiratory distress of newborn (P22) 8 2.9 9 2.2 11 2.0 9 2.2 9 2.4Neonatal haemorrhages (P50-P52, P54) 8 2.9 8 2.8 8 2.8 7 2.9 9 2.4Accidents (unintentional injuries) (V01-X59) 10 1.8 13 1.1 12 1.5 10 1.9 12 1.5
rank 3 infant rate 4,5 rank 3 infant rate 4,5 rank 3 infant rate 4,5 rank 3 infant rate 4,5 rank 3 infant rate 4,5
Total, all causes of infant death 2 (A00-Y89) ... 499.4 ... 501.5 ... 478.3 ... 488.9 ... 456.4Congenital malformations, deformations and
chromosomal abnormalities (Q00-Q99) 1 123.5 1 127.5 1 121.7 1 131.3 1 116.9Disorders related to short gestation and low birth
weight, not elsewhere classified (P07) 2 65.9 2 79.9 2 63.0 2 63.8 2 46.1Newborn affected by maternal complications of
pregnancy (P01) 3 46.2 3 42.1 3 26.3 3 33.1 3 37.5Sudden infant death syndrome (R95) 4 24.0 7 16.5 4 22.6 4 26.9 4 26.4Newborn affected by complications of placenta, cord
and membranes (P02) 5 22.8 4 29.9 4 22.6 4 26.9 5 24.6Intrauterine hypoxia and birth asphyxia (P20-P21) 6 22.2 6 18.9 6 19.6 6 16.9 6 21.5Newborn affected by other complications of labour and
delivery (P03) 7 17.4 5 20.7 7 17.1 8 13.1 7 12.9Respiratory distress of newborn (P22) 8 14.4 9 11.0 11 9.8 9 10.6 9 11.1Neonatal haemorrhages (P50-P52, P54) 8 14.4 8 14.0 8 13.5 7 14.4 9 11.1Accidents (unintentional injuries) (V01-X59) 10 9.0 13 5.5 12 7.3 10 9.4 12 6.8
1. The geographic distribution of deaths in this table is based on the deceased’s usual place of residence. Counts in this table exclude deaths of non-residents ofCanada.
2. An infant death is the death of a child under one year of age.3. The ranking of the leading causes of death is based on the number of infant deaths.4. The infant mortality rate is the number of deaths of infants aged less than one year during a given year per 100,000 live births in the same year.5. Infant mortality rate calculations in this table use live births in the calendar year as denominator (see the publication "Births" catalogue number 84F0210XIE).Note(s): See "Introduction", "Glossary" and "Definitions, data sources and methods" sections.Source(s): Statistics Canada, Canadian Vital Statistics, Death Database (CANSIM table 102-0562).
Statistics Canada, Catalogue no. 84-215-X 61

Table 3-1Ten leading causes of death, by sex and geography 1, 2005 — Newfounland and Labrador
Canada 2 Newfoundland and LabradorDeaths Deaths
rank 3 number percent age-standardized rate 4 rank 3 number percent age-standardized rate 4
Both sexesTotal, all causes of death (A00-Y89) ... 230,132 100.0 563.7 ... 4,486 100.0 701.6Malignant neoplasms (C00-C97) 1 67,343 29.3 170.3 1 1,261 28.1 196.2Diseases of heart (I00-I09, I11, I13,
I20-I51) 2 51,574 22.4 121.5 2 1,101 24.5 168.8Cerebrovascular diseases (I60-I69) 3 14,054 6.1 32.5 3 325 7.2 49.5Chronic lower respiratory diseases
(J40-J47) 4 10,515 4.6 25.1 5 189 4.2 29.5Accidents (unintentional injuries)
(V01-X59, Y85-Y86) 5 9,506 4.1 25.6 6 139 3.1 23.7Diabetes mellitus (E10-E14) 6 7,881 3.4 19.1 4 223 5.0 34.3Influenza and pneumonia (J10-J18) 7 5,845 2.5 13.2 9 88 2.0 13.1Alzheimer’s disease (G30) 8 5,762 2.5 12.7 8 99 2.2 14.8Intentional self-harm (suicide) (X60-X84,
Y87.0) 9 3,743 1.6 10.9 11 55 1.2 9.7Nephritis, nephrotic syndrome and
nephrosis (N00-N07, N17-N19,N25-N27) 10 3,643 1.6 8.5 7 103 2.3 15.9
MalesTotal, all causes of death (A00-Y89) ... 116,006 100.0 696.8 ... 2,393 100.0 896.1Malignant neoplasms (C00-C97) 1 35,481 30.6 207.7 1 707 29.5 250.9Diseases of heart (I00-I09, I11, I13,
I20-I51) 2 26,675 23.0 160.1 2 603 25.2 222.3Accidents (unintentional injuries)
(V01-X59, Y85-Y86) 3 5,807 5.0 35.6 6 93 3.9 35.8Cerebrovascular diseases (I60-I69) 4 5,767 5.0 35.2 3 146 6.1 57.5Chronic lower respiratory diseases
(J40-J47) 5 5,563 4.8 34.1 4 127 5.3 48.9Diabetes mellitus (E10-E14) 6 3,981 3.4 23.7 5 98 4.1 35.5Intentional self-harm (suicide) (X60-X84,
Y87.0) 7 2,857 2.5 16.9 8 44 1.8 15.9Influenza and pneumonia (J10-J18) 8 2,521 2.2 15.8 9 42 1.8 17.8Nephritis, nephrotic syndrome and
nephrosis (N00-N07, N17-N19,N25-N27) 9 1,859 1.6 11.5 7 49 2.0 20.0
Alzheimer’s disease (G30) 10 1,691 1.5 10.7 11 24 1.0 9.5
FemalesTotal, all causes of death (A00-Y89) ... 114,126 100.0 460.7 ... 2,093 100.0 553.5Malignant neoplasms (C00-C97) 1 31,862 27.9 143.8 1 554 26.5 155.7Diseases of heart (I00-I09, I11, I13,
I20-I51) 2 24,899 21.8 91.5 2 498 23.8 124.7Cerebrovascular diseases (I60-I69) 3 8,287 7.3 30.2 3 179 8.6 43.1Chronic lower respiratory diseases
(J40-J47) 4 4,952 4.3 19.8 6 62 3.0 17.3Alzheimer’s disease (G30) 5 4,071 3.6 13.6 5 75 3.6 17.5Diabetes mellitus (E10-E14) 6 3,900 3.4 15.6 4 125 6.0 32.1Accidents (unintentional injuries)
(V01-X59, Y85-Y86) 7 3,699 3.2 16.5 8 46 2.2 13.4Influenza and pneumonia (J10-J18) 8 3,324 2.9 11.5 8 46 2.2 10.9Nephritis, nephrotic syndrome and
nephrosis (N00-N07, N17-N19,N25-N27) 9 1,784 1.6 6.6 7 54 2.6 13.5
Essential (primary) hypertension andhypertensive renal disease (I10, I12) 10 930 0.8 3.2 10 45 2.2 10.9
1. The geographic distribution of deaths in this table is based on the deceased’s usual place of residence. Counts in this table exclude deaths of non-residents ofCanada.
2. The category "Canada" includes deaths with unknown province or territory of residence in Canada.3. The ranking of the leading causes of death is based on the number of deaths.4. Age standardized mortality rate per 100,000 standard population.Note(s): See "Introduction", "Glossary" and "Definitions, data sources and methods" sections.Source(s): Statistics Canada, Canadian Vital Statistics, Death Database (CANSIM table 102-0563).
Statistics Canada, Catalogue no. 84-215-X 62
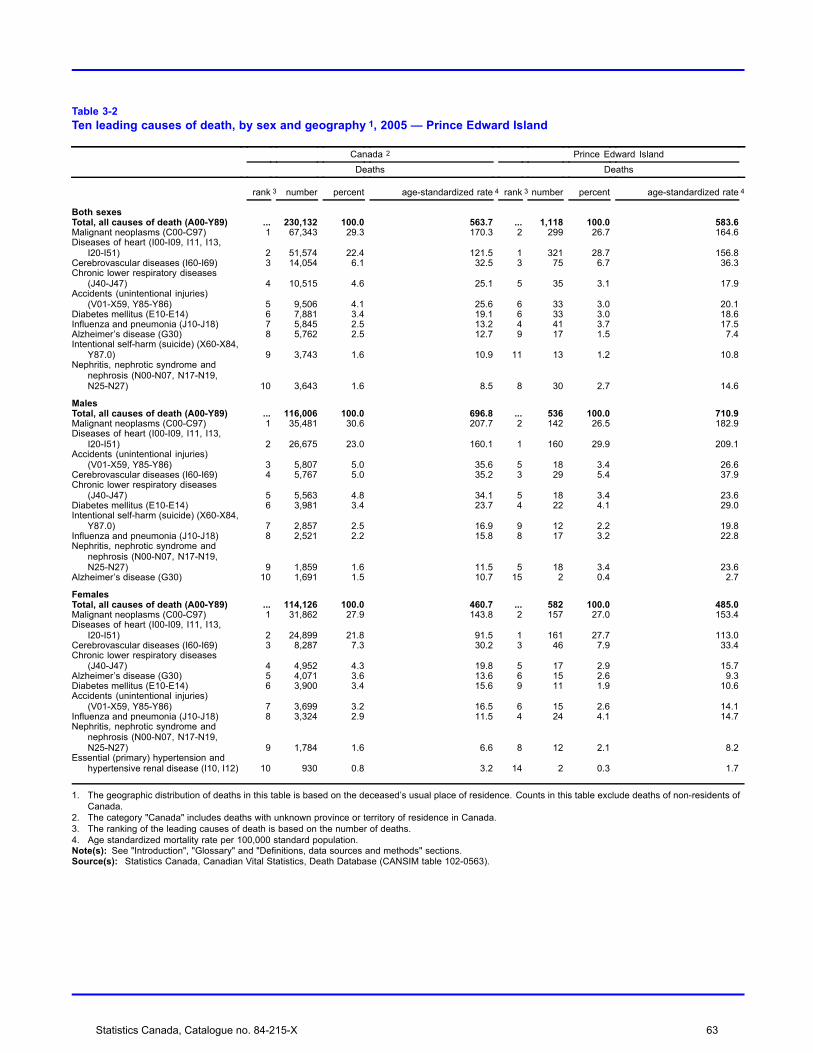
Table 3-2Ten leading causes of death, by sex and geography 1, 2005 — Prince Edward Island
Canada 2 Prince Edward IslandDeaths Deaths
rank 3 number percent age-standardized rate 4 rank 3 number percent age-standardized rate 4
Both sexesTotal, all causes of death (A00-Y89) ... 230,132 100.0 563.7 ... 1,118 100.0 583.6Malignant neoplasms (C00-C97) 1 67,343 29.3 170.3 2 299 26.7 164.6Diseases of heart (I00-I09, I11, I13,
I20-I51) 2 51,574 22.4 121.5 1 321 28.7 156.8Cerebrovascular diseases (I60-I69) 3 14,054 6.1 32.5 3 75 6.7 36.3Chronic lower respiratory diseases
(J40-J47) 4 10,515 4.6 25.1 5 35 3.1 17.9Accidents (unintentional injuries)
(V01-X59, Y85-Y86) 5 9,506 4.1 25.6 6 33 3.0 20.1Diabetes mellitus (E10-E14) 6 7,881 3.4 19.1 6 33 3.0 18.6Influenza and pneumonia (J10-J18) 7 5,845 2.5 13.2 4 41 3.7 17.5Alzheimer’s disease (G30) 8 5,762 2.5 12.7 9 17 1.5 7.4Intentional self-harm (suicide) (X60-X84,
Y87.0) 9 3,743 1.6 10.9 11 13 1.2 10.8Nephritis, nephrotic syndrome and
nephrosis (N00-N07, N17-N19,N25-N27) 10 3,643 1.6 8.5 8 30 2.7 14.6
MalesTotal, all causes of death (A00-Y89) ... 116,006 100.0 696.8 ... 536 100.0 710.9Malignant neoplasms (C00-C97) 1 35,481 30.6 207.7 2 142 26.5 182.9Diseases of heart (I00-I09, I11, I13,
I20-I51) 2 26,675 23.0 160.1 1 160 29.9 209.1Accidents (unintentional injuries)
(V01-X59, Y85-Y86) 3 5,807 5.0 35.6 5 18 3.4 26.6Cerebrovascular diseases (I60-I69) 4 5,767 5.0 35.2 3 29 5.4 37.9Chronic lower respiratory diseases
(J40-J47) 5 5,563 4.8 34.1 5 18 3.4 23.6Diabetes mellitus (E10-E14) 6 3,981 3.4 23.7 4 22 4.1 29.0Intentional self-harm (suicide) (X60-X84,
Y87.0) 7 2,857 2.5 16.9 9 12 2.2 19.8Influenza and pneumonia (J10-J18) 8 2,521 2.2 15.8 8 17 3.2 22.8Nephritis, nephrotic syndrome and
nephrosis (N00-N07, N17-N19,N25-N27) 9 1,859 1.6 11.5 5 18 3.4 23.6
Alzheimer’s disease (G30) 10 1,691 1.5 10.7 15 2 0.4 2.7
FemalesTotal, all causes of death (A00-Y89) ... 114,126 100.0 460.7 ... 582 100.0 485.0Malignant neoplasms (C00-C97) 1 31,862 27.9 143.8 2 157 27.0 153.4Diseases of heart (I00-I09, I11, I13,
I20-I51) 2 24,899 21.8 91.5 1 161 27.7 113.0Cerebrovascular diseases (I60-I69) 3 8,287 7.3 30.2 3 46 7.9 33.4Chronic lower respiratory diseases
(J40-J47) 4 4,952 4.3 19.8 5 17 2.9 15.7Alzheimer’s disease (G30) 5 4,071 3.6 13.6 6 15 2.6 9.3Diabetes mellitus (E10-E14) 6 3,900 3.4 15.6 9 11 1.9 10.6Accidents (unintentional injuries)
(V01-X59, Y85-Y86) 7 3,699 3.2 16.5 6 15 2.6 14.1Influenza and pneumonia (J10-J18) 8 3,324 2.9 11.5 4 24 4.1 14.7Nephritis, nephrotic syndrome and
nephrosis (N00-N07, N17-N19,N25-N27) 9 1,784 1.6 6.6 8 12 2.1 8.2
Essential (primary) hypertension andhypertensive renal disease (I10, I12) 10 930 0.8 3.2 14 2 0.3 1.7
1. The geographic distribution of deaths in this table is based on the deceased’s usual place of residence. Counts in this table exclude deaths of non-residents ofCanada.
2. The category "Canada" includes deaths with unknown province or territory of residence in Canada.3. The ranking of the leading causes of death is based on the number of deaths.4. Age standardized mortality rate per 100,000 standard population.Note(s): See "Introduction", "Glossary" and "Definitions, data sources and methods" sections.Source(s): Statistics Canada, Canadian Vital Statistics, Death Database (CANSIM table 102-0563).
Statistics Canada, Catalogue no. 84-215-X 63
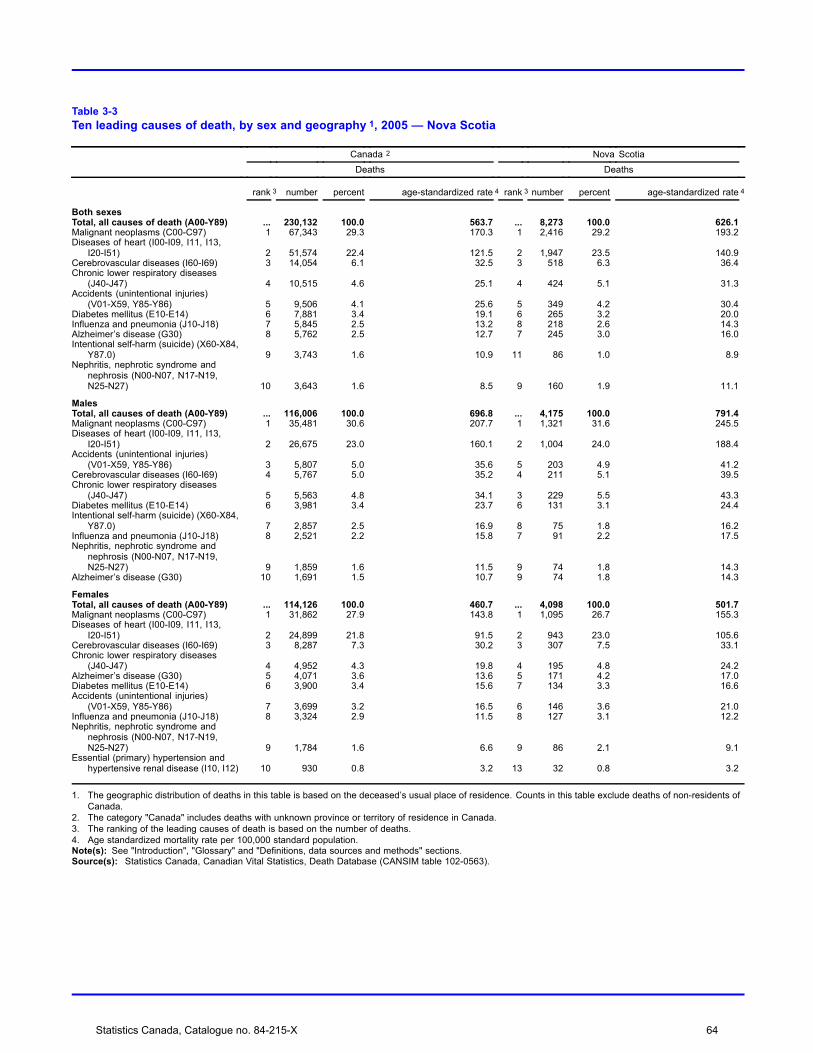
Table 3-3Ten leading causes of death, by sex and geography 1, 2005 — Nova Scotia
Canada 2 Nova ScotiaDeaths Deaths
rank 3 number percent age-standardized rate 4 rank 3 number percent age-standardized rate 4
Both sexesTotal, all causes of death (A00-Y89) ... 230,132 100.0 563.7 ... 8,273 100.0 626.1Malignant neoplasms (C00-C97) 1 67,343 29.3 170.3 1 2,416 29.2 193.2Diseases of heart (I00-I09, I11, I13,
I20-I51) 2 51,574 22.4 121.5 2 1,947 23.5 140.9Cerebrovascular diseases (I60-I69) 3 14,054 6.1 32.5 3 518 6.3 36.4Chronic lower respiratory diseases
(J40-J47) 4 10,515 4.6 25.1 4 424 5.1 31.3Accidents (unintentional injuries)
(V01-X59, Y85-Y86) 5 9,506 4.1 25.6 5 349 4.2 30.4Diabetes mellitus (E10-E14) 6 7,881 3.4 19.1 6 265 3.2 20.0Influenza and pneumonia (J10-J18) 7 5,845 2.5 13.2 8 218 2.6 14.3Alzheimer’s disease (G30) 8 5,762 2.5 12.7 7 245 3.0 16.0Intentional self-harm (suicide) (X60-X84,
Y87.0) 9 3,743 1.6 10.9 11 86 1.0 8.9Nephritis, nephrotic syndrome and
nephrosis (N00-N07, N17-N19,N25-N27) 10 3,643 1.6 8.5 9 160 1.9 11.1
MalesTotal, all causes of death (A00-Y89) ... 116,006 100.0 696.8 ... 4,175 100.0 791.4Malignant neoplasms (C00-C97) 1 35,481 30.6 207.7 1 1,321 31.6 245.5Diseases of heart (I00-I09, I11, I13,
I20-I51) 2 26,675 23.0 160.1 2 1,004 24.0 188.4Accidents (unintentional injuries)
(V01-X59, Y85-Y86) 3 5,807 5.0 35.6 5 203 4.9 41.2Cerebrovascular diseases (I60-I69) 4 5,767 5.0 35.2 4 211 5.1 39.5Chronic lower respiratory diseases
(J40-J47) 5 5,563 4.8 34.1 3 229 5.5 43.3Diabetes mellitus (E10-E14) 6 3,981 3.4 23.7 6 131 3.1 24.4Intentional self-harm (suicide) (X60-X84,
Y87.0) 7 2,857 2.5 16.9 8 75 1.8 16.2Influenza and pneumonia (J10-J18) 8 2,521 2.2 15.8 7 91 2.2 17.5Nephritis, nephrotic syndrome and
nephrosis (N00-N07, N17-N19,N25-N27) 9 1,859 1.6 11.5 9 74 1.8 14.3
Alzheimer’s disease (G30) 10 1,691 1.5 10.7 9 74 1.8 14.3
FemalesTotal, all causes of death (A00-Y89) ... 114,126 100.0 460.7 ... 4,098 100.0 501.7Malignant neoplasms (C00-C97) 1 31,862 27.9 143.8 1 1,095 26.7 155.3Diseases of heart (I00-I09, I11, I13,
I20-I51) 2 24,899 21.8 91.5 2 943 23.0 105.6Cerebrovascular diseases (I60-I69) 3 8,287 7.3 30.2 3 307 7.5 33.1Chronic lower respiratory diseases
(J40-J47) 4 4,952 4.3 19.8 4 195 4.8 24.2Alzheimer’s disease (G30) 5 4,071 3.6 13.6 5 171 4.2 17.0Diabetes mellitus (E10-E14) 6 3,900 3.4 15.6 7 134 3.3 16.6Accidents (unintentional injuries)
(V01-X59, Y85-Y86) 7 3,699 3.2 16.5 6 146 3.6 21.0Influenza and pneumonia (J10-J18) 8 3,324 2.9 11.5 8 127 3.1 12.2Nephritis, nephrotic syndrome and
nephrosis (N00-N07, N17-N19,N25-N27) 9 1,784 1.6 6.6 9 86 2.1 9.1
Essential (primary) hypertension andhypertensive renal disease (I10, I12) 10 930 0.8 3.2 13 32 0.8 3.2
1. The geographic distribution of deaths in this table is based on the deceased’s usual place of residence. Counts in this table exclude deaths of non-residents ofCanada.
2. The category "Canada" includes deaths with unknown province or territory of residence in Canada.3. The ranking of the leading causes of death is based on the number of deaths.4. Age standardized mortality rate per 100,000 standard population.Note(s): See "Introduction", "Glossary" and "Definitions, data sources and methods" sections.Source(s): Statistics Canada, Canadian Vital Statistics, Death Database (CANSIM table 102-0563).
Statistics Canada, Catalogue no. 84-215-X 64

Table 3-4Ten leading causes of death, by sex and geography 1, 2005 — New Brunswick
Canada 2 New BrunswickDeaths Deaths
rank 3 number percent age-standardized rate 4 rank 3 number percent age-standardized rate 4
Both sexesTotal, all causes of death (A00-Y89) ... 230,132 100.0 563.7 ... 6,175 100.0 596.0Malignant neoplasms (C00-C97) 1 67,343 29.3 170.3 1 1,795 29.1 181.1Diseases of heart (I00-I09, I11, I13,
I20-I51) 2 51,574 22.4 121.5 2 1,406 22.8 128.6Cerebrovascular diseases (I60-I69) 3 14,054 6.1 32.5 3 363 5.9 32.9Chronic lower respiratory diseases
(J40-J47) 4 10,515 4.6 25.1 6 266 4.3 24.9Accidents (unintentional injuries)
(V01-X59, Y85-Y86) 5 9,506 4.1 25.6 4 275 4.5 30.9Diabetes mellitus (E10-E14) 6 7,881 3.4 19.1 5 270 4.4 25.8Influenza and pneumonia (J10-J18) 7 5,845 2.5 13.2 7 161 2.6 13.7Alzheimer’s disease (G30) 8 5,762 2.5 12.7 8 151 2.4 12.7Intentional self-harm (suicide) (X60-X84,
Y87.0) 9 3,743 1.6 10.9 10 101 1.6 12.6Nephritis, nephrotic syndrome and
nephrosis (N00-N07, N17-N19,N25-N27) 10 3,643 1.6 8.5 9 115 1.9 10.6
MalesTotal, all causes of death (A00-Y89) ... 116,006 100.0 696.8 ... 3,141 100.0 755.6Malignant neoplasms (C00-C97) 1 35,481 30.6 207.7 1 973 31.0 230.0Diseases of heart (I00-I09, I11, I13,
I20-I51) 2 26,675 23.0 160.1 2 724 23.0 171.9Accidents (unintentional injuries)
(V01-X59, Y85-Y86) 3 5,807 5.0 35.6 3 168 5.3 42.1Cerebrovascular diseases (I60-I69) 4 5,767 5.0 35.2 4 149 4.7 36.0Chronic lower respiratory diseases
(J40-J47) 5 5,563 4.8 34.1 5 146 4.6 35.2Diabetes mellitus (E10-E14) 6 3,981 3.4 23.7 6 138 4.4 32.4Intentional self-harm (suicide) (X60-X84,
Y87.0) 7 2,857 2.5 16.9 7 80 2.5 20.2Influenza and pneumonia (J10-J18) 8 2,521 2.2 15.8 8 79 2.5 19.4Nephritis, nephrotic syndrome and
nephrosis (N00-N07, N17-N19,N25-N27) 9 1,859 1.6 11.5 9 57 1.8 13.8
Alzheimer’s disease (G30) 10 1,691 1.5 10.7 10 38 1.2 9.3
FemalesTotal, all causes of death (A00-Y89) ... 114,126 100.0 460.7 ... 3,034 100.0 476.2Malignant neoplasms (C00-C97) 1 31,862 27.9 143.8 1 822 27.1 145.7Diseases of heart (I00-I09, I11, I13,
I20-I51) 2 24,899 21.8 91.5 2 682 22.5 95.7Cerebrovascular diseases (I60-I69) 3 8,287 7.3 30.2 3 214 7.1 30.4Chronic lower respiratory diseases
(J40-J47) 4 4,952 4.3 19.8 5 120 4.0 19.4Alzheimer’s disease (G30) 5 4,071 3.6 13.6 6 113 3.7 14.3Diabetes mellitus (E10-E14) 6 3,900 3.4 15.6 4 132 4.4 21.6Accidents (unintentional injuries)
(V01-X59, Y85-Y86) 7 3,699 3.2 16.5 7 107 3.5 20.6Influenza and pneumonia (J10-J18) 8 3,324 2.9 11.5 8 82 2.7 10.0Nephritis, nephrotic syndrome and
nephrosis (N00-N07, N17-N19,N25-N27) 9 1,784 1.6 6.6 9 58 1.9 7.9
Essential (primary) hypertension andhypertensive renal disease (I10, I12) 10 930 0.8 3.2 11 21 0.7 2.5
1. The geographic distribution of deaths in this table is based on the deceased’s usual place of residence. Counts in this table exclude deaths of non-residents ofCanada.
2. The category "Canada" includes deaths with unknown province or territory of residence in Canada.3. The ranking of the leading causes of death is based on the number of deaths.4. Age standardized mortality rate per 100,000 standard population.Note(s): See "Introduction", "Glossary" and "Definitions, data sources and methods" sections.Source(s): Statistics Canada, Canadian Vital Statistics, Death Database (CANSIM table 102-0563).
Statistics Canada, Catalogue no. 84-215-X 65

Table 3-5Ten leading causes of death, by sex and geography 1, 2005 — Quebec
Canada 2 QuebecDeaths Deaths
rank 3 number percent age-standardized rate 4 rank 3 number percent age-standardized rate 4
Both sexesTotal, all causes of death (A00-Y89) ... 230,132 100.0 563.7 ... 55,787 100.0 564.2Malignant neoplasms (C00-C97) 1 67,343 29.3 170.3 1 17,943 32.2 183.6Diseases of heart (I00-I09, I11, I13,
I20-I51) 2 51,574 22.4 121.5 2 11,276 20.2 110.6Cerebrovascular diseases (I60-I69) 3 14,054 6.1 32.5 4 2,674 4.8 26.1Chronic lower respiratory diseases
(J40-J47) 4 10,515 4.6 25.1 3 2,972 5.3 29.3Accidents (unintentional injuries)
(V01-X59, Y85-Y86) 5 9,506 4.1 25.6 5 2,155 3.9 24.4Diabetes mellitus (E10-E14) 6 7,881 3.4 19.1 7 1,594 2.9 15.9Influenza and pneumonia (J10-J18) 7 5,845 2.5 13.2 8 1,253 2.2 12.0Alzheimer’s disease (G30) 8 5,762 2.5 12.7 6 1,926 3.5 18.0Intentional self-harm (suicide) (X60-X84,
Y87.0) 9 3,743 1.6 10.9 9 1,237 2.2 15.1Nephritis, nephrotic syndrome and
nephrosis (N00-N07, N17-N19,N25-N27) 10 3,643 1.6 8.5 10 929 1.7 9.0
MalesTotal, all causes of death (A00-Y89) ... 116,006 100.0 696.8 ... 27,864 100.0 716.7Malignant neoplasms (C00-C97) 1 35,481 30.6 207.7 1 9,462 34.0 232.4Diseases of heart (I00-I09, I11, I13,
I20-I51) 2 26,675 23.0 160.1 2 5,779 20.7 148.4Accidents (unintentional injuries)
(V01-X59, Y85-Y86) 3 5,807 5.0 35.6 4 1,296 4.7 34.0Cerebrovascular diseases (I60-I69) 4 5,767 5.0 35.2 5 1,087 3.9 28.7Chronic lower respiratory diseases
(J40-J47) 5 5,563 4.8 34.1 3 1,559 5.6 42.7Diabetes mellitus (E10-E14) 6 3,981 3.4 23.7 7 788 2.8 20.1Intentional self-harm (suicide) (X60-X84,
Y87.0) 7 2,857 2.5 16.9 6 959 3.4 23.8Influenza and pneumonia (J10-J18) 8 2,521 2.2 15.8 8 531 1.9 14.9Nephritis, nephrotic syndrome and
nephrosis (N00-N07, N17-N19,N25-N27) 9 1,859 1.6 11.5 10 482 1.7 13.0
Alzheimer’s disease (G30) 10 1,691 1.5 10.7 9 523 1.9 15.0
FemalesTotal, all causes of death (A00-Y89) ... 114,126 100.0 460.7 ... 27,923 100.0 453.5Malignant neoplasms (C00-C97) 1 31,862 27.9 143.8 1 8,481 30.4 151.4Diseases of heart (I00-I09, I11, I13,
I20-I51) 2 24,899 21.8 91.5 2 5,497 19.7 82.6Cerebrovascular diseases (I60-I69) 3 8,287 7.3 30.2 3 1,587 5.7 23.9Chronic lower respiratory diseases
(J40-J47) 4 4,952 4.3 19.8 4 1,413 5.1 22.5Alzheimer’s disease (G30) 5 4,071 3.6 13.6 5 1,403 5.0 19.2Diabetes mellitus (E10-E14) 6 3,900 3.4 15.6 7 806 2.9 12.7Accidents (unintentional injuries)
(V01-X59, Y85-Y86) 7 3,699 3.2 16.5 6 859 3.1 15.4Influenza and pneumonia (J10-J18) 8 3,324 2.9 11.5 8 722 2.6 10.4Nephritis, nephrotic syndrome and
nephrosis (N00-N07, N17-N19,N25-N27) 9 1,784 1.6 6.6 9 447 1.6 6.5
Essential (primary) hypertension andhypertensive renal disease (I10, I12) 10 930 0.8 3.2 14 187 0.7 2.6
1. The geographic distribution of deaths in this table is based on the deceased’s usual place of residence. Counts in this table exclude deaths of non-residents ofCanada.
2. The category "Canada" includes deaths with unknown province or territory of residence in Canada.3. The ranking of the leading causes of death is based on the number of deaths.4. Age standardized mortality rate per 100,000 standard population.Note(s): See "Introduction", "Glossary" and "Definitions, data sources and methods" sections.Source(s): Statistics Canada, Canadian Vital Statistics, Death Database (CANSIM table 102-0563).
Statistics Canada, Catalogue no. 84-215-X 66

Table 3-6Ten leading causes of death, by sex and geography 1, 2005 — Ontario
Canada 2 OntarioDeaths Deaths
rank 3 number percent age-standardized rate 4 rank 3 number percent age-standardized rate 4
Both sexesTotal, all causes of death (A00-Y89) ... 230,132 100.0 563.7 ... 85,591 100.0 554.7Malignant neoplasms (C00-C97) 1 67,343 29.3 170.3 1 24,967 29.2 166.4Diseases of heart (I00-I09, I11, I13,
I20-I51) 2 51,574 22.4 121.5 2 19,769 23.1 124.3Cerebrovascular diseases (I60-I69) 3 14,054 6.1 32.5 3 5,445 6.4 33.6Chronic lower respiratory diseases
(J40-J47) 4 10,515 4.6 25.1 4 3,597 4.2 22.8Accidents (unintentional injuries)
(V01-X59, Y85-Y86) 5 9,506 4.1 25.6 5 3,436 4.0 23.6Diabetes mellitus (E10-E14) 6 7,881 3.4 19.1 6 3,228 3.8 20.7Influenza and pneumonia (J10-J18) 7 5,845 2.5 13.2 7 2,204 2.6 13.3Alzheimer’s disease (G30) 8 5,762 2.5 12.7 8 2,048 2.4 12.1Intentional self-harm (suicide) (X60-X84,
Y87.0) 9 3,743 1.6 10.9 10 1,115 1.3 8.3Nephritis, nephrotic syndrome and
nephrosis (N00-N07, N17-N19,N25-N27) 10 3,643 1.6 8.5 9 1,250 1.5 7.8
MalesTotal, all causes of death (A00-Y89) ... 116,006 100.0 696.8 ... 42,418 100.0 671.5Malignant neoplasms (C00-C97) 1 35,481 30.6 207.7 1 12,859 30.3 198.2Diseases of heart (I00-I09, I11, I13,
I20-I51) 2 26,675 23.0 160.1 2 10,141 23.9 161.3Accidents (unintentional injuries)
(V01-X59, Y85-Y86) 3 5,807 5.0 35.6 4 2,033 4.8 32.5Cerebrovascular diseases (I60-I69) 4 5,767 5.0 35.2 3 2,190 5.2 35.6Chronic lower respiratory diseases
(J40-J47) 5 5,563 4.8 34.1 5 1,879 4.4 30.3Diabetes mellitus (E10-E14) 6 3,981 3.4 23.7 6 1,636 3.9 25.4Intentional self-harm (suicide) (X60-X84,
Y87.0) 7 2,857 2.5 16.9 8 831 2.0 12.7Influenza and pneumonia (J10-J18) 8 2,521 2.2 15.8 7 915 2.2 15.4Nephritis, nephrotic syndrome and
nephrosis (N00-N07, N17-N19,N25-N27) 9 1,859 1.6 11.5 11 617 1.5 10.1
Alzheimer’s disease (G30) 10 1,691 1.5 10.7 10 620 1.5 10.4
FemalesTotal, all causes of death (A00-Y89) ... 114,126 100.0 460.7 ... 43,173 100.0 463.4Malignant neoplasms (C00-C97) 1 31,862 27.9 143.8 1 12,108 28.0 144.0Diseases of heart (I00-I09, I11, I13,
I20-I51) 2 24,899 21.8 91.5 2 9,628 22.3 95.3Cerebrovascular diseases (I60-I69) 3 8,287 7.3 30.2 3 3,255 7.5 31.8Chronic lower respiratory diseases
(J40-J47) 4 4,952 4.3 19.8 4 1,718 4.0 18.2Alzheimer’s disease (G30) 5 4,071 3.6 13.6 6 1,428 3.3 12.8Diabetes mellitus (E10-E14) 6 3,900 3.4 15.6 5 1,592 3.7 16.9Accidents (unintentional injuries)
(V01-X59, Y85-Y86) 7 3,699 3.2 16.5 7 1,403 3.2 15.7Influenza and pneumonia (J10-J18) 8 3,324 2.9 11.5 8 1,289 3.0 11.9Nephritis, nephrotic syndrome and
nephrosis (N00-N07, N17-N19,N25-N27) 9 1,784 1.6 6.6 9 633 1.5 6.4
Essential (primary) hypertension andhypertensive renal disease (I10, I12) 10 930 0.8 3.2 13 318 0.7 2.9
1. The geographic distribution of deaths in this table is based on the deceased’s usual place of residence. Counts in this table exclude deaths of non-residents ofCanada.
2. The category "Canada" includes deaths with unknown province or territory of residence in Canada.3. The ranking of the leading causes of death is based on the number of deaths.4. Age standardized mortality rate per 100,000 standard population.Note(s): See "Introduction", "Glossary" and "Definitions, data sources and methods" sections.Source(s): Statistics Canada, Canadian Vital Statistics, Death Database (CANSIM table 102-0563).
Statistics Canada, Catalogue no. 84-215-X 67
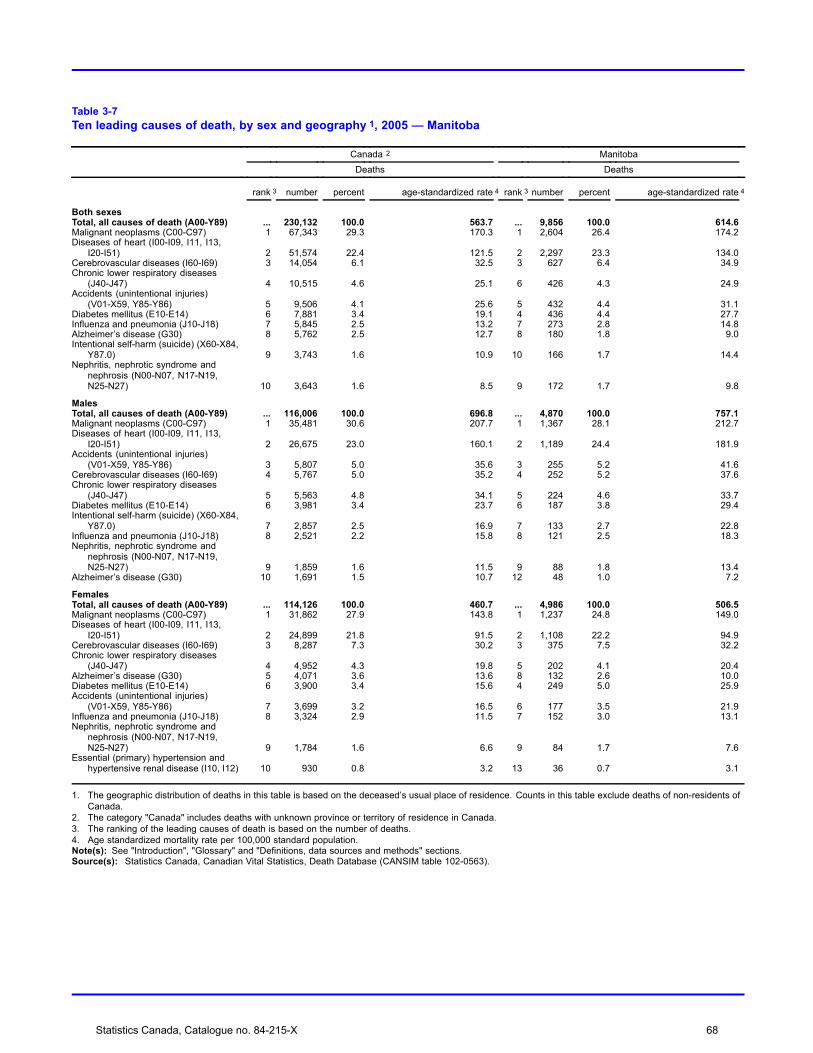
Table 3-7Ten leading causes of death, by sex and geography 1, 2005 — Manitoba
Canada 2 ManitobaDeaths Deaths
rank 3 number percent age-standardized rate 4 rank 3 number percent age-standardized rate 4
Both sexesTotal, all causes of death (A00-Y89) ... 230,132 100.0 563.7 ... 9,856 100.0 614.6Malignant neoplasms (C00-C97) 1 67,343 29.3 170.3 1 2,604 26.4 174.2Diseases of heart (I00-I09, I11, I13,
I20-I51) 2 51,574 22.4 121.5 2 2,297 23.3 134.0Cerebrovascular diseases (I60-I69) 3 14,054 6.1 32.5 3 627 6.4 34.9Chronic lower respiratory diseases
(J40-J47) 4 10,515 4.6 25.1 6 426 4.3 24.9Accidents (unintentional injuries)
(V01-X59, Y85-Y86) 5 9,506 4.1 25.6 5 432 4.4 31.1Diabetes mellitus (E10-E14) 6 7,881 3.4 19.1 4 436 4.4 27.7Influenza and pneumonia (J10-J18) 7 5,845 2.5 13.2 7 273 2.8 14.8Alzheimer’s disease (G30) 8 5,762 2.5 12.7 8 180 1.8 9.0Intentional self-harm (suicide) (X60-X84,
Y87.0) 9 3,743 1.6 10.9 10 166 1.7 14.4Nephritis, nephrotic syndrome and
nephrosis (N00-N07, N17-N19,N25-N27) 10 3,643 1.6 8.5 9 172 1.7 9.8
MalesTotal, all causes of death (A00-Y89) ... 116,006 100.0 696.8 ... 4,870 100.0 757.1Malignant neoplasms (C00-C97) 1 35,481 30.6 207.7 1 1,367 28.1 212.7Diseases of heart (I00-I09, I11, I13,
I20-I51) 2 26,675 23.0 160.1 2 1,189 24.4 181.9Accidents (unintentional injuries)
(V01-X59, Y85-Y86) 3 5,807 5.0 35.6 3 255 5.2 41.6Cerebrovascular diseases (I60-I69) 4 5,767 5.0 35.2 4 252 5.2 37.6Chronic lower respiratory diseases
(J40-J47) 5 5,563 4.8 34.1 5 224 4.6 33.7Diabetes mellitus (E10-E14) 6 3,981 3.4 23.7 6 187 3.8 29.4Intentional self-harm (suicide) (X60-X84,
Y87.0) 7 2,857 2.5 16.9 7 133 2.7 22.8Influenza and pneumonia (J10-J18) 8 2,521 2.2 15.8 8 121 2.5 18.3Nephritis, nephrotic syndrome and
nephrosis (N00-N07, N17-N19,N25-N27) 9 1,859 1.6 11.5 9 88 1.8 13.4
Alzheimer’s disease (G30) 10 1,691 1.5 10.7 12 48 1.0 7.2
FemalesTotal, all causes of death (A00-Y89) ... 114,126 100.0 460.7 ... 4,986 100.0 506.5Malignant neoplasms (C00-C97) 1 31,862 27.9 143.8 1 1,237 24.8 149.0Diseases of heart (I00-I09, I11, I13,
I20-I51) 2 24,899 21.8 91.5 2 1,108 22.2 94.9Cerebrovascular diseases (I60-I69) 3 8,287 7.3 30.2 3 375 7.5 32.2Chronic lower respiratory diseases
(J40-J47) 4 4,952 4.3 19.8 5 202 4.1 20.4Alzheimer’s disease (G30) 5 4,071 3.6 13.6 8 132 2.6 10.0Diabetes mellitus (E10-E14) 6 3,900 3.4 15.6 4 249 5.0 25.9Accidents (unintentional injuries)
(V01-X59, Y85-Y86) 7 3,699 3.2 16.5 6 177 3.5 21.9Influenza and pneumonia (J10-J18) 8 3,324 2.9 11.5 7 152 3.0 13.1Nephritis, nephrotic syndrome and
nephrosis (N00-N07, N17-N19,N25-N27) 9 1,784 1.6 6.6 9 84 1.7 7.6
Essential (primary) hypertension andhypertensive renal disease (I10, I12) 10 930 0.8 3.2 13 36 0.7 3.1
1. The geographic distribution of deaths in this table is based on the deceased’s usual place of residence. Counts in this table exclude deaths of non-residents ofCanada.
2. The category "Canada" includes deaths with unknown province or territory of residence in Canada.3. The ranking of the leading causes of death is based on the number of deaths.4. Age standardized mortality rate per 100,000 standard population.Note(s): See "Introduction", "Glossary" and "Definitions, data sources and methods" sections.Source(s): Statistics Canada, Canadian Vital Statistics, Death Database (CANSIM table 102-0563).
Statistics Canada, Catalogue no. 84-215-X 68

Table 3-8Ten leading causes of death, by sex and geography 1, 2005 — Saskatchewan
Canada 2 SaskatchewanDeaths Deaths
rank 3 number percent age-standardized rate 4 rank 3 number percent age-standardized rate 4
Both sexesTotal, all causes of death (A00-Y89) ... 230,132 100.0 563.7 ... 8,850 100.0 596.0Malignant neoplasms (C00-C97) 1 67,343 29.3 170.3 1 2,229 25.2 164.7Diseases of heart (I00-I09, I11, I13,
I20-I51) 2 51,574 22.4 121.5 2 2,171 24.5 133.8Cerebrovascular diseases (I60-I69) 3 14,054 6.1 32.5 3 581 6.6 33.9Chronic lower respiratory diseases
(J40-J47) 4 10,515 4.6 25.1 5 359 4.1 23.1Accidents (unintentional injuries)
(V01-X59, Y85-Y86) 5 9,506 4.1 25.6 4 412 4.7 35.4Diabetes mellitus (E10-E14) 6 7,881 3.4 19.1 6 322 3.6 20.9Influenza and pneumonia (J10-J18) 7 5,845 2.5 13.2 7 270 3.1 15.3Alzheimer’s disease (G30) 8 5,762 2.5 12.7 8 224 2.5 11.6Intentional self-harm (suicide) (X60-X84,
Y87.0) 9 3,743 1.6 10.9 10 115 1.3 11.5Nephritis, nephrotic syndrome and
nephrosis (N00-N07, N17-N19,N25-N27) 10 3,643 1.6 8.5 9 187 2.1 11.2
MalesTotal, all causes of death (A00-Y89) ... 116,006 100.0 696.8 ... 4,547 100.0 749.5Malignant neoplasms (C00-C97) 1 35,481 30.6 207.7 1 1,176 25.9 197.5Diseases of heart (I00-I09, I11, I13,
I20-I51) 2 26,675 23.0 160.1 2 1,157 25.4 183.3Accidents (unintentional injuries)
(V01-X59, Y85-Y86) 3 5,807 5.0 35.6 4 251 5.5 48.0Cerebrovascular diseases (I60-I69) 4 5,767 5.0 35.2 3 274 6.0 42.5Chronic lower respiratory diseases
(J40-J47) 5 5,563 4.8 34.1 5 200 4.4 31.7Diabetes mellitus (E10-E14) 6 3,981 3.4 23.7 6 168 3.7 27.3Intentional self-harm (suicide) (X60-X84,
Y87.0) 7 2,857 2.5 16.9 9 87 1.9 17.1Influenza and pneumonia (J10-J18) 8 2,521 2.2 15.8 7 131 2.9 20.0Nephritis, nephrotic syndrome and
nephrosis (N00-N07, N17-N19,N25-N27) 9 1,859 1.6 11.5 8 97 2.1 14.9
Alzheimer’s disease (G30) 10 1,691 1.5 10.7 10 70 1.5 10.0
FemalesTotal, all causes of death (A00-Y89) ... 114,126 100.0 460.7 ... 4,303 100.0 473.2Malignant neoplasms (C00-C97) 1 31,862 27.9 143.8 1 1,053 24.5 141.1Diseases of heart (I00-I09, I11, I13,
I20-I51) 2 24,899 21.8 91.5 2 1,014 23.6 94.1Cerebrovascular diseases (I60-I69) 3 8,287 7.3 30.2 3 307 7.1 27.1Chronic lower respiratory diseases
(J40-J47) 4 4,952 4.3 19.8 5 159 3.7 17.1Alzheimer’s disease (G30) 5 4,071 3.6 13.6 6 154 3.6 12.4Diabetes mellitus (E10-E14) 6 3,900 3.4 15.6 6 154 3.6 15.9Accidents (unintentional injuries)
(V01-X59, Y85-Y86) 7 3,699 3.2 16.5 4 161 3.7 23.5Influenza and pneumonia (J10-J18) 8 3,324 2.9 11.5 8 139 3.2 11.8Nephritis, nephrotic syndrome and
nephrosis (N00-N07, N17-N19,N25-N27) 9 1,784 1.6 6.6 9 90 2.1 8.9
Essential (primary) hypertension andhypertensive renal disease (I10, I12) 10 930 0.8 3.2 10 63 1.5 5.4
1. The geographic distribution of deaths in this table is based on the deceased’s usual place of residence. Counts in this table exclude deaths of non-residents ofCanada.
2. The category "Canada" includes deaths with unknown province or territory of residence in Canada.3. The ranking of the leading causes of death is based on the number of deaths.4. Age standardized mortality rate per 100,000 standard population.Note(s): See "Introduction", "Glossary" and "Definitions, data sources and methods" sections.Source(s): Statistics Canada, Canadian Vital Statistics, Death Database (CANSIM table 102-0563).
Statistics Canada, Catalogue no. 84-215-X 69
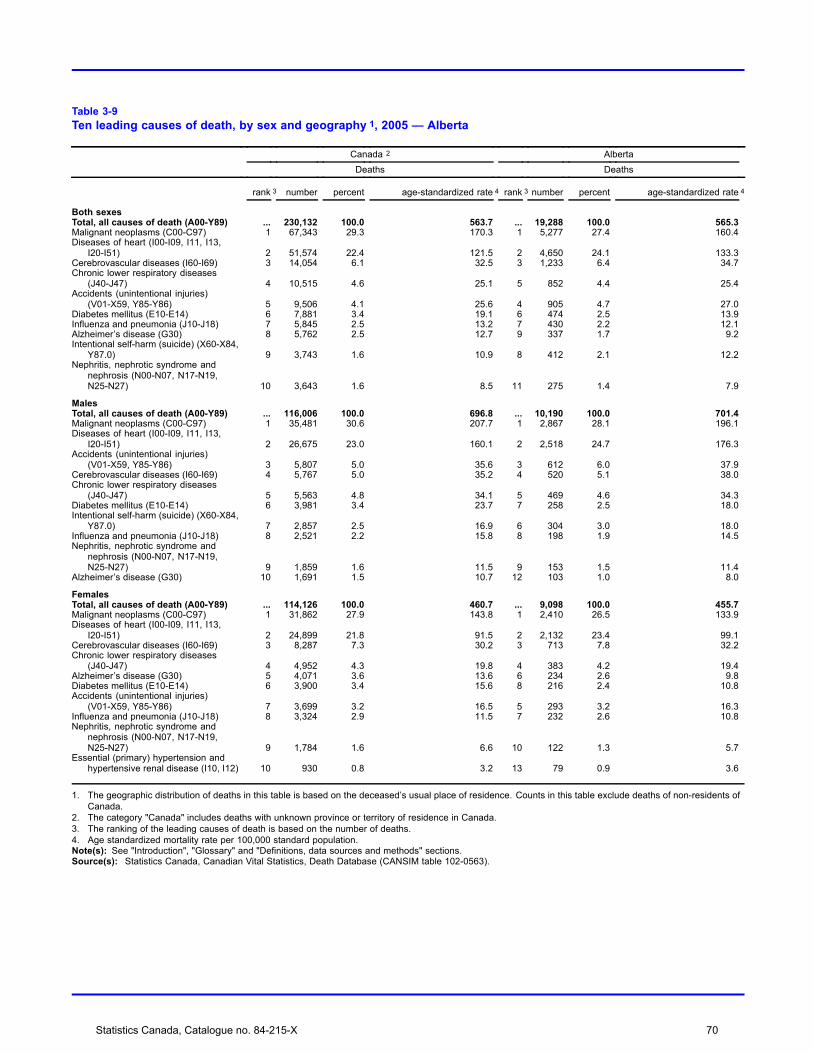
Table 3-9Ten leading causes of death, by sex and geography 1, 2005 — Alberta
Canada 2 AlbertaDeaths Deaths
rank 3 number percent age-standardized rate 4 rank 3 number percent age-standardized rate 4
Both sexesTotal, all causes of death (A00-Y89) ... 230,132 100.0 563.7 ... 19,288 100.0 565.3Malignant neoplasms (C00-C97) 1 67,343 29.3 170.3 1 5,277 27.4 160.4Diseases of heart (I00-I09, I11, I13,
I20-I51) 2 51,574 22.4 121.5 2 4,650 24.1 133.3Cerebrovascular diseases (I60-I69) 3 14,054 6.1 32.5 3 1,233 6.4 34.7Chronic lower respiratory diseases
(J40-J47) 4 10,515 4.6 25.1 5 852 4.4 25.4Accidents (unintentional injuries)
(V01-X59, Y85-Y86) 5 9,506 4.1 25.6 4 905 4.7 27.0Diabetes mellitus (E10-E14) 6 7,881 3.4 19.1 6 474 2.5 13.9Influenza and pneumonia (J10-J18) 7 5,845 2.5 13.2 7 430 2.2 12.1Alzheimer’s disease (G30) 8 5,762 2.5 12.7 9 337 1.7 9.2Intentional self-harm (suicide) (X60-X84,
Y87.0) 9 3,743 1.6 10.9 8 412 2.1 12.2Nephritis, nephrotic syndrome and
nephrosis (N00-N07, N17-N19,N25-N27) 10 3,643 1.6 8.5 11 275 1.4 7.9
MalesTotal, all causes of death (A00-Y89) ... 116,006 100.0 696.8 ... 10,190 100.0 701.4Malignant neoplasms (C00-C97) 1 35,481 30.6 207.7 1 2,867 28.1 196.1Diseases of heart (I00-I09, I11, I13,
I20-I51) 2 26,675 23.0 160.1 2 2,518 24.7 176.3Accidents (unintentional injuries)
(V01-X59, Y85-Y86) 3 5,807 5.0 35.6 3 612 6.0 37.9Cerebrovascular diseases (I60-I69) 4 5,767 5.0 35.2 4 520 5.1 38.0Chronic lower respiratory diseases
(J40-J47) 5 5,563 4.8 34.1 5 469 4.6 34.3Diabetes mellitus (E10-E14) 6 3,981 3.4 23.7 7 258 2.5 18.0Intentional self-harm (suicide) (X60-X84,
Y87.0) 7 2,857 2.5 16.9 6 304 3.0 18.0Influenza and pneumonia (J10-J18) 8 2,521 2.2 15.8 8 198 1.9 14.5Nephritis, nephrotic syndrome and
nephrosis (N00-N07, N17-N19,N25-N27) 9 1,859 1.6 11.5 9 153 1.5 11.4
Alzheimer’s disease (G30) 10 1,691 1.5 10.7 12 103 1.0 8.0
FemalesTotal, all causes of death (A00-Y89) ... 114,126 100.0 460.7 ... 9,098 100.0 455.7Malignant neoplasms (C00-C97) 1 31,862 27.9 143.8 1 2,410 26.5 133.9Diseases of heart (I00-I09, I11, I13,
I20-I51) 2 24,899 21.8 91.5 2 2,132 23.4 99.1Cerebrovascular diseases (I60-I69) 3 8,287 7.3 30.2 3 713 7.8 32.2Chronic lower respiratory diseases
(J40-J47) 4 4,952 4.3 19.8 4 383 4.2 19.4Alzheimer’s disease (G30) 5 4,071 3.6 13.6 6 234 2.6 9.8Diabetes mellitus (E10-E14) 6 3,900 3.4 15.6 8 216 2.4 10.8Accidents (unintentional injuries)
(V01-X59, Y85-Y86) 7 3,699 3.2 16.5 5 293 3.2 16.3Influenza and pneumonia (J10-J18) 8 3,324 2.9 11.5 7 232 2.6 10.8Nephritis, nephrotic syndrome and
nephrosis (N00-N07, N17-N19,N25-N27) 9 1,784 1.6 6.6 10 122 1.3 5.7
Essential (primary) hypertension andhypertensive renal disease (I10, I12) 10 930 0.8 3.2 13 79 0.9 3.6
1. The geographic distribution of deaths in this table is based on the deceased’s usual place of residence. Counts in this table exclude deaths of non-residents ofCanada.
2. The category "Canada" includes deaths with unknown province or territory of residence in Canada.3. The ranking of the leading causes of death is based on the number of deaths.4. Age standardized mortality rate per 100,000 standard population.Note(s): See "Introduction", "Glossary" and "Definitions, data sources and methods" sections.Source(s): Statistics Canada, Canadian Vital Statistics, Death Database (CANSIM table 102-0563).
Statistics Canada, Catalogue no. 84-215-X 70

Table 3-10Ten leading causes of death, by sex and geography 1, 2005 — British Columbia
Canada 2 British ColumbiaDeaths Deaths
rank 3 number percent age-standardized rate 4 rank 3 number percent age-standardized rate 4
Both sexesTotal, all causes of death (A00-Y89) ... 230,132 100.0 563.7 ... 30,227 100.0 525.8Malignant neoplasms (C00-C97) 1 67,343 29.3 170.3 1 8,407 27.8 152.5Diseases of heart (I00-I09, I11, I13,
I20-I51) 2 51,574 22.4 121.5 2 6,563 21.7 106.7Cerebrovascular diseases (I60-I69) 3 14,054 6.1 32.5 3 2,199 7.3 35.5Chronic lower respiratory diseases
(J40-J47) 4 10,515 4.6 25.1 4 1,363 4.5 23.0Accidents (unintentional injuries)
(V01-X59, Y85-Y86) 5 9,506 4.1 25.6 5 1,317 4.4 26.7Diabetes mellitus (E10-E14) 6 7,881 3.4 19.1 6 1,030 3.4 17.9Influenza and pneumonia (J10-J18) 7 5,845 2.5 13.2 7 897 3.0 14.0Alzheimer’s disease (G30) 8 5,762 2.5 12.7 8 530 1.8 8.1Intentional self-harm (suicide) (X60-X84,
Y87.0) 9 3,743 1.6 10.9 10 412 1.4 8.8Nephritis, nephrotic syndrome and
nephrosis (N00-N07, N17-N19,N25-N27) 10 3,643 1.6 8.5 9 418 1.4 6.9
MalesTotal, all causes of death (A00-Y89) ... 116,006 100.0 696.8 ... 15,558 100.0 642.2Malignant neoplasms (C00-C97) 1 35,481 30.6 207.7 1 4,519 29.0 182.7Diseases of heart (I00-I09, I11, I13,
I20-I51) 2 26,675 23.0 160.1 2 3,351 21.5 136.4Accidents (unintentional injuries)
(V01-X59, Y85-Y86) 3 5,807 5.0 35.6 4 834 5.4 37.3Cerebrovascular diseases (I60-I69) 4 5,767 5.0 35.2 3 901 5.8 36.8Chronic lower respiratory diseases
(J40-J47) 5 5,563 4.8 34.1 5 696 4.5 28.4Diabetes mellitus (E10-E14) 6 3,981 3.4 23.7 6 550 3.5 22.4Intentional self-harm (suicide) (X60-X84,
Y87.0) 7 2,857 2.5 16.9 8 306 2.0 13.2Influenza and pneumonia (J10-J18) 8 2,521 2.2 15.8 7 390 2.5 16.1Nephritis, nephrotic syndrome and
nephrosis (N00-N07, N17-N19,N25-N27) 9 1,859 1.6 11.5 9 221 1.4 9.1
Alzheimer’s disease (G30) 10 1,691 1.5 10.7 11 188 1.2 7.7
FemalesTotal, all causes of death (A00-Y89) ... 114,126 100.0 460.7 ... 14,669 100.0 429.4Malignant neoplasms (C00-C97) 1 31,862 27.9 143.8 1 3,888 26.5 129.5Diseases of heart (I00-I09, I11, I13,
I20-I51) 2 24,899 21.8 91.5 2 3,212 21.9 82.5Cerebrovascular diseases (I60-I69) 3 8,287 7.3 30.2 3 1,298 8.8 33.9Chronic lower respiratory diseases
(J40-J47) 4 4,952 4.3 19.8 4 667 4.5 19.4Alzheimer’s disease (G30) 5 4,071 3.6 13.6 8 342 2.3 8.4Diabetes mellitus (E10-E14) 6 3,900 3.4 15.6 7 480 3.3 14.3Accidents (unintentional injuries)
(V01-X59, Y85-Y86) 7 3,699 3.2 16.5 6 483 3.3 16.7Influenza and pneumonia (J10-J18) 8 3,324 2.9 11.5 5 507 3.5 12.4Nephritis, nephrotic syndrome and
nephrosis (N00-N07, N17-N19,N25-N27) 9 1,784 1.6 6.6 9 197 1.3 5.4
Essential (primary) hypertension andhypertensive renal disease (I10, I12) 10 930 0.8 3.2 10 146 1.0 3.8
1. The geographic distribution of deaths in this table is based on the deceased’s usual place of residence. Counts in this table exclude deaths of non-residents ofCanada.
2. The category "Canada" includes deaths with unknown province or territory of residence in Canada.3. The ranking of the leading causes of death is based on the number of deaths.4. Age standardized mortality rate per 100,000 standard population.Note(s): See "Introduction", "Glossary" and "Definitions, data sources and methods" sections.Source(s): Statistics Canada, Canadian Vital Statistics, Death Database (CANSIM table 102-0563).
Statistics Canada, Catalogue no. 84-215-X 71

Table 3-11Ten leading causes of death, by sex and geography 1, 2005 — Yukon
Canada 2 YukonDeaths Deaths
rank 3 number percent age-standardized rate 4 rank 3 number percent age-standardized rate 4
Both sexesTotal, all causes of death (A00-Y89) ... 230,132 100.0 563.7 ... 164 100.0 745.1Malignant neoplasms (C00-C97) 1 67,343 29.3 170.3 1 56 34.1 246.5Diseases of heart (I00-I09, I11, I13,
I20-I51) 2 51,574 22.4 121.5 2 29 17.7 145.0Cerebrovascular diseases (I60-I69) 3 14,054 6.1 32.5 5 7 4.3 40.1Chronic lower respiratory diseases
(J40-J47) 4 10,515 4.6 25.1 4 9 5.5 51.2Accidents (unintentional injuries)
(V01-X59, Y85-Y86) 5 9,506 4.1 25.6 3 21 12.8 80.6Diabetes mellitus (E10-E14) 6 7,881 3.4 19.1 7 3 1.8 9.5Influenza and pneumonia (J10-J18) 7 5,845 2.5 13.2 10 2 1.2 8.5Alzheimer’s disease (G30) 8 5,762 2.5 12.7 7 3 1.8 20.4Intentional self-harm (suicide) (X60-X84,
Y87.0) 9 3,743 1.6 10.9 6 5 3.0 12.3Nephritis, nephrotic syndrome and
nephrosis (N00-N07, N17-N19,N25-N27) 10 3,643 1.6 8.5 12 1 0.6 2.1
MalesTotal, all causes of death (A00-Y89) ... 116,006 100.0 696.8 ... 105 100.0 960.5Malignant neoplasms (C00-C97) 1 35,481 30.6 207.7 1 36 34.3 322.0Diseases of heart (I00-I09, I11, I13,
I20-I51) 2 26,675 23.0 160.1 2 20 19.0 196.8Accidents (unintentional injuries)
(V01-X59, Y85-Y86) 3 5,807 5.0 35.6 3 16 15.2 129.3Cerebrovascular diseases (I60-I69) 4 5,767 5.0 35.2 5 4 3.8 52.2Chronic lower respiratory diseases
(J40-J47) 5 5,563 4.8 34.1 4 5 4.8 74.0Diabetes mellitus (E10-E14) 6 3,981 3.4 23.7 7 3 2.9 16.9Intentional self-harm (suicide) (X60-X84,
Y87.0) 7 2,857 2.5 16.9 5 4 3.8 21.2Influenza and pneumonia (J10-J18) 8 2,521 2.2 15.8 12 0 0.0 0.0Nephritis, nephrotic syndrome and
nephrosis (N00-N07, N17-N19,N25-N27) 9 1,859 1.6 11.5 12 0 0.0 0.0
Alzheimer’s disease (G30) 10 1,691 1.5 10.7 8 1 1.0 29.7
FemalesTotal, all causes of death (A00-Y89) ... 114,126 100.0 460.7 ... 59 100.0 537.9Malignant neoplasms (C00-C97) 1 31,862 27.9 143.8 1 20 33.9 165.4Diseases of heart (I00-I09, I11, I13,
I20-I51) 2 24,899 21.8 91.5 2 9 15.3 96.6Cerebrovascular diseases (I60-I69) 3 8,287 7.3 30.2 5 3 5.1 24.5Chronic lower respiratory diseases
(J40-J47) 4 4,952 4.3 19.8 4 4 6.8 43.5Alzheimer’s disease (G30) 5 4,071 3.6 13.6 6 2 3.4 26.1Diabetes mellitus (E10-E14) 6 3,900 3.4 15.6 13 0 0.0 0.0Accidents (unintentional injuries)
(V01-X59, Y85-Y86) 7 3,699 3.2 16.5 3 5 8.5 30.1Influenza and pneumonia (J10-J18) 8 3,324 2.9 11.5 6 2 3.4 16.9Nephritis, nephrotic syndrome and
nephrosis (N00-N07, N17-N19,N25-N27) 9 1,784 1.6 6.6 9 1 1.7 4.6
Essential (primary) hypertension andhypertensive renal disease (I10, I12) 10 930 0.8 3.2 13 0 0.0 0.0
1. The geographic distribution of deaths in this table is based on the deceased’s usual place of residence. Counts in this table exclude deaths of non-residents ofCanada.
2. The category "Canada" includes deaths with unknown province or territory of residence in Canada.3. The ranking of the leading causes of death is based on the number of deaths.4. Age standardized mortality rate per 100,000 standard population.Note(s): See "Introduction", "Glossary" and "Definitions, data sources and methods" sections.Source(s): Statistics Canada, Canadian Vital Statistics, Death Database (CANSIM table 102-0563).
Statistics Canada, Catalogue no. 84-215-X 72

Table 3-12Ten leading causes of death, by sex and geography 1, 2005 — Northwest Territories
Canada 2 Northwest TerritoriesDeaths Deaths
rank 3 number percent age-standardized rate 4 rank 3 number percent age-standardized rate 4
Both sexesTotal, all causes of death (A00-Y89) ... 230,132 100.0 563.7 ... 148 100.0 657.9Malignant neoplasms (C00-C97) 1 67,343 29.3 170.3 1 42 28.4 195.2Diseases of heart (I00-I09, I11, I13,
I20-I51) 2 51,574 22.4 121.5 3 14 9.5 74.7Cerebrovascular diseases (I60-I69) 3 14,054 6.1 32.5 7 2 1.4 14.9Chronic lower respiratory diseases
(J40-J47) 4 10,515 4.6 25.1 4 11 7.4 68.3Accidents (unintentional injuries)
(V01-X59, Y85-Y86) 5 9,506 4.1 25.6 2 16 10.8 50.1Diabetes mellitus (E10-E14) 6 7,881 3.4 19.1 7 2 1.4 12.9Influenza and pneumonia (J10-J18) 7 5,845 2.5 13.2 5 7 4.7 35.3Alzheimer’s disease (G30) 8 5,762 2.5 12.7 18 0 0.0 0.0Intentional self-harm (suicide) (X60-X84,
Y87.0) 9 3,743 1.6 10.9 6 4 2.7 8.8Nephritis, nephrotic syndrome and
nephrosis (N00-N07, N17-N19,N25-N27) 10 3,643 1.6 8.5 7 2 1.4 9.0
MalesTotal, all causes of death (A00-Y89) ... 116,006 100.0 696.8 ... 98 100.0 884.8Malignant neoplasms (C00-C97) 1 35,481 30.6 207.7 1 24 24.5 263.5Diseases of heart (I00-I09, I11, I13,
I20-I51) 2 26,675 23.0 160.1 3 9 9.2 98.7Accidents (unintentional injuries)
(V01-X59, Y85-Y86) 3 5,807 5.0 35.6 2 14 14.3 77.9Cerebrovascular diseases (I60-I69) 4 5,767 5.0 35.2 7 2 2.0 39.5Chronic lower respiratory diseases
(J40-J47) 5 5,563 4.8 34.1 4 6 6.1 76.0Diabetes mellitus (E10-E14) 6 3,981 3.4 23.7 9 1 1.0 9.2Intentional self-harm (suicide) (X60-X84,
Y87.0) 7 2,857 2.5 16.9 6 4 4.1 17.2Influenza and pneumonia (J10-J18) 8 2,521 2.2 15.8 5 5 5.1 52.0Nephritis, nephrotic syndrome and
nephrosis (N00-N07, N17-N19,N25-N27) 9 1,859 1.6 11.5 7 2 2.0 19.2
Alzheimer’s disease (G30) 10 1,691 1.5 10.7 15 0 0.0 0.0
FemalesTotal, all causes of death (A00-Y89) ... 114,126 100.0 460.7 ... 50 100.0 462.6Malignant neoplasms (C00-C97) 1 31,862 27.9 143.8 1 18 36.0 163.6Diseases of heart (I00-I09, I11, I13,
I20-I51) 2 24,899 21.8 91.5 2 5 10.0 49.6Cerebrovascular diseases (I60-I69) 3 8,287 7.3 30.2 11 0 0.0 0.0Chronic lower respiratory diseases
(J40-J47) 4 4,952 4.3 19.8 2 5 10.0 62.3Alzheimer’s disease (G30) 5 4,071 3.6 13.6 11 0 0.0 0.0Diabetes mellitus (E10-E14) 6 3,900 3.4 15.6 6 1 2.0 11.7Accidents (unintentional injuries)
(V01-X59, Y85-Y86) 7 3,699 3.2 16.5 4 2 4.0 15.7Influenza and pneumonia (J10-J18) 8 3,324 2.9 11.5 4 2 4.0 18.4Nephritis, nephrotic syndrome and
nephrosis (N00-N07, N17-N19,N25-N27) 9 1,784 1.6 6.6 11 0 0.0 0.0
Essential (primary) hypertension andhypertensive renal disease (I10, I12) 10 930 0.8 3.2 6 1 2.0 14.6
1. The geographic distribution of deaths in this table is based on the deceased’s usual place of residence. Counts in this table exclude deaths of non-residents ofCanada.
2. The category "Canada" includes deaths with unknown province or territory of residence in Canada.3. The ranking of the leading causes of death is based on the number of deaths.4. Age standardized mortality rate per 100,000 standard population.Note(s): See "Introduction", "Glossary" and "Definitions, data sources and methods" sections.Source(s): Statistics Canada, Canadian Vital Statistics, Death Database (CANSIM table 102-0563).
Statistics Canada, Catalogue no. 84-215-X 73

Table 3-13Ten leading causes of death, by sex and geography 1, 2005 — Nunavut
Canada 2 NunavutDeaths Deaths
rank 3 number percent age-standardized rate 4 rank 3 number percent age-standardized rate 4
Both sexesTotal, all causes of death (A00-Y89) ... 230,132 100.0 563.7 ... 115 100.0 1,012.2Malignant neoplasms (C00-C97) 1 67,343 29.3 170.3 1 35 30.4 380.3Diseases of heart (I00-I09, I11, I13,
I20-I51) 2 51,574 22.4 121.5 3 13 11.3 164.0Cerebrovascular diseases (I60-I69) 3 14,054 6.1 32.5 6 5 4.3 66.6Chronic lower respiratory diseases
(J40-J47) 4 10,515 4.6 25.1 5 9 7.8 103.4Accidents (unintentional injuries)
(V01-X59, Y85-Y86) 5 9,506 4.1 25.6 4 10 8.7 59.4Diabetes mellitus (E10-E14) 6 7,881 3.4 19.1 10 1 0.9 6.6Influenza and pneumonia (J10-J18) 7 5,845 2.5 13.2 10 1 0.9 14.8Alzheimer’s disease (G30) 8 5,762 2.5 12.7 15 0 0.0 0.0Intentional self-harm (suicide) (X60-X84,
Y87.0) 9 3,743 1.6 10.9 2 20 17.4 51.2Nephritis, nephrotic syndrome and
nephrosis (N00-N07, N17-N19,N25-N27) 10 3,643 1.6 8.5 10 1 0.9 9.4
MalesTotal, all causes of death (A00-Y89) ... 116,006 100.0 696.8 ... 75 100.0 1,186.6Malignant neoplasms (C00-C97) 1 35,481 30.6 207.7 1 18 24.0 386.2Diseases of heart (I00-I09, I11, I13,
I20-I51) 2 26,675 23.0 160.1 4 9 12.0 226.7Accidents (unintentional injuries)
(V01-X59, Y85-Y86) 3 5,807 5.0 35.6 3 10 13.3 107.3Cerebrovascular diseases (I60-I69) 4 5,767 5.0 35.2 7 2 2.7 28.3Chronic lower respiratory diseases
(J40-J47) 5 5,563 4.8 34.1 5 4 5.3 87.2Diabetes mellitus (E10-E14) 6 3,981 3.4 23.7 8 1 1.3 12.6Intentional self-harm (suicide) (X60-X84,
Y87.0) 7 2,857 2.5 16.9 2 16 21.3 83.2Influenza and pneumonia (J10-J18) 8 2,521 2.2 15.8 8 1 1.3 23.9Nephritis, nephrotic syndrome and
nephrosis (N00-N07, N17-N19,N25-N27) 9 1,859 1.6 11.5 8 1 1.3 17.6
Alzheimer’s disease (G30) 10 1,691 1.5 10.7 13 0 0.0 0.0
FemalesTotal, all causes of death (A00-Y89) ... 114,126 100.0 460.7 ... 40 100.0 778.6Malignant neoplasms (C00-C97) 1 31,862 27.9 143.8 1 17 42.5 330.9Diseases of heart (I00-I09, I11, I13,
I20-I51) 2 24,899 21.8 91.5 3 4 10.0 95.0Cerebrovascular diseases (I60-I69) 3 8,287 7.3 30.2 5 3 7.5 151.9Chronic lower respiratory diseases
(J40-J47) 4 4,952 4.3 19.8 2 5 12.5 119.8Alzheimer’s disease (G30) 5 4,071 3.6 13.6 8 0 0.0 0.0Diabetes mellitus (E10-E14) 6 3,900 3.4 15.6 8 0 0.0 0.0Accidents (unintentional injuries)
(V01-X59, Y85-Y86) 7 3,699 3.2 16.5 8 0 0.0 0.0Influenza and pneumonia (J10-J18) 8 3,324 2.9 11.5 8 0 0.0 0.0Nephritis, nephrotic syndrome and
nephrosis (N00-N07, N17-N19,N25-N27) 9 1,784 1.6 6.6 8 0 0.0 0.0
Essential (primary) hypertension andhypertensive renal disease (I10, I12) 10 930 0.8 3.2 8 0 0.0 0.0
1. The geographic distribution of deaths in this table is based on the deceased’s usual place of residence. Counts in this table exclude deaths of non-residents ofCanada.
2. The category "Canada" includes deaths with unknown province or territory of residence in Canada.3. The ranking of the leading causes of death is based on the number of deaths.4. Age standardized mortality rate per 100,000 standard population.Note(s): See "Introduction", "Glossary" and "Definitions, data sources and methods" sections.Source(s): Statistics Canada, Canadian Vital Statistics, Death Database (CANSIM table 102-0563).
Statistics Canada, Catalogue no. 84-215-X 74

Glossary
The definitions used for the production of statistical tables of Canadian vital statistics data are based on those recommended by the World HealthOrganization1and the United Nations2. Age: Age attained at the last birthday preceding death. In the case of infant deaths, the completed number of months (or minutes, hours, or days)since birth. Cause of death: The cause of death coded and tabulated is the underlying cause of death. This is defined as “(a) the disease or injury whichinitiated the train of morbid events leading directly to death, or (b) the circumstances of the accident or violence which produced the fatal injury”.This underlying cause of death is selected from a number of conditions listed on the medical certificate of cause of death.
Beginning in the year 2000 in Canada, causes of death and stillbirth are coded to the 10th revision of the World Health Organization’sInternational Statistical Classification of Diseases and Related Health Problems (ICD–10). The previous revision, ICD–93 was used inCanada for the classification of cause of death and stillbirth from 1979 to 1999.
Death: The permanent disappearance of all evidence of life at any time after a live birth has taken place. Stillbirths are excluded from deathstatistics unless otherwise indicated.
Infant death: Death of a child under one year of age.
ICD–10 codes: The International Statistical Classification of Diseases and Related Health Problems (ICD) codes, 10th Revision, were establishedby the World Health Organization in 1992. The ICD–10 manual assigns codes to specific diseases, injuries and causes of death. Live birth: The complete expulsion or extraction from its mother of a product of conception, irrespective of the duration of the pregnancy, which,after such separation, breathes or shows any other evidence of life, such as beating of the heart, pulsation of the umbilical cord, or definitemovement of voluntary muscles, whether or not the umbilical cord has been cut or the placenta is attached. Mortality rates
Age–standardized mortality rate: Age–standardization removes the effects of differences in the age structure of populations among areasand over time. Age-standardized mortality rates show the number of deaths per 100,000 population that would have occurred in a givenarea if the age structure of the population of that area was the same as the age structure of a specified standard population.
The formula for an age–standardized mortality rate r is:
where,
For age group i:
di is the age-sex-specific death count for a particular cause of death for a given year and geographic area,
piis the age-sex-specific population estimates for July 1 of the same year and geographic area, and
is the weight for that age group in a standard population. This standard population and calculated weights are reproduced below. Note that thesame weight is used for each sex.
To yield a rate per 100,000 population, r is multiplied by 100,000.
The standard population used in the calculation of age-standardized mortality rates is the 1991 Canadian Census of Population, by age group,both sexes combined.
Table A Standardized–population by age group,Canada, July 1st, 1991 (both sexes) Group Age in years Standard population Weight
1 under 1 403,061 0.0143
2 1 to 4 1,550,285 0.0551
3 5 to 9 1,953,045 0.0695
4 10 to 14 1,913,115 0.068
5 15 to 19 1,926,090 0.0685
6 20 to 24 2,109,452 0.075
7 25 to 29 2,529,239 0.0899
Statistics Canada, Catalogue no. 84-215-X 75

8 30 to 34 2,598,289 0.0924
9 35 to 39 2,344,872 0.0834
10 40 to 44 2,138,891 0.0761
11 45 to 49 1,674,153 0.0595
12 50 to 54 1,339,902 0.0476
13 55 to 59 1,238,441 0.044
14 60 to 64 1,190,217 0.0423
15 65 to 69 1,084,588 0.0386
16 70 to 74 834,024 0.0297
17 75 to 79 622,221 0.0221
18 80 to 84 382,303 0.0136
19 85 to 89 192,410 0.0068
20 90 and over 95,467 0.0034
Total ... 28,120,065 1
Note: ... not applicable Source: Statistic Canada
Age–specific mortality rate: The number of deaths in a particular age group during a given year per 100,000 population in the same agegroup as of July of the same year.
Infant mortality rate: The number of infant deaths duringa given year per 100,000 live births in the same year.
Population: Persons whose usual place of residence is somewhere in Canada, including Canadian government employees stationed abroad andtheir families, members of the Canadian Forces stationed abroad and their families, crews of Canadian merchant vessels, and non-permanentresidents of Canada.
Mid-year (July 1) population estimates are used to calculate the rates in vital statistics publications (see table footnotes). Population estimates arefrequently revised by Statistics Canada's Demography Division.
Provinces and territories: The geographic distribution of deaths in the tables of this publication is based on the deceased’s usual place ofresidence.
Rank of leading causes of death: The rank is based on the number of deaths of each leading cause of death. When there is the same number ofdeaths for more than one leading cause, the ranks assigned will be the same. Consequently, the next rank in line will be incremented by thenumber of equal ranks. For example, if there are three leading causes of death with 4th rank, the next leading cause will be rank 7th.
Footnotes
1. World Health Organization (WHO). International Statistical Classification of Diseases and Related Health Problems, Tenth Revision, Volumes and2 (ICD-10). Geneva, 1992.
2. United Nations. Principles and Recommendations for a Vital Statistics System. Statistical Papers, Series M, No. 9, Rev.1. New York, 1974.
3. Health Organization (WHO). International Classification of Diseases, 1975 Revision, Volume 1 (ICD–9). Geneva, 1977.
Statistics Canada, Catalogue no. 84-215-X 76