Embed Size (px)
Citation preview

2017-18 ACCOUNTABILITY PLAN PROGRESS REPORT
Leadership Prep Ocean Hill Charter School 2017-18 Accountability Plan Progress Report Page 1 of 73
_
Leadership Prep Ocean Hill Charter School
2017-18 ACCOUNTABILITY PLAN PROGRESS REPORT
Submitted to the SUNY Charter Schools Institute on:
October 2, 2018
By Brendan Campbell, Rita Chan and Angela Hamarich
51 Christopher Avenue, Room 327 Brooklyn, NY 11212
718-250-5767, ext. 3201

2017-18 ACCOUNTABILITY PLAN PROGRESS REPORT
Leadership Prep Ocean Hill Charter School 2017-18 Accountability Plan Progress Report Page 2 of 73
Rita Chan (Elementary Academy Director of Operations), Angela Hamarich, (Middle Academy Director of Operations), and Brendan Campbell (Uncommon Preparatory Charter High School Director of Operations) prepared this 2017-2018 Accountability Progress Report on behalf of the school’s board of trustees:
Trustee’s Name Board Position
Linton Mann III Chair
Tony Pasquariello Vice Chair
St. Claire Gerald Trustee
John Greenstein Trustee
Michael Hall Trustee
Shakima Jones Trustee
John Kim Trustee
Ekwutozia U. Nwabuzor Secretary
Brett Peiser Ex-Officio Trustee
Joseph F. Wayland Treasurer
Chrystal Stokes Williams Trustee
Rachel Huff (King) has served as the Principal of the Elementary Academy since from July 2015 –
June 2018, and Rita Chan has served as the Director of Operations of the Elementary Academy since
July 2017. Starting in July 2018, Caroline Kerns became the Principal of the Elementary Academy.
Jessica Pasionek has served as Principal of the Middle Academy since July 2017, and Angela
Hamarich has served as the Director of Operations of the Middle Academy since March 2018.
Christine Algozo has served as the Principal of Uncommon Preparatory Charter High School since
from July 2014 to June 2016, and Brendan Campbell has served as the Director of Operations of
Uncommon Preparatory Charter High School since July 2017. Starting in July 2018, Sean Healey
became the Principal of the Elementary Academy.

2017-18 ACCOUNTABILITY PLAN PROGRESS REPORT
Leadership Prep Ocean Hill Charter School 2017-18 Accountability Plan Progress Report Page 3 of 73
In 2010, 28% of 3rd graders in Brownsville’s Community School District (CSD) 23 scored Advanced or Proficient on the State ELA exam, and 28% performed at those levels on the State Math exam. Among District 23 8th graders, only 25% of them performed at the Advanced or Proficient Level on the State ELA exam, and only 35% did so on the State Math exam.
Community School District 23
(% of Students Earning 3 or 4 in 2010)
State (% of Students Earning 3
or 4 in 2010)
Subject/Grade 3rd 8th 3rd 8th
ELA 28% 25% 56% 47%
Math 28% 35% 60% 60%
Leadership Preparatory Ocean Hill Charter School resides in Community School District 23, and expects that many students will enter the school substantially below grade level in reading and math. Students in District 23 schools routinely score below the city and state averages on standardized exams. This achievement gap becomes even more pronounced with 8th grade students, as seen in the table below.1 In 2000, The National Center for Educational Statistics showed that 27.4% of New York State’s White residents over the age of 25 have a college degree, about twice the percentage of the state’s African-American (15.8%) or Latino (11.5%) residents.2 Educational inequalities, however, carry grave consequences for an alarming number of African-American males. As of the year 2000, according to the Justice Policy Institute, more African-American men were in jail or prison (791,000) than were enrolled at colleges or universities (603,032).3 Given these statistics, parents in this community are eager for high-quality public school options. Charter schools in central Brooklyn, including those in the Uncommon Schools network, have long waiting lists. There is a high need for rigorous, college-preparatory schools like Leadership Prep Ocean Hill in this community. Leadership Prep Ocean Hill expects most of its students to live in Brooklyn, especially in the predominantly African-American communities in central Brooklyn surrounding Ocean Hill that share its demographic trends and academic under-performance. As of the year 2000, Ocean Hill’s population under 18 years of age was 78% African-American and 19 % Latino.4 According to the 2000 Census, 81% of District 23 students qualify for free lunch. The median household income is $15,042 and approximately 41% of the population receives income support. Leadership Prep Charter School was founded in Ocean Hill/Brownsville (CSD 23) to address these alarming trends.
1 New York City Department of Education, Department of Assessment and Accountability & New York State Report Cards
2 The National Center for Education Statistics, Digest of Educational Statistics 2004.
3 Fox Butterfield. “Study Finds Big Increase in Black Men as Inmates since 1980.” New York Times (August 28, 2002): p. A14.
4 New York City Department of City Planning. “Brooklyn Community District 16 Profile.”
2017-18 ACCOUNTABILITY PLAN PROGRESS REPORT
Leadership Prep Ocean Hill Charter School 2017-18 Accountability Plan Progress Report Page 4 of 73
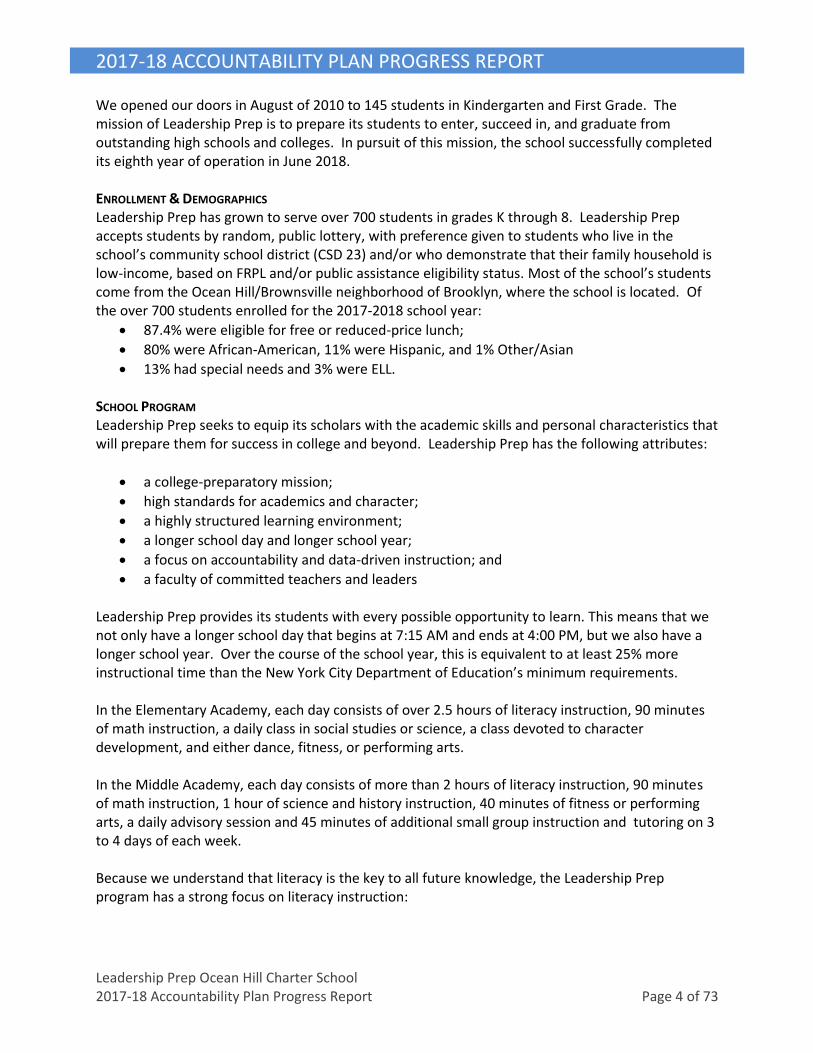
We opened our doors in August of 2010 to 145 students in Kindergarten and First Grade. The mission of Leadership Prep is to prepare its students to enter, succeed in, and graduate from outstanding high schools and colleges. In pursuit of this mission, the school successfully completed its eighth year of operation in June 2018. ENROLLMENT & DEMOGRAPHICS Leadership Prep has grown to serve over 700 students in grades K through 8. Leadership Prep accepts students by random, public lottery, with preference given to students who live in the school’s community school district (CSD 23) and/or who demonstrate that their family household is low-income, based on FRPL and/or public assistance eligibility status. Most of the school’s students come from the Ocean Hill/Brownsville neighborhood of Brooklyn, where the school is located. Of the over 700 students enrolled for the 2017-2018 school year:
• 87.4% were eligible for free or reduced-price lunch;
• 80% were African-American, 11% were Hispanic, and 1% Other/Asian
• 13% had special needs and 3% were ELL. SCHOOL PROGRAM Leadership Prep seeks to equip its scholars with the academic skills and personal characteristics that will prepare them for success in college and beyond. Leadership Prep has the following attributes:
• a college-preparatory mission;
• high standards for academics and character;
• a highly structured learning environment;
• a longer school day and longer school year;
• a focus on accountability and data-driven instruction; and
• a faculty of committed teachers and leaders
Leadership Prep provides its students with every possible opportunity to learn. This means that we not only have a longer school day that begins at 7:15 AM and ends at 4:00 PM, but we also have a longer school year. Over the course of the school year, this is equivalent to at least 25% more instructional time than the New York City Department of Education’s minimum requirements. In the Elementary Academy, each day consists of over 2.5 hours of literacy instruction, 90 minutes of math instruction, a daily class in social studies or science, a class devoted to character development, and either dance, fitness, or performing arts. In the Middle Academy, each day consists of more than 2 hours of literacy instruction, 90 minutes of math instruction, 1 hour of science and history instruction, 40 minutes of fitness or performing arts, a daily advisory session and 45 minutes of additional small group instruction and tutoring on 3 to 4 days of each week. Because we understand that literacy is the key to all future knowledge, the Leadership Prep program has a strong focus on literacy instruction:

2017-18 ACCOUNTABILITY PLAN PROGRESS REPORT
Leadership Prep Ocean Hill Charter School 2017-18 Accountability Plan Progress Report Page 5 of 73
• In the early grades, scholars have nearly 3 hours of reading instruction each day, which includes a systematic decoding program (Reading Mastery), a teacher-designed reading comprehension curriculum, the use of the STEP Assessment5, and daily read alouds;
• All classrooms are staffed with two teachers to ensure that the student-to-teacher ratio never exceeds 15:1;
• Students are expected to read for at least 15-20 minutes at home each night in Kindergarten and 1st grade, and for at least 30 minutes each night starting in 2nd grade;
• Students write in every class and use the Writer’s Workshop method to cultivate creativity and voice.
Even when students leave for the day, the learning continues. Each student, including each Kindergarten student, takes home at least 20 minutes of homework, every evening – including weekends and holidays. In the Middle Academy, scholars take home at least 2 hours of homework, every evening. Parents/guardians review and sign each evening’s assignment upon completion. Families and scholars are expected to read together for 20 minutes each night as well. FACULTY In the Elementary Academy, one Lead Teacher and one Teacher are assigned to each classroom and provide differentiated instruction in small groups and individually. In 2017-2018, every teacher held a bachelor’s degree and 92% either held or were working toward a master’s degree. In the Middle Academy, each teacher teaches a specialized subject area, with one teacher in each classroom. At Leadership Prep, we know that more instructional time and rigorous instruction is not enough to get all our scholars to college. We understand that we need to instill in our students the character attributes that will allow them to persevere, work hard, always try their best, respect their community, and grow into leaders, so that they can successfully travel the long road to college. We hold students to high standards in behavior to maximize learning time. To maintain an energetic, orderly, and productive environment where teachers can focus on teaching and students can focus on learning, the school implements a strict code of conduct, provides explicit daily instruction in core values, and enforces a dress code. Additionally, routines and rituals constantly reinforce our expectations, core values, and mission. This process begins before students even enter the building. Every morning, the school Leadership Team meets students outside the school’s front door to greet each student by name and shake each student’s hand as the student crosses the threshold. Each week ends with a Friday Community Circle for the elementary academy. Community Circles are centered around the Core Values of the school: L.E.A.D: Love, Enjoy, Achieve, and Dream. Role Models from our history who embody the Core Values are referenced in Community Meetings throughout the year and serve as role models for the other scholars. On Thursdays, the middle academy also holds a community meeting called Stampede, where the Middle Academy’s values,
5 The STEP (Strategic Teaching and Evaluation Progress) Literacy Assessment provides a set of tools, tightly aligned with scientifically
established milestones in reading development, to follow students' progress from kindergarten through third grade. These tools are organized into a developmentally sequenced set of tasks that can help a teacher understand the developmental status of individual students and a class of students at any given point. They also help a teacher analyze students' progress over time

2017-18 ACCOUNTABILITY PLAN PROGRESS REPORT
Leadership Prep Ocean Hill Charter School 2017-18 Accountability Plan Progress Report Page 6 of 73
T.U.S.K.S.: Tenacity, Understanding, Scholarship, Kindness, and Self-Discipline are celebrated through various activities. The Core Values of the elementary and middle academy are reinforced during Community Circles are seen and heard throughout the entire school, from classrooms, where scholars sing chants and songs that embody the messages of the Core Values, to hallways that are lined with inspirational quotes, pictures, and messages from strong role models from both inside and outside of the school building. Leadership Prep is led jointly by three Principals, one for the Elementary Academy, one for the Middle Academy, and one for the High School, who oversee teaching and learning in the school, and three Directors of Operations, who manage all non-instructional components of the schools. This dual leadership model allows the school to maintain a constant, unwavering focus on measurable student achievement while it grows as an effective, sustainable organization. All school leaders benefit from extensive training and ongoing support from Uncommon Schools.
School Enrollment by Grade Level and School Year School Year
K 1 2 3 4 5 6 7 8 9 10 11 12 Total
2013-14 89 87 88 80 54 79 475
2014-15 89 87 87 83 80 81 84 78 669
2015-16 90 90 89 86 90 94 85 74 77 70 845
2016-17 90 90 91 89 90 92 90 82 75 103 75 66 1033
2017-18 89 90 88 90 89 91 86 82 85 145 90 67 63 1155
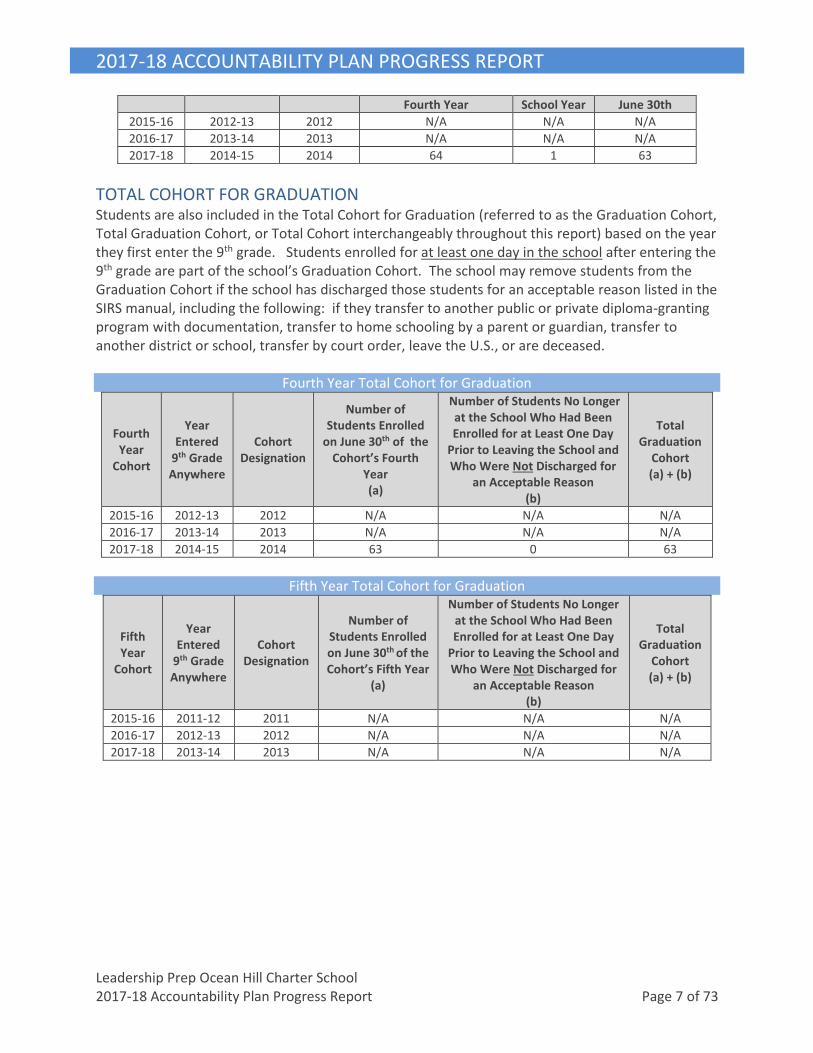
HIGH SCHOOL COHORTS ACCOUNTABILITY COHORT The state’s Accountability Cohort consists specifically of students who are in their fourth year of high school after entering the 9th grade. For example, the 2014 state Accountability Cohort consists of students who entered the 9th grade anywhere in the 2014-15 school year, were enrolled in the school on the state’s annual enrollment-determination day (i.e., BEDS day) in the 2017-18 school year, and either remained in the school for the rest of the year or left for an acceptable reason. (See New York State Education Department’s SIRS Manual for more details about cohort eligibility: http://www.p12.nysed.gov/irs/sirs/ht) The following table indicates the number of students in the Accountability Cohorts who are in their fourth year of high school anywhere and were enrolled at the school on BEDS Day in October and remained in the school until June 30th of that year.
Fourth-Year High School Accountability Cohorts Fourth
Year Cohort
Year Entered 9th Grade Anywhere
Cohort Designation
Number of Students Enrolled on BEDS Day in October of the Cohort’s
Number Leaving
During the
Number in Accountability
Cohort as of
2017-18 ACCOUNTABILITY PLAN PROGRESS REPORT
Leadership Prep Ocean Hill Charter School 2017-18 Accountability Plan Progress Report Page 7 of 73
Fourth Year School Year June 30th
2015-16 2012-13 2012 N/A N/A N/A
2016-17 2013-14 2013 N/A N/A N/A
2017-18 2014-15 2014 64 1 63
TOTAL COHORT FOR GRADUATION Students are also included in the Total Cohort for Graduation (referred to as the Graduation Cohort, Total Graduation Cohort, or Total Cohort interchangeably throughout this report) based on the year they first enter the 9th grade. Students enrolled for at least one day in the school after entering the 9th grade are part of the school’s Graduation Cohort. The school may remove students from the Graduation Cohort if the school has discharged those students for an acceptable reason listed in the SIRS manual, including the following: if they transfer to another public or private diploma-granting program with documentation, transfer to home schooling by a parent or guardian, transfer to another district or school, transfer by court order, leave the U.S., or are deceased.
Fourth Year Total Cohort for Graduation
Fourth Year
Cohort
Year Entered
9th Grade Anywhere
Cohort Designation
Number of Students Enrolled
on June 30th of the Cohort’s Fourth
Year (a)
Number of Students No Longer at the School Who Had Been Enrolled for at Least One Day
Prior to Leaving the School and Who Were Not Discharged for
an Acceptable Reason (b)
Total Graduation
Cohort (a) + (b)
2015-16 2012-13 2012 N/A N/A N/A
2016-17 2013-14 2013 N/A N/A N/A
2017-18 2014-15 2014 63 0 63
Fifth Year Total Cohort for Graduation
Fifth Year
Cohort
Year Entered
9th Grade Anywhere
Cohort Designation
Number of Students Enrolled on June 30th of the Cohort’s Fifth Year
(a)
Number of Students No Longer at the School Who Had Been Enrolled for at Least One Day
Prior to Leaving the School and Who Were Not Discharged for
an Acceptable Reason (b)
Total Graduation
Cohort (a) + (b)
2015-16 2011-12 2011 N/A N/A N/A
2016-17 2012-13 2012 N/A N/A N/A
2017-18 2013-14 2013 N/A N/A N/A

2017-18 ACCOUNTABILITY PLAN PROGRESS REPORT
Leadership Prep Ocean Hill Charter School 2017-18 Accountability Plan Progress Report Page 8 of 73
GOAL 1: HIGH SCHOOL GRADUATION
GOAL 1: HIGH SCHOOL GRADUATION
100% of students at Uncommon Preparatory Charter High School will graduate with a high school diploma.
Goal 1: Leading Indicator
Each year, 75 percent of students in first and second year high school Total Graduation Cohorts will earn at least ten credits (if 44 needed for graduation) or five credits (if 22 needed for graduation) each year.
METHOD
This measure serves as a leading indicator of the performance of the high school cohort and examines students’ progress toward graduation based on annual credit accumulation. The measure requires that, based on the school’s promotion requirements, 75 percent of the first and second year high school Total Graduation Cohorts will earn the required number of credits.
Students who receive a final failing grade (below a 70) for a class do not receive credit for the class. The final grade is based on individual quarter grades and a comprehensive subject-area test.
In subjects that earn 2.0 credits per year (English, Math, Science and History), a student who fails will be required to take an additional class to recover the lost credits. There are two ways this occurs, depending on how many classes a student is failing that academic year. If students fail one class, the student can recover credit by taking an intensive summer school class in this subject at his/her expense and/or at the school if offered. To recover credit, the class must be approved by the school. If a student fails two or more classes, that student is required to repeat the grade.
In subjects that require less than four years of credits (Foreign Language, Physical Education, Health and Electives), a student must make up the class in a subsequent school year after the school day, during the summer or another time the school deems appropriate (at his/her expense).
Seniors who fail a class but need the credit to graduate must take an intensive summer school class and cannot partake in commencement activities.
Given that Uncommon Preparatory Charter High School has provided tiers of student support throughout the school year – among which are Weekly Progress Reports, Office Hours, and Weekly Check-in Meetings with their Advisor – summer coursework for all subjects is the responsibility of the family, both financially and logistically. Subject-area teachers will supply the directions and expectations for summer research projects.
Students who need summer remediation and do not fulfill all requirements will automatically be retained.
Graduation Credit Requirements:
• English: 4 years (8 credits) • Math: 3-4 years (6-8 credits)

2017-18 ACCOUNTABILITY PLAN PROGRESS REPORT
Leadership Prep Ocean Hill Charter School 2017-18 Accountability Plan Progress Report Page 9 of 73
• Science: 4 years (8 credits) • History: 4 years (8 credits) • Language: 3 years (6 credits) • Electives: 3 years (6 credits) • Physical Education: 2 years (4 credits)
RESULTS AND EVALUATION
Uncommon Preparatory Charter High School met this measure, promoting above 75% of students within each cohort. We promoted 100% of students within our 2014 cohort and 100% of our 2015 cohort.
Percent of Students in First and Second Year Cohorts
Earning the Required Number of Credits in 2017-18
Cohort Designation
Number in Cohort
Percent Promoted
2016 85 99%
2017 127 98%
ADDITIONAL EVIDENCE
n/a

2017-18 ACCOUNTABILITY PLAN PROGRESS REPORT
Leadership Prep Ocean Hill Charter School 2017-18 Accountability Plan Progress Report Page 10 of 73
Goal 1: Leading Indicator
Each year, 75 percent of students in the second year high school Total Graduation Cohort will score at or above proficient on at least three different New York State Regents exams required for graduation.
METHOD
This measure serves as a leading indicator of the performance of high school cohorts and examines their progress towards graduation based on Regents exam passage. The measure requires that 75 percent of students in each Graduation Cohort have passed at least three Regents exams by their second year in the cohort. In August of 2018, the 2016 cohort will have completed its second year.
RESULTS AND EVALUATION
Looking at the 2014, 2015, and 2016 cohorts in their second year, we are exceeding the measure of 75% of students passing at least three different New York State Regents Exams required for graduation. At the end of their second year, 100% of the 2014 cohort had passed 3 or more Regents exams, and 96% of the 2015 cohort and 81% of the 2016 cohort had done the same. Looking at future data, we expect to continue to meet and exceed this goal. Most of our students take and pass two Regents exams in the 8th grade (Living Environment and Algebra I). Those who don’t pass those exams upon taking it a second time in their 9th grade year. Then, when they enroll in 9th grade, all students take the ELA Common Core Regents Exam, and about 50% take the Geometry Regents Exam. By prioritizing Regents exams in the 8th and 9th grades, we are able to ensure that at least 75% of students meet and exceed our goal of 3 passing Regents exams by the end of the 10th grade.
Percent of Students in their Second Year Passing Three Regents Exams by Cohort
Cohort Designation
Number in Cohort
Percent Passing Three
Regents
2014 64 100%
2015 69 96%
2016 94 81%
ADDITIONAL EVIDENCE
n/a
2017-18 ACCOUNTABILITY PLAN PROGRESS REPORT
Leadership Prep Ocean Hill Charter School 2017-18 Accountability Plan Progress Report Page 11 of 73
Goal 1: Absolute Measures
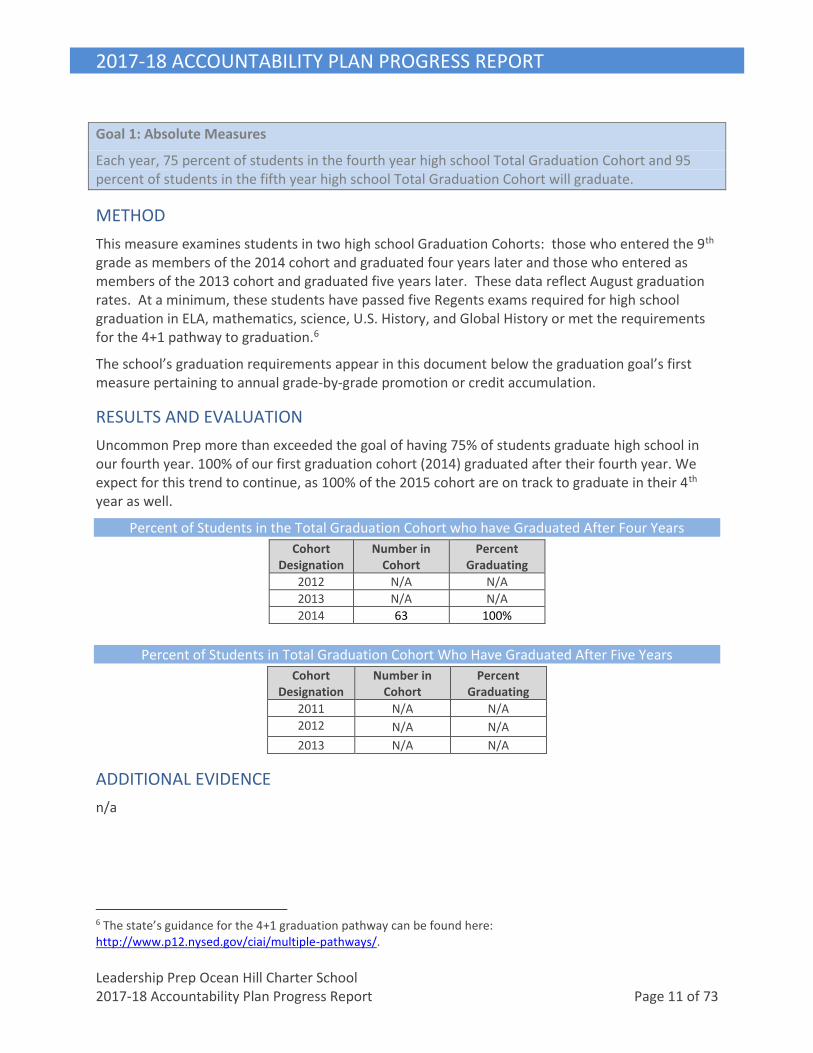
Each year, 75 percent of students in the fourth year high school Total Graduation Cohort and 95 percent of students in the fifth year high school Total Graduation Cohort will graduate.
METHOD
This measure examines students in two high school Graduation Cohorts: those who entered the 9th grade as members of the 2014 cohort and graduated four years later and those who entered as members of the 2013 cohort and graduated five years later. These data reflect August graduation rates. At a minimum, these students have passed five Regents exams required for high school graduation in ELA, mathematics, science, U.S. History, and Global History or met the requirements for the 4+1 pathway to graduation.6
The school’s graduation requirements appear in this document below the graduation goal’s first measure pertaining to annual grade-by-grade promotion or credit accumulation.
RESULTS AND EVALUATION
Uncommon Prep more than exceeded the goal of having 75% of students graduate high school in our fourth year. 100% of our first graduation cohort (2014) graduated after their fourth year. We expect for this trend to continue, as 100% of the 2015 cohort are on track to graduate in their 4th year as well.
Percent of Students in the Total Graduation Cohort who have Graduated After Four Years
Cohort Designation
Number in Cohort
Percent Graduating
2012 N/A N/A
2013 N/A N/A
2014 63 100%
Percent of Students in Total Graduation Cohort Who Have Graduated After Five Years
Cohort Designation
Number in Cohort
Percent Graduating
2011 N/A N/A
2012 N/A N/A
2013 N/A N/A
ADDITIONAL EVIDENCE
n/a
6 The state’s guidance for the 4+1 graduation pathway can be found here: http://www.p12.nysed.gov/ciai/multiple-pathways/.
2017-18 ACCOUNTABILITY PLAN PROGRESS REPORT
Leadership Prep Ocean Hill Charter School 2017-18 Accountability Plan Progress Report Page 12 of 73
Goal 1: Comparative Measure
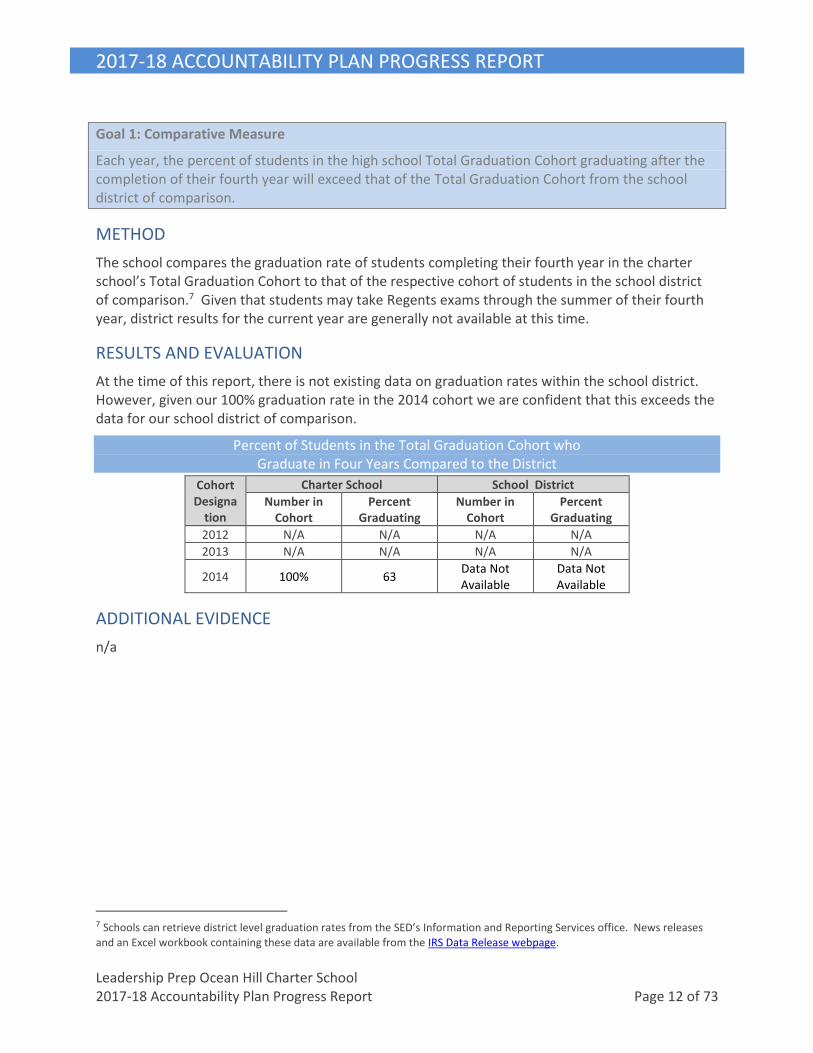
Each year, the percent of students in the high school Total Graduation Cohort graduating after the completion of their fourth year will exceed that of the Total Graduation Cohort from the school district of comparison.
METHOD
The school compares the graduation rate of students completing their fourth year in the charter school’s Total Graduation Cohort to that of the respective cohort of students in the school district of comparison.7 Given that students may take Regents exams through the summer of their fourth year, district results for the current year are generally not available at this time.
RESULTS AND EVALUATION
At the time of this report, there is not existing data on graduation rates within the school district. However, given our 100% graduation rate in the 2014 cohort we are confident that this exceeds the data for our school district of comparison.
Percent of Students in the Total Graduation Cohort who Graduate in Four Years Compared to the District
Cohort Designa
tion
Charter School School District
Number in Cohort
Percent Graduating
Number in Cohort
Percent Graduating
2012 N/A N/A N/A N/A
2013 N/A N/A N/A N/A
2014 100% 63 Data Not Available
Data Not Available
ADDITIONAL EVIDENCE
n/a
7 Schools can retrieve district level graduation rates from the SED’s Information and Reporting Services office. News releases
and an Excel workbook containing these data are available from the IRS Data Release webpage.

2017-18 ACCOUNTABILITY PLAN PROGRESS REPORT
Leadership Prep Ocean Hill Charter School 2017-18 Accountability Plan Progress Report Page 13 of 73
Goal 1: Absolute Measure
Each year, 75 percent of students in the high school Total Cohort pursuing an alternative graduation pathway (commonly referred to as the 4+1 pathway) will achieve a Regents equivalency score and pass an approved pathway assessment required for graduation by the end of their fourth year in the cohort.
METHOD
The New York State Board of Regents approved regulations establishing alternative pathways to graduation for all students. Students may replace one of the required Social Studies Regents exams with an approved alternative assessment. For more information about requirements and approved assessments refer to the NYSED resource online: http://www.p12.nysed.gov/ciai/multiple-pathways/. The school will document the names of the alternative assessments administered and success rate for students in the templates bellow.
RESULTS AND EVALUATION
100% of the 2014 graduation cohort passed one Regents exam in each subject, plus an additional Regents exam in an additional subject (commonly referred to as 4+1). This far exceeds the goal of 75% of the graduation cohort.
Percentage of the 2014 Graduation Cohort Pathway Students Demonstrating Success by Exam Type
Exam
Number of Graduation Cohort Members Tested
(a)
Number Passing or Achieving Regents
Equivalency
(b)
Percentage Passing
=[(b)/(a)]*100
English Language Arts N/A N/A N/A
Living Environment N/A N/A N/A
Global History N/A N/A N/A
US History N/A N/A N/A
Integrated Algebra N/A N/A N/A
Geometry N/A N/A N/A
Pathway Exam Passing Rate
by Fourth Year Accountability Cohort
Cohort Designation Number in
Cohort Percent Passing a Pathway
Exam
2012 0 0
2013 0 0
2014 0 0

2017-18 ACCOUNTABILITY PLAN PROGRESS REPORT
Leadership Prep Ocean Hill Charter School 2017-18 Accountability Plan Progress Report Page 14 of 73
ADDITIONAL EVIDENCE
n/a
SUMMARY OF THE HIGH SCHOOL GRADUATION GOAL
In our first year with a graduation cohort, Uncommon Prep met or exceeded all the goals listed below:
Type Measure Outcome
Leading Indicator
Each year, 75 percent of students in first and second year high school Total Graduation Cohorts will earn at least ten credits (if 44 needed for graduation) or five credits (if 22 needed for graduation) each year.
Achieved
Leading Indicator
Each year, 75 percent of students in the high school Total Graduation Cohort will score at least 65 on at least three different New York State Regents exams required for graduation by the completion of their second year in the cohort.
Achieved
Absolute
Each year, 75 percent of students in the fourth year high school Total Graduation Cohort will graduate.
Achieved
Absolute Each year, 95 percent of students in the fifth year high school Total Graduation Cohort will graduate.
Achieved
Comparative
Each year, the percent of students in the high school Total Graduation Cohort graduating after the completion of their fourth year will exceed that of the Total Graduation Cohort from the school district of comparison.
Achieved
Absolute
Each year, 75 percent of students in the high school Total Cohort pursuing an alternative graduation pathway will achieve a Regents equivalency score and pass an approved pathway assessment required for graduation by the end of their fourth year.
Achieved
ACTION PLAN
• Uncommon Preparatory Charter High School will continue to use an academic model that is largely similar to that of grades K-8, utilizing practices and approaches that have proven effective in producing significant academic gains at the highest-performing urban public schools in the country. Specifically, the high school will focus around:
• A College Preparatory Mission • High Standards for Academics and Character • A Highly Structured Learning Environment • A Longer School Day and A Longer School Year • A Focus on Accountability and Data-Driven Instruction • A Faculty of Committed and Talented Leaders and Teachers
The school has developed a rigorous high school curriculum based on the New York State Learning Standards and the newly adopted Common Core Learning Standards with a special emphasis on preparing students for admission into and success in college. The school

2017-18 ACCOUNTABILITY PLAN PROGRESS REPORT
Leadership Prep Ocean Hill Charter School 2017-18 Accountability Plan Progress Report Page 15 of 73
is structured so that students will meet the criteria for a Regents or Advanced Regents degree and will be accepted to at least one 4-year college.
• Quarterly Exams will continue to serve as a critical driver of classroom instruction and lesson planning for grades 9-12. The results will provide teachers with ongoing feedback on students’ progress in meeting state standards so they know, at any moment, which students have mastered which skills and which students have not. Armed with this information, teachers will be better prepared to target instruction and make significant content adjustments throughout the year, without waiting for an end-of-year assessment that shows a student in need.
• Uncommon Preparatory Charter High School will continue to administer Interim Assessments/Quarterly Exams on a quarterly basis in all five major subjects. Uncommon Preparatory Charter High School will continue to modify Interim Assessments/Quarterly Exams, ensuring that they measure student progress with respect to the Common Core Learning Standards.
• The high school instructional leadership team will continue to review teacher lesson plans, observe classroom instruction and provide feedback on instruction. The school’s leadership team will be responsible for identifying areas for growth and providing an extensive professional development program that meets the needs of both the school and individual teachers.
• The school’s leadership team will continue to review the effectiveness of the school’s curriculum and making necessary revisions to increase student achievement.
• School leaders will continue to work with master teachers at the school to research and develop curriculum modifications that will ensure increased levels of student achievement and will continuously monitor the effectiveness of those modifications.
• Uncommon Preparatory Charter High School will continue to offer Regents/AP/SAT preparation classes on Saturdays beginning in the 9th grade.

2017-18 ACCOUNTABILITY PLAN PROGRESS REPORT
Leadership Prep Ocean Hill Charter School 2017-18 Accountability Plan Progress Report Page 16 of 73
GOAL 2: COLLEGE PREPARATION
GOAL 2: COLLEGE PREPARATION
Uncommon Charter High School’s mission is to prepare all students to enter, succeed in, and graduate from a four year college by instilling in them the discipline, work ethic and passion for learning that will lead to their success.
Goal 2: Absolute Measure
Each year, 75 percent of graduating students will demonstrate their preparation for college by at least one or some combination of the following indicators:
• Passing an Advanced Placement (“AP”) exam with a score of 3 or higher;
• Earning a score of 4 or higher on an International Baccalaureate (“IB”) exam;
• Passing a College Level Examination Program (“CLEP”) exam;
• Passing a college level course offered at a college or university or through a school partnership with a college or university;
• Achieving the college and career readiness benchmark on the SAT; or,
• Earning a Regents diploma with advanced designation; or,
METHOD
Schools use any method listed here, or any combination thereof, to demonstrate that at least 75 percent of graduates are prepared to engage in rigorous college level coursework. The school should select only those methods listed here that it uses to demonstrate the college readiness of its students and eliminate those that it will not. For instance, high schools that do not deliver an IB Program as part of their high school design do not report on the IB option. The school reports on the number of students who attempted to achieve each indicator, the number who succeeded, and the corresponding percentage. Additionally, the school should report on the overall number of students who graduated after four years, the number of those graduates who achieved any of the relevant measures, and the overall percentage achieving the measure.
RESULTS AND EVALUATION
Uncommon Preparatory Charter High School focused on two of the above indicators: passing an AP Exam with a score of 3 or higher (of which 75% of the 2014 graduation cohort did) and achieving the college readiness benchmark on the SAT (of which 71% of the 2014 graduation cohort did). As such, Uncommon Preparatory Charter High School met this benchmark goal.

2017-18 ACCOUNTABILITY PLAN PROGRESS REPORT
Leadership Prep Ocean Hill Charter School 2017-18 Accountability Plan Progress Report Page 17 of 73
Percentage of the 2014 Total Cohort Graduates Demonstrating College Preparation by Indicator
Indicator
Number of Graduates who Attempted the
Indicator
Number who Achieved Indicator
Percentage of Graduates who Achieved Indicator
Passing an Advanced Placement exam with a
score of 3 or higher 63 47 75%
Achieving the college and career readiness
benchmark on the SAT 63 45 71%
Earning a Regents diploma with advanced
designation 63 0 0%
ADDITIONAL EVIDENCE
n/a

2017-18 ACCOUNTABILITY PLAN PROGRESS REPORT
Leadership Prep Ocean Hill Charter School 2017-18 Accountability Plan Progress Report Page 18 of 73
Goal 2: Absolute Measure
Each year, the College, Career, and Civic Readiness Index (“CCCRI”) for the school’s Total Cohort will exceed the Measure of Interim Progress (“MIP”) set forth in the state’s ESSA accountability system.
METHOD
The state’s recently finalized ESSA plan includes a College, Career, and Civic Readiness Index that measures the rate of completion among the Total Cohort of a variety of indicators of readiness for the next step after high school. Indicators that are more rigorous and that are therefore more difficult to attain receive greater weight in the new CCCRI (e.g., attaining a Regents diploma and a score of 4 or higher on an IB exam). Conversely, some less rigorous indicators that were not included in the College and Career Readiness Index under the state’s NCLB accountability system are included in the CCCRI (e.g., completion of a high school equivalency program).8
To achieve this measure, the school must have a CCCRI value that equals or exceeds the 2017-18 CCCRI MIP for all students. The state will calculate and disseminate the MIP in the summer of 2018. The CCCRI is calculated by multiplying the number of students in the cohort demonstrating college and career readiness by the weighting for the method by which the student demonstrated college and career readiness, divided by the number of students in the cohort. The highest possible CCCRI is 200.
RESULTS AND EVALUATION
At the time of this report, CCCRI data has not been released yet. Uncommon Preparatory Charter High School will update this report when the data becomes available.
CCCRI Performance by Cohort Year
Graduation Year
Cohort Number of Students in
Cohort
MIP
School CCCRI
2015-16 2012 N/A N/A N/A
2016-17 2013 N/A N/A N/A
2017-18 2014 63 TBD 154.76
ADDITIONAL EVIDENCE
n/a
8 For more detail about the weighting of college readiness methods for calculation of the CCCRI, see page 64 of the state’s finalized ESSA plan here: www.p12.nysed.gov/accountability/essa/documents/nys-essa-plan-final-1-16-2018.pdf
2017-18 ACCOUNTABILITY PLAN PROGRESS REPORT
Leadership Prep Ocean Hill Charter School 2017-18 Accountability Plan Progress Report Page 19 of 73
Goal 2: Comparative Measure
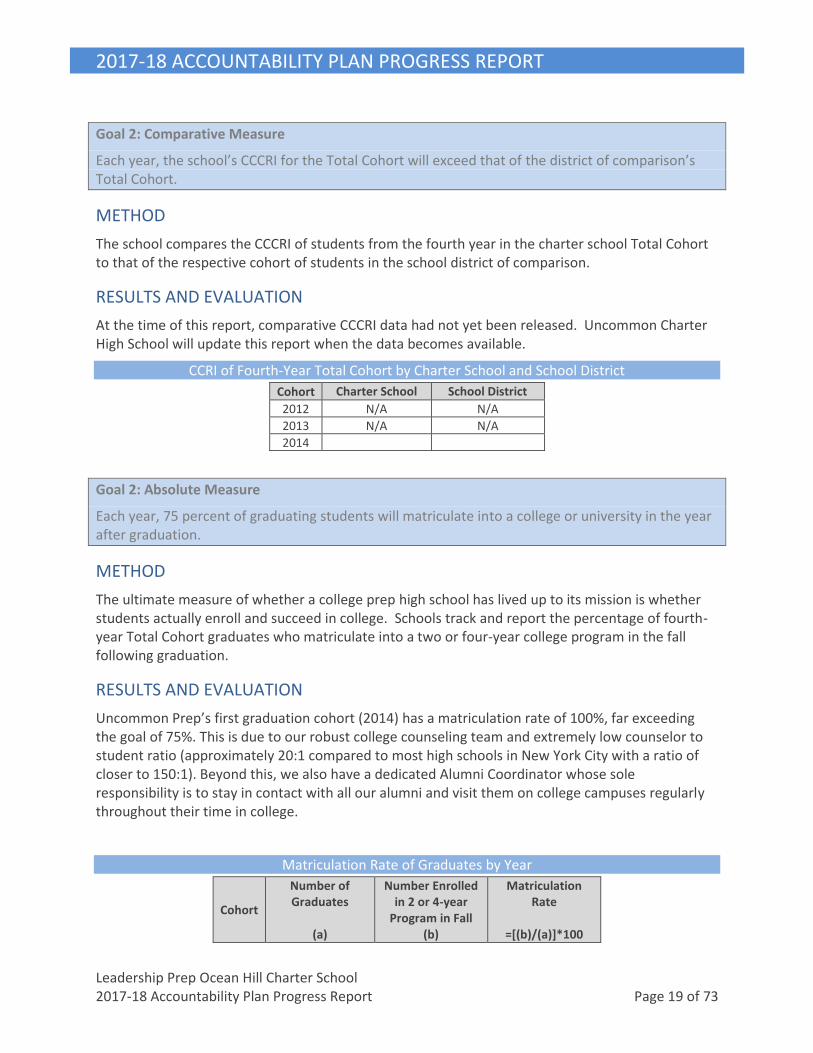
Each year, the school’s CCCRI for the Total Cohort will exceed that of the district of comparison’s Total Cohort.
METHOD
The school compares the CCCRI of students from the fourth year in the charter school Total Cohort to that of the respective cohort of students in the school district of comparison.
RESULTS AND EVALUATION
At the time of this report, comparative CCCRI data had not yet been released. Uncommon Charter High School will update this report when the data becomes available.
CCRI of Fourth-Year Total Cohort by Charter School and School District
Cohort Charter School School District
2012 N/A N/A
2013 N/A N/A
2014
Goal 2: Absolute Measure
Each year, 75 percent of graduating students will matriculate into a college or university in the year after graduation.
METHOD
The ultimate measure of whether a college prep high school has lived up to its mission is whether students actually enroll and succeed in college. Schools track and report the percentage of fourth-year Total Cohort graduates who matriculate into a two or four-year college program in the fall following graduation.
RESULTS AND EVALUATION
Uncommon Prep’s first graduation cohort (2014) has a matriculation rate of 100%, far exceeding the goal of 75%. This is due to our robust college counseling team and extremely low counselor to student ratio (approximately 20:1 compared to most high schools in New York City with a ratio of closer to 150:1). Beyond this, we also have a dedicated Alumni Coordinator whose sole responsibility is to stay in contact with all our alumni and visit them on college campuses regularly throughout their time in college.
Matriculation Rate of Graduates by Year
Cohort
Number of Graduates
(a)
Number Enrolled in 2 or 4-year
Program in Fall (b)
Matriculation Rate
=[(b)/(a)]*100
2017-18 ACCOUNTABILITY PLAN PROGRESS REPORT
Leadership Prep Ocean Hill Charter School 2017-18 Accountability Plan Progress Report Page 20 of 73
2012 N/A N/A N/A
2013 N/A N/A N/A
2014 63 63 100%
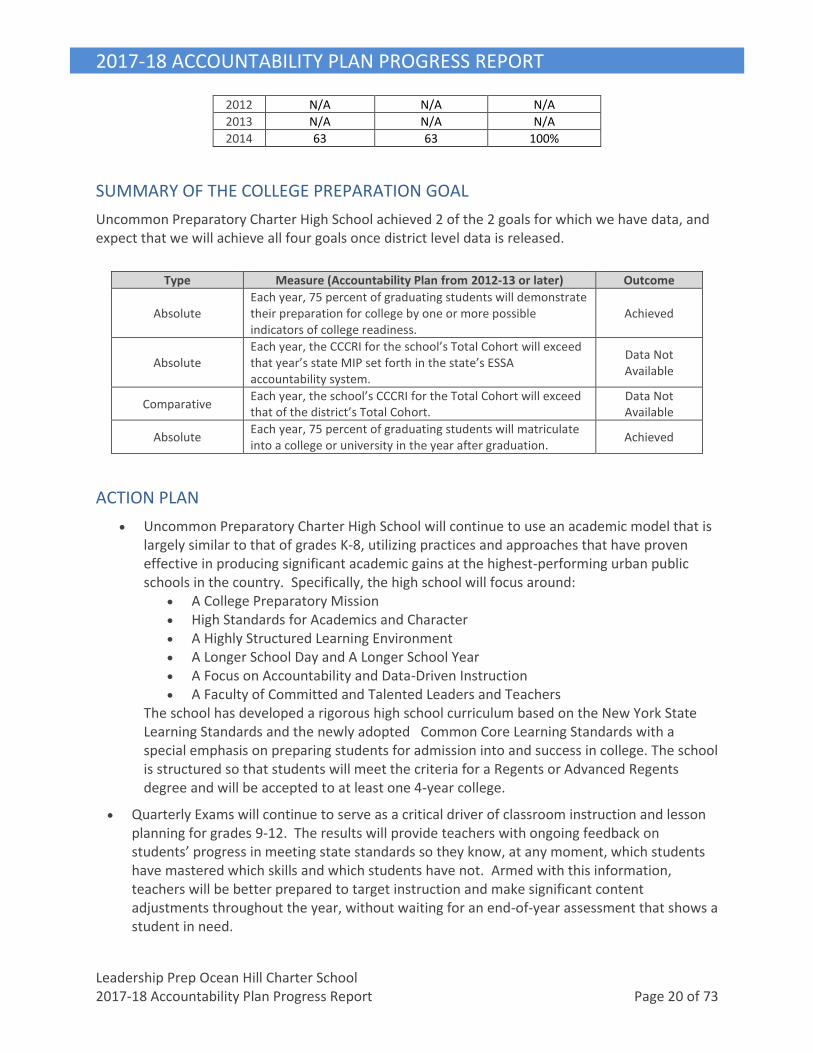
SUMMARY OF THE COLLEGE PREPARATION GOAL
Uncommon Preparatory Charter High School achieved 2 of the 2 goals for which we have data, and expect that we will achieve all four goals once district level data is released.
Type Measure (Accountability Plan from 2012-13 or later) Outcome
Absolute Each year, 75 percent of graduating students will demonstrate their preparation for college by one or more possible indicators of college readiness.
Achieved
Absolute Each year, the CCCRI for the school’s Total Cohort will exceed that year’s state MIP set forth in the state’s ESSA accountability system.
Data Not Available
Comparative Each year, the school’s CCCRI for the Total Cohort will exceed that of the district’s Total Cohort.
Data Not Available
Absolute Each year, 75 percent of graduating students will matriculate into a college or university in the year after graduation.
Achieved
ACTION PLAN
• Uncommon Preparatory Charter High School will continue to use an academic model that is largely similar to that of grades K-8, utilizing practices and approaches that have proven effective in producing significant academic gains at the highest-performing urban public schools in the country. Specifically, the high school will focus around:
• A College Preparatory Mission • High Standards for Academics and Character • A Highly Structured Learning Environment • A Longer School Day and A Longer School Year • A Focus on Accountability and Data-Driven Instruction • A Faculty of Committed and Talented Leaders and Teachers
The school has developed a rigorous high school curriculum based on the New York State Learning Standards and the newly adopted Common Core Learning Standards with a special emphasis on preparing students for admission into and success in college. The school is structured so that students will meet the criteria for a Regents or Advanced Regents degree and will be accepted to at least one 4-year college.
• Quarterly Exams will continue to serve as a critical driver of classroom instruction and lesson planning for grades 9-12. The results will provide teachers with ongoing feedback on students’ progress in meeting state standards so they know, at any moment, which students have mastered which skills and which students have not. Armed with this information, teachers will be better prepared to target instruction and make significant content adjustments throughout the year, without waiting for an end-of-year assessment that shows a student in need.

2017-18 ACCOUNTABILITY PLAN PROGRESS REPORT
Leadership Prep Ocean Hill Charter School 2017-18 Accountability Plan Progress Report Page 21 of 73
• Uncommon Preparatory Charter High School will continue to administer Interim Assessments/Quarterly Exams on a quarterly basis in all five major subjects. Uncommon Preparatory Charter High School will continue to modify Interim Assessments/Quarterly Exams, ensuring that they measure student progress with respect to the Common Core Learning Standards.
• The high school instructional leadership team will continue to review teacher lesson plans, observe classroom instruction and provide feedback on instruction. The school’s leadership team will be responsible for identifying areas for growth and providing an extensive professional development program that meets the needs of both the school and individual teachers.
• The school’s leadership team will continue to review the effectiveness of the school’s curriculum and making necessary revisions to increase student achievement.
• School leaders will continue to work with master teachers at the school to research and develop curriculum modifications that will ensure increased levels of student achievement and will continuously monitor the effectiveness of those modifications.
• Uncommon Preparatory Charter High School will continue to offer Regents/AP/SAT preparation classes on Saturdays beginning in the 9th grade.

2017-18 ACCOUNTABILITY PLAN PROGRESS REPORT
Leadership Prep Ocean Hill Charter School 2017-18 Accountability Plan Progress Report Page 22 of 73
GOAL 3: ENGLISH LANGUAGE ARTS
Goal 3: English Language Arts
All students at Leadership Prep Ocean Hill will be proficient readers and writers of the English language.
BACKGROUND
The Leadership Prep Ocean Hill English Language Arts curriculum reflects our understanding that literacy is the foundation upon which all future knowledge is built. We provide our scholars with 160 minutes of reading instruction each day. Our reading program overcomes our scholars’ early literacy deficits by aggressively accelerating them through a coherent set of curricula that addresses five components of early literacy: phonemic awareness, phonics, vocabulary, fluency, and comprehension. The foundation of our reading curriculum lies in four complementary, research-based programs – Direct Instruction (Reading Mastery); Riverdeep Destination Reading Program (computer program); reading comprehension instruction based on the lesson plans of other Uncommon Schools teachers; guided reading instruction based on the STEP assessment, and explicit vocabulary instruction through Text Talk (designed by noted vocabulary expert Isabel Beck). We incorporate these five components of early literacy to provide a rigorous reading education.
All Leadership Prep Ocean Hill Elementary Academy scholars start the day with a 25-minute Read Aloud, where they sit on the rug, listen to their teacher read to them from a text taken from the Text Talk Program or a teacher-selected text, and answer questions that increase their reading comprehension skills and vocabulary base. Teachers select texts which allow them to teach particular comprehension concepts that are being taught during Reading Comprehension.
The Reading Mastery program, which Elementary Academy teachers use as the curriculum for one of the daily 45-minute reading blocks, has an extremely strong research base. It is particularly effective in building the core decoding and fluency skills of students; moreover, the program is designed in a very linear, sequential manner. Students are not allowed to move on until they show mastery of the reading material. The Leadership Prep Ocean Hill program gives scholars five 45-minute Reading Mastery lessons a week in order to rapidly accelerate them to mastery.
Scholars spend three 45-minute blocks each week doing Reading Comprehension. During this time, scholars delve into authentic literature and practice independent reading strategies.
Scholars spend two 45-minute blocks each week doing Guided Reading using the STEP assessment. During this time, teachers use the assessment data as tools that are organized into a developmentally sequenced set of tasks that can help them understand the developmental status of individual students and a class of students at any given point. They also help a teacher analyze students' progress over time.
Scholars spend their third 45-minute reading block each day of the week on the classroom computers using the Riverdeep Destination Reading Program, which provides engaging individualized early literacy instruction that reinforces both phonics and comprehension skills.

2017-18 ACCOUNTABILITY PLAN PROGRESS REPORT
Leadership Prep Ocean Hill Charter School 2017-18 Accountability Plan Progress Report Page 23 of 73
Because we have two teachers in each classroom, all Leadership Prep Ocean Hill Elementary Academy scholars are able to rotate through the above-mentioned three 45-minute reading blocks each day in groups of 10-11 scholars, following the below schedule. Between each reading group, scholars engage in a fun and energizing transition routine (e.g. singing the “Look at how I move! Dance to get from the desks to the rug”).
Leadership Prep Ocean Hill administers several different assessments throughout the year for various grade levels. Commercial assessments include the STEP Program (see “Summary of ELA Goal” section). School-created assessments include: bimonthly writing compositions and quarterly Interim Assessments. A full-time Learning Support Coordinator helps the Principal develop and lead extensive and intensive professional development to ensure that Leadership Prep Ocean Hill’s English Language Arts Goals are met.
In the Middle Academy, students receive 60 minutes of reading and writing instruction daily, independent reading on several mornings of the week, as well as a robust library with word incentives, including special sweaters for students who reach up to 1,000,000 words. During independent reading, students can read an independent reading book on their level. Their levels are determined by the STAR Reading Assessment 4 times a year. The mobile school library carried books ranging across all grade levels to support scholars’ growth and knowledge. Scholars were given point goals every month to aid in increasing reading levels.
Goal 3: Absolute Measure
Each year, 75 percent of all tested students enrolled in at least their second year will perform at or above proficiency on the New York State English language arts examination for grades 3-8.
METHOD
The school administered the New York State Testing Program English Language Arts (“ELA”) assessment to students in 3rd through 8th grade in April 2018. Each student’s raw score has been converted to a grade-specific scaled score and a performance level.
The table below summarizes participation information for this year’s test administration. The table indicates total enrollment and total number of students tested. It also provides a detailed breakdown of those students excluded from the exam. Note that this table includes all students according to grade level, even if they have not enrolled in at least their second year (defined as enrolled by BEDS day of the previous school year).
2017-18 State English Language Arts Exam Number of Students Tested and Not Tested
Grade
Total Tested
Not Tested9 Total Enrolled IEP ELL Absent Refused
3 87 0 0 0 0 87
4 85 0 0 2 0 87
5 90 0 0 2 0 92
9 Students exempted from this exam according to their Individualized Education Program (IEP), because of English Language Learners (ELL) status, or absence for at least some part of the exam.

2017-18 ACCOUNTABILITY PLAN PROGRESS REPORT
Leadership Prep Ocean Hill Charter School 2017-18 Accountability Plan Progress Report Page 24 of 73
6 84 0 0 1 0 85
7 78 0 0 0 0 78
8 84 0 0 1 0 85
All 508 0 0 6 0 514
RESULTS AND EVALUATION
This is the sixth year that Leadership Prep Ocean Hill has administered the NYS ELA assessment and the second year administered to the eighth grade, and we surpassed this goal in Grade 3 by roughly 11% and in Grade 4 by roughly7%. However, overall, we fell short of the measure by 8% as a school. It is still the school’s goal to see that at least 75% of tested students perform at proficiency on the Common Core exam, and we are looking forward to implementing a higher level of rigor in our English Language Arts instruction going forward to better prepare our students to meet this bar.
Performance on 2017-18 State English Language Arts Exam
By All Students and Students Enrolled in At Least Their Second Year
Grades
All Students Enrolled in at least their
Second Year
Percent Proficient
Number Tested
Percent Proficient
Number Tested
3 85% 87 86% 83
4 80% 85 82% 79
5 52% 90 52% 81
6 61% 84 60% 77
7 56% 78 55% 75
8 63% 84 64% 78
All 66 508 67% 473
ADDITIONAL EVIDENCE
We believe that the steps we have been taking will help to increase student performance on the exam in the coming year.
• We are continuing to strengthen our curriculum’s alignment with the Common Core Standards, specifically regarding Informational Reading, Science, and Social Studies. Over the 2017-2018 school year we focused on improving our teaching practice and ensuring that teachers were educated and received professional development on the shift happening with Common Core prior to exams. We look forward to increasing our curricular alignment to the Common Core standards in the coming year, as well as our level of rigor in the classroom.
• Our school will focus more intently on writing instruction, specifically on best teaching practices in writing and the level of feedback on student work. We strongly believe with strengthened written responses more scholars will achieve at or above a Level 3 in the 2018-2019 school year.
ELA Performance by Grade Level and Year

2017-18 ACCOUNTABILITY PLAN PROGRESS REPORT
Leadership Prep Ocean Hill Charter School 2017-18 Accountability Plan Progress Report Page 25 of 73
Grade
Percent of Students Enrolled in At Least Their Second Year Achieving Proficiency
2015-16 2016-17 2017-18
Percent Number Tested
Percent Number Tested
Percent Number Tested
3 97% 78 89% 80 86% 83
4 86% 83 87% 82 82% 79
5 53% 81 56% 80 52% 81
6 50% 72 48% 88 60% 77
7 49% 68 55% 75 55% 75
8 N/A N/A 55% 69 64% 78
All 68% 383 65% 474 67% 473
Goal 3: Absolute Measure
Each year, the school’s aggregate Performance Index (“PI”) on the State English language arts exam will meet that year’s state Measure of Interim Progress (“MIP”) set forth in the state’s ESSA accountability system.
METHOD
In New York State, ESSA school performance goals are met by showing that an absolute proportion of a school's students who have taken the English language arts test have scored at the partially proficient, or proficient and advanced performance levels (Levels 2 or 3 & 4). The percentage of students at each of these three levels is used to calculate a PI and determine if the school has met the MIP set each year by the state’s ESSA accountability system. To achieve this measure, all tested students must have a PI value that equals or exceeds the state’s 2017-18 English language arts MIP for all students. The state plans to calculate and disseminate the MIP in summer 2018. The PI is the sum of the percent of students in all tested grades combined scoring at Level 2, plus two times the percent of students scoring at Level 3, plus two-and-a-half times the percent of students scoring at Level 4. Thus, the highest possible PI is 250.
RESULTS AND EVALUATION
Leadership Prep Ocean Hill scored 157 173.5 on the ELA Performance Index. The MIP for NY State has not yet been released at the time of this report. Therefore, Leadership Prep Ocean Hill cannot report if this measure was achieved.
English Language Arts 2017-18 Performance Index
Number in Cohort
Percent of Students at Each Performance Level
Level 1 Level 2 Level 3 Level 4
6 29 41 25
PI = 29 + 41 + 25 = 95 41 + 25 = 66 + (.5)*25 = 12.5 PI = 173.5

2017-18 ACCOUNTABILITY PLAN PROGRESS REPORT
Leadership Prep Ocean Hill Charter School 2017-18 Accountability Plan Progress Report Page 26 of 73
Goal 3: Comparative Measure
Each year, the percent of all tested students who are enrolled in at least their second year and performing at proficiency on the state English language arts exam will be greater than that of all students in the same tested grades in the school district of comparison.
METHOD
A school compares tested students enrolled in at least their second year to all tested students in the public school district of comparison. Comparisons are between the results for each grade in which the school had tested students in at least their second year at the school and the total result for all students at the corresponding grades in the school district.10
RESULTS AND EVALUATION
Leadership Prep Ocean Hill students in at least their second year outperformed peers in Community School District 23 by 41 percentage points. 86% of Leadership Prep Ocean Hill’s 3rd grade students, who were at least in their second year, scored “Proficient” (level 3) or “Advanced Proficient” (level 4) on the state ELA exam exceeding CSD 23 3rd graders by 56 percentage points. 30% of 3rd graders in District 23 scored “Proficient” (level 3) or “Advanced Proficient” (level 4). Additionally, 82% of Leadership Prep Ocean Hill’s 4th graders who were at least in their second year, scored “Proficient” (level 3) or “Advanced Proficient” (level 4) exceeding CSD 23 4th graders by 54 percentage points. 28% of 4th graders in CSD 23 scored “Proficient” (level 3) or “Advanced Proficient” (level 4). In fifth grade, Leadership Prep Ocean Hill students outperformed CSD 23 by 33 percentage points. In sixth grade, Leadership Prep Ocean Hill students outperformed their peers in CSD 23 by 33 percentage points. In seventh grade, Leadership Prep Ocean Hill students outperformed their peers in CSD 23 by 23 percentage points. Finally, in eighth grade, Leadership Prep Ocean Hill students outperformed CSD 23 by 34 percentage points.
Leadership Prep Ocean Hill students in all grades outperformed their peers in District 23 in ELA. Specifically, Leadership Prep Ocean Hill students outperformed their CSD 23 peers by 41 percentage points.
2017-18 State English Language Arts Exam Charter School and District Performance by Grade Level
Grade
Percent of Students at or Above Proficiency
Charter School Students In At Least 2nd Year
All District Students
Percent Number Tested
Percent Number Tested
3 86% 83 30% 735
10 Schools can acquire these data when the New York State Education Department releases its database containing grade level ELA and math test results for all schools and districts statewide. The NYSED announces the release of the data on its News Release webpage.

2017-18 ACCOUNTABILITY PLAN PROGRESS REPORT
Leadership Prep Ocean Hill Charter School 2017-18 Accountability Plan Progress Report Page 27 of 73
4 82% 79 28% 722
5 52% 81 19% 694
6 60% 77 27% 813
7 55% 75 23% 818
8 64% 78 30% 831
All 67% 473 26% 4,613
ADDITIONAL EVIDENCE
As seen in the table, Leadership Prep Ocean Hill’s third, fourth, fifth, sixth, and seventh, and eighth graders outperformed their district peers this year.
English Language Arts Performance of Charter School and Local District
by Grade Level and School Year
Grade
Percent of Students Enrolled in at Least their Second Year Scoring at or Above Proficiency Compared to District Students
2015-16 2016-17 2017-18
Charter School
District Charter School
District Charter School
District
3 97% 22% 89% 22% 86% 30%
4 86% 21% 87% 17% 82% 28%
5 53% 10% 56% 16% 52% 19%
6 50% 16% 48% 14% 60% 27%
7 49% 21% 55% 25% 55% 23%
8 N/A 23% 55% 33% 64% 30%
All 68% 19% 65% 21% 67% 26%
Goal 3: Comparative Measure
Each year, the school will exceed its predicted level of performance on the state English language
arts exam by an effect size of 0.3 or above (performing higher than expected to a meaningful degree) according to a regression analysis controlling for economically disadvantaged students among all public schools in New York State.
METHOD
The SUNY Charter Schools Institute (“Institute”) conducts a comparative performance analysis, which compares the school’s performance to that of demographically similar public schools statewide. The Institute uses a regression analysis to control for the percentage of economically disadvantaged students among all public schools in New York State. The Institute compares the school’s actual performance to the predicted performance of public schools with a similar concentration of economically disadvantaged students. The difference between the school’s actual and predicted performance, relative to other schools with similar economically disadvantaged statistics, produces an Effect Size. An Effect Size of 0.3, or performing higher than expected to a meaningful degree, is the requirement for achieving this measure.

2017-18 ACCOUNTABILITY PLAN PROGRESS REPORT
Leadership Prep Ocean Hill Charter School 2017-18 Accountability Plan Progress Report Page 28 of 73
Given the timing of the state’s release of economically disadvantaged data and the demands of the data analysis, the 2017-18 analysis is not yet available. This report contains 2016-17 results, the most recent Comparative Performance Analysis available.
RESULTS AND EVALUATION
Leadership Prep Ocean Hill in 2016-17 exceeded the Effect Size of 0.3, with Leadership Prep Ocean Hill’s Effect Size of 1.99. We believe that with the additional strengthening of the Leadership Prep Ocean Hill ELA program, the comparative data for the 2017-18 school year will again exceed the Effect Size.
2016-17 English Language Arts Comparative Performance by Grade Level
Grade Percent
Economically Disadvantaged
Number Tested
Percent of Students at Levels 3&4
Difference between Actual and Predicted
Effect Size
Actual Predicted
3 82.4 87 90 32.3 57.7 3.12
4 80.0 87 86 31.1 54.9 3.00
5 82.8 86 55 24.3 30.7 2.05
6 73.3 89 47 24.8 22.2 1.40
7 79.5 82 55 30.9 24.1 1.29
8 78.9 74 53 35.9 17.1 0.89
All 79.5 505 64.7 29.7 35.0 1.99
School’s Overall Comparative Performance:
Higher than expected to a large degree
ADDITIONAL EVIDENCE
English Language Arts Comparative Performance by School Year
School Year
Grades Percent
Economically Disadvantaged
Number Tested
Actual Predicted Effect Size
2014-15 4 82.2 327 48.5% 19.9% 2.08
2015-16 5 83.0 420 64.8% 25.9% 2.29
2016-17 5 79.5 505 64.7% 29.7% 1.99
Goal 3: Growth Measure11
Each year, under the state’s Growth Model, the school’s mean unadjusted growth percentile in English language arts for all tested students in grades 4-8 will be above the target of 50.
11 See Guidelines for Creating a SUNY Accountability Plan for an explanation.

2017-18 ACCOUNTABILITY PLAN PROGRESS REPORT
Leadership Prep Ocean Hill Charter School 2017-18 Accountability Plan Progress Report Page 29 of 73
METHOD
This measure examines the change in performance of the same group of students from one year to the next and the progress they are making in comparison to other students with the same score in the previous year. The analysis only includes students who took the state exam in 2016-17 and also have a state exam score from 2015-16 including students who were retained in the same grade. Students with the same 2015-16 score are ranked by their 2016-17 score and assigned a percentile based on their relative growth in performance (student growth percentile). Students’ growth percentiles are aggregated school-wide to yield a school’s mean growth percentile. In order for a school to perform above the target for this measure, it must have a mean growth percentile greater than 50.
Given the timing of the state’s release of Growth Model data, the 2017-18 analysis is not yet available. This report contains 2016-17 results, the most recent Growth Model data available.12
RESULTS AND EVALUATION
As a school, Leadership Prep Ocean Hill did not exceed the statewide median. Leadership Prep Ocean Hill exceeded this measure in Grade 4. In Grades s 4 and 5, 6, 7, and 8, Leadership Prep Ocean Hill’s Mean Growth Percentile did not meet this standard. We believe that with additional time, each grade will meet this standard.
2016-17 English Language Arts Mean Growth Percentile by Grade Level
Grade Mean Growth Percentile
School Target
4 54.7 50.0
5 34.0 50.0
6 49.2 50.0
7 45.8 50.0
8 46.3 50.0
All 46.0 50.0
ADDITIONAL EVIDENCE
English Language Arts Mean Growth Percentile by Grade Level and School Year
Grade Mean Growth Percentile
2014-15 2015-16 2016-17 Target
4 33.45 4957.1 54.7 50.0
5 38.65 49.346 34.0 50.0
6 62.33 54.254 49.2 50.0
7 67.52 45.8 50.0
8 46.3 50.0
All 45 52.7556.
9 46.0 50.0
12 Schools can acquire these data from the NYSED’s Business Portal: portal.nysed.gov.

2017-18 ACCOUNTABILITY PLAN PROGRESS REPORT
Leadership Prep Ocean Hill Charter School 2017-18 Accountability Plan Progress Report Page 30 of 73
SUMMARY OF THE ENGLISH LANGUAGE ARTS GOAL
In its sixth year of state testing, Leadership Prep Ocean Hill did not achieve the goal of having 75% of all tested students who are enrolled in at least their second year perform at proficiency on the New York State English language arts exam for grade 3-8. Additionally, Leadership Prep Ocean Hill as a whole significantly outperformed their district peers, with grades 3 and 4 performing the highest. Moreover, Leadership Prep Ocean Hill met its goal of exceeding the predicted level of performance by an Effect Size of 0.3 with Leadership Prep Ocean Hill’s Effect Size of 1.99.
Type Measure Outcome
Absolute Each year, 75 percent of all tested students who are enrolled in at least their second year will perform at proficiency on the New York State English language arts exam for grades 3-8.
Did Not Achieve
Absolute Each year, the school’s aggregate PI on the state’s English language arts exam will meet that year’s state MIP as set forth in the state’s ESSA accountability system.
MIP for NY State has not yet been released at the
time of this report
Comparative
Each year, the percent of all tested students who are enrolled in at least their second year and performing at proficiency on the state English language arts exam will be greater than that of students in the same tested grades in the school district of comparison.
Achieved
Comparative
Each year, the school will exceed its predicted level of performance on the state English language arts exam by an effect size of 0.3 or above (performing higher than expected to a small degree) according to a regression analysis controlling for economically disadvantaged students among all public schools in New York State. (Using 2016-17 results.)
Achieved
Growth Each year, under the state’s Growth Model the school’s mean unadjusted growth percentile in English language arts for all tested students in grades 4-8 will be above the target of 50. (Using 2016-17 results.)
Did Not Achieve
ACTION PLAN
During the 2018-2019 school year, the Elementary Academy will continue to deploy two teachers in each classroom, divide classrooms into three, skill-differentiated small reading groups, and deliver 160 minutes of daily reading instruction. The school will also continue to utilize Direct Instruction (Reading Mastery) as its main K-2 reading program, particularly because of its success in building the core decoding and fluency skills of students and to utilize a computer program to take students from basic phonemic awareness to sophisticated reading comprehension skills in a three-year sequence. Teachers will also continue to develop and lead daily Reading Comprehension lessons in which students learn and practice reading comprehension skills.
Leadership Prep supplements this core reading program for struggling readers through its Reading Intervention program and staffing which allows Leadership Prep to provide highly specialized, intervention-based instruction to students identified as at-risk for academic failure in reading.
The Elementary Academy also redesigned their daily schedules to allow for up to 50 more minutes of small-group instruction during the day which will be supplemented by more extensive tutoring for testing grades. The Middle Academy continues to add time to ELA instruction and includes a

2017-18 ACCOUNTABILITY PLAN PROGRESS REPORT
Leadership Prep Ocean Hill Charter School 2017-18 Accountability Plan Progress Report Page 31 of 73
daily small group instruction block for ELA that ranges from 45 to 60 minutes. The Middle Academy also will be launching its first Saturday school program starting in the spring to provide an additional 90 minutes of ELA instruction each week to struggling students.
Leadership Prep will also implement professional development programs targeted towards ELA instruction. In preparation for the 2018-2019 school year, teachers who are new to Leadership Prep will participate in two days of Reading Mastery, Guided Reading and STEP training. These trainings will be conducted by content experts and master teachers from the Uncommon Schools network. Moreover, Leadership Prep will continue to deliver professional development for all teachers on Evidence-Based Questions, interactive reading, Accountable Independent Reading and Habits of Discussion.
Finally, the school is energized by the challenge that more rigorous Common Core standards present. As part of the Uncommon Schools network, Leadership Prep Ocean Hill will continue to make changes to its curriculum to be better prepared to address the increased rigor of the Common Core standards.
Beginning three years ago, Leadership Prep Ocean Hill began to modify the schools’ existing curricula for English Language Arts (ELA), working to strengthen its Reading Instruction and align the ELA curriculum with the new Common Core learning standards. Leadership Prep Ocean Hill Elementary Academy will continue to make adjustments to its ELA curriculum. With the adoption of Common Core, we need to factor in the Lexile level of text, and so while 90% of the books used at Leadership Prep Ocean Hill EA were aligned, we continue to adjust other books, with some books moving down in reading level or grade. Furthermore, teachers will continue to make conversations more text based, and students will continue using text-based evidence to support verbal and written responses.
While our narrative reading began aligning with Common Core last year, the work that our experienced teachers and instructional leaders have been doing this summer will ensure that our informational reading is also common core aligned. In addition, teachers and instructional leaders are working to strengthen our writing curriculum so that there is an increased focus on the techniques used to teach writing and so that students are receiving an increased amount of feedback on their writing. This will ensure that student performance on the New York State ELA exam is increased in future years.
Interim Assessments continue to be reassessed to ensure alignment with the Common Core. For example, passages continue to be more rigorous and the questions require students to go back to the text to analyze and synthesize information. The addition of rigorous passages and questions continues to be added during each round of Interim Assessments based on real-time student data. Lastly, passages used in both narrative and informational reading will be Lexile leveled to ensure that students are accessing and reading text at the appropriate levels for their grade and content according to the Common Core Learning standards.
Leadership Prep remains strongly committed to keeping literacy at the forefront of our curriculum and to taking whatever steps are necessary to ensure that all our students become proficient readers and writers.
2017-18 ACCOUNTABILITY PLAN PROGRESS REPORT
Leadership Prep Ocean Hill Charter School 2017-18 Accountability Plan Progress Report Page 32 of 73
HIGH SCHOOL ENGLISH LANGUAGE ARTS
Goal 3: Absolute Measure
Each year, 65 percent of students in the high school Accountability Cohort will exceed Common Core expectations (currently scoring at or above Performance Level 4 on the Regents Exam in English Language Arts (Common Core)) by the completion of their fourth year in the cohort.
METHOD
The school administered a Regents English exam that students must pass to graduate. The school scores Regents on a scale from 0 to 100. The State Education Department currently defines the college and career readiness standard as scoring at or above Performance Level 4 (meeting Common Core expectations) on the Regents Exam in English Language Arts (Common Core).13 This measure examines the percent of the Accountability Cohort that achieved at least Performance Level 4 by the completion of their fourth year in the cohort.
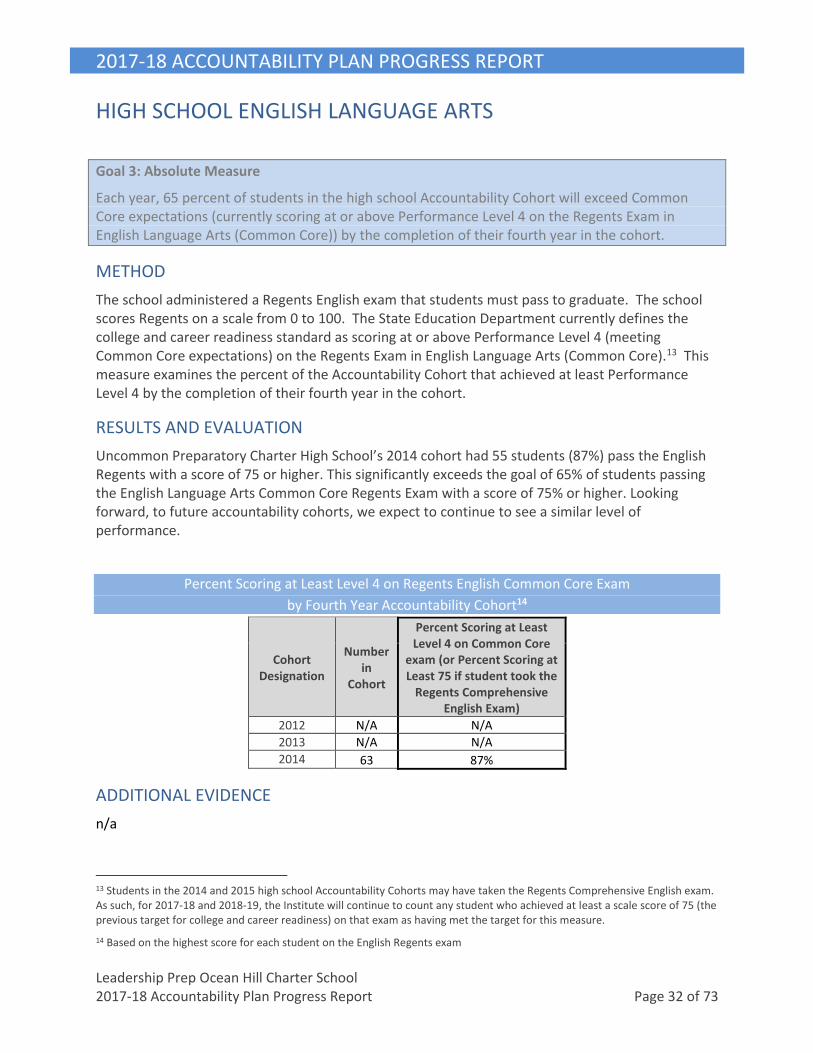
RESULTS AND EVALUATION
Uncommon Preparatory Charter High School’s 2014 cohort had 55 students (87%) pass the English Regents with a score of 75 or higher. This significantly exceeds the goal of 65% of students passing the English Language Arts Common Core Regents Exam with a score of 75% or higher. Looking forward, to future accountability cohorts, we expect to continue to see a similar level of performance.
Percent Scoring at Least Level 4 on Regents English Common Core Exam
by Fourth Year Accountability Cohort14
Cohort Designation
Number in
Cohort
Percent Scoring at Least Level 4 on Common Core
exam (or Percent Scoring at Least 75 if student took the
Regents Comprehensive English Exam)
2012 N/A N/A
2013 N/A N/A
2014 63 87%
ADDITIONAL EVIDENCE
n/a
13 Students in the 2014 and 2015 high school Accountability Cohorts may have taken the Regents Comprehensive English exam. As such, for 2017-18 and 2018-19, the Institute will continue to count any student who achieved at least a scale score of 75 (the previous target for college and career readiness) on that exam as having met the target for this measure.
14 Based on the highest score for each student on the English Regents exam

2017-18 ACCOUNTABILITY PLAN PROGRESS REPORT
Leadership Prep Ocean Hill Charter School 2017-18 Accountability Plan Progress Report Page 33 of 73
Percent Achieving at Least Level 4 by Cohort and Year
Cohort Designation
2015-16 2016-17 2017-18
Number in Cohort
Percent Level 4
Number in Cohort
Percent Level 4
Number in Cohort
Percent Level 4
2014 64 88% 63 87%
2015 73 63% 70 70%
2016 96 39% 90 49%
2017 136 24%

2017-18 ACCOUNTABILITY PLAN PROGRESS REPORT
Leadership Prep Ocean Hill Charter School 2017-18 Accountability Plan Progress Report Page 34 of 73
Goal 3: Absolute Measure
Each year, 80 percent of students in the high school Accountability Cohort will at least partially meet Common Core expectations (currently scoring at or above Performance Level 3 on the Regents Exam in English Language Arts (Common Core)) by the completion of their fourth year in the cohort.
METHOD
The school administered a Regents English exam that students must pass to graduate. The school scores Regents on a scale from 0 to 100. The State Education Department currently defines the cut off for passing and meeting the requirement for graduation as scoring at or above Performance Level 3 (partially meeting Common Core expectations) on the Regents Exam in English Language Arts (Common Core). This measure examines the percent of the Accountability Cohort that achieved at least Performance Level 3 by the completion of their fourth year in the cohort.
RESULTS AND EVALUATION
100% of the 2014 cohort, the first graduation cohort for Uncommon Preparatory Charter High School, scored at least a level 3 on the Regents English Exam, far exceeding the goal of 80%.
Percent Scoring at Least Level 3 on Regents English Common Core Exam
by Fourth Year Accountability Cohort15
Cohort Designation
Number in
Cohort
Percent Scoring at Least Level 3 on the Regents
English Exam
2012 N/A N/A
2013 N/A N/A
2014 63 100%
ADDITIONAL EVIDENCE
n/a
Percent Achieving at Least Level 3 by Cohort and Year
Cohort Designation
2015-16 2016-17 2017-18
Number in Cohort
Percent Passing
Number in Cohort
Percent Passing
Number in Cohort
Percent Passing
2014 64 100% 63 100%
2015 73 92% 70 96%
2016 96 57% 90 70%
2017 136 56%
15 Based on the highest score for each student on the English Regents exam

2017-18 ACCOUNTABILITY PLAN PROGRESS REPORT
Leadership Prep Ocean Hill Charter School 2017-18 Accountability Plan Progress Report Page 35 of 73
Goal 3: Absolute Measure
Each year, the Performance Index (“PI”) on the Regents English exam of students completing their fourth year in the Accountability Cohort will meet the state’s Measure of Interim Progress (“MIP”) set forth in the state’s ESSA accountability system.
METHOD
The state’s finalized and approved ESSA plan in 2018 includes a revised calculation of the high school Performance Index. In it, schools now receive additional credit for students scoring at Accountability Level 4.16 To achieve this measure, all tested students in the Accountability Cohort must have a PI that equals or exceeds the state’s 2017-18 English language arts MIP for all students. The state plans to calculate and disseminate the MIP in summer 2018.
The Performance Index is calculated as such: (percent of students scoring at Accountability Level 2) + 2*(percent of students scoring at Accountability Level 3) + 2.5 * (percent of students scoring at Accountability Level 4). Thus, the highest possible PI is 250. The basis for the percent of students is the school’s fourth year Total Cohort for Graduation. The Regents Examination in English Language Arts (Common Core) is scored on a scale from 0 to 100; 0 to 64 is Accountability Level 1, 65 to 78 is Accountability Level 2; 79 to 84 is Accountability Level 3, and 85 to 100 is Accountability Level 4.
RESULTS AND EVALUATION
The 2014 graduating cohort scored 243.5 out of the possible 250 on the English Language Arts Performance Index. At this time, the Performance Index benchmark is unavailable; however Uncommon Preparatory Charter High School has received a very high PI score. The high PI is due to 87% of the cohort achieving a level 4 score on the English Language Regents.
English Language Arts Performance Index (PI)
For the 2014 High School Accountability Cohort
Number in Cohort
Percent of Students at Each Accountability Level
Level 1 Level 2 Level 3 Level 4
63 0 0 13% 87%
PI = 0 + 13 + 87 = 100 13 + 87 = 100 + (.5)*87 = 43.5 PI = 243.5
ADDITIONAL EVIDENCE
n/a
16 For more details on the score ranges used to determine Accountability Levels as distinguished from Performance Levels, see www.p12.nysed.gov/irs/sirs/documents/2017RegentsScoreRangesforAnnualandAccountabilityReporting.pdf

2017-18 ACCOUNTABILITY PLAN PROGRESS REPORT
Leadership Prep Ocean Hill Charter School 2017-18 Accountability Plan Progress Report Page 36 of 73
Goal 3: Comparative Measure
Each year, the percent of students in the high school Total Cohort meeting or exceeding Common Core expectations on the Regents Exam in English Language Arts (Common Core) will exceed the percentage of comparable students in the district meeting or exceeding Common Core expectations.
METHOD
The school compares the performance of students in their fourth year in the charter school Total Cohort to that of the respective Total Cohort of students in the school district of comparison. In order to meet or exceed Common Core expectations, a student must achieve Performance Level 4 or 5. Given that students may take Regents exam up through the summer of their fourth year, the school presents most recently available school district results.
RESULTS AND EVALUATION
At the time of this report, comparative data for English Regents had not yet been released. Uncommon Preparatory Charter High School will update this report when the data becomes available.
Percent Achieving Performance Level 4 or Higher on English Regents
of Fourth-Year Accountability Cohorts by Charter School and School District
Cohort
Charter School School District
Percent Level 4 or 5
Number in Cohort
Percent Level 4 or 5
Number in Cohort
2012 N/A N/A N/A N/A
2013 N/A N/A N/A N/A
2014 87% 63
Data Not Available
Data Not Available
ADDITIONAL EVIDENCE
n/a

2017-18 ACCOUNTABILITY PLAN PROGRESS REPORT
Leadership Prep Ocean Hill Charter School 2017-18 Accountability Plan Progress Report Page 37 of 73
Goal 3: Comparative Measure
Each year, the percent of students in the high school Total Cohort at least partially meeting Common Core expectations on the Regents Exam in English Language Arts (Common Core) will exceed the percentage of comparable students in the district at least partially meeting Common Core expectations.
METHOD
The school compares the performance of students in their fourth year in the charter school Total Cohort to that of the respective Total Cohort of students in the school district of comparison. In order to at least partially meet Common Core expectations, a student would need to pass the exam and score at Performance Level 3 or higher (i.e. scoring at least 65).Given that students may take Regents exam up through the summer of their fourth year, the school presents most recently available school district results.
RESULTS AND EVALUATION
At the time of this report, comparative data for English Regents had not yet been released. Uncommon Preparatory Charter High School will update this report when the data becomes available.
Percent Achieving Performance Level 3 or Higher on English Regents
of Fourth-Year Accountability Cohorts by Charter School and School District
Cohort
Charter School School District
Percent Level 3 or
Higher
Number in Cohort
Percent Level 3 or
Higher
Number in Cohort
2012 N/A N/A N/A N/A
2013 N/A N/A N/A N/A
2014 100% 63
Data Not Available
Data Not Available
ADDITIONAL EVIDENCE
n/a

2017-18 ACCOUNTABILITY PLAN PROGRESS REPORT
Leadership Prep Ocean Hill Charter School 2017-18 Accountability Plan Progress Report Page 38 of 73
Goal 3: Comparative Measure
Each year, the Performance Index (“PI”) in Regents English of students in the fourth year of their high school Accountability Cohort will exceed that of comparable students from the school district of comparison.
METHOD
The school compares the performance of students in their fourth year in the charter school Accountability Cohort to that of the respective cohort of students in the school district of comparison. Given that students may take Regents exam up through the summer of their fourth year, the school presents most recently available school district results.
RESULTS AND EVALUATION
At the time of this report, comparative data for English Regents had not yet been released. Uncommon Charter High School will update this report when the data becomes available.
English Regents Performance Index (PI)17
of Fourth-Year Accountability Cohorts by Charter School and School District
Cohort
Charter School School District
PI Cohort
Size PI
Cohort Size
2012 N/A N/A N/A N/A
2013 N/A N/A N/A N/A
2014 243.5 63
Data Not Available
Data Not Available
ADDITIONAL EVIDENCE
n/a
17 For an explanation of the procedure to calculate the school’s PI, see page 28.
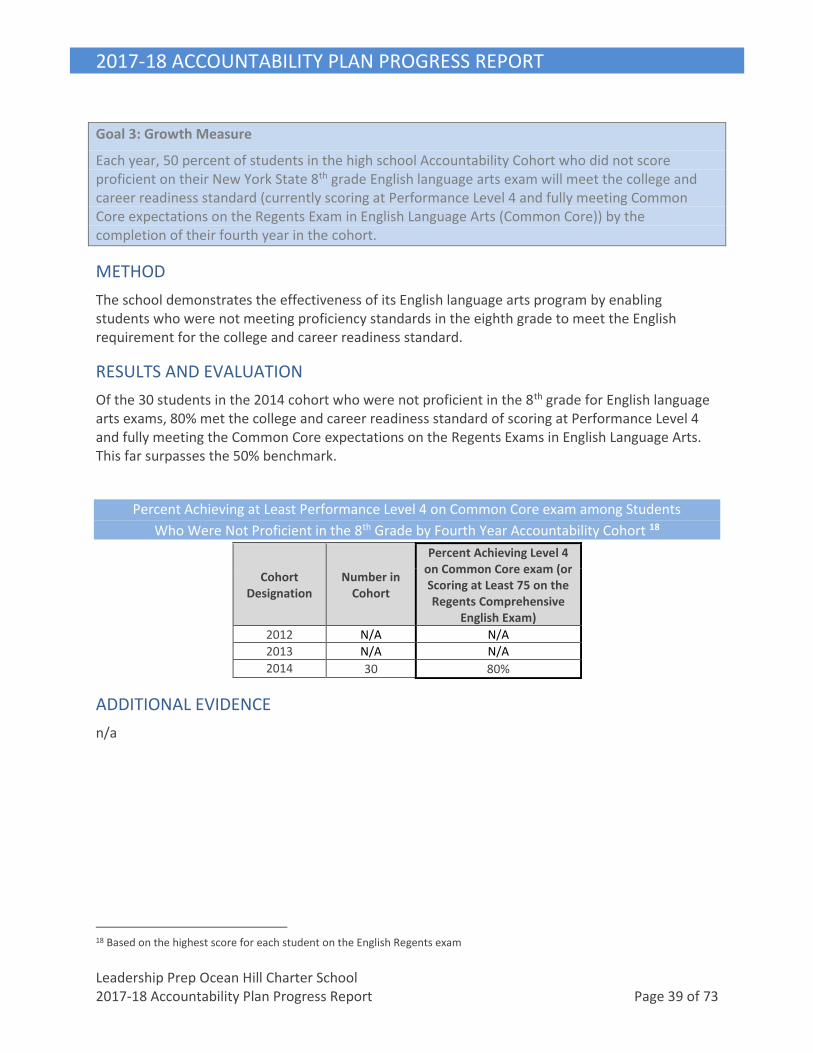
2017-18 ACCOUNTABILITY PLAN PROGRESS REPORT
Leadership Prep Ocean Hill Charter School 2017-18 Accountability Plan Progress Report Page 39 of 73
Goal 3: Growth Measure
Each year, 50 percent of students in the high school Accountability Cohort who did not score proficient on their New York State 8th grade English language arts exam will meet the college and career readiness standard (currently scoring at Performance Level 4 and fully meeting Common Core expectations on the Regents Exam in English Language Arts (Common Core)) by the completion of their fourth year in the cohort.
METHOD
The school demonstrates the effectiveness of its English language arts program by enabling students who were not meeting proficiency standards in the eighth grade to meet the English requirement for the college and career readiness standard.
RESULTS AND EVALUATION
Of the 30 students in the 2014 cohort who were not proficient in the 8th grade for English language arts exams, 80% met the college and career readiness standard of scoring at Performance Level 4 and fully meeting the Common Core expectations on the Regents Exams in English Language Arts. This far surpasses the 50% benchmark.
Percent Achieving at Least Performance Level 4 on Common Core exam among Students
Who Were Not Proficient in the 8th Grade by Fourth Year Accountability Cohort 18
Cohort Designation
Number in Cohort
Percent Achieving Level 4 on Common Core exam (or Scoring at Least 75 on the Regents Comprehensive
English Exam)
2012 N/A N/A
2013 N/A N/A
2014 30 80%
ADDITIONAL EVIDENCE
n/a
18 Based on the highest score for each student on the English Regents exam

2017-18 ACCOUNTABILITY PLAN PROGRESS REPORT
Leadership Prep Ocean Hill Charter School 2017-18 Accountability Plan Progress Report Page 40 of 73
Goal 3: Growth Measure
Each year, 75 percent of students in the high school Accountability Cohort who did not score proficient on their New York State 8th grade English language arts exam will at least partially meet Common Core expectations (currently scoring at Performance Level 3 on the Regents Exam in English Language Arts (Common Core)) by the completion of their fourth year in the cohort.
METHOD
The school demonstrates the effectiveness of its English language arts program by enabling students who were not meeting proficiency standards in the eighth grade to meet the English requirement for graduation.
RESULTS AND EVALUATION
Of the 30 students in the 2014 cohort who were not proficient in the 8th grade for English language arts exams, 100% partially met the college and career readiness standard of scoring at Performance Level 3 and fully meeting the Common Core expectations on the Regents Exams in English Language Arts. This far surpasses the 75% benchmark.
Percent Achieving at Least Performance Level 3 on Common Core exam among Students
Who Were Not Proficient in the 8th Grade by Fourth Year Accountability Cohort 19
Cohort Designation
Number in Cohort
Percent Achieving Level 3 on Regents English Exam
2012 N/A N/A
2013 N/A N/A
2014 30 100%
ADDITIONAL EVIDENCE
n/a
19 Based on the highest score for each student on the English Regents exam

2017-18 ACCOUNTABILITY PLAN PROGRESS REPORT
Leadership Prep Ocean Hill Charter School 2017-18 Accountability Plan Progress Report Page 41 of 73
SUMMARY OF THE HIGH SCHOOL ENGLISH LANGUAGE ARTS GOAL 20
The 2014 Graduating Cohort achieved and surpassed the English Language Arts goals. Approximately 86% of the 2014 cohort has scored a Level 4 on the Regents Exam in English Language Arts, and 100% of students scored at least a Level 3 on the exam. Regarding both measurements, the 2014 cohort surpassed the necessary benchmark.
Additionally, among the students in the 2014 Graduating Cohort who did not achieve a proficient score in their 8th grade New York State English Language Arts exams, 80% achieved at least a Level 4 score and 100% achieved at least a level 3 score on their English Language Arts Regents Exams.
Though the State Measure of the Interim Progress is not available, the 2014 Cohort has a Performance Index of 243.5 out of 250. At the time of this report, data is not available to provide information regarding the comparative measures of the 2014 cohort at Uncommon Preparatory Charter High School and the district. However, in both cases, the 2014 cohort has high passage rates for both the Level 3 and Level 4 score on the Regents Exam in English Language Arts.
Type Measure Outcome
Absolute
Each year, 65 percent of students in the high school Accountability Cohort will meet or exceed Common Core expectations (currently scoring at or above Performance Level 4 on the Regents Exam in English Language Arts (Common Core)) by the completion of their fourth year in the cohort.
Achieved
Absolute
Each year, 80 percent of students in the high school Accountability Cohort will at least partially meet Common Core expectations (currently scoring at or above Performance Level 3 on the Regents Exam in English Language Arts (Common Core)) by the completion of their fourth year in the cohort.
Achieved
Absolute
Each year, the Performance Index (PI) on the Regents English exam of students completing their fourth year in the Accountability Cohort will meet the state Measure of Interim Progress (MIP) set forth in the state’s ESSA accountability system.
Data Not Available
Comparative
Each year, the percentage of students in the Total Cohort meeting or exceeding Common Core expectations on the Regents Exam in English Language Arts (Common Core) will exceed the percentage of comparable students from the district meeting or exceeding Common Core expectations.
Data Not Available
Comparative
Each year, the percentage of students in the Total Cohort partially meeting Common Core expectations on the Regents Exam in English Language Arts (Common Core) will exceed the percentage of comparable students in the district at least partially meeting Common Core expectations.
Data Not Available
Comparative
Each year, the Performance Index (PI) in Regents English of students in the fourth year of their high school Accountability Cohort will exceed that of comparable students from the school district of comparison. (Using 2016-17 school district results.)
Data Not Available
Growth
Each year, 50 percent of students in the high school Accountability Cohort who did not score proficient on their New York State 8th grade English language arts exam will meet or exceed Common Core expectations (currently scoring at or above Performance Level 4 on the Regents Exam in English Language Arts (Common Core)) by the completion of their fourth year in the cohort.
Achieved
20 If the school includes a middle school component, add these measures to the subject area goal for the younger grades.

2017-18 ACCOUNTABILITY PLAN PROGRESS REPORT
Leadership Prep Ocean Hill Charter School 2017-18 Accountability Plan Progress Report Page 42 of 73
Growth
Each year, 75 percent of students in the high school Accountability Cohort who did not score proficient on their New York State 8th grade English language arts exam will at least partially meet Common Core expectations (currently scoring at least Performance Level 3 on the Regents Exam in English Language Arts (Common Core)) by the completion of their fourth year in the cohort.
Achieved
ACTION PLAN
• Students will continue to receive 60-120 minutes of English instruction each day.
• The high school instructional leadership team will continue to review teacher lesson plans, observe classroom instruction and provide feedback on instruction.
• The school’s leadership team will be responsible for identifying areas for growth and providing an extensive professional development program that meets the needs of both the school and individual teachers.
• The school’s leadership team will continue to review the effectiveness of the school’s curriculum and make necessary revisions to increase student achievement.
• School leaders will continue to work with master teachers at the school to research and develop curriculum modifications that will ensure increased levels of student achievement and will continuously monitor the effectiveness of those modifications.
• Uncommon Preparatory Charter High School Charter School will continue to offer Regents/AP/SAT preparation beginning in the 9th grade and continuing through all four grades
• Uncommon Preparatory Charter High School will continue to provide professional development before the school year, during the school year, and following the school year, during which teachers can review and discuss results.

2017-18 ACCOUNTABILITY PLAN PROGRESS REPORT
Leadership Prep Ocean Hill Charter School 2017-18 Accountability Plan Progress Report Page 43 of 73
GOAL 4: MATHEMATICS
Goal 4: Mathematics
Students will demonstrate competency in the understanding and application of mathematical computation and problem solving.
BACKGROUND
Leadership Prep Ocean Hill employs a rigorous, fast paced math program that is designed to carry all students through a minimum of one year of high school algebra by the time they complete eighth grade.
Previously, Leadership Prep Ocean Hill used the Saxon Math program. However, in the fall of 2012, the school moved away from Saxon towards implementing teacher-created math lessons which utilize the Investigations math curriculum. Leadership Prep Ocean Hill made this change in curriculum to increase the rigor of instruction and to incorporate Common Core.
Investigations is a curriculum that allows scholars to deep dive into mathematical conceptual understanding. Through the use of cognitively guided instruction children have the opportunity to explore using a variety of different strategies. Some of these strategies are:
• Base tens
• Pictures
• Algorithms
The Investigations curriculum allows students to draw upon their own knowledge and understanding to experiment with strategies that further their mathematical conceptual understanding.
Scholars at Leadership Prep receive 60-90 minutes of math instruction each day. The math program in K-2 includes a 20 minute Math Meeting which begins each day as well as a lesson and practice for 60 minutes. The math program in Grade 3 includes independent opening math routines as well as a lesson for 55 minutes. The math program in Grades 5 through 8 includes an independent practice section as well as 90 minutes of math instruction. The Middle Academy also provides a monthly “Mathletes” challenge, providing additional independent math practice for students.
Leadership Prep’s math curriculum uses various methodologies and approaches to move students towards competency in the understanding and application of mathematical computation and problem solving. The school is committed to meeting its accountability plan goals related to mathematics as listed below:
Goal 4: Absolute Measure
Each year, 75 percent of all tested students enrolled in at least their second year will perform at proficiency on the New York State mathematics examination for grades 3-8.

2017-18 ACCOUNTABILITY PLAN PROGRESS REPORT
Leadership Prep Ocean Hill Charter School 2017-18 Accountability Plan Progress Report Page 44 of 73
METHOD
The school administered the New York State Testing Program mathematics assessment to students in grades 3 through 8 in April 2018. Each student’s raw score has been converted to a grade-specific scaled score and a performance level.
The table below summarizes participation information for this year’s test administration. The table indicates total enrollment and total number of students tested. It also provides a detailed breakdown of those students excluded from the exam. Note that this table includes all students according to grade level, even if they have not enrolled in at least their second year.
2017-18 State Mathematics Exam Number of Students Tested and Not Tested
Grade
Total Tested
Not Tested21 Total Enrolled IEP ELL Absent Refused
3 88 0 0 0 0 88
4 87 0 0 0 0 87
5 89 0 0 3 0 92
6 83 0 0 2 0 85
7 77 0 0 0 0 77
8 0 0 0 0 0 0
All 424 0 0 5 0 429
RESULTS AND EVALUATION
In its sixth year taking the NYS Math Exam, Leadership Prep Ocean Hill exceeded the absolute measure by 4 percentage points with 79% of students in at least their second year achieving proficiency. Additionally, 80% of all tested students achieved proficiency.
Performance on 2017-18 State Mathematics Exam By All Students and Students Enrolled in At Least Their Second Year
Grades
All Students Enrolled in at least their
Second Year
Percent Proficient
Number Tested
Percent Proficient
Number Tested
3 89% 88 90% 84
4 89% 87 90% 79
5 67% 89 68% 81
6 71% 83 70% 77
7 79% 77 76% 75
8 N/A N/A N/A N/A
All 80% 424 79% 396
21 Students exempted from this exam according to their Individualized Education Program (IEP), because of English Language Learners (ELL) status, or absence for at least some part of the exam.

2017-18 ACCOUNTABILITY PLAN PROGRESS REPORT
Leadership Prep Ocean Hill Charter School 2017-18 Accountability Plan Progress Report Page 45 of 73
ADDITIONAL EVIDENCE
Mathematics Performance by Grade Level and School Year
Grade
Percent of Students Enrolled in At Least Their Second Year Achieving Proficiency
2015-16 2016-17 2017-18
Percent Number Tested
Percent Number Tested
Percent Number Tested
3 99% 78 99% 80 90% 84
4 94% 83 91% 82 90% 79
5 62% 81 73% 79 68% 81
6 65% 72 63% 88 70% 77
7 81% 68 61% 75 76% 75
8 N/A N/A N/A N/A N/A N/A
All 80% 382 77% 404 79% 396
Goal 4: Absolute Measure
Each year, the school’s aggregate Performance Index (“PI”) on the state mathematics exam will meet that year’s state Measure of Interim Progress (“MIP”) set forth in the state’s ESSA accountability system.
METHOD
In New York State, ESSA school performance goals are met by showing that an absolute proportion of a school's students who have taken the mathematics test have scored at the partially proficient, or proficient and advanced performance levels (Levels 2 or 3 & 4). The percentage of students at each of these three levels is used to calculate a PI and determine if the school has met the MIP set each year by the state’s ESSA accountability system. To achieve this measure, all tested students must have a PI value that equals or exceeds the state’s 2017-18 mathematics MIP for all students. The state plans to calculate and disseminate the MIP in summer 2018. The PI is the sum of the percent of students in all tested grades combined scoring at Level 2, plus two times the percent of students scoring at Level 3, plus two-and-a-half times the percent of students scoring at Level 4. Thus, the highest possible PI is 250.
RESULTS AND EVALUATION
Leadership Prep Ocean Hill scored 157 197 on the Math Performance Index. The MIP for NY State has not yet been released at the time of this report. Therefore, Leadership Prep Ocean Hill cannot report if this measure was achieved.
Mathematics 2017-18 Performance Level Index (PI)
Number in Cohort
Percent of Students at Each Performance Level
Level 1 Level 2 Level 3 Level 4
7 14 34 46

2017-18 ACCOUNTABILITY PLAN PROGRESS REPORT
Leadership Prep Ocean Hill Charter School 2017-18 Accountability Plan Progress Report Page 46 of 73
PI = 14 + 34 + 46 = 94 34 +
+ 46
(.5)*46 = =
80 23
PI = 197
Goal 4: Comparative Measure
Each year, the percent of all tested students who are enrolled in at least their second year and performing at proficiency on the state mathematics exam will be greater than that of all students in the same tested grades in the school district of comparison.
METHOD
A school compares the performance of tested students enrolled in at least their second year to that of all tested students in the public school district of comparison. Comparisons are between the results for each grade in which the school had tested students in at least their second year at the school and the total result for all students at the corresponding grades in the school district.22
RESULTS AND EVALUATION
Leadership Prep Ocean Hill students outperformed their peers in District 23 in Math as a whole school. Specifically, 79% of Leadership Prep Ocean Hill students in at least their second year at the school scored proficient, outperforming their peers in CSD 23 by 58 percentage points. Leadership Prep Ocean Hill exceeded the comparative measure.
2017-18 State Mathematics Exam Charter School and District Performance by Grade Level
Grade
Percent of Students at or Above Proficiency
Charter School Students In At Least 2nd Year
All District Students
Percent Number Tested
Percent Number Tested
3 90% 84 29% 740
4 90% 79 22% 734
5 68% 81 17% 694
6 70% 77 20% 812
7 76% 75 18% 818
8 N/A N/A 18% 707
All 79% 396 21% 4,505
ADDITIONAL EVIDENCE
22 Schools can acquire these data when the New York State Education Department releases its database containing grade level ELA and math test results for all schools and districts statewide. The NYSED announces the release of the data on its News Release webpage.

2017-18 ACCOUNTABILITY PLAN PROGRESS REPORT
Leadership Prep Ocean Hill Charter School 2017-18 Accountability Plan Progress Report Page 47 of 73
Mathematics Performance of Charter School and Local District by Grade Level and School Year
Grade
Percent of Students Enrolled in at Least their Second Year Who Are at Proficiency Compared to Local District Students
2015-16 2016-17 2017-18
Charter School
District Charter School
District Charter School
District
3 99% 22% 99% 23% 90% 29%
4 94% 17% 91% 12% 90% 22%
5 62% 10% 73% 19% 68% 17%
6 65% 16% 63% 12% 70% 20%
7 81% 16% 61% 15% 76% 18%
8 N/A 10% N/A 11% N/A 18%
All 80% 15% 77% 15% 79% 21%
Goal 4: Comparative Measure
Each year, the school will exceed its predicted level of performance on the state mathematics exam
by an Effect Size of 0.3 or above (performing higher than expected to a meaningful degree) according to a regression analysis controlling for economically disadvantaged students among all public schools in New York State.
METHOD
The Institute conducts a Comparative Performance Analysis, which compares the school’s performance to that of demographically similar public schools statewide. The Institute uses a regression analysis to control for the percentage of economically disadvantaged students among all public schools in New York State. The Institute compares the school’s actual performance to the predicted performance of public schools with a similar concentration of economically disadvantaged students. The difference between the school’s actual and predicted performance, relative to other schools with similar economically disadvantaged statistics, produces an Effect Size. An Effect Size of 0.3, or performing higher than expected to a meaningful degree, is the requirement for achieving this measure.
Given the timing of the state’s release of economically disadvantaged data and the demands of the data analysis, the 2017-18 analysis is not yet available. This report contains 2016-17 results, the most recent Comparative Performance Analysis available.
RESULTS AND EVALUATION
Leadership Prep Ocean Hill exceeded the Effect Size of 0.3, with an effect size of 2.37.

2017-18 ACCOUNTABILITY PLAN PROGRESS REPORT
Leadership Prep Ocean Hill Charter School 2017-18 Accountability Plan Progress Report Page 48 of 73
2016-17 Mathematics Comparative Performance by Grade Level
Grade Percent
Economically Disadvantaged
Number Tested
Percent of Students at Levels 3&4
Difference between Actual and Predicted
Effect Size
Actual Predicted
3 82.4 87 99 37.6 61.4 2.91
4 80.0 87 92 31.6 60.4 3.06
5 82.8 85 72 29.5 42.5 2.30
6 73.3 89 63 30.4 32.6 1.63
7 79.5 82 63 23.9 39.1 1.91
8
All 79.6 430 77.9 30.7 47.3 2.37
School’s Overall Comparative Performance:
Higher than expected to a large degree
ADDITIONAL EVIDENCE
Mathematics Comparative Performance by School Year
School Year
Grades Percent
Economically Disadvantaged
Number Tested
Actual Predicted Effect Size
2014-15 4 82.2 327 77.7 28.4 2.64
2015-16 5 83.0 421 77.7 27.9 2.46
2016-17 5 79.6 430 77.9 30.7 2.37
In addition, the school administered the NYS Common Core Algebra Regents in Grade 8 in lieu of the 8th grade State Math exam following guidance from NYSED which allowed students to forego the 8th grade math exam if they took the Regents instead. 80% of our 8th graders tested passed. We feel this shows that every year we have with the Common Core curriculum will only make our teachers and cohorts stronger. Additionally, we feel that the Regents results are representative of the strong mathematics instruction students are receiving to help prepare them for college as they are taking these Regents exams in 8th grade instead of waiting for high school, which is typical of many students in New York State.
Cohort Designation
Number in Cohort
Percent Passing
2014 N/A N/A
2015 N/A N/A
2016 73 95%
2017 85 80%

2017-18 ACCOUNTABILITY PLAN PROGRESS REPORT
Leadership Prep Ocean Hill Charter School 2017-18 Accountability Plan Progress Report Page 49 of 73
Goal 4: Growth Measure23
Each year, under the state’s Growth Model, the school’s mean unadjusted growth percentile in mathematics for all tested students in grades 4-8 will be above the target of 50.
METHOD
This measure examines the change in performance of the same group of students from one year to the next and the progress they are making in comparison to other students with the same score in the previous year. The analysis only includes students who took the state exam in 2016-17 and also have a state exam score in 2015-16 including students who were retained in the same grade. Students with the same 2015-16 scores are ranked by their 2016-17 scores and assigned a percentile based on their relative growth in performance (student growth percentile). Students’ growth percentiles are aggregated school-wide to yield a school’s mean growth percentile. In order for a school to meet the measure, the school would have to achieve a mean growth percentile above the target of 50.
Given the timing of the state’s release of Growth Model data, the 2017-18 analysis is not yet available. This report contains 2016-17 results, the most recent Growth Model data available.24
RESULTS AND EVALUATION
Leadership Prep Ocean Hill exceeded this measure in Grade 7. However, in Grades 4, 5, and 6, Leadership Prep Ocean Hill fell short in this measure.
2016-17 Mathematics Mean Growth Percentile by Grade Level
Grade Mean Growth Percentile
School Target
4 36.9 50.0
5 18.5 50.0
6 46.7 50.0
7 60.1 50.0
8
All 40.1 50.0
ADDITIONAL EVIDENCE
Mathematics Mean Growth Percentile by Grade Level and School Year
Grade Mean Growth Percentile
2014-15 2015-16 2016-17 Target
4 48.3 32.1 36.9 50.0
5 27.2 14.9 18.5 50.0
6 75.2 49.8 46.7 50.0
23 See Guidelines for Creating a SUNY Accountability Plan for an explanation.
24 Schools can acquire these data from the NYSED’s business portal: portal.nysed.gov.
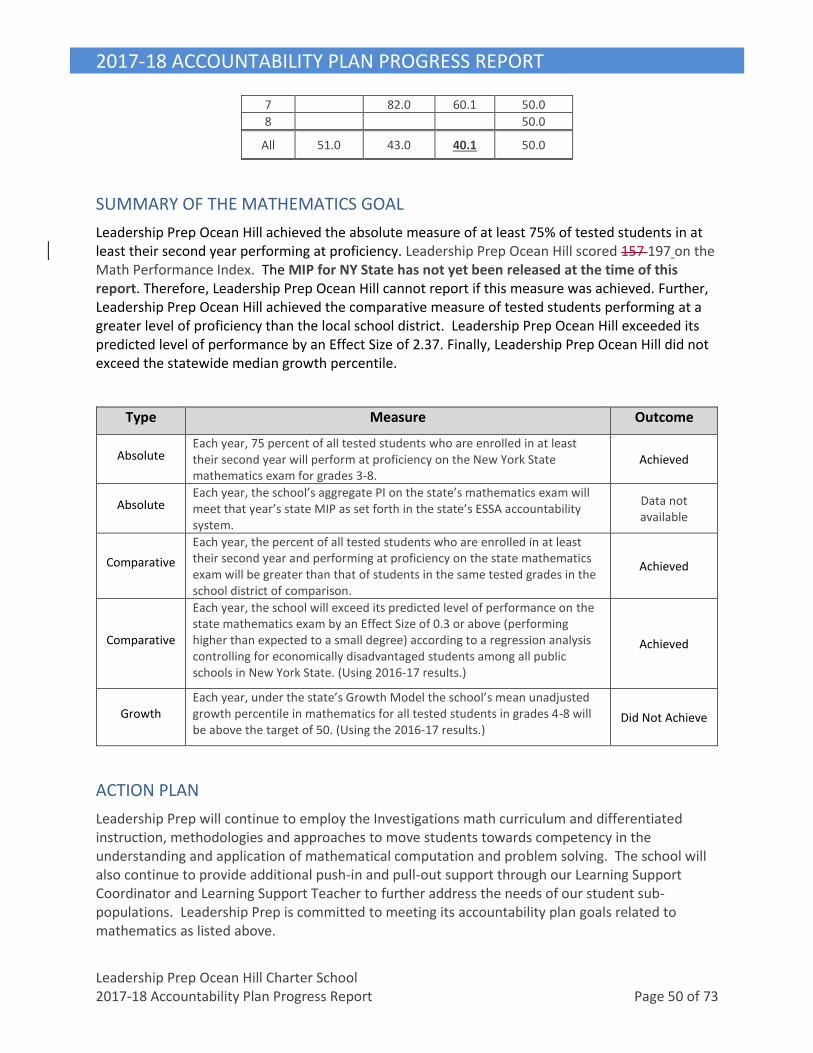
2017-18 ACCOUNTABILITY PLAN PROGRESS REPORT
Leadership Prep Ocean Hill Charter School 2017-18 Accountability Plan Progress Report Page 50 of 73
7 82.0 60.1 50.0
8 50.0
All 51.0 43.0 40.1 50.0
SUMMARY OF THE MATHEMATICS GOAL
Leadership Prep Ocean Hill achieved the absolute measure of at least 75% of tested students in at least their second year performing at proficiency. Leadership Prep Ocean Hill scored 157 197 on the Math Performance Index. The MIP for NY State has not yet been released at the time of this report. Therefore, Leadership Prep Ocean Hill cannot report if this measure was achieved. Further, Leadership Prep Ocean Hill achieved the comparative measure of tested students performing at a greater level of proficiency than the local school district. Leadership Prep Ocean Hill exceeded its predicted level of performance by an Effect Size of 2.37. Finally, Leadership Prep Ocean Hill did not exceed the statewide median growth percentile.
Type Measure Outcome
Absolute Each year, 75 percent of all tested students who are enrolled in at least their second year will perform at proficiency on the New York State mathematics exam for grades 3-8.
Achieved
Absolute Each year, the school’s aggregate PI on the state’s mathematics exam will meet that year’s state MIP as set forth in the state’s ESSA accountability system.
Data not available
Comparative
Each year, the percent of all tested students who are enrolled in at least their second year and performing at proficiency on the state mathematics exam will be greater than that of students in the same tested grades in the school district of comparison.
Achieved
Comparative
Each year, the school will exceed its predicted level of performance on the state mathematics exam by an Effect Size of 0.3 or above (performing higher than expected to a small degree) according to a regression analysis controlling for economically disadvantaged students among all public schools in New York State. (Using 2016-17 results.)
Achieved
Growth Each year, under the state’s Growth Model the school’s mean unadjusted growth percentile in mathematics for all tested students in grades 4-8 will be above the target of 50. (Using the 2016-17 results.)
Did Not Achieve
ACTION PLAN
Leadership Prep will continue to employ the Investigations math curriculum and differentiated instruction, methodologies and approaches to move students towards competency in the understanding and application of mathematical computation and problem solving. The school will also continue to provide additional push-in and pull-out support through our Learning Support Coordinator and Learning Support Teacher to further address the needs of our student sub-populations. Leadership Prep is committed to meeting its accountability plan goals related to mathematics as listed above.

2017-18 ACCOUNTABILITY PLAN PROGRESS REPORT
Leadership Prep Ocean Hill Charter School 2017-18 Accountability Plan Progress Report Page 51 of 73
As in ELA, as part of the Uncommon Schools network, Leadership Prep Ocean Hill will continue to make changes to its Math curriculum to be better prepared to address the increased rigor of the Common Core standards. Beginning two years ago, Leadership Prep Ocean Hill began to modify the schools’ existing curricula for Math, ensuring that those curricula are aligned to the Common Core Learning Standards. One significant change is reflected in Leadership Prep Ocean Hill’s switch from using Saxon to Math Investigations to address Common Core which will be rooted in conceptual math. Consequently, math lessons will continue to be adjusted so that the structure and the work students complete are aligned to Common Core standards. Math lessons are currently being revised so that student activities more closely align to the objective, and the independent practices are as rigorous as the lessons being taught to students. Scope and sequences are also being revised to ensure that math meeting in grades Kindergarten through 2nd grade, and fact practices in grades 3-7 are focused solely on reviewing difficult to master material throughout the school year.
Additionally, Interim Assessments will also continue to be redesigned ensuring that each Common Core Learning Standard is taught, assessed and ultimately mastered.

2017-18 ACCOUNTABILITY PLAN PROGRESS REPORT
Leadership Prep Ocean Hill Charter School 2017-18 Accountability Plan Progress Report Page 52 of 73
HIGH SCHOOL MATHEMATICS
Goal 4: Absolute Measure
Each year, 65 percent of students in the high school Accountability Cohort will exceed Common Core expectations (currently scoring at or above Performance Level 4 on a Regents mathematics exam) by the completion of their fourth year in the cohort.
METHOD
The school administered the Regents mathematics exam(s) that students must pass to graduate. The school scores Regents on a scale from 0 to 100. The State Education Department currently defines the college and career readiness standard as scoring at or above Performance Level 4 (meeting Common Core expectations) on any Regents Common Core mathematics exams.25 This measure examines the percent of the Accountability Cohort that achieved at least Performance Level 4 by the completion of their fourth year in the cohort.
RESULTS AND EVALUATION
Of the 2014 cohort, 43% of students have passed at Mathematics Regents at 80 or above by their fourth year. Uncommon Preparatory Charter High School did not meet this measure for its 2014 cohort.
Percent Scoring at Least Level 4 on a Regents Mathematics Common Core Exam
by Fourth Year Accountability Cohort26
Cohort Designation
Number in
Cohort
Percent Scoring at Least Level 4
2012 N/A N/A
2013 N/A N/A
2014 63 43%
ADDITIONAL EVIDENCE
The data indicates that the 2015 and 2016 cohorts at Uncommon Preparatory Charter High School is trailing behind the 2014 cohort regarding achieving at least a level 4 on a Regents Mathematics Exam. However, the 2017 Cohorts are outperforming the 2014, 2015, and 2016 cohorts.
Percent Achieving at Least Level 4 by Cohort and Year
Cohort Designation
2015-16 2016-17 2017-18
Number Percent Number Percent Number Percent
25 Students in the 2014 and 2015 high school Accountability Cohorts may have taken the non-Common Core mathematics exams. As such, for 2017-18 and 2018-19, the Institute will continue to count any student who achieved at least a scale score of 80 (the previous target for college and career readiness) on that exam as having met the target for this measure.
26 Based on the highest score for each student on a mathematics Regents exam

2017-18 ACCOUNTABILITY PLAN PROGRESS REPORT
Leadership Prep Ocean Hill Charter School 2017-18 Accountability Plan Progress Report Page 53 of 73
in Cohort Level 4 in Cohort Level 4 in Cohort Level 4
2014 64 44% 63 43%
2015 73 14% 70 14%
2016 96 39% 90 38%
2017 136 52%
Goal 4: Absolute Measure
Each year, 80 percent of students in the high school Accountability Cohort will at least partially meet Common Core expectations (currently scoring at or above Performance Level 3 on a Regents mathematics exam) by the completion of their fourth year in the cohort.
METHOD
The school administered the Regents mathematics exam(s) that students must pass to graduate. The school scores Regents on a scale from 0 to 100. The State Education Department currently defines the cut off for passing and meeting the requirement for graduation as scoring at or above Performance Level 3 (partially meeting Common Core expectations) on the Regents mathematics exams. This measure examines the percent of the Accountability Cohort that achieved at least Performance Level 3 by the completion of their fourth year in the cohort.
RESULTS AND EVALUATION
Of the 2014 Cohort at Uncommon Preparatory Charter High School, 100% of students have scored at or above Level 3 on a Regents Mathematics Exam. The 2014 cohort far exceeds the threshold for this benchmark.
Percent Scoring at Least Level 3 on a Regents Mathematics Common Core Exam
by Fourth Year Accountability Cohort27
Cohort Designation
Number in
Cohort
Percent Scoring at Least Level 3 on a Regents Mathematics Exam
2012 N/A N/A
2013 N/A N/A
2014 63 100%
ADDITIONAL EVIDENCE
Subsequent cohorts are also on track to meet or exceed this benchmark in future years.
Percent Achieving at Least Level 3 by Cohort and Year
Cohort Designation
2015-16 2016-17 2017-18
Number in Cohort
Percent Passing
Number in Cohort
Percent Passing
Number in Cohort
Percent Passing
2014 64 100% 63 100%
2015 73 96% 70 99%
2016 96 94% 90 97%
27 Based on the highest score for each student on a mathematics Regents exam

2017-18 ACCOUNTABILITY PLAN PROGRESS REPORT
Leadership Prep Ocean Hill Charter School 2017-18 Accountability Plan Progress Report Page 54 of 73
2017 136 89%
Goal 4: Absolute Measure
Each year, the Performance Index (“PI”) on the Regents mathematics exam of students completing their fourth year in the Accountability Cohort will meet the state’s Measure of Interim Progress (“MIP”) set forth in the state’s ESSA accountability system.
METHOD
The state’s finalized and approved ESSA plan in 2018 includes a revised calculation of the high school Performance Index. In it, schools now receive additional credit for students scoring at Accountability Level 4.28 To achieve this measure, all tested students in the Accountability Cohort must have a PI that equals or exceeds the state’s 2017-18 mathematics MIP for all students. The state plans to calculate and disseminate the MIP in summer 2018.
The Performance Index is calculated as such: (percent of students scoring at Accountability Level 2) + 2*(percent of students scoring at Accountability Level 3) + 2.5 * (percent of students scoring at Accountability Level 4). Thus, the highest possible PI is 250. The basis for the percent of students is the school’s fourth year Total Cohort for Graduation. Regents Common Core mathematics exams are scored on a scale from 0 to 100; 0 to 64 is Accountability Level 1, 65 to 79 is Accountability Level 2 (65 to 77 for Algebra II); 80 to 84 is Accountability Level 3 (78 to 84 for Algebra II), and 85 to 100 is Accountability Level 4.
RESULTS AND EVALUATION
The Performance Index for the Mathematics Regents exam for the 2014 Graduating Cohort is 221.5 out of the highest possible 250.
Mathematics Performance Index (PI)
For the 2014 High School Accountability Cohort
Number in Cohort
Percent of Students at Each Accountability Level
Level 1 Level 2 Level 3 Level 4
0 0 57% 43%
PI = 0 + 57 + 43 = 100 57 + 43 = 100 + (.5)*43 = 21.5 PI = 221.5
ADDITIONAL EVIDENCE
n/a
28 For more details on the score ranges used to determine Accountability Levels as distinguished from Performance Levels, see www.p12.nysed.gov/irs/sirs/documents/2017RegentsScoreRangesforAnnualandAccountabilityReporting.pdf

2017-18 ACCOUNTABILITY PLAN PROGRESS REPORT
Leadership Prep Ocean Hill Charter School 2017-18 Accountability Plan Progress Report Page 55 of 73
Goal 4: Comparative Measure
Each year, the percent of students in the high school Total Cohort meeting or exceeding Common Core expectations on a Regents mathematics exams will exceed the percentage of comparable students in the district meeting or exceeding Common Core expectations.
METHOD
The school compares the performance of students in their fourth year in the charter school Total Cohort to that of the respective Total Cohort of students in the school district of comparison. In order to meet or exceed Common Core expectations, a student must achieve Performance Level 4 or 5. Given that students may take Regents exam up through the summer of their fourth year, the school presents most recently available school district results.
RESULTS AND EVALUATION
At the time of this report, comparative graduation data for NYS Mathematics Regents has not yet been released. Uncommon Preparatory Charter High School will update this report when the data becomes available.
Percent Achieving Performance Level 4 or Higher on a Mathematics Regents
of Fourth-Year Accountability Cohorts by Charter School and School District
Cohort
Charter School School District
Percent Level 4 or 5
Number in Cohort
Percent Level 4 or 5
Number in Cohort
2012 N/A N/A N/A N/A
2013 N/A N/A N/A N/A
2014 43% 63
Data Not Available
Data Not Available
ADDITIONAL EVIDENCE
n/a

2017-18 ACCOUNTABILITY PLAN PROGRESS REPORT
Leadership Prep Ocean Hill Charter School 2017-18 Accountability Plan Progress Report Page 56 of 73
Goal 4: Comparative Measure
Each year, the percent of students in the high school Total Cohort at least partially meeting Common Core expectations on a Regents mathematics exams will exceed the percentage of comparable students in the district at least partially meeting Common Core expectations.
METHOD
The school compares the performance of students in their fourth year in the charter school Total Cohort to that of the respective Total Cohort of students in the school district of comparison. In order to at least partially meet Common Core expectations, a student would need to pass the exam and score at Performance Level 3 or higher (i.e. scoring at least 65).Given that students may take Regents exam up through the summer of their fourth year, the school presents most recently available school district results.
RESULTS AND EVALUATION
At the time of this report, comparative graduation data for NYS Mathematics Regents has not yet been released. Uncommon Preparatory Charter High School will update this report when the data becomes available.
Percent Achieving Performance Level 3 or Higher on a Mathematics Regents
of Fourth-Year Accountability Cohorts by Charter School and School District
Cohort
Charter School School District
Percent Level 3 or
Higher
Number in Cohort
Percent Level 3 or
Higher
Number in Cohort
2012 N/A N/A N/A N/A
2013 N/A N/A N/A N/A
2014 100% 63
Data Not Available
Data Not Available
ADDITIONAL EVIDENCE
n/a

2017-18 ACCOUNTABILITY PLAN PROGRESS REPORT
Leadership Prep Ocean Hill Charter School 2017-18 Accountability Plan Progress Report Page 57 of 73
Goal 4: Comparative Measure
Each year, the Performance Index (“PI”) in Regents mathematics of students in the fourth year of their high school Accountability Cohort will exceed that of comparable students from the school district of comparison.
METHOD
The school compares the performance of students in their fourth year in the charter school Accountability Cohort to that of the respective cohort of students in the school district of comparison. Given that students may take Regents exam up through the summer of their fourth year, the school presents most recently available school district results.
RESULTS AND EVALUATION
At the time of this report, comparative graduation data for NYS Mathematics Regents has not yet been released. Uncommon Preparatory Charter High School will update this report when the data becomes available.
Mathematics Regents Performance Index (PI)29
of Fourth-Year Accountability Cohorts by Charter School and School District
Cohort
Charter School School District
PI Cohort
Size PI
Cohort Size
2012 N/A N/A N/A N/A
2013 N/A N/A N/A N/A
2014 221.5 63
Data Not Available
Data Not Available
ADDITIONAL EVIDENCE
n/a
29 For an explanation of the procedure to calculate the school’s PI, see page 46.

2017-18 ACCOUNTABILITY PLAN PROGRESS REPORT
Leadership Prep Ocean Hill Charter School 2017-18 Accountability Plan Progress Report Page 58 of 73
Goal 4: Growth Measure
Each year, 50 percent of students in the high school Accountability Cohort who did not score proficient on their New York State 8th grade mathematics exam will meet the college and career readiness standard (currently scoring at Performance Level 4 and fully meeting Common Core expectations on a Regents mathematics exam) by the completion of their fourth year in the cohort.
METHOD
The school demonstrates the effectiveness of its mathematics program by enabling students who were not meeting proficiency standards in the eighth grade to grow to meeting the mathematics requirement for the college and career readiness standard.
RESULTS AND EVALUATION
Of the 11 students in the 2014 cohort who did not score proficient on their New York State 8th grade mathematics exam, 73% of students achieved a level 4 on a Regents Mathematics exam. The 2014 cohort far exceeded the benchmark goal of 50%.
Percent Achieving at Least Performance Level 4 on a Mathematics Regents Exam among Students
Who Were Not Proficient in the 8th Grade by Fourth Year Accountability Cohort 30
Cohort Designation
Number in Cohort
Percent Achieving Level 4 on Common Core Exam
2012 N/A N/A
2013 N/A N/A
2014 11 73%
ADDITIONAL EVIDENCE
n/a
30 Based on the highest score for each student on the English Regents exam

2017-18 ACCOUNTABILITY PLAN PROGRESS REPORT
Leadership Prep Ocean Hill Charter School 2017-18 Accountability Plan Progress Report Page 59 of 73
Goal 4: Growth Measure
Each year, 75 percent of students in the high school Accountability Cohort who did not score proficient on their New York State 8th grade mathematics exam will at least partially meet Common Core expectations (currently scoring at Performance Level 3 on a Regents mathematics exam) by the completion of their fourth year in the cohort.
METHOD
The school demonstrates the effectiveness of its mathematics program by enabling students who were not meeting proficiency standards in the eighth grade to move to meeting the English requirement for graduation.
RESULTS AND EVALUATION
Of the 11 students in the 2014 cohort who did not score proficient on their New York State 8th grade mathematics exam, 100% of students achieved a level 3 on a Regents Mathematics exam. The 2014 cohort far exceeded the benchmark goal of 75%.
Percent Achieving at Least Performance Level 3 on a Mathematics Regents Exam among Students
Who Were Not Proficient in the 8th Grade by Fourth Year Accountability Cohort 31
Cohort Designation
Number in Cohort
Percent Achieving Level 3
2012 N/A N/A
2013 N/A N/A
2014 11 100%
ADDITIONAL EVIDENCE
n/a
SUMMARY OF THE HIGH SCHOOL MATHEMATICS GOAL 32
The 2014 cohort of Uncommon Preparatory Charter High School met and exceeded all but one of the mathematics goals (the first goal of 65% of the cohort scoring a Level 4 or higher on a Common Core math exam). We believe that this is due to a selection bias – because this cohort was the last cohort who was able to take the non-Common Core Algebra I and Geometry Regents exams, the only students who took the Common Core exams were students who did not pass that exam. Therefore, the percentage of students at a Level 4 is artificially low. We believe this data will improve significantly in the coming years.
Type Measure Outcome
Absolute Each year, 65 percent of students in the high school Accountability Cohort Did Not Achieve
31 Based on the highest score for each student on the mathematics Regents exam
32 If the school includes a middle school component, add these measures to the subject area goal for the younger grades.
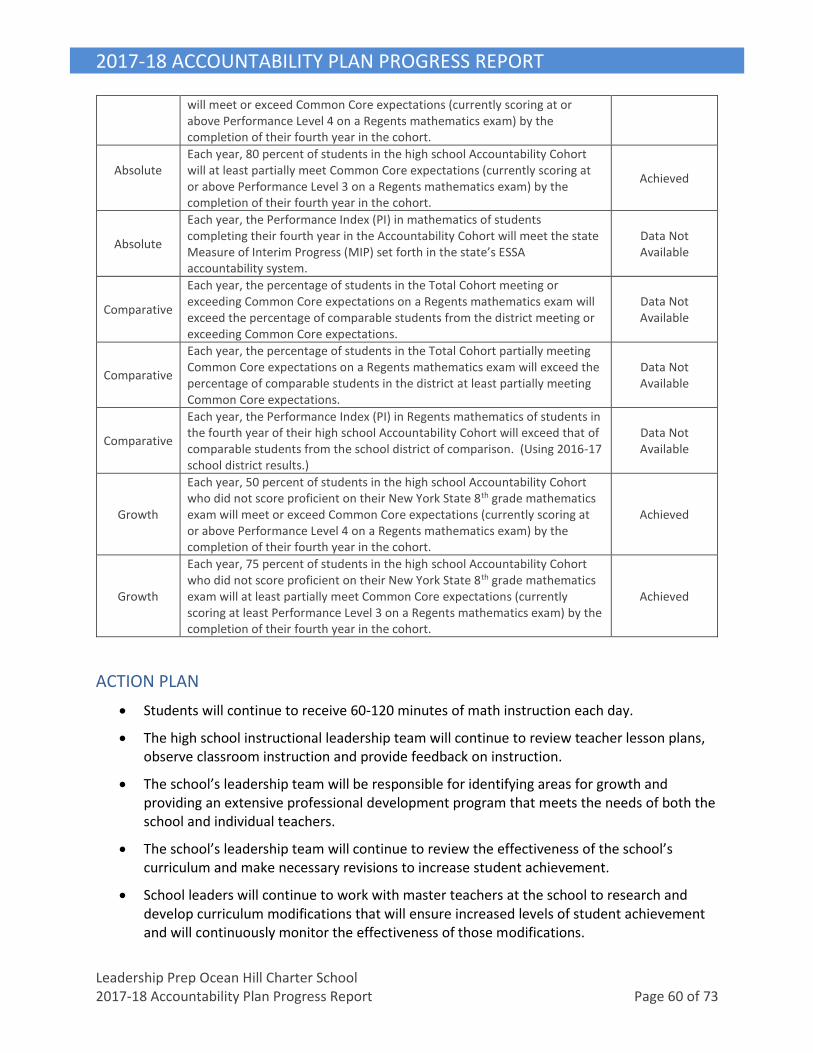
2017-18 ACCOUNTABILITY PLAN PROGRESS REPORT
Leadership Prep Ocean Hill Charter School 2017-18 Accountability Plan Progress Report Page 60 of 73
will meet or exceed Common Core expectations (currently scoring at or above Performance Level 4 on a Regents mathematics exam) by the completion of their fourth year in the cohort.
Absolute
Each year, 80 percent of students in the high school Accountability Cohort will at least partially meet Common Core expectations (currently scoring at or above Performance Level 3 on a Regents mathematics exam) by the completion of their fourth year in the cohort.
Achieved
Absolute
Each year, the Performance Index (PI) in mathematics of students completing their fourth year in the Accountability Cohort will meet the state Measure of Interim Progress (MIP) set forth in the state’s ESSA accountability system.
Data Not Available
Comparative
Each year, the percentage of students in the Total Cohort meeting or exceeding Common Core expectations on a Regents mathematics exam will exceed the percentage of comparable students from the district meeting or exceeding Common Core expectations.
Data Not Available
Comparative
Each year, the percentage of students in the Total Cohort partially meeting Common Core expectations on a Regents mathematics exam will exceed the percentage of comparable students in the district at least partially meeting Common Core expectations.
Data Not Available
Comparative
Each year, the Performance Index (PI) in Regents mathematics of students in the fourth year of their high school Accountability Cohort will exceed that of comparable students from the school district of comparison. (Using 2016-17 school district results.)
Data Not Available
Growth
Each year, 50 percent of students in the high school Accountability Cohort who did not score proficient on their New York State 8th grade mathematics exam will meet or exceed Common Core expectations (currently scoring at or above Performance Level 4 on a Regents mathematics exam) by the completion of their fourth year in the cohort.
Achieved
Growth
Each year, 75 percent of students in the high school Accountability Cohort who did not score proficient on their New York State 8th grade mathematics exam will at least partially meet Common Core expectations (currently scoring at least Performance Level 3 on a Regents mathematics exam) by the completion of their fourth year in the cohort.
Achieved
ACTION PLAN
• Students will continue to receive 60-120 minutes of math instruction each day.
• The high school instructional leadership team will continue to review teacher lesson plans, observe classroom instruction and provide feedback on instruction.
• The school’s leadership team will be responsible for identifying areas for growth and providing an extensive professional development program that meets the needs of both the school and individual teachers.
• The school’s leadership team will continue to review the effectiveness of the school’s curriculum and make necessary revisions to increase student achievement.
• School leaders will continue to work with master teachers at the school to research and develop curriculum modifications that will ensure increased levels of student achievement and will continuously monitor the effectiveness of those modifications.

2017-18 ACCOUNTABILITY PLAN PROGRESS REPORT
Leadership Prep Ocean Hill Charter School 2017-18 Accountability Plan Progress Report Page 61 of 73
• Uncommon Preparatory Charter High School Charter School will continue to offer Regents/AP/SAT preparation beginning in the 9th grade.
• Uncommon Preparatory Charter High School Charter School will continue to provide professional development before the school year, during the school year, and following the school year, during which teachers can review and discuss results.
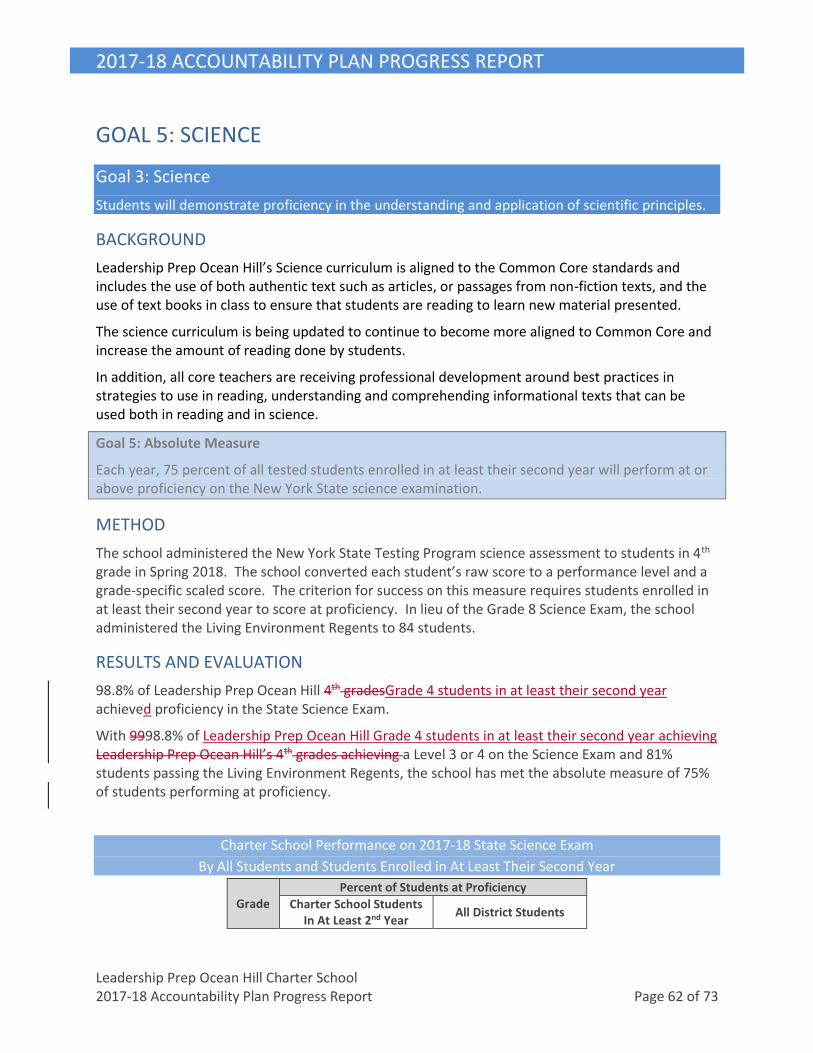
2017-18 ACCOUNTABILITY PLAN PROGRESS REPORT
Leadership Prep Ocean Hill Charter School 2017-18 Accountability Plan Progress Report Page 62 of 73
GOAL 5: SCIENCE
Goal 3: Science
Students will demonstrate proficiency in the understanding and application of scientific principles.
BACKGROUND
Leadership Prep Ocean Hill’s Science curriculum is aligned to the Common Core standards and includes the use of both authentic text such as articles, or passages from non-fiction texts, and the use of text books in class to ensure that students are reading to learn new material presented.
The science curriculum is being updated to continue to become more aligned to Common Core and increase the amount of reading done by students.
In addition, all core teachers are receiving professional development around best practices in strategies to use in reading, understanding and comprehending informational texts that can be used both in reading and in science.
Goal 5: Absolute Measure
Each year, 75 percent of all tested students enrolled in at least their second year will perform at or above proficiency on the New York State science examination.
METHOD
The school administered the New York State Testing Program science assessment to students in 4th grade in Spring 2018. The school converted each student’s raw score to a performance level and a grade-specific scaled score. The criterion for success on this measure requires students enrolled in at least their second year to score at proficiency. In lieu of the Grade 8 Science Exam, the school administered the Living Environment Regents to 84 students.
RESULTS AND EVALUATION
98.8% of Leadership Prep Ocean Hill 4th gradesGrade 4 students in at least their second year achieved proficiency in the State Science Exam.
With 9998.8% of Leadership Prep Ocean Hill Grade 4 students in at least their second year achieving Leadership Prep Ocean Hill’s 4th grades achieving a Level 3 or 4 on the Science Exam and 81% students passing the Living Environment Regents, the school has met the absolute measure of 75% of students performing at proficiency.
Charter School Performance on 2017-18 State Science Exam
By All Students and Students Enrolled in At Least Their Second Year
Grade Percent of Students at Proficiency
Charter School Students In At Least 2nd Year
All District Students

2017-18 ACCOUNTABILITY PLAN PROGRESS REPORT
Leadership Prep Ocean Hill Charter School 2017-18 Accountability Plan Progress Report Page 63 of 73
Percent Proficient
Number Tested
Percent Proficient
Number Tested
4 98.8% 80
8 81% 77
All 90% 157
ADDITIONAL EVIDENCE
Science Performance by Grade Level and School Year
Grade
Percent of Students Enrolled in At Least Their Second Year at Proficiency
2015-16 2016-17 2017-18
Percent Proficient
Number Tested
Percent Number Tested
Percent Proficient
Number Tested
4 99% 83 97.5% 82 98.8% 80
8 N/A N/A 72% 68 81% 77
All 99% 83 86% 150 90% 157
Goal 5: Comparative Measure
Each year, the percent of all tested students enrolled in at least their second year and performing at proficiency on the state science exam will be greater than that of all students in the same tested grades in the school district of comparison.
METHOD
The school compares tested students enrolled in at least their second year to all tested students in the public school district of comparison. Comparisons are between the results for each grade in which the school had tested students in at least their second year and the results for the respective grades in the school district of comparison. Given the timing of the state’s release of district science data, the 2017-18 comparative data is not yet available. Schools should report comparison to the district’s 2016-17 data.
RESULTS AND EVALUATION
District results from the Science Exam are not yet available. Leadership Prep Ocean Hill will update the following chart when the scores are released.
When test scores become available, Leadership Prep Ocean Hill will be able to evaluate the school’s performance on this measure.
2017-18 State Science Exam
Charter School and District Performance by Grade Level
Grade Percent of Students at Proficiency

2017-18 ACCOUNTABILITY PLAN PROGRESS REPORT
Leadership Prep Ocean Hill Charter School 2017-18 Accountability Plan Progress Report Page 64 of 73
Charter School Students In At Least 2nd Year
All District Students33
Percent Proficient
Number Tested
Percent Proficient
Number Tested
4 98.8% 80
8 81% 77
All 90% 157
ADDITIONAL EVIDENCE
20152017-16 18 was the school’s third fifth year administering the NYS Science exam, although there is not yet data to establish a significant trend, we have maintained a 99%98.8% proficiency level.
Science Performance of Charter School and Local District by Grade Level and School Year
Grade
Percent of Charter School Students at Proficiency and Enrolled in At Least their Second Year Compared to Local District Students
2015-16 2016-17 2017-18
Charter School
District Charter School
District Charter School
District
4 99% 97.5% 98.8%
8 N/A 72% 81%
All 99% 86% 90%
SUMMARY OF THE SCIENCE GOAL
In our second year of Science testing, Leadership Prep Ocean Hill met the absolute goal with well over 75% of 4th grade students achieving proficiency. Leadership Prep will update this report with comparative results once district data are available.
Type Measure Outcome
Absolute Each year, 75 percent of all tested students enrolled in at least their second year will perform at or above proficiency on the New York State examination.
Achieved
Comparative
Each year, the percent of all tested students enrolled in at least their second year and performing at proficiency on the state exam will be greater than that of all students in the same tested grades in the school district of comparison.
Data Not Available
ACTION PLAN
Building upon the results achieved this year, Leadership Prep Ocean Hill will continue to make modifications to the school’s existing curriculum for Science and History, ensuring that those
33 This table uses the prior year’s results as 2017-18 district science scores are not yet available.

2017-18 ACCOUNTABILITY PLAN PROGRESS REPORT
Leadership Prep Ocean Hill Charter School 2017-18 Accountability Plan Progress Report Page 65 of 73
curricula are aligned to the Common Core Learning Standards for Literacy in History/Social Studies and Science. In particular, we will continue to use non-fiction Science and Social studies texts, relying on evidence-based questioning to ensure comprehension and mastery.
Additionally, Leadership Prep Ocean Hill will increase the use of labs and experiments into science in all grade levels to ensure that students are receiving practice and time to become familiar with the scientific process and the different tools and materials used in experiments. Employing the extensive use of hands-on experiments will be utilized with the goal of moving students towards competency in the understanding and application of Science concepts. Additionally, Leadership Prep Ocean Hill will increase the focus of writing during science, and use the practices used in writing workshop into our science classes

2017-18 ACCOUNTABILITY PLAN PROGRESS REPORT
Leadership Prep Ocean Hill Charter School 2017-18 Accountability Plan Progress Report Page 66 of 73
HIGH SCHOOL SCIENCE
Goal 5: Absolute Measure
Each year, 75 percent of students in the high school Accountability Cohort will score at least 65 on a New York State Regents science exam by the completion of their fourth year in the cohort.
METHOD
New York State schools administer multiple high school science assessments; current Regent exams are Living Environment, Earth Science, Chemistry and Physics. The school administered Living Environment and Chemistry Regents exams. It scores Regents on a scale from 0 to 100; students must score at least 65 to pass. This measure requires students in each Accountability Cohort to pass any one of the Regents science exams by their fourth year in the cohort. Students may have taken a particular Regents science exam multiple times or have taken multiple science exams. Students have until the summer of their fourth year to pass a science exam.
RESULTS AND EVALUATION
Uncommon Preparatory Charter High School’s 2014 cohort had 100% of students passing the Living Environment Regents with a score of 65 or higher.
This measure was met and exceeded, with 100% of students achieving “proficiency” as measured by a passing grade of 65 or higher on the Regents exams (equivalent to “Level 3 or higher” on the State Science Exam).
Science Regents Passing Rate with a Score of 65
by Fourth Year Accountability Cohort34
Cohort Designation
Number in Cohort
Percent Passing with a score of 65
2012 N/A N/A
2013 N/A N/A
2014 63 100%
ADDITIONAL EVIDENCE
The 2015, 2016, and 2017 cohorts have also already met the benchmark, each with more than 80% of students receiving a passing grade of 65 or higher on the Regents exams.
Science Regents Passing Rate with a score of 65 by Cohort and Year
Cohort Designation
2015-16 2016-17 2017-18
Number in Cohort
Percent Passing
Number in Cohort
Percent Passing
Number in Cohort
Percent Passing
2014 64 100% 63 100%
34 Based on the highest score for each student on any science Regents exam

2017-18 ACCOUNTABILITY PLAN PROGRESS REPORT
Leadership Prep Ocean Hill Charter School 2017-18 Accountability Plan Progress Report Page 67 of 73
2015 73 88% 70 89%
2016 96 88% 90 87%
2017 136 83%
Goal 5: Comparative Measure
Each year, the percent of students in the high school Total Cohort passing a Regents science exam with a score of 65 or above will exceed that of the high school Total Cohort from the school district of comparison.
METHOD
The school compares the performance of students in their fourth year in the charter school high school Total Cohort to that of the respective cohort of students in the school district of comparison. Given that students may take Regents exam up through the summer of their fourth year, the school presents most recently available district results.
RESULTS AND EVALUATION
At the time of this report, comparative NYS Science exam and NYS Regents exam data had not yet been released. Uncommon Preparatory Charter High School will update this report when the data becomes available.
Science Regents Passing Rate of the High School Total Cohort by Charter School and School District
Cohort
Charter School School District
Percent Passing
Cohort Size
Percent Passing
Cohort Size
2012 N/A N/A N/A N/A
2013 N/A N/A N/A N/A
2014 100% 63
Data Not Available
Data Not Available
ADDITIONAL EVIDENCE
n/a

2017-18 ACCOUNTABILITY PLAN PROGRESS REPORT
Leadership Prep Ocean Hill Charter School 2017-18 Accountability Plan Progress Report Page 68 of 73
GOAL 6: SOCIAL STUDIES
Goal 6: Social Studies
Students will demonstrate an understanding of key geographical, economic, and governmental concepts, as well as major historical ideas and developments in the United States, New York and the world.
Goal 6: Absolute Measure
Each year, 75 percent of students in the high school Accountability Cohort will score at least 65 on the New York State Regents U.S. History exam by the completion of their fourth year in the cohort.
METHOD
New York State administers two high school social studies assessments: U.S. History and Global History. In order to graduate, students must pass both of these Regents exams with a score of 65 or higher. This measure requires students in each Accountability Cohort to pass the two exams by the completion of their fourth year in the cohort. Students may have taken the exams multiple times and have until the summer of their fourth year to pass it. Once students pass it, performance on subsequent administrations of the same exam do not affect their status as passing.
RESULTS
The 2014 cohort had a 100% pass rate on the US History Regents.
U.S. History Regents Passing Rate with a Score of 65
by Fourth Year Accountability Cohort35
Cohort Designation
Number in Cohort
Percent Passing with a score of 65
2012 N/A N/A
2013 N/A N/A
2014 63 100%
EVALUATION
Uncommon Preparatory Charter High School met and surpassed this measure with a 100% pass rate on the US History Regents in the 2014 cohort.
ADDITIONAL EVIDENCE
n/a
U.S. History Regents Passing Rate with a score of 65 by Cohort and Year
35 Based on the highest score for each student on a science Regents exam

2017-18 ACCOUNTABILITY PLAN PROGRESS REPORT
Leadership Prep Ocean Hill Charter School 2017-18 Accountability Plan Progress Report Page 69 of 73
Cohort Designation
2014-15 2015-16 2016-17
Number in Cohort
Percent Passing
Number in Cohort
Percent Passing
Number in Cohort
Percent Passing
2014 64 98% 63 100%
2015 73 33% 70 84%
2016 96 16% 90 17%
2017 136 15%
Goal 6: Comparative Measure
Each year, the percent to students in the high school Total Cohort passing the Regents U.S. History exam with a score of 65 or above will exceed that of the high school Total Cohort from the school district of comparison.
METHOD
The school compares the performance of students in their fourth year in the charter school high school Total Cohort to that of the respective cohort of students in the school district of comparison. Given that students may take Regents exam up through the summer of their fourth year, school presents the most recently available district results.
RESULTS
At the time of this report, comparative graduation data for U.S. History Regents had not yet been released. Uncommon Preparatory Charter High School will update this report when the data becomes available.
U.S. History Passing Rate
of the High School Total Cohort by Charter School and School District
Cohort
Charter School School District
Percent Passing
Cohort Size
Percent Passing
Cohort Size
2012 N/A N/A N/A N/A
2013 N/A N/A N/A N/A
2014 100% 63
Data Not Available
Data Not Available
EVALUATION
n/a
ADDITIONAL EVIDENCE
n/a

2017-18 ACCOUNTABILITY PLAN PROGRESS REPORT
Leadership Prep Ocean Hill Charter School 2017-18 Accountability Plan Progress Report Page 70 of 73
Goal 6: Absolute Measure
Each year, 75 percent of students in the high school Accountability Cohort will score at least 65 on the New York State Regents Global History exam by the completion of their fourth year in the cohort.
METHOD
This measure requires students in each Accountability Cohort to pass the Global History exam by the completion of their fourth year in the cohort. Students may have taken the exam multiple times, and had until the summer of their fourth year to pass it. Once students pass it, performance on subsequent administrations of the same exam do not affect their status as passing.
RESULTS
The 2014 cohort had a 95% pass rate on the Global History Regents.
Global History Regents Passing Rate with a Score of 65
by Fourth Year Accountability Cohort36
Cohort Designation
Number in Cohort
Percent Passing with a score of 65
2012 N/A N/A
2013 N/A N/A
2014 63 95%
EVALUATION
This measure was met and exceeded, with 95% of students achieving “proficiency” as a measured by a passing grade of 65 or higher on the Regents exam (equivalent to “Level 3 or higher” on the State Science exam).
ADDITIONAL EVIDENCE
n/a
Global History Regents Passing Rate with a score of 65 by Cohort and Year
Cohort Designation
2014-15 2015-16 2016-17
Number in Cohort
Percent Passing
Number in Cohort
Percent Passing
Number in Cohort
Percent Passing
2014 64 95% 63 95%
2015 73 77% 70 86%
2016 96 0% 90 63%
2017 136 0
36 Based on the highest score for each student on a science Regents exam

2017-18 ACCOUNTABILITY PLAN PROGRESS REPORT
Leadership Prep Ocean Hill Charter School 2017-18 Accountability Plan Progress Report Page 71 of 73
Goal 6: Comparative Measure
Each year, the percent of students in the high school Total Cohort passing the Regents Global History exam with a score of 65 or above will exceed that of the high school Total Cohort from the school district of comparison.
METHOD
The school compares the performance of students in their fourth year in the charter school high school Total Cohort to that of the respective cohort of students in the school district of comparison. Given that students may take Regents exam up through the summer of their fourth year, the school presents most recently available district results.
RESULTS
At the time of this report, comparative graduation data for Global History Regents had not yet been released. Uncommon Preparatory Charter High School will update this report when the data becomes available.
Global History Passing Rate
of the High School Total Cohort by Charter School and School District
Cohort Charter School School District
Percent Passing
Number in Cohort
Percent Passing
Number in Cohort
2012 N/A N/A N/A N/A
2013 N/A N/A N/A N/A
2014 95% 63
Data Not Available
Data Not Available
EVALUATION
n/a
ADDITIONAL EVIDENCE
n/a

2017-18 ACCOUNTABILITY PLAN PROGRESS REPORT
Leadership Prep Ocean Hill Charter School 2017-18 Accountability Plan Progress Report Page 72 of 73
GOAL 7: ESSA
Goal 7: ESSA
The school will remain in good standing under the state’s ESSA accountability system.
Goal 7: Absolute Measure
Under the state’s ESSA accountability system, the school is in good standing: the state has not identified the school for comprehensive or targeted improvement.
METHOD
Because all students are expected to meet the state's performance standards, the federal statute stipulates that various sub-populations and demographic categories of students among all tested students must meet the state standard in and of themselves aside from the overall school results. As New York State, like all states, is required to establish a specific system for making these determinations for its public schools, charter schools do not have latitude in establishing their own performance levels or criteria of success for meeting the ESSA accountability requirements. Each year, the state issues School Report Cards that indicate a school’s status under the state accountability system.
RESULTS AND EVALUATION
Leadership Prep received a “Good Standing” status under ESSA. The school has diligently worked to meet each ESSA requirement and comply with all stated guidelines for testing and we will maintain this going forward.
ADDITIONAL EVIDENCE
Accountability Status by Year
Year Status
2015-16 Good Standing
2016-17 Good Standing
2017-18 Good Standing

Leadership Prep Ocean Hill Charter School 2017-18 Accountability Plan Progress Report Page 73 of 73