Embed Size (px)
Citation preview

The University of Southern MississippiThe Aquila Digital Community
Dissertations
Fall 12-2011
Leadership Practices that Promote IncreasedStudent Achievement in Secondary SchoolsBilly Ray JonesUniversity of Southern Mississippi
Follow this and additional works at: https://aquila.usm.edu/dissertations
Part of the Educational Leadership Commons, and the Elementary and Middle and SecondaryEducation Administration Commons
This Dissertation is brought to you for free and open access by The Aquila Digital Community. It has been accepted for inclusion in Dissertations by anauthorized administrator of The Aquila Digital Community. For more information, please contact [email protected].
Recommended CitationJones, Billy Ray, "Leadership Practices that Promote Increased Student Achievement in Secondary Schools" (2011). Dissertations. 422.https://aquila.usm.edu/dissertations/422

The University of Southern Mississippi
LEADERSHIP PRACTICES THAT PROMOTE INCREASED
STUDENT ACHIEVEMENT IN SECONDARY SCHOOLS
by
Billy Ray Jones, Jr.
Abstract of a Dissertation Submitted to the Graduate School
of The University of Southern Mississippi in Partial Fulfillment of the Requirements
for the Degree of Doctor of Philosophy
December 2011

ABSTRACT
LEADERSHIP PRACTICES THAT PROMOTE INCREASED
STUDENT ACHIEVEMENT IN SECONDARY SCHOOLS
by Billy Ray Jones, Jr.
December 2011
The purpose of the following study was to determine the degree to which the
perceptions of teachers and school level administrators may differ, and the effects of
these perceptions on student achievement as measured at the school level by the school’s
accountability score reported in the form of the Quality Distribution Index (QDI). This
index ranges from 0 to 300 and is used in the state of Mississippi to assign schools to one
of seven accountability labels. Schools may be classified as one of the following
depending on their QDI score: star, high performing, successful, academic watch, at risk
of failure, low performing, or failing. All secondary schools in the state of Mississippi
were contacted for participation in this study. Participation in the study consisted of
supervising principals and the teachers at the school completing online surveys regarding
the principal’s demonstration of various leadership responsibilities. Once these scores
were recorded, the co-variable of socioeconomic status was controlled for as the
perception of principals of their leadership responsibilities was regressed with the QDI
score. This statistical analysis found a significant amount of variance between the
leadership perception of the principal and that of the QDI score. This finding is supported
by other research in that the efficacy of the principal can have a significant impact on
student and school achievement. Teacher perceptions of the principal’s leadership ability
ii

was found to have less than a significant relationship when regressed with QDI while
controlling for the co-variable of socioeconomic status. Finally, a difference score was
calculated between the principal’s perception and the teacher’s perception, and this score
was then placed in a regression with the QDI once again controlling for the co-variable of
socioeconomic status. No significant relationship was found with this difference score
and the QDI score for the school while controlling for the co-variable of socioeconomic
status. The findings of this study would seem to support other research which has shown
that the efficacy, or belief that one has an impact, of the school principal does have a
significant impact on student achievement.
iii

COPYRIGHT BY
BILLY RAY JONES, JR.
2011

The University of Southern Mississippi
LEADERSHIP PRACTICES THAT PROMOTE INCREASED
STUDENT ACHIEVEMENT IN SECONDARY SCHOOLS
by
Billy Ray Jones, Jr.
A Dissertation Submitted to the Graduate School
of The University of Southern Mississippi in Partial Fulfillment of the Requirements
for the Degree of Doctor of Philosophy Approved: Rose McNeese Director David Lee J.T. Johnson
Wanda Maulding Susan A. Siltanen Dean of the Graduate School
December 2011

ACKNOWLEDGMENTS
I would like to thank my family for not giving up on me during this process. With
the time requirements it would have been easy to do so many times. It goes without
saying that I adore my wife and our three beautiful children. A special thank you I extend
to my parents. They have always been my biggest fans.
To Dr. Rose McNeese, who began to kindle a fire in my heart for at-risk kids
some time ago. I will be eternally grateful. All of the members of my committee, Dr.
Wanda Maulding, Dr. David Lee, and Dr. Tammy Greer, I truly thank each of you for
your guidance and time. In addition, I certainly want to thank Dr. J.T. Johnson and Dr.
Jalynn Roberts for their time and service. These are two first class individuals. I sincerely
thank all of you for the questions that you answered as I quested for knowledge. Each of
you has helped make me a better person.
Now I hope that I can move on, with the knowledge that you have all shared with
me, in hopes of increasing the chance of students reaching their potential and dreams by
never giving up on them. By using the knowledge and skills that you have imparted, it is
my intent to give back to my fellow man.
iv

TABLE OF CONTENTS
ABSTRACT………………………………………………………………………………ii
ACKNOWLEDGMENTS………………………………………………………………..iv
LIST OF TABLES…………………………………………………………………….....vii
LIST OF ILLUSTRATIONS……………………………………………………………viii
CHAPTER
I. INTRODUCTION………………………………………………………...1
Statement of the Problem Background Purpose of the Study Research Questions Definitions of Terms Delimitations Assumptions Professional Significance Summary
II. LITERATURE REVIEW………………………………………………..15
Introduction Theoretical Framework Instructional Leadership ISLLC Standards for Principals Focusing Leadership Resistive Forces to School Leadership Practices of Schools that Foster High Achievement Summary
III. METHODOLOGY………………………………………………………52
Introduction Research Questions Research Design Participants Instrumentation Procedures Analysis of Results Summary
v

IV. RESULTS………………………………………………………………..62 Introduction Descriptive Statistics Statistical Analysis Ancillary Findings Summary
V. DISCUSSION……………………………………………………………75
Introduction Discussion Limitations Implications for Policy and Practice Recommendations for Future Research Summary
APPENDIXES …………………………………………………………………………..86 REFERENCES ………………………………………………………………….............99
vi

LIST OF TABLES
Table
1. Twenty-One Leadership Responsibilities and Their Correlations (r) with Student Achievement…………………………………………………………….30
2. School Accountability Types…………………………………………………….55
3. Principal Demographics………………………………………………………….64
4. Descriptive Statistics for Different Accountability Labels………………………65
5. Comparison of Mean Leadership Aggregate Score of Principals with That of Teachers………………………………………………………………………….67
E1. Descriptive Statistics for Individual Principal Survey Items…………………….95 F1. Descriptive Statistics for Individual Teacher Survey Items……………………..97
vii

LIST OF ILLUSTRATIONS
Figure
1. Leadership and Learning Framework……………………………………………38
viii

1
CHAPTER I
INTRODUCTION
Because of Federal mandates to education such as the No Child Left Behind
(NCLB) Act (2001), Individuals with Disabilities Educational Act (IDEA, 2004), and the
legislative initiative Response to Intervention (RTI), current school leaders are being
asked to do something that the systems in which they operate were never organized to do
at the inception of the American public education system: educate all students to high
levels of learning (Chenowith, 2009). This being the case, many school leaders find
themselves looking for the next big “saving solution” in education. As Douglas Reeves
(2006) states in his book The Learning Leader:
There is a new religion spreading like wildfire in the school systems and
state departments of education. The religion of “Documentarianism” and,
with missionary zeal, its adherents believe that with just the right school
improvement plan, or the right format, or with the all the boxes completed
in all the right places, the deity to whom they pray will grant educational
miracles. (p. 61)
The researcher in this study sought to identify not a step-by-step school
improvement model, but a group of leadership practices that are associated with
improving student achievement through fostering and supporting effective school
practices amongst members of a learning community at the school level. Principals are
asked to fulfill many and diverse responsibilities that are extremely important in running
a school. Not all of these tasks are essential to improving student achievement (Marzano,
Waters, & McNulty, 2005; Waters & Cameron, 2003). This study sought to provide

2
insights to principals so that they might better understand how to balance their time and
efforts in paying attention to important supervisory tasks versus those tasks that are
essential for improving student achievement through supporting effective school
practices in the schools in which they work.
Statement of Problem
According to Richard DuFour, in his latest book dealing with professional
learning communities, Revisiting Professional Learning Communities at Work (2008),
“Until recently, if formal charges were brought against a school alleging that learning
was taking place, most schools in America could be confident the charges would
ultimately be dropped for lack of evidence” (p. 59). This paradox of what is current
reality in schools and is expected for schools to achieve by 2014 (NCLB, 2001) has been
the focus of several studies on the effectiveness of school leadership on increasing
student achievement in their schools. One of these studies, School Leadership that Works
by Waters, Marzano, & McNulty (2005), developed a list of 21 Leadership
Responsibilities for school leaders as the result of an extensive meta-analysis that
included 70 studies and more than 14,000 teacher ratings of administrative leadership for
a pool of over 2,800 principals. Waters et al., (2005) showed that the relationship is very
strong between leadership and student achievement. The research also revealed that the
educational leader is responsible for many important tasks that can influence student
achievement. Some of the researchers that have helped to establish a strong relationship
for this connection between leadership and student achievement include: Goodlad (1984),
Schmoker (1999, 2001, 2006), DuFour, DuFour, Eaker, and Karhanek (2004), Elmore

3
(2000), Childress, Elmore, & Grossman (2006), Marzano, Waters, McNulty (2005), and
the Wallace Foundation (Leithwood, Louis, Anderson, & Walhstrom, 2004).
In A Place Called School, John Goodlad (1984) noted that teachers must take
headship in the use of time, as it is the most valuable non-renewable commodity in the
learning process that the teachers have at their disposal. Instructional decisions by the
teacher that are made in relation to time can greatly affect the outcomes in student
achievement for students (Goodlad, 1984). These time-related decisions made by the
teacher can also greatly affect the educational equity that students receive. This equity
can be related to a student’s opportunity to learn (Chenowith, 2009). Also, Goodlad
shared that teachers need support from leaders. According to Goodlad, teachers languish
for a situation in which they feel that they are supported by someone that appreciates
their work, is zealous about the teacher’s work, and provides much needed assistance and
support for teachers.
Mike Schmoker (2006) made the case in his book Results Now that leadership for
schools which has proven to lead to improved results usually runs opposite of the culture
that has persisted in schools since they were first organized in America. Schools have
conventionally operated under the supposition that teachers are professionals, and so they
should be left alone to go about their daily business without outside intrusion in their
classrooms. Schmoker contended that it will take effective leadership practices to insure
schools are able to adopt (a) a cogent curriculum, (b) an improved commitment to
teaching literacy, (c) confirmation that most schooling contains the rudiments necessary
for success, and (d) an intermittent classroom walk-through process to evaluate the
strengths and obstacles of the instructional decisions being made in schools.

4
Richard Elmore (2000) raised the alarm for many years that the standards-based
reform brought about by NCLB (2001) created problems of the sincerest and most
elemental variety about how we visualize the hierarchy of schooling and the role of
leaders in school districts and schools. Elmore asserted that the stakes are at a very
important point for the outlook of public schooling and students who attend public
schools. Schools were fundamentally designed to be static enterprises that are incapable
of the shift that is required to initiate the significant changes that are required to meet the
challenges of the future in relation to the requirements of NCLB (Elmore, 2000). It will
require changes in the values and dispositions that form how teachers and principals think
about the intention of their work. This dynamic structure will also require changes in how
we think about who the key leaders in the schools are and what these new leaders do. In
addition, changes in the conceptual knowledge and skill requirements of schools based on
continual school improvement will need to be the norm. The core of the matter, according
to Elmore, is that schools must be redesigned to the point to which they are institutions
where both the students and the teachers both learn together. Learning for the student
group will not be able to be sustained if occurring isolated from learning for the adults.
Many meta-analyses have identified leadership domains that may be helpful in the
task of leading today’s schools. The list of responsibilities identified by Marzano,
Waters, and McNulty (2003, 2005) was mentioned again by Douglas Reeves in his book
The Learning Leader (2006). Reeves used this list to emphasize the fact that for the
maximum amount of effectiveness of leadership in schools to take place, leadership must
be shared in the form of effective collaboration, which in turn, leads to the development
of actual teacher leadership in the learning process. This idea was expanded in Reeves’

5
book Reframing Teacher Leadership: To Improve Your School (2008) as he emphasized
the relationship between leadership, student achievement, and effective teacher
collaboration.
Background
At no other time in history have schools been asked to complete the varied
number and difficult tasks that they are being asked to complete today. One of the
greatest shifts of the American Public Education paradigm brought about by NCLB
(2001) was the idea of ensuring that all children learn at high levels. According to NCLB
(2001), any school that does not have all students in every demographic group scoring
proficient on its state mandated exams in the subjects of math, language arts, and science
will be considered “failing” (U.S. Department of Education [USDE], 2002). According to
DuFour, DuFour, Eaker, and Karhanek (2010) in their latest book, Raising the Bar,
Closing the Gap: Whatever It Takes, even though American students have had the
constitutional right to attend school historically; they have not had the constitutional right
to learn. As a matter of fact, for the past two hundred years, it has been the status quo that
only a select group of students were capable of high levels of learning while the others
were more suited for pursuing vocational interests or possible apprenticeships in the
industrial arts (DuFour et al., 2010).
When one compares this idea of public education to that of the requirements of
NCLB (2001), the dilemma for school leaders is clear. How can a structure for schools be
used that has not changed over the past two hundred years to meet this new federally
mandated challenge? This reality has been a source of a high level of anxiety and fear for
school leaders and teachers alike as many lack the training and the skills needed to meet

6
the challenge (Chenowith, 2009). Looking at the sanctions included in the NCLB (2001)
legislation, it would appear that trepidation is what is needed to provide the necessary
motivation to school leaders and teachers to insure that all students learn at high levels
(DuFour et al., 2010).
Purpose of the Study
The purpose of this study was to examine the relationship between principals and
teachers perceptions of the principal’s demonstration of school Leadership
Responsibilities as measured by a leadership score, on student achievement in the
secondary school courses of Algebra I, Biology I, English II, and United States History as
measured by the Mississippi Subject Area Tests reported in the form of the school QDI
score. From the analysis of these Leadership Responsibilities, as reported by this
leadership score, the intent was to provide school leaders a set of practices that may be
positively associated with improvement in secondary student achievement as measured
by the Mississippi state assessments reported by the QDI.
A meta-analysis conducted by Waters, Marzano, and McNulty (2003) found that
the main responsibility of a school’s instructional leader is to provide the support and the
supervision of the instructional program to increase the probability of success in the
learning process for all students in the school. This meta-analysis included seventy
studies and 2,894 schools. The study also included 1.1 million students and 14,000
teachers. The study identified 21 Leadership Responsibilities that showed positive impact
on student achievement. The data from this study demonstrated that there is a substantial
relationship between leadership and student achievement.

7
This overall effect size of (.25) was found for the relationship of leadership
domains and student achievement. This effect size would be equivalent to an increase in
leadership ability of one standard deviation equating to a 10 percentile point increase in
student achievement. If two schools, School X and School Y, were both achieving at the
50th percentile and the principal at School Y were able to increase their leadership ability
by one standard deviation, then the student achievement would be expected to increase to
the 60th percentile based on this effect size.
These Leadership Responsibilities were organized to form The Balanced
Leadership Framework (Marzano, Waters, & McNulty, 2005; Waters, Marzano &
McNulty, 2003). For the purpose of this quantitative study, this researcher sought to
examine the relationship of the 21 Leadership Responsibilities identified by Waters,
Marzano, & McNulty (2003) and Marzano, Waters, & McNulty (2005) to high school
student achievement as measured on state assessments in Algebra I, Biology I, English II,
and United States History on the Mississippi Subject Area Tests to determine the extent
that each of these school principals and their staff perceive the Leadership
Responsibilities lead to success on the Mississippi Subject Area Tests in the high school
courses that comprise the QDI index for these schools. The researcher used a survey
instrument and archival test data to conduct this research.
Research Questions
Leadership is complicated and dynamic. According to Douglas Reeves in The
Learning Leader (2006), “Leadership is about change---how to justify it, implement it,
and maintain it” (p. 158). The purpose of this study was to determine to what extent does
the demonstration of any of the 21 Leadership Responsibilities identified in the previous

8
studies mentioned (Marzano, Waters, & McNulty, 2005; Waters, Marzano & McNulty,
2003), as measured by a leadership score, have a relationship or perceived relationship on
student achievement in Algebra I, Biology I, English II, and United States History as
measured by the Mississippi Subject Area Tests in Mississippi as reported in the form of
the Quality Distribution Index (QDI) or the Mississippi Accountability Level which takes
into account the QDI score and whether or not students showed growth from the middle
school standardized tests. The researcher in this study sought to understand which of
these identified and quantifiable Leadership Responsibilities show any relationship to
improved student achievement marked by the performance of students on the Mississippi
Subject Area Tests for Algebra I, Biology I, English II, and United States History as
measured by QDI or accountability label.
This research did address the following research questions:
1. Is there a relationship between a school principals’ and teachers’
perceptions of the principals’ demonstration of Leadership
Responsibilities as measured by the leadership aggregate score on a survey
instrument related to the 21 Leadership Responsibilities?
2. Is there a relationship between the school principals’ leadership score on
the survey instrument and school achievement on Algebra I, Biology I,
English II, and United States History Area Tests as measured by the
Mississippi Subject Area Tests as reported in the form of the QDI score
for the school, controlling for the percent of free and reduced lunch
students?

9
3. Is there a relationship between the school teachers’ perceptions of the
principals’ demonstration of Leadership Responsibilities as measured by
the leadership score computed from this survey instrument and school
achievement based on the school QDI score as measured by the
Mississippi Subject Area Tests, controlling for the percent of free and
reduced lunch students?
4. Are there differences between school principals’ and teachers’ perceptions
as measured by the leadership score computed from this survey instrument
related to school achievement as measured by the QDI score, controlling
for the percent of free lunch students?
The effectiveness of the principal was measured by examination of teacher and
administrator perceptions of the principals’ demonstration of the various 21 Leadership
Responsibilities found in the Balanced Leadership Framework and computed into a
single leadership score for the principal and one for the teachers’ perception of the
principal (Marzano, Waters, & McNulty, 2005; Waters, Marzano & McNulty, 2003).
Student achievement scores for 2010 as measured by the Mississippi Subject Area Tests
in Algebra I, Biology I, English II, and United States History as reported by the
Mississippi Department of Education (MDE, 2010) served as an additional gauge of
effectiveness of the school leader. These scores were compared with the schools
Accountability Performance Accreditation Rating (MDE, 2010) to determine if any
statistical significance exists between one and more of the 21 Leadership Responsibilities
and student performance on the Mississippi Subject Area Tests in high school Algebra I,
Biology I, English II, and United States History.

10
Definitions of Terms
School Administrator – A person legally appointed to conduct the affairs of a
school (“School Administrator,” 2011).
School Leader – A person that directs a school or who has authority (“School
Leader,” 2011).
School Principal – A person that is primarily in charge of a local education
agency and has obligation to the performance of the institution (“School Principal,”
2011).
Leadership – The act or the behavior of leading (“Leadership,” 2011).
Responsibility – The act of being responsible with moral, legal, and mental
accountability (“Responsibility,” 2011).
Delimitations
The study was limited to public high public schools serving grades 7 through 12.
The sample was drawn from the eight districts of the state of Mississippi recognized by
the Mississippi High School Activities Association. The schools chosen for this sampling
may or may not have been representative of all areas of the state even though these
districts did cover the entire geography of the state. The Leadership Responsibilities of
the principals that were assessed by the teachers of the schools were limited to those
responsibilities observed by the teachers. The Mississippi Subject Area Test Score
variances amongst schools in Algebra I, Biology I, English II, and United States History
could be attributable to multiple variables other than school leadership.

11
Assumptions
Assumptions in this study were limited by the researcher. In this study it was
assumed that school principals and teachers did answer surveys honestly and completely.
It was also assumed that principals and teachers were undeterred in answering honestly
based on concerns over confidentiality. It was also accepted that teachers have had the
opportunity to observe the school leader enough to be able to determine certain traits
related to the 21 Leadership Responsibilities.
Professional Significance
With the number of responsibilities faced by today’s educational leaders, it is
important with all of the varied and wide array of educational initiative choices that there
be a concerted effort to provide current practitioners with an identified group of practices
that will give them some hope of meeting the challenges of the mandates by which they
are held accountable. This study sought to shed light on the practices that school leaders
might focus on as essential to supporting and developing effective school practices which
research has shown can have the effect of increased student achievement. The idea was
that these specific leadership practices could be the focus of collective inquiry by districts
to provide the leaders of their schools with the necessary tools to focus school
improvement while developing “learning leaders” (Reeves, 2006, p. vii). These groups of
practices have been shown to help schools meet the challenges of teaching all students to
high achievement levels as evidenced by the research of Douglas Reeves in the 90-90-90
Schools (2004) research and the research of Richard DuFour in Revisiting Professional
Learning Communities at Work (2008).

12
Summary
External efforts to improve schools most often focus on changing the structure of
the school. Whether these changes are directed at policies, procedures, rules, and
relationships, they fail to get at the foundation of the matter which is what really must
take place is a change in the culture of the school. According to Richard Elmore (2003),
“The pathology of American schools is that they know how to change…What schools do
not know how to do is to improve, to engage in sustained and continuous progress toward
a performance goal over time” (p. 11). Culture shift is very important in developing the
effective collaboration needed for school leaders and teachers to work together to meet
today’s demands that have been placed on schools. The central premise behind schools
becoming professional learning communities is that they undergo a profound cultural
shift (DuFour, 2008).
In the book by DuFour, DuFour, and Eaker, Revisiting Professional Learning
Communities at Work: New Insights for Improving Schools (2008), the big ideas that
drive professional learning communities correlate with the other research on the subject
of meeting the challenges that are faced by today’s leaders in our nation’s schools. The
big ideas expounded upon in this work are first, the fundamental purpose of any school is
to ensure that all students learn at high levels, and second, the future success of students
will depend on how effective leaders and teachers are in achieving this elemental
purpose. These big ideas relate to the idea that all children can learn as stated in the
requirements of NCLB (2001).
The second big idea is that there is no way that educators can achieve this
fundamental purpose working in isolated classrooms as independent contractors that

13
simply share a common parking lot (Elmore, 2003). This points to the evidence provided
by many researchers that only through collaboration can the challenges faced by today’s
schools hope to be met.
Lastly, the final big idea underpinning professional learning communities again
lends itself to effective collaboration by teachers supported by school leaders in that it
insists that schools will not know whether all students are learning if the leaders and
teachers are not purposefully looking for evidence of learning through the data provided
by effective formative assessments and monitoring by all educators (DuFour, 2008). All
of these activities are supported by effective collaboration that in turn is supported by the
leadership of the principal. Thus the leadership research that supports the importance of
the relationship of leadership to student achievement, in turn suggests that the leadership
practices used by the school leader in turn will affect the use of effective collaboration of
teachers, which has also been proven to be very important in improving student
achievement.
Other researchers have been quoted as corroborating the importance of
collaboration in highly successful schools. Waters and Cameron (2003), supported this
idea of the importance of the group feeling that they can have an impact through the term
of “collective efficacy,” which is defined by Goddard (2001) as a shared perception or
belief held by a group that they can organize and execute a course of action that makes a
difference. Douglas Reeves (2006) explained this phenomenon as “the wisdom of the
group” in his book The Learning Leader (p. 25). Mike Schmoker (2006) argues that the
professional learning community is “arguably the best, most agreed-upon means by
which to continuously improve instruction and student performance” (p. 106).

14
The professional learning community is defined as educators committed to
working collaboratively in ongoing processes of collective inquiry and action research to
achieve better results for the students they serve (DuFour, DuFour, Eaker, & Many,
2006). The basic characteristics of professional learning communities are described in
detail in DuFour et al.’s (2006) Learning by Doing: Shared mission, vision, values, and
goals that are all focused on student learning, a collaborative culture with a focus on
learning, collective inquiry into best practice and current reality, action orientation with a
learning by doing spirit of practice, a commitment to continuous improvement, and a
results orientation.

15
CHAPTER II
LITERATURE REVIEW
Introduction
This chapter provides an overview of the research literature related to the
investigation of what leadership practices promote high student achievement of
secondary students in mathematics and language arts as evidenced by higher student
achievement on standardized measures of secondary subjects that account for the schools
QDI index. The essential frameworks that have been reviewed for this study were related
to: (a) Instructional Leadership Practices, (b) Effective Practices Related to Improved
Student Achievement in Secondary Mathematics and Language Arts, (c) Teacher
Collaboration, (d) Change Theory, (e) Professional Learning Communities, and (f)
Leadership for Learning.
Because of Federal mandates to education such as the No Child Left Behind
(NCLB) Act (2001), Individuals with Disabilities Educational Act (IDEA, 2004), and the
legislative initiative Response to Intervention (RTI), current school leaders are being
asked to do something that the systems in which they operate were never organized to do
at the inception of the American public education system: educate all students to high
levels of learning (Chenowith, 2009; Reeves, 2004). This being the case, many school
leaders find themselves looking for the next big saving solution in education.

16
As Douglas Reeves stated in his book The Learning Leader (2006):
There is a new religion spreading like wildfire in the school systems and
state departments of education. The religion of Documenatrianism and,
with missionary zeal, its adherents believe that with just the right school
improvement plan, or the right format, or with the all the boxes completed
in all the right places, the deity to whom they pray will grant educational
miracles. (p. 61)
The researcher in this study sought to identify not a step-by-step school
improvement model, but a group of leadership practices that are associated with
improving student achievement in secondary mathematics and language arts through
fostering and supporting effective school practices amongst members of a learning
community at the school level. Principals are asked to fulfill many and diverse
responsibilities that are extremely important in operating schools. Not all of these tasks
are essential to improving student achievement (Marzano, Waters, & McNulty, 2005;
Waters & Cameron, 2003). This study sought to provide insights to principals, so they
might better understand how to balance their time and efforts in paying attention to
important managerial tasks opposed to those tasks that are essential for improving student
achievement through focusing on those leadership practices that lead to more effective
adult actions in schools such as effective collaboration.
The purpose of this study is to examine instructional leaders’ perceived practices
and cultures of their schools in relation to how these leadership practices have impacted
and helped to foster improvement and high student achievement in secondary
mathematics and language arts. Leadership practices that school leaders undertook to

17
positively influence student achievement in secondary mathematics and language arts as
a result of teacher collaboration and other effective practices were analyzed in this study.
From the analysis of these leadership practices, the intent of this study was to provide a
set of practices that may be explored by school leaders that have been positively
associated with improved student achievement in secondary mathematics and language
arts as evidenced by improvements and/or high achievement on state and nationally
standardized achievement tests.
The main responsibility of a school’s instructional leader is to provide for the
support and the supervision of the instructional program to increase the probability of
success in the learning process for their students. This quantitative correlational study
sought to examine the perceptions of school level administrators and teachers on the
school leader’s leadership practices in schools in the state of Mississippi in regards to
their performance on the secondary Mississippi Subject Area Test in Algebra I, Biology
I, English II, and United States History as reflected in school achievement in the form of
the QDI score. This was done to study the extent that each of these educators perceives
how leadership practices such those related to the 21 leadership practices identified by
Marzano, Waters, & McNulty (2003, 2005) could be influential in the outcomes of high
or improved student achievement as measured by state standardized tests reported by
QDI. The researcher used a survey instrument and archival test data to conduct this
research to gain the perceptions of the administrators and teachers. This survey did
include objective items.

18
Theoretical Framework
External efforts to improve schools most often focus on changing the structure of
the school. Whether these changes are directed at policies, procedures, rules, and
relationships, they fail to get at the core of the matter which is what really must take place
is a change in the culture of the school. According to Richard Elmore (2002), “The
pathology of American schools is that they know how to change…What schools do not
know how to do is to improve, to engage in sustained and continuous progress toward a
performance goal over time” (p. 8). Culture shift is very important in developing the
effective collaboration needed for school leaders and teachers to work together to meet
today’s demands that have been placed on schools. The central premise behind schools
becoming professional learning communities is that they undergo a profound cultural
shift (DuFour, 2008).
In the book by DuFour, DuFour, and Eaker, Revisiting Professional Learning
Communities at Work: New Insights for Improving Schools (2008), the big ideas that
drive professional learning communities correlate with the other research on the subject
of meeting the challenges that are faced by today’s leaders in our nation’s schools. The
big ideas expounded upon in this work are first, that the fundamental purpose of any
school is to ensure that all students learn at high levels, and the future success of students
will depend on how effective leaders and teachers are in achieving this elemental
purpose. This big idea relates to the idea of all children learning as stated in the
requirements of NCLB (2001).
The second big idea is that there is no way that educators can achieve this
fundamental purpose working in isolated classrooms as independently without focusing

19
together to formulate solutions to common problems. This points to the evidence
provided by many researchers that only through collaboration can the challenges faced by
today’s schools hope to met.
Lastly, the final big idea underpinning professional learning communities again
lends itself to effective collaboration by teachers supported by school leaders in that it
insists that schools will not know whether all students are learning if the leaders and
teachers are not purposefully looking for evidence of learning through the data provided
by effective formative assessments and the monitoring of learning by all educators
(DuFour, 2008). All of these activities are supported by effective collaboration that in
turn is supported by the leadership of the principal. The leadership research that supports
the importance of the relationship of leadership to student achievement in turn suggests
that the leadership practices used by the school leader in turn will affect the use of
effective collaboration of teachers and other effective practices, which have been proven
through research to be very important in improving student achievement.
Other researchers have been quoted as corroborating the importance of
collaboration in highly successful schools. Waters and Cameron (2003), support this idea
of the importance of the group feeling that they can have an impact through the term of
“collective efficacy,” defined by Goddard (2001) as a shared perception or belief held by
a group that they can organize and execute a course of action that makes a difference.
Reeves (2005) explained this phenomenon as “the wisdom of the group” in his book The
Learning Leader (2006, p. 25). Mike Schmoker (2006) argued that the professional
learning community is, “arguably the best, most agreed-upon means by which to
continuously improve instruction and student performance” (p. 106).

20
The professional learning community is defined as educators committed to
working collaboratively in ongoing processes of collective inquiry and action research to
achieve better results for the students they serve (DuFour, DuFour, Eaker, & Many,
2006). The basic characteristics of professional learning communities are described in
detail in DuFour et al.’s, Learning by Doing (2006) as a shared mission, vision, values,
and goals that are all focused on student learning, a collaborative culture with a focus on
learning, collective inquiry into best practice and current reality, action orientation with a
learning by doing focus, a commitment to continuous improvement, and a results
orientation are all considered essential components of a professional leaning community.
In John Hattie’s book Visible Learning (2009), he compiles over 800 different
meta-analyses together to form an extensive review of all of the information that we have
in regards to the effects of leadership on student achievement. Professor Hattie’s interest
in the book was simply the effect that principals have on the achievement of their
students. In the eleven meta-analyses that were studied by the researcher, there were 491
studies included.
One of the conclusions drawn by John Hattie from this research was that in all
491 studies there were two major forms of principal leadership that predominated. These
forms of leadership were instructional leadership and transformational leadership.
Instructional leadership, according to Professor Hattie, was marked by principals that
were focused on clear objectives for teaching and learning, clear ideals and beliefs about
learning, and high expectations for teachers and learners. Transformational leadership
was marked by principals that felt it was more their responsibility to inspire teachers to
commitment and moral purpose, thus leadership was more distributed.

21
The end findings of Professor Hattie’s work were such that it was the more
directive instructional leadership style that showed a higher effect on positive student
outcomes. Professor Hattie concludes that principals that focus on student’s achievement,
supporting and fostering effective instructional strategies, and focusing more on student
achievement domains have the greatest positive effect on student learning.
There were many specific strategies that John Hattie found that supported his
conclusions. The specific area that was found in the research to have the highest positive
effect on student learning was the principal actively engaging in teacher professional
learning and staff development. In this case the effect was d = 0.91, where d > 0.40 is
considered significant (Hattie, 2009, p. 83). The second highest effect area was the
principal “planning, coordinating, and evaluating the curriculum” (Hattie, 2009, p. 83). In
contrast the highest effect noted for a transformational type trait which was d = 0.009.
Professor Hattie also found other factors that correlated with improved student
achievement. One of the factors that had a strong correlation (r = 0.66) in the study was
the awareness of the school leader of the goals that needed to be addressed for student
achievement to improve. Whether the principal was willing to challenge the status quo of
current reality was correlated strongly (r = .60) with improved student achievement. And,
finally, a moderate correlation was found between the principals commitment to monitor
school practice effectiveness (r = .56) (Hattie, 2009, pp. 84-85).
The literature review in this chapter defines a need for a cultural change in
schools to be able to foster a culture of collaboration as this collaborative culture is
counter to the way schools have operated since their inception. This research sought to
present how school leaders can combat this resistance to change and overcome what

22
Collins and Porras (1997) called the “Tyranny of Or,” which would lead us to believe that
a school must consist of either strong leadership or teachers empowered through
collaboration, but that it would be impossible for the school to possess both (DuFour,
2008).
History of Leadership
Research shows that the definition of leadership has changed over the past one
hundred years. In fact, Short and Greer, in Leadership in Empowered Schools (2002),
assert that “no other facet of organizational behavior has received more attention from
researchers” (p. 23) than that of leadership. In the early part of the 19th century, much
attention was paid to the early entrepreneurs that led the building of large companies that
would eventually evolve into the Industrial Revolution. These earliest studies could be
called “The Great Man Studies” (Short & Greer, 2002, p. 23). Mainly these studies
focused on attributes and personal qualities of these individuals. The primary idea was
that if one could study these attributes, possibly a framework could be devised to identify
specific traits that could be replicated to correlate to success.
John Hattie, in his landmark book Visible Learning (2009), which compiles over
800 different meta-analyses, draws together all of the information that we have in regards
to the effects of leadership on student achievement. Professor Hattie’s interest in the book
was purely the effect that principals have on the achievement of their students. In the
eleven meta-analyses that were studied by the researcher, there were 491 studies
included.
One of the conclusions drawn by John Hattie from this extensive research was
that in all 491 studies there were two major forms of principal leadership that

23
predominated. These forms of leadership were instructional leadership and
transformational leadership. Instructional leadership, according to Professor Hattie, was
marked by principals that were focused on clear objectives for teaching and learning,
clear ideals and beliefs about learning, and high expectations for teachers and learners.
Transformational leadership was marked by principals that felt it was more their
responsibility to inspire teachers to commitment and moral purpose, thus leadership was
more dispersed.
The end findings of John Hattie’s work were such that it was the more directive
instructional leadership style that showed a higher effect on positive student outcomes.
Professor Hattie concludes that principals that focus on student’s achievement,
supporting and fostering effective instructional strategies, and focusing more on student
achievement domains have the greatest positive effect on student learning.
There were many specific strategies that Hattie (2009) found that supported his
conclusions. The specific area that was found in the research to have the highest positive
effect on student learning was that of the principal being actively engaged in teacher
professional learning and staff development. In this case the effect was d = 0.91, where d
> 0.40 is considered significant (Hattie, 2009, p. 83). The second highest effect area was
the principal engaging in “planning, coordinating, and evaluating the curriculum” (Hattie,
2009, p. 83). In contrast the highest effect noted for a transformational type trait was d =
0.009.
Hattie (2009) also found other factors that correlated with improved student
achievement. One of the factors that had a strong correlation (r = 0.66) in the study was
the awareness of the school leader of the goals that needed to be addressed for student

24
achievement to improve. Willingness of the principal to challenge the status quo of
current reality was correlated strongly (r = .60) with improved student achievement. And
finally, a moderate correlation was found between the principals loyalty to monitoring
school practice effectiveness (r = .56) (Hattie, 2009, pp. 84-85).
Many of the 21 Leadership Responsibilities are related to relational trust and what
some researchers would call integrity. Warren Bennis, in his book On Becoming a Leader
(2009), devotes an entire chapter to what he describes as the ingredients of leadership.
Warren Bennis describes the essential ingredients that his research has found are present
in all successful leaders. The ingredients are a guiding vision, passion, integrity, trust,
curiosity, and daring. An important point that Bennis makes is that these ingredients are
not necessarily things that these leaders are born with. Many of these traits must be
learned. The basic supposition being that this means that any leader can improve their
abilities to be more successful by paying attention to these specific traits.
John Maxwell, in his book Developing the Leader Within You (1993), discusses
the importance of leadership in successful organizations. Maxwell simply defines
leadership as “influence” (p. 1). He goes on to make sure to emphasize that the way that
leaders influence others most powerfully is by the leaders actions. This has important
implications for school leaders as well. Many of the behaviors that describe the 21
Leadership Responsibilities are related to influence. Even more importantly, like Bennis,
John Maxwell is sure to emphasize the fact that we can increase and improve our
influence. This in turn provides the impetus through which a leader can increase the
leader’s leadership potential (Maxwell, 1993).

25
Instructional Leadership
According to the National Association of Elementary School Principals (2008),
the roles that a principal should address in fulfilling the role of instructional leader
include the following:
1. Leading in a way that places adult and student learning at the center of what the
school does daily.
2. Setting high expectations and standards for academic, social, emotional and
physical development of all students.
3. Demanding content and instruction that ensures student achievement of agreed-
upon standards.
4. Creating a culture of continuous learning for adults tied to student learning and
other school goals.
5. Managing data and knowledge to inform decisions and measure progress of
student, adult, and school performance.
6. Actively engaging the community to create shared responsibility for student
performance and development.
Instructional leadership requires more than just simply managing people
according to the six domains listed by the NAESP (2008). According to Richard Elmore
(2000), instructional leadership is the guidance and direction of instructional
improvement. In addition, Elmore (2000) concludes that for leadership for instructional
improvement to be effectual, the leader must use distributed leadership. In knowledge
intensive forms of work like teaching and learning, it would be impossible for a single
individual to perform the numberless tasks required to complete the process of

26
instructional leadership (Elmore, 2000). Because of the challenges that standards based
reform has brought to the site based arena of schools, instructional leaders must be able to
lean on the expertise of others to accomplish the tasks involved in improving student
achievement. Early studies into instructional leadership assumed it entirely the
responsibility of the principal for the guidance of instruction (Robinson, Lloyd, & Rowe,
2008). As more research is done, it has appeared that to successfully address the domains
that fall under the auspices of instructional leadership, the leadership responsibility must
be distributed.
Contrary to this notion, the end findings of John Hattie’s work recorded in the
book Visible Learning (2009) were such that it was the more directive instructional
leadership style that showed a higher effect on positive student outcomes. Hattie
concluded those principals who are focusing on student achievement, supporting and
fostering effective instructional strategies, and focusing more on student achievement
domains have the greatest positive effect on student learning.
There were many specific strategies that Hattie (2009) found that supported his
conclusions. The specific area that was found in the research to have the highest positive
effect on student learning was the principal actively engaging in teacher professional
learning and staff development. In this case the effect was d = 0.91, where d > 0.40 is
considered significant (Hattie, 2009, p. 83). The second highest effect area was the
principal “planning, coordinating, and evaluating the curriculum” (Hattie, 2009, p. 83). In
contrast the highest effect noted for a transformational type trait was d = 0.009.
Hattie (2009) also found other factors that correlated with improved student
achievement. One of the factors that had a strong correlation (r = 0.66) in the study was

27
the awareness of the school leader of the goals that needed to be addressed for student
achievement to improve. Whether the principal was willing to challenge the status quo of
current reality was correlated strongly (r = 0.60) with improved student achievement.
And, finally, a moderate correlation was found between the principals commitment to
monitor school practice effectiveness (r = .56) and improved student achievement (Hattie
2009, pp. 84-85).
ISLLC Standards for Principals
In addition to the standards based reform that has come to define the learning of
students in schools, many organizations have defined standards designed to govern the
role of the principal in schools. Two such groups are the Council of Chief State School
Officers and the National Policy Board for Educational Administration. These
organizations originally defined a set of standards to guide the practice of principals in
1996, and most recently updated these standards in 2008. These standards, known as the
Interstate School Leaders Licensure Consortium (ISLLC) Standards, help to define the
standards of practice for schools leaders. The ISLLC standards are used by colleges and
university training programs to train leaders with the knowledge and skills needed to
fulfill the varied roles of the principalship. The ISLLC standards are listed below.
Standard 1. An education leader promotes the success of every student by
facilitating the development, articulation, implementation, and stewardship of a
vision of learning that is shared and supported by all stakeholders.
Standard 2. An education leader promotes the success of every student by
advocating, nurturing, and sustaining a school culture and instructional program
conducive to student learning and staff professional growth.

28
Standard 3. An education leader promotes the success of every student by
ensuring management of the organization, operation, and resources for a safe,
efficient, and effective learning environment.
Standard 4. An education leader promotes the success of every student by
collaborating with faculty and community members, responding to diverse
community interests and needs, and mobilizing community resources.
Standard 5. An education leader promotes the success of every student by acting
with integrity, fairness, and in an ethical manner.
Standard 6. An education leader promotes the success of every student by
understanding, responding to, and influencing the political, social, economic,
legal, and cultural context. (Council of Chief State School Officers 2008, pp. 14-
15)
These standards provide an administrator with a framework for school Leadership
Responsibilities and form the blueprint for many of the licensure examinations that
aspiring administrators must complete for leadership licensure in many states in the
United States.
In 2003, researchers Robert Marzano, Tim Waters, and Greg Cameron conducted
a meta-analysis of school leadership including sixty-nine different studies that consisted
of more than 14,000 teacher ratings of school leadership for 2,802 principals. These
ratings were then correlated with more than 1.4 million student achievement scores on
various measures. The findings of the meta-analysis were published in the work entitled
School Leadership that Works: From Research to Results (Marzano, Waters, & McNulty,
2005). In this work, the researchers identified 21 Leadership Responsibilities with

29
statistically significant correlations to student achievement, and a list of sixty-six
leadership practices for carrying out these particular responsibilities. This work provided
a conceptual framework for the leadership of instruction (Marzano, Waters, & McNulty,
2005; Waters & Cameron, 2003). School level leadership practices were shown to have a
significant correlation with student achievement of (r = 0.25), which according to the
researchers corresponds to a ten-percentile point difference in student achievement on a
norm referenced test (Marzano, Waters, & McNulty, 2005).

30
The list of the 21 responsibilities and each responsibilities correlation to student
academic achievement are summarized in the following table:
Table 1
Twenty-One Leadership Responsibilities and Their Correlations (r) with Student
Achievement
Note. From “School Leadership That Works” by R. Marzano, T. Waters, and B. McNulty, 2005, pp. 42-43. Copyright by Association
of Supervision and Curriculum Development. Reprinted with permission of the authors.
These various responsibilities all show a moderate correlation with student
achievement. This research reflects some similar findings in a meta-analysis conducted
Responsibility Average Correlation to Student Achievement (r)
1. Affirmation 0.19 2. Change Agent 0.25 3. Contingent Rewards 0.24 4. Communication 0.23 5. Culture 0.25 6. Discipline 0.27 7. Flexibility 0.28 8. Focus 0.24 9. Ideals/Beliefs 0.22 10. Input 0.25 11. Intellectual Stimulation 0.24 12. Involvement in Curriculum,
Instruction, and Assessment 0.20
13. Knowledge of Curriculum, Instruction, and Assessment
0.25
14. Monitoring/Evaluating 0.27 15. Optimizer 0.20 16. Order 0.25 17. Outreach 0.27 18. Relationships 0.18 19. Resources 0.25 20. Situational Awareness 0.33 21. Visibility 0.20

31
by John Hattie (2009) in his work Visible Learning (2009). Both the School Leadership
That Works (Marzano, Waters, &McNulty, 2005) research and John Hattie’s (2009)
provide documentation that focus, involvement and/or knowledge of curriculum,
instruction, and assessment, and monitoring/evaluating are all important practices or
responsibilities of the instructional leader of a school (Hattie, 2009; Marzano, Waters, &
McNulty, 2005).
Focusing Leadership
Expanding on the meta-analyses of the past decade, Douglas Reeves, in
conjunction with The Teachers College at Columbia University, conducted a research
study on developing a leadership focus for schools which relates to the previously
mentioned 21 Leadership Responsibilities. The results of this study are recorded in the
book Finding Your Leadership Focus: What Matters Most for Student Results (Reeves,
2011). According to the researcher, it was found that the three responsibilities most
highly correlated with improved student achievement were focus, efficacy, and
monitoring (Reeves, 2011).
By “focus” the study refers to the school leader’s ability to prioritize and monitor
no more than six instructional priorities, within a given point in time, that have a high
leverage capacity on student achievement (Reeves, 2011). The researcher has defined
“monitoring” as the methodical evaluation of the actions of the adults in the school
building and the affect of these actions on student achievement. The research found that
monitoring needed to be timely, and at a minimum of once per quarter. The final area of
importance found to be most closely related to improved student achievement was
“efficacy.” Efficacy was defined in the study as the collective belief of the teachers,

32
administrators, and other staff in the building that their actions were the major influences
on the academic accomplishment of the students in their school.
This latest research provides a narrowing of the needed focus of school leaders to
help combat the overwhelming assault on the finite amount of emotional and physical
energy of educators. This is provided in an attempt to combat a serious issue that the
researcher called “initiative fatigue.” According to Douglas Reeves (2011):
Initiative fatigue is the tendency of educational leaders and policymakers
to mandate policies, procedures, practices that must be implemented by
teachers and school administrators, often with insufficient consideration of
the time, resources, and emotional energy required to begin and sustain the
initiatives. (p. 1)
This research reaffirms many of the findings from previous studies like the one of
Marzano, Waters and McNulty (2005) on the affect of certain leadership
responsibilities and their affect on student achievement. It further asserts that
school leadership does have a quantifiable impact on student achievement.
Resistive Forces to School Leadership
One of the major forces of resistance to differing school leadership is that for the
past thirty years schools have ultimately been halls of isolation for teachers (DuFour,
DuFour, & Eaker, 2008). These researchers would argue that this common practice itself
can be a source of resistance as teachers begin to experience something that is foreign in
the form of the expectation of sharing practices, strategies, and data with colleagues.
Mike Schmoker (2006) goes so far as to imply that teachers have been insulated from
outside inspection or interference because of this “culture of privacy and non-interference

33
that is the best friend of the status quo” (Schmoker, 2006, p.14). Another study by Fulton,
Yoon, and Lee (2005) concluded similar findings in that the most troublesome resistive
force to schools improving to more effectively offer students opportunity to master
twenty first century knowledge and skills is the isolation of individual teachers in their
classrooms. In addition, the sheer number of educational initiatives themselves may be
enough to cause resistance (Reeves, 2010). Douglas Reeves in his newest work,
Transforming Professional Development into Student Results (2010), calls this
phenomenon “initiative fatigue” (p. 27). The researcher holds that with each new
initiative the participants must expend a finite amount of emotional energy up to the point
they may have no more to expend. This can be a source resistance to leadership efforts.
Practices of Schools that Foster High Achievement
Douglas Reeves did a report on common characteristics of high performing
schools entitled High Performance in High Poverty Schools: 90/90/90 and Beyond
(2004). The results of this study showed that regardless of race or socioeconomic status,
there are certain practices that can be replicated to increase student achievement in the
areas of mathematics and language arts (Reeves, 2004). The characteristics that led to
statistically significant higher achievement in the areas of math and language arts are:
1. A clear focus on academic achievement,
2. Clear curriculum choices,
3. Frequent assessment of student progress and multiple opportunities for
improvement for the student,
4. An emphasis on nonfiction writing, and
5. Collaborative scoring of student work. (Reeves 2004, p. 3)

34
Reeve’s (2004) research has been replicated and was also corroborated by the
research of Robert Marzano in his book What Works in Schools: Translating Research
into Action (2003). Marzano terms clear curriculum choices as being a “guaranteed and
viable” curriculum that is offered to students in high achieving schools (p. 22). The
curriculum being “guaranteed” relates to the idea that it is an aligned common curriculum
focused on the standards that students need to master in order to gain the knowledge,
skill, and dispositions necessary for them to be successful. Marzano also states that there
is a need for collaboration during the development of this curriculum to ensure that all
students in the school have an opportunity to learn these important skills. This process is
too important to be left up to individual teachers working in isolation which can lead to
gaps in students learning (Marzano, 2003).
In addition, according to Marzano, the curriculum must be “viable.” That is the
curriculum must be developed in such a way as to ensure that students can master the
curriculum in the allotted time that students have to interact with or learn the curriculum
(Marzano, 2003). In Marzano’s research, he found that for a student to cover all of the
standards in the documents found at the national level and on the average state level
standards documents, that schooling would have to be extended from kindergarten
through grade twelve to kindergarten through grade 22 (Marzano, 2003).

35
High Quality Instruction for All
In schools where isolation is the norm, students are not very likely to receive the
same opportunity to learn the same curriculum even in the same grade and the same
course. Robert Eaker (2002) put it this way, “The traditional school often functions as a
collection of independent contractors united by a common parking lot” (p. 9). Marzano
(2003) also warns of the dangers of teachers not being on the same page when there is no
consensus over what should be taught. This is apparent in many situations today when
students are considered to be at the mercy of the luck of the draw when it comes to the
teachers that they receive and the quality of instruction that they can expect. McLaughlin
and Talbert (2001) referred to this phenomenon as being like an instructional game of
chance in which a student’s opportunities to learn will depend mainly on the teachers that
they are assigned to from year to year.
This fact again makes the case for effective collaboration of teachers even more
important. DuFour (2010) states in Raising the Bar, Closing the Gap that only when
teachers work together in the form of “co-laboring” (p. 181) will they be sure to have the
right focus for selecting and putting together what Marzano (2003) called a “guaranteed
and viable curriculum” (p. 22). Researcher John Hattie (2009) asserts the importance of
teachers knowing the learning goals of the content they are teaching. Larry Ainsworth
borrows the term “Power Standards,” from Douglas Reeves, in his book Power
Standards: Identifying the Standards that Matter the Most (2003) for those segments of
the content that all teachers in the school collaboratively agree on that must be taught to
mastery by all students. This collaboration and teaming on agreed upon outcomes lends

36
itself to equal opportunity in all classrooms in the school for students to have the
opportunity to learn the valuable knowledge, skills, and dispositions that they will need.
As previously noted with the citation of John Hattie’s work in Visible Learning
(2009), the principal must have a focused role in instructional leadership. Of the 491
studies that were included in the meta-analyses that John Hattie synthesized,
overwhelmingly, a more directive approach to leadership was found to be more effective
(Hattie, 2009). Once again, Professor Hattie concluded that principals that focus on
student’s achievement, supporting and fostering effective instructional strategies, and
focusing more on student achievement domains have the greatest positive effect on
student learning.
Focusing on the Right Work
As schools strive to improve through the collaboration of staff it is important that
they focus on the right work. The collaborative identification of the power standards is a
first step in this process (Ainsworth, 2003). Once these standards have been defined, it is
important that teachers collectively decide on the pacing and sequencing of content. In
looking at the research on professional learning communities, this is most effectively
done in collaborative teams by teachers teaching similar content or grade levels. Next, the
teachers develop common formative assessments to determine if students are learning the
content. The formative assessments are used as assessments for learning not simply to
assign grades (Stiggins, 2007). Again, collaboration is central to this process.
Finally, once the common formative assessments have been developed and
proficiency has been defined, the assessments are then given by all teachers to all of the
students in that particular course. Data is collected and the results are analyzed.

37
Collectively, teachers go item by item and competency by competency and note
proficiency and the lack thereof (Ainsworth, 2008). Based on these results adjustments
are made to instruction. Mike Schmoker (2006) as well as Robert DuFour (2008) makes
the case that this process of collaboration and collective inquiry holds the keys to
effective schooling and increased student achievement.
Professional Leaning Communities
A professional learning community is a conceptual framework for schools that
focuses on the following basic big ideas (DuFour, DuFour, & Eaker, 2008):
1. The true purpose of schools is to ensure that all students learn at high levels.
2. Collaboration is a must if educators are to accomplish the goal of educating all
students.
3. Schools must use data to determine if students are learning and then make
sure to follow-up with intervention and prevention measures when the data
indicates that the students are not learning.
Researchers DuFour, DuFour, Eaker, and Many (2006) define a professional learning
community as educators with a commitment to work in collaboration with one another in
continuous processes of investigation and action research to achieve improved results for
students. Professional learning communities assume that the most effective way to insure
that learning is improved for students is to mirror that with effective learning for
educators.

38
Data-Driven Decisions
Research tells us that to make informed decisions; educators have to look at
measurable outcomes objectively. In Jim Collin’s book Good to Great (2001), he called
this aspect of making data driven decisions the “Stockdale Paradox” (p. 83). Collin’s
asserted that it is not enough to just look at data in and of itself, but one must be willing
to “confront the most brutal facts about the current reality, whatever they might be” (p.
86). In addition to this paradigm, Douglas Reeves in his book, Accountability for
Learning (2004), shared that in making data driven decisions we must be just as
concerned with cause data, which are the actions of the teacher, curriculum, leadership
decisions, and many other variables that can have overwhelming impact data gathered
from test scores. Reeves (2004) contended if we do not consider these data effects on
student outcomes then we are truly not learning or leading effective practices.
Lucky
High Results, Low Understanding of Antecedents
Leading
High Results, High Understanding of Antecedents
Losing
Low Results, Low Understanding of Antecedents
Learning
Low Results, High Understanding of Antecedents
Figure 1. Leadership and Learning Framework From “The Learning Leader: How to focus school improvement on better results” by Douglas Reeves, 2006, p. 24. Copyright 2006 by Association of Supervision and Curriculum Development, Reston, Virginia. Reprinted with permission of the author.
According to the research, the essence of making data-driven decisions is based
on looking not only at the student achievement results (i.e., standardized test scores), but
also to look at the cause data (i.e., leadership decisions) for these effect outcomes. Using
Ach
ieve
men
t of
Res
ults
Antecedents of Excellence

39
the matrix allows one to track and understand how specific adult actions influence
student achievement.
Formative Assessment
In conjunction with the research base of data driven decision making, formative
assessment has also been a concept that has helped schools make drastic improvements in
the achievement of students. According to Stiggins (2002), this form of assessment is
considered “assessment for learning,” and not just simply “assessment of learning” (p.
83). This strategy has been seen as having so much possibility through research that after
reviewing 250 studies from around the globe that were published between 1987 and
1998, Black and Wiliam found that assessment for learning produced a statistically
significant increase in student achievement when used appropriately. Additionally, John
Hattie (2009) found that providing students formative evaluation had an extremely
positive effect size (d = 0.90, where d > 0.40 is considered a strong effect) on student
achievement.
The concept of common formative assessment is central to the collaboratively
formed assessments so present in DuFour’s (2008) “Professional Learning Community”
concept. These types of assessments require ongoing collaboration opportunities for
grade level, course, and department teachers within schools. Results on these assessments
provide predictive value as to how students are likely to achieve on each succeeding
assessment in real time so that teachers can make instructional modifications during
instruction (Ainsworth & Viegut, 2006). John Hattie (2009) and Marzano, Waters, and
McNulty (2005) also noted that knowledge and involvement of the principal in matters of

40
curriculum, instruction, and assessment has a positive effect (r = .48) on student
achievement.
System-Wide Intervention
Another important characteristic of high performing schools is how these schools
react to students when the students do not learn. Richard DuFour (2010) in his book,
Raising the Bar: Closing the Gap, spends a great deal of time discussing the concept of
system-wide intervention for students that are experiencing difficulty in achievement and
behavior. One type program of system-wide intervention that has become popular over
last nine years is called Response to Intervention (RtI). According to the National Center
on Response to Intervention (2006), RtI is steeped in history and empirical research that
supports many of the elements that are embedded in the process. It is based on a national
understanding that the No Child Left Behind Act (NCLB, 2001) and the Individuals with
Disabilities Education Act (IDEA, 2004) are companion laws dictating the use of
scientifically-based research (SBR) curricula/instructional practices and setting high
expectations for improvement for all students, including those with disabilities. Each
element of RtI is part of an interrelated process, which must be applied to every student.
According to DuFour (2010), this provides another opportunity to ensure the greatest
possible outcomes for students through the application of a system-wide program of
intervention based on solving student problems collectively and utilizing all available
resources. This is the intention of the RtI process.

41
Challenge of the Cultural Change
Educational improvements that do not result in the changes becoming part of the
culture of the organization have been found by researchers to be futile at best. As Roland
Barth (2001) wrote, “The culture is the historical transmitted pattern of meaning that
wields astonishing power in shaping how people think and act” (p. 8). Every school has a
culture, and historically, most schools have exhibited cultures of isolation (Chenowith,
2009). Those that wish to cultivate a collaborative culture must be intentional in
processes they take to impact practice. In the article “What Being a Successful Principal
Really Means” (2008), author Christopher Day, with an analysis of the international
literature states seven research-based axioms in regards to the importance of principal
leadership and the culture of a school.
The research results shared by Day (2008) are listed below.
1. School leadership ranks only second to classroom instruction as a major influence
on student learning in schools.
2. Nearly all school leaders in one form or another have to do some work towards
re-culturing their organization in some way.
3. Leaders tailor the leadership practices they employ to the present reality.
4. Principals affect improvements on teaching and learning in an indirect fashion,
thus they must have a strong affect on the culture of the organization.
5. To have the most influence, school leadership is distributed.
6. Some forms of distributed leadership are more closely aligned with positive
outcomes for student achievement.

42
7. Most successful school leaders are ready to learn, open-minded, persistent,
flexible, and optimistic.
Each one of these findings is closely related to the culture of the school (Day,
2008). Cultures are not easily changed because they are forged based on strong beliefs
and actions that have characterized the everyday workings of schools. The change that
must accompany a change in culture is a change that requires a break with many of the
known customs and mores of the current reality within a school.
Transitioning from Isolation to Collaboration
On the subject of “relational trust,” researcher Roland Barth (2001) wrote, “The
relationship among the adults in the schoolhouse has more impact on the quality and the
character of the schoolhouse – and on the accomplishments of youngsters – than any
other factor ” (p. 105). According to Alan Blankstein in his book Failure is Not an
Option (2004), it takes effective leadership to transition from a culture of isolated practice
within schools to one that values the positive benefits of collaboration. This is not a
process that will take place unintentionally, and therefore, requires insightful leadership
from the school leader. In the book Reframing Teacher Leadership (2008), Douglas
Reeves asserts that to change attitudes and beliefs, one must first change behaviors. The
researcher states that in many ways we are what we do, and the only thing that we can
influence at the outset in other people is their behavior. Therefore by focusing on getting
the persons to change their behaviors first, then we can begin to change attitudes as they
experience the personal benefits brought about by the change. Other researchers (Bossidy
& Charan, 2002; Kotter & Cohen, 2002) agree that the process of changing any
organizations culture begins by the changing of the behaviors of the people in that

43
organization. According to Reeves’ research, this process is extremely important in the
area of transitioning from teachers working in isolation to collaboration. The problem
with this transition is that collaboration is not natural or common in the traditional school
culture. According to one principal that researcher Alan Blankstein quoted in his work
Failure is Not an Option (2004), “one of my teachers went into the classroom and didn’t
come out for 38 years” (p. 137). This type of isolation is not uncommon. The key is that
teachers are able to see the possible personal benefits and positive outcomes to effective
collaboration (Blankstein, 2004).
Magnitude of Change
This process is also known as a second order change because it causes those
involved to think in new ways and to look at things differently. Marzano, Waters, and
McNulty (2005) speak of second order change when they speak of the magnitude of
change. In a first order change, the change is seen as an extension of the past, within
existing paradigms, consistent with prevailing norms, and able to be implemented with
existing knowledge and skills.
This stands in stark contrast to the magnitude of second order change. A second
order change would then consist of a break with the practices of the past, exist outside
existing paradigms, even conflict with prevailing norms, and most definitely require the
attainment of new knowledge and skills (Marzano, Waters, & McNulty, 2005; Waters &
Cameron, 2003). Doug Reeves (2006) has called this resistance to the paradigm shift in
re-culturing the schools in contemporary America as the “fear of incompetence” (p. xxi).
In that when we ask persons to gain new knowledge and skills with which they are
unfamiliar, they fear the unknown and even fear appearing to be incompetent. Marzano,

44
Waters, and McNulty (2005) have deemed it second order change. Even though there is a
sense of urgency for schools to improve or face the unpleasant sanctions guaranteed with
failure in the NCLB Act (2001), many schools, many teachers, and many school leaders
are reluctant to change based on this “fear of incompetence” (Reeves, 2006).
Many educational reforms have failed to deliver the expected results. This has
been caused in part by the unrealistic expectations placed upon it by society (DuFour,
2008). No Child Left Behind (2001) now demands one hundred percent proficiency for
every student in the United States by 2014. This of course is a goal that no state or
country in the history of the world has ever achieved. This being the case, a system has
been put in place that will ultimately lead to every public school in America being
labeled a failure (DuFour, 2010). The task of changing an organization as large as the
public education system in America is a very complex undertaking. In the fifty states of
America, there are more than 14,300 school districts that operate over 95,000 schools that
teach approximately 48 million students (National Center for Education Statistics, 2005).
According to the research, the majority of these teachers and schools in many ways are
completely autonomous in the way they go about the business of educating these students
(DuFour, 2008).
Creating a Shared Mission and Vision
Another characteristic of highly successful schools are that they have a culture of
a common focus. Most researchers describe this phenomenon as these schools having
developed a common mission and vision (Blankstein, 2004). In effective schools the
mission statement is more than just an artful statement hanging on the wall, it is a
statement of why the school exists that all stakeholders have agreed upon (DuFour,

45
2008). The mission serves as a filter or a guiding principle that shapes all the work of the
school. Every decision is looked at through the scope of the mission. For this to be an
effective part of a school’s culture, all in the school must have had a hand in the
development process. The key component is the leadership provided by the school leader
to facilitate the success of this endeavor. The school leader must exhibit the Leadership
Responsibilities of focus and commitment to ensure the fidelity of this process (Marzano,
Waters, & McNulty, 2005).
In addition to the maintenance of a viable mission statement, successful learning
organizations also have a vision for the future. This relates to the commitment of
continuous improvement. According to Blankstein (2004), without a workable and
collaboratively formulated vision, decisions are often made randomly with no moral or
organizational compass. According to Reeves (2006), this can lead to inconsistency in
practices, and can lead to a scatter shot approach to school improvement. School leader
must be an integral part in the formulation of the vision just as in the process of
formulating the mission for the school (Reeves, 2006).
Learning Leadership
With the increased knowledge gained through research about the practices of
effective schools, it has become all too clear that a break with many of the practices of
the past is needed for schools to meet the new demands brought about by increased
accountability (Reeves, 2006).
When changes require a break from past practices they are referred to as a second-
order change. According to the work of Marzano, Waters, and McNulty (2005) and

46
Hattie (2009), the Leadership Responsibilities' most related to the success of a second-
order change are the following:
1. Knowledge of Curriculum, Instruction, and Assessment
2. Optimizer
3. Intellectual Stimulation
4. Change Agent
5. Monitoring/Evaluating
6. Flexibility
7. Ideals/Beliefs.
In this research, the studies showed that it is critical that the school leader have an
in-depth “knowledge about curriculum, instruction, and assessment” (Marzano, Waters,
& McNulty, 2005, p. 84). The leaders’ ability to provide conceptual modeling and
understanding to these areas are critical to the success of these important aspects of
schooling. In addition to knowledge, the leader must also help be the driving force behind
improvement. This encompasses the role of “optimizer.” The leader also must accept the
responsibility of leading discussion and study of the concepts of effective schooling
amongst all stakeholders. Providing this “intellectual stimulation” for faculty and staff is
a great duty of the school leader. Being willing to challenge the status quo is related to
the role of “change agent.” Monitoring/evaluating all aspects of the school, being
directive and non-directive as the situation dictates, and operating in a manner consistent
with the school leaders ideals and beliefs are all critical responsibilities in leading for
learning (Marzano, Waters, & McNulty, 2005).

47
Collective Learning and Data Teams
Allowing time for effective teacher collaboration is an essential ingredient for
increased levels of effective learning (Reeves, 2006). Even more important, is effective
collaboration in which teachers actually have the opportunity to focus on the collective
scoring of actual student work. This process provides teachers an opportunity to develop
a common definition of proficiency, identify strengths and obstacles to learning, and
collectively decide upon strategies to highlight and build upon strengths and develop
action plans aligned to addressing and overcoming obstacles to learning (Reeves, 2006).
DuFour (2008) calls these teams of teachers working together within a school to
collectively inquire into best practices about teaching and learning, clarify their current
practices, and honestly assess their students’ current levels of learning, “Professional
Learning Community” teams. Douglas Reeves (2006) calls these groups of teachers
“Data” teams (p. 103). The common thread is a group of educators with a focused
commitment to continuous improvement.
Support for an Action Oriented Culture
One of the world’s leading organizational theorists, Peter Block (2003), contends
that many organizations are frozen by the question, “But how do we do this?” (p. 35).
Block (2003) makes the assertion that this question can be used as a defense for not
acting. This type of response is contrary to what researchers call an “action oriented”
culture. The researchers Pfeffer and Sutton (2000) also made the assertion that many
organizations often substitute training for doing when it comes to improving their
organization. These researchers found that the most successful companies had an “action
oriented” culture, whereby they “learned by doing” (Pfeffer & Sutton, 2000, p. 243).

48
According to DuFour (2008), this provides great support for an “action oriented” culture
in schools supported by the instructional leader of the school. The action orientation is
brought about in schools by articulating specific collective commitments that help people
shift from ideas to actions. This is one of the underlying assumptions of the “Professional
Learning Community” (DuFour, 2010).
The collaborative development of effective goals also contributes to the advance
of an action-oriented culture in schools. These goals should be SMART, according to
Conzemius and O’Neill (2005). This means that the goals should be Specific,
Measurable, Attainable, Results-Oriented, and Time-bound if they are to be used to guide
action.
Commitment to Continuous Improvement
A culture focused on continuous improvement in an organization is a concept
based on the Japanese term kaizen, which loosely means incremental improvement
(“Kaizen,” 2010). According to Deming (1986), any leader of an organization should
make sure that the goals of that organization guide the workings of that company by a
continuous focus and revisiting of these goals. Research shows that schools that are
positively impacting student achievement have a continued commitment to improvement
(DuFour, 2008). According to the research of successful schools by DuFour in Raising
the Bar and Closing the Gap (2010), “The perpetual disquiet and constant search for a
better way that characterizes these schools results from the continuous improvement
processes that are embedded in the routine practices of the school” (p. 83).

49
Effective School Improvement
We have discovered a great deal of information over the last forty years in regards
to effective schooling. With the work of John Hattie (2009), Robert Marzano (2003), and
Douglas Reeves (2006) the research supports the following conclusions:
1. The actions of the adults in the school matter. This includes the leadership
and teaching that takes place in schools.
2. Some leadership actions show significant links to improvements in student
achievement and equity in education across varied demographics.
3. Leadership in schools is more than a unitary skill set; it is a dynamic
activity in schools. (Reeves, 2006, pp. xxiii-xxiv)
Robert Marzano (2003) completed a meta-analysis covering the last 35 years of
education research, in which he identified eleven factors that school leaders could use as
a guide to improve schools effectiveness. The research showed that by addressing the
school-level factors of developing “A Guaranteed and Viable Curriculum,” setting and
providing “Challenging Goals and Effective Feedback,” fostering “Parental and
Community Involvement,” insuring a “Safe and Orderly Environment” and maintaining
“Collegiality and Professionalism” that a school leader could positively impact student
achievement (p. 15).
In addition to the five school-level factors, Marzano (2003) also found that at the
teacher-level the factors of using effective “Instructional Strategies,” effective
“Classroom Management,” and the proper “Classroom Curriculum Design” could all
have positive impacts on student achievement (p. 71). These are three additional areas a
school could look to improve and begin total school improvement.

50
Finally, Marzano (2003) addressed three student-level factors that were found in
his meta-analysis that had the least impact of the eleven on student achievement. The
three student-level factors are conducive “Home Atmosphere,” the student’s “Learned
Intelligence and Background Knowledge,” and the level of the student’s “Motivation” (p.
123). These are all areas that school leaders can explore that have shown positive
correlation to improved student achievement.
This list of eleven factors can form the basis for an effective school improvement
strategy. Marzano asserts in his book about the research, What Works in Schools (2003),
that the one factor that was separated from the list of factors because of the strength of
that one factor on all the others is “Leadership.” Like Marzano (2003), other researchers
(Scheerens & Bosker, 1997; Teddlie & Reynolds, 2000) contend that leadership can be
considered the solitary most significant factor in effective school reform. It affects all
aspect of schooling at all levels.
Summary
As documented in this literature review, when comes to the school leaders’
impacts on student achievements and the initiatives that may be undertaken in schools to
improve student achievements, the research clearly supports the fact that the leadership
provided by the administrator has a significant impact (Marzano, 2003). As schools have
faced the challenges brought about by the increased requirements in the No Child Left
Behind (2001) legislation, never before has the school leader’s role been more critical.
Supporting the improvement of schools requires the administrator to accept the
duty of performing the 21 identified Leadership Responsibilities developed by Marzano,
Waters, and McNulty (2005). This dissertation study aimed to ascertain if leadership of

51
the principal displayed in the form of actions similar to the 21 Leadership
Responsibilities, identified by other researchers, may be correlated with high student
achievement as measured by state standardized tests. Also, this study will seek to explore
if any of these Leadership Responsibilities may be associated with improved scores on
these same assessments.

52
CHAPTER III
METHODOLOGY
Introduction
The purpose of this chapter is to overview the research design the researcher used
for this research project. Research questions in conjunction with the research hypotheses
are communicated with the methodology in which they were tested. The research
procedures, instrument, and participants are projected in this chapter.
Research Questions
Leadership is complicated and dynamic. According to Douglas Reeves in The
Learning Leader (2006), “Leadership is about change---how to justify it, implement it,
and maintain it” (p. 158). The researcher sought to understand in this study which of
these identified and quantifiable Leadership Responsibilities is related to success in
developing effective practices in schools which in turn lead to improved student
achievement. This research did address the following research questions:
1. Is there a relationship between a school principals’ and teachers’
perceptions of the principals’ demonstration of Leadership
Responsibilities as measured by the leadership aggregate score on a survey
instrument related to the 21 Leadership Responsibilities?
2. Is there a relationship between the school principals’ leadership score on
the survey instrument and school achievement on Algebra I, Biology I,
English II, and United States History Area Tests as measured by the
Mississippi Subject Area Tests as reported in the form of the QDI score

53
for the school, controlling for the percent of free and reduced lunch
students?
3. Is there a relationship between the school teachers’ perceptions of the
principals’ demonstration of Leadership Responsibilities as measured by
the leadership score computed from this survey instrument and school
achievement based on the school QDI score as measured by the
Mississippi Subject Area Tests, controlling for the percent of free and
reduced lunch students?
4. Are there differences between school principals’ and teachers’ perceptions
as measured by the leadership score computed from this survey instrument
related to school achievement as measured by the QDI score, controlling
for the percent of free lunch students?
Research Design
The proposed methodology for this study is a regression analysis that did include
a survey instrument and a look at the archival test data, including the assigned MDE
accountability achievement level, for the school years 2009-2010. The building level
principals and the teachers of 245 identified schools in the Southeast were given a survey
related to the 21 Leadership Responsibilities identified by Marzano, Waters, and
McNulty (2005) in the School Leadership that Works study. Variables considered in this
research study include principal adherence to the 21 Leadership Responsibilities as self-
reported by the principals and reported by teachers, school demographics, and school
principal characteristics. Principal ratings of effectiveness and demonstration of the 21
Leadership Responsibilities from the work of Marzano, Waters, and McNulty (2005) in

54
McREL’s Balanced Leadership Framework were measured by self-reported survey by the
principals’ themselves in the form of an aggregate leadership score. In addition, teachers
were surveyed to determine their evaluation of the school leaders’ demonstration of the
21 Leadership Responsibilities. The scores on assessments in Algebra I, Biology I,
English II, and United States History as reported by the MDE through QDI and the
overall school accountability level rating for 2009-2010 was analyzed after permission
had been granted by the IRB from The University of Southern Mississippi and the
prospective superintendents.
The principal demographic characteristics that were studied were gender,
ethnicity, years at current school, and years of administrative experience. School level
demographics that were considered in this study were location, school enrollment, grade
levels, and socioeconomic status as defined by the percentage of students that eat free or
reduced lunch.
Participants
Building level supervising principals and the teachers of 245 identified high
schools in the Southeast were offered opportunity to participate in the survey related to
the 21 Leadership Responsibilities identified by Marzano, Waters, and McNulty (2005)
in the School Leadership that Works study. This represented all of the schools in the state
of Mississippi that are held accountable for the state mandated graduation exams of
Algebra I, Biology I, English II, and United States History reported in the form of the
Quality Distribution Index (QDI) and the Mississippi accountability label (MDE, 2010).
Permission was obtained from the district superintendents of the districts selected
for the study. Superintendents had to acknowledge their willingness for the identified

55
schools in their prospective districts to participate in this study. Once this permission was
obtained, the letters containing the link for the survey for this research project were
provided to the schools. The results of all the surveys were collectively analyzed.
Additionally, schools were sought that were representative of the seven
accountability levels according to the MDE to help control for the co-variable of percent
of free lunch students. Research such as Douglas Reeves work with 90-90-90 Schools
(2004) corroborates that poverty certainly has a negative impact on student achievement.
It was the goal of the researcher to control for that variable in this study.
The seven accountability levels include the following: Star School, High
Performing School, Successful School, Academic Watch School, At Risk of Failing
School, Low Performing School, and Failing School.
Table 2
School Accountability Types
Level of School
N
Mean QDI
Star 20 216.7 High Performing 45 193.3 Successful 80 166.1 Academic Watch 55 141.2 At Risk of Failing 32 116.0 Low Performing 2 94.0 Failing 11 87.7 Note. Source: MDE, 2011

56
Instrumentation
The survey instrument proposed to be used in this study was created by the
researcher. It contains 47 items, which includes six demographic items. The remaining 41
items are related to behaviors consistent with the demonstration of the 21 Leadership
Responsibilities described by Marzano, Waters, and McNulty (2005) in the book School
Leadership that Works and the McREL Balanced Leadership Framework by Waters and
Cameron (2003). A pilot study was conducted in which this instrument was reviewed by
a panel of experts to help evaluate the reliability and face validity of the instrument.
The credentials of the experts used for the pilot study included the holding of a
Ph.D. either in the field of Educational Leadership or in field of Research and Statistics.
In addition, the majority of these experts had held positions of leadership in schools
ranging from supervising principal to superintendent. Lastly, these experts were familiar
with research of this type and instruments that would be used for this type of study as all
of them were practicing faculty on the university level.
Preliminary review of the survey instrument was conducted by a panel of experts
for face validity. These experts agreed that on the face, the instrument appeared to be
valid. The experts did concur that the survey needed be shortened in the number of items.
Also, the experts stated that in their opinion, there needed to be some negative statements
included in the survey. Initially, there was one negative statement per 21 leadership
responsibilities. After receiving the feedback from the panel of experts, this number was
reduced to five on the recommendation of the panel of experts.
Pilot study participants included teachers and secondary administrators. In the
course of this pilot study, participants were asked if the items on the survey were clear to

57
them as they were written. Eight out of 10 agreed that the items were clear. Also, pilot
study participants were asked if they perceived the items in the survey as relevant to the
stated purpose of the research study. In addition, participants were asked if they were able
to glean from the questions on the survey, “What do you believe this survey is
measuring?” Upon completion of the pilot study, 100% of the participants in the pilot
study related the items to the study of school leadership.
In addition, seven out of ten respondents believed that the survey needed to be
shortened from 66 items on the behavioral portion. This was done by reducing the
number of items from the original number of 66 items to 41 items. For all but one of the
domains, “Monitoring and Evaluating,” this new format included two behavioral
descriptions per the remaining 20 leadership behaviors.
When presented to the pilot study participants once again as a panel of experts,
the participants felt that the new format was very user friendly. They also stated that the
shorter format would, in their opinion, provide for a higher response rate from
participants in the study being that the survey would now take less time to answer. The
pilot study participants also stated they believed that this reduction in items removed
many redundant items that had been present in the original survey.
To test for the internal consistency reliability of the survey, a Cronbach’s alpha
(or α) test was conducted on the survey instrument. Data from the pilot study was entered
into the statistical program SPSS for analysis. According to Neil Salkind (2010), when
the Cronbach’s alpha is computed, the results “correlate the score of each item with the
total score for each individual” (Salkind, 2010, p. 147). In addition, the test compares that
total score for each individual to the variability for all of the individual item scores. The

58
score for the Cronbach’s alpha measured an α = .930. According to Salkind (2010), the
ideal is that the coefficient be positive, and that it be as close to +1.00 as possible. This
score received on this test would indicate a high level of internal consistency reliability.
Procedures
The survey was delivered to participants via the online survey creation site of
Survey Monkey. Participants, including supervising principals and teachers, were
provided the link to the survey by the superintendent’s of their school district. This link
was sent to the superintendent’s of each individual school district on a letter that was
included with all of the directions for the survey use. Different schools received varying
survey links corresponding to their accountability levels. For example, “Star Schools,”
the highest rated schools in the MDE accountability rating system, were provided a
distinct link to the survey from the other six accountability levels. In so doing, the
responses are able to be observed for the different levels of schools. At the same time,
responses within these groups are able to be filtered by their response to question number
six on the survey in such a way that teachers and principals of specific schools were able
to be analyzed separately for comparison.
Analysis of Results
Descriptive Statistics for the following variables were tabled: 21 Leadership
Responsibilities, principal self-reports, teacher evaluations of principal, MDE
accountability level, percent of students eating free lunch in the school, differences
between teacher and principal perceptions, mean, standard deviation, range, skew, tenure
of the principal, number of students, number of teachers, and grade levels. Where
applicable, Data was entered into the statistical program SPSS for analyses in order to

59
determine whether there was a relationship between leadership practices and the
incidence of higher student achievement on the state assessments. In addition, the
following analyses were performed as a part of this research study project:
1. In order to determine whether there was a relationship between teacher ratings of
principals, and principals’ self-ratings on the leadership score, and whether
similarity of ratings differs by domain, a Pearson Correlation was conducted.
2. In order to determine whether principal perception of their demonstration of the
21 Leadership Responsibilities as measured by the leadership score computed
from this survey instrument is related to school performance, a regression of
school performance (MDE Accountability Level) onto the leadership scores,
controlling for percent of free lunch, was conducted.
3. In order to determine whether teacher perception of the principals’ demonstration
of the 21 Leadership Responsibilities as measured by the survey leadership score
is related to school performance, a regression of school performance (MDE
Accountability Level) onto the 21 leadership domains, controlling for percent of
free lunch, was conducted.
4. In order to determine whether differences between teachers’ and principals’ on
ratings of leadership are related to school performance, school performance was
regressed onto differences on each domain between principal and teacher ratings,
controlling for percent of free lunch.
Following regression analyses, leadership profiles for schools in the different school
accountability levels may be graphed if there is a statistically significant difference
amongst the ratings of certain domains between the principals and the teachers for a

60
school. These graphs were intended to provide a visual representation of leadership
differences between schools as it relates to performance of these schools.
Accountability levels assigned to the school assigned to the schools in the form of
the overall accountability level rating reported by MDE was also considered in this
analysis. It was the goal of this analysis to determine if there was a relationship of any of
the particular leadership domains and higher student achievement which would
correspond to a higher overall school accountability level rating by MDE.
Through regression analyses the researcher did attempt to control for the co-
variable of the percent of students in the school receiving free or reduced lunch in the
various selected schools. Schools from each of the various accountability levels were
used in the sample to help ensure good representation of high, mid, and low performing
schools.
Summary
The purpose of this study was to help determine if instructional leaders perceived
practices and actual leadership practices, as reported by teachers, have helped to foster an
improvement in student academic achievement in secondary schools as measured by state
assessments. Schools from across the state were requested to participate in this study. It
was the hope of the researcher that this would then lead to a narrowed set of practices that
may be explored by school leaders that have been positively associated with
improvement in student academic achievement of secondary schools as measured by the
Mississippi Subject Area Tests and indicated by schools higher QDI and or overall school
accountability performance levels as reported by MDE.

61
In order to determine whether there was a relationship between teachers’ ratings
of principals and principal self-ratings on the 21 domains survey and whether similarity
of ratings differs by domain, a difference score was calculated between the teachers’
perception aggregate score and the principals’ aggregate score. Once this difference score
was obtained, a regression was performed with these different scores controlling for the
co-variable of free and reduced lunch. QDI was the dependent variable in these analyses.

62
CHAPTER IV
RESULTS
Introduction
The purpose of this quantitative study was to compare the perceptions of
principals’ self-reported leadership scores on a leadership survey designed around the 21
Leadership Responsibilities identified by McREL with the perception of teachers’
perceived leadership scores of the principal from the same school on the same survey.
Researchers Marzano, Waters and McNulty (2005) found a mean significant correlation
(r = .25) on the 21 Leadership Responsibilities when correlated to student achievement.
This work is recorded in the book School Leadership that Works: From Research to
Results (Marzano, Waters, & McNulty, 2005). In addition, these perceptions were
compared with the Quality Distribution Index (QDI) which a part of the new
accountability system for the state of Mississippi that became Mississippi’s way of
labeling schools in regards to student performance (MDE, 2007).
The QDI score which ranges from 0 to 300 is used in conjunction with the growth
composite component to assign schools in Mississippi one of the following seven
accountability labels: Star, high performing, successful, academic watch, at risk of
failing, low performing, and failing. The “Star” school designation is the highest level of
achievement a school can attain within this system, while the lowest ranking school is
labeled with the “Failing” label.
All 152 school districts were contacted by email and the United States Postal
Service mail in the form of a letter to the superintendent of education for participation in
this study. Since this study was limited to those schools that taught the secondary courses

63
of Algebra I, Biology I, English II, and United States History, the total number of
possible schools that could have participated in this study was 245 schools (MDE, 2010).
These schools where targeted for the fact that this study focused on how leadership
perceptions of the principals and teachers affected secondary student achievement which
was measured by using both the QDI calculation and the accountability label assigned to
the secondary school.
Of the 152 districts contacted, 25 districts responded that they would give
permission to participate in this research study. Another 10 districts declined participation
in the study. The consent was given in writing and these letters were received by the
researcher from the superintendent of each participating district. The number of high
schools in these 25 districts equaled to 40 schools housing the secondary subjects that
were a part of the secondary QDI and accountability label calculations. Of the 40 schools
in this group of 25 districts, 39 of the 40 high schools responded.
Initially, the number of high schools participating in the study after the initial
letter to the superintendent taking part in the online survey consisting of 47 items was 25
schools. A second email sent to the individual principals of each high school with the
survey link on the Survey Monkey Online Survey site accompanied by phone calls to
many of these principals increased the response rate by 14 more schools to get to 39
schools total participating.
Of the 39 schools participating, four of the schools were labeled with the “Star”
designation, seven were labeled as “High Performing,” 11 were labeled “Successful,”
nine were labeled “Academic Watch,” five were labeled “At Risk of Failing,” zero were
labeled “Low Performing,” and two were labeled as “Failing” schools.

64
Descriptive Statistics
There were a total of 39 principals that completed the seven demographic items of
the survey instrument which were items 1 through 5. Demographics are reported by the
researcher as reported by the principals. Even though the teachers were asked the same
questions in regards to the principals’ demographics, the demographics as self-reported
by the principals were felt to be more reliable.
Table 3
Principal Demographics
Variable N Percent Gender Male 34 87.2
Female 5 12.8
Ethnicity African American 11 28.2
White/Caucasian 28 71.8
Years at Current School 1-2 2 5.1
3-5 6 15.4
6-10 10 25.6
11-15 7 17.9
16-20 9 23.1
21+ 5 12.8
Years as Principal 3-5 19 48.7
6-10 10 25.6
11-15 5 12.8
21+ 5 12.8

65
Table 3 (continued). Variable N Percent Grade Levels of School 9-12 25 64.1
7-12 5 12.8
K-12 9 23.1
The number of teachers responding to the survey ranged from a minimum of two for one
school to a maximum of 19. Again the teachers scored the principal on the same
instrument as was provided to the principals for this study.
The scores used for analysis was an aggregate score obtained by adding all
responses to obtain one score for each teacher from each school. This was done only after
survey items number 15, 19, 26, 34, and 42 were reversed as these items had been
included as items to be answered in reverse order on the Likert four-point scale as
compared to the other 36 items on the leadership score section of the survey instrument.
The same process was repeated to obtain an aggregate score for the principals of each
school as well.
Descriptive statistics for school QDI were recorded with a minimum score of 80
and a maximum score of 213 (n = 39, M = 159.41, sd = 33.105). The following table
summarizes the descriptive findings for the seven accountability labels.
Table 4
Descriptive Statistics for Different Accountability Labels
Accountability Label n M sd Minimum Maximum 1 Failing School 2 87.50 10.607 80 95 2 Low Performing School 0

66
Table 4 (continued).
Accountability Label n M sd Minimum Maximum 4 Academic Watch School 9 143.56 9.449 130 159 5 Successful School 11 163.91 15.764 138 187 6 High Performing School 8 190.88 9.702 176 208
7 Star School 4 205.75 5.252 201 213 Total 39 159.41 33.105 80 213
Statistical Analysis
In regards to research question 1: Is there a relationship between school
principals’ and teachers’ perceptions of the principals’ demonstration of Leadership
Responsibilities?
The analyses for this question consisted of a Pearson Correlation comparing the
leadership aggregate score of the principal’s self-report with that of the leadership
aggregate score as scored by the teacher on the same survey instrument. This analysis
yielded a significant correlation with an r (39) = .484, p = .002. The mean score for the
principals leadership perception score was (M = 3.53, sd = .4566), while the mean for the
teachers leadership perception score for the principal was (M = 2.59, sd = .5541). The
results of this test show that on the average, the principal’s score was nearly one whole
point higher than the score the principal was given as indicated by the teachers’
leadership perception aggregate score mean.

67
In addition to the Pearson Correlation a Paired Samples t-test analysis using the
principals leadership aggregate score mean was compared with the teachers leadership
aggregate score mean to yield a significant difference (t(38) = 11.125, p ≤ .000) in the
perceptions of the principals leadership aggregate score in comparison to that of the
teachers’ leadership aggregate score for the principal.
Table 5
Comparison of Mean Leadership Aggregate Score of Principals with That of Teachers
Leadership Score n M sd t df p Principal Perception 39 3.5253 .4566 11.125 38 .000 Teacher Perception 39 2.5988 .5541
These results in regards to the research question as to whether there is a
relationship between principals and teachers perceptions of the principals’ leadership
ability as measured by this survey instrument would appear to indicate that a moderate
positive correlation exists. That is that the principals’ score tends to be slightly higher
than the teachers’ score of them on the principals’ leadership as measured by this
instrument with this sample.
In regards to research question 2: Is there a relationship between the school
principals’ leadership score on the survey instrument and school achievement on Algebra
I, Biology I, English II, and United States History Area Tests as measured by the
Mississippi Subject Area Tests as reported in the form of the QDI score for the school,
controlling for the percent of free and reduced lunch students?
A regression analysis was used to test for any significant explanation of variance
of the school’s QDI score while controlling for the covariate of school socio-economic
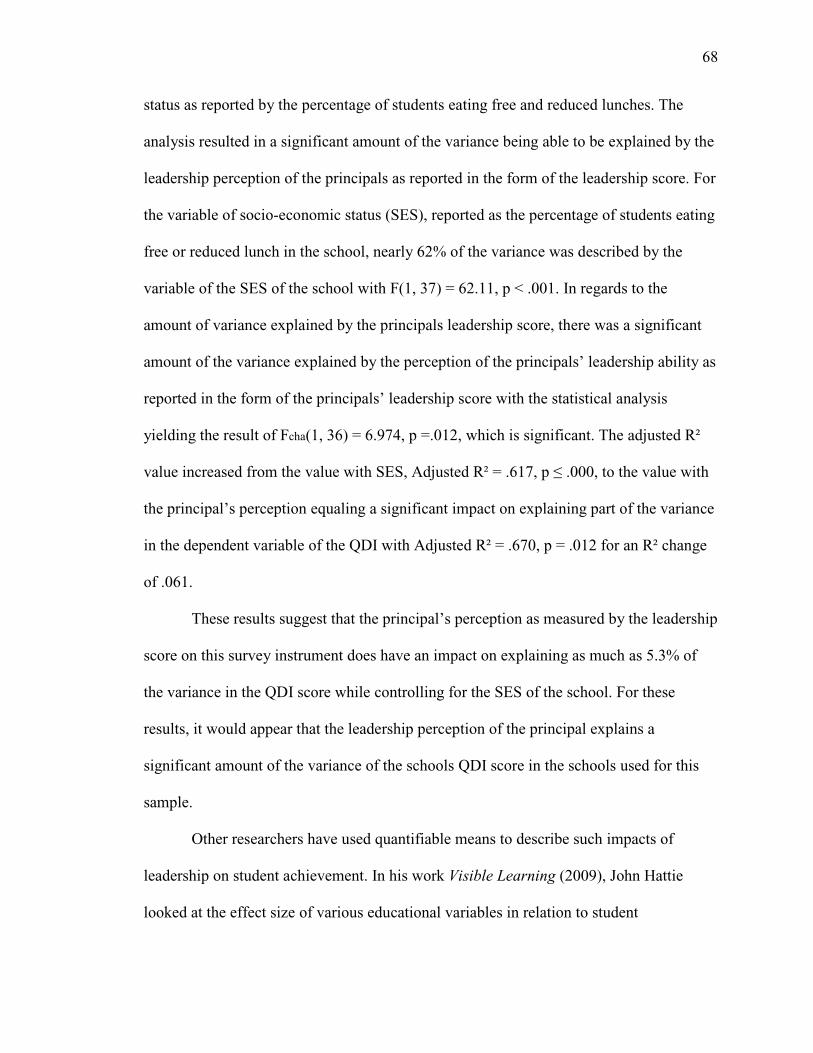
68
status as reported by the percentage of students eating free and reduced lunches. The
analysis resulted in a significant amount of the variance being able to be explained by the
leadership perception of the principals as reported in the form of the leadership score. For
the variable of socio-economic status (SES), reported as the percentage of students eating
free or reduced lunch in the school, nearly 62% of the variance was described by the
variable of the SES of the school with F(1, 37) = 62.11, p < .001. In regards to the
amount of variance explained by the principals leadership score, there was a significant
amount of the variance explained by the perception of the principals’ leadership ability as
reported in the form of the principals’ leadership score with the statistical analysis
yielding the result of Fcha(1, 36) = 6.974, p =.012, which is significant. The adjusted R²
value increased from the value with SES, Adjusted R² = .617, p ≤ .000, to the value with
the principal’s perception equaling a significant impact on explaining part of the variance
in the dependent variable of the QDI with Adjusted R² = .670, p = .012 for an R² change
of .061.
These results suggest that the principal’s perception as measured by the leadership
score on this survey instrument does have an impact on explaining as much as 5.3% of
the variance in the QDI score while controlling for the SES of the school. For these
results, it would appear that the leadership perception of the principal explains a
significant amount of the variance of the schools QDI score in the schools used for this
sample.
Other researchers have used quantifiable means to describe such impacts of
leadership on student achievement. In his work Visible Learning (2009), John Hattie
looked at the effect size of various educational variables in relation to student

69
achievement. According to Hattie (2009), the concept of effect size can be described in
the following manner, “effect size provides a common expression of the magnitude of
study outcomes for many types of outcome variables” (p. 7). In looking at variables
related to the field of education, Hattie concluded from the research that an effect size of
(d = 0.40) should be considered to be significant. In relation to the findings of research
question number two, the synthesis of the 800+ meta-analyses in Hattie’s research found
the overall effect size of principal leadership to be significant, (d = 0.36).
In regards to research question 3: Is there a relationship between the school
teachers’ perceptions of the principals’ demonstration of Leadership Responsibilities as
measured by the leadership score computed from this survey instrument and school
achievement based on the school QDI score as measured by the Mississippi Subject Area
Tests, controlling for the percent of free and reduced lunch students?
A regression analysis was used to test for any significant differences in the
explanation of variance of the school’s QDI score while controlling for the covariate of
school socio-economic status as reported by the percentage of students eating free and
reduced lunches. The analysis resulted in a less than significant amount of the variance
being able to be explained by the leadership perception of the teachers’ of the principal as
reported in the form of the leadership score computed by the teacher scores on the survey
instrument. For the variable of socio-economic status (SES), reported as the percentage of
students eating free or reduced lunch in the school, again nearly 62% of the variance was
described by the variable of the SES of the school with F(1, 37) = 62.11,
p < .001. In regards to the amount of variance explained by the teachers’ leadership score
of the principal, there was a non-significant amount of the variance explained by the

70
perception of the principal’s leadership ability by the teacher’s score of the principal as
reported in the form of the teachers’ leadership score with the statistical analysis yielding
the result of Fcha(1, 36) = 2.853, p =.100, which is not statistically significant. The
adjusted R² value increased from the value with SES, Adjusted R² = .617, p = .000, to the
value with the teachers’ perceptions of the principals’ abilities equaling a less than
significant impact on explaining part of the variance in the dependent variable of the QDI
with Adjusted R² = .635, p = .100.
These results suggest that the teachers’ perception of the principals’ leadership
ability as measured by the leadership score on this survey instrument does not have as
much of an impact on explaining of the variance, only 1.8%, in the QDI score while
controlling for the SES of the school. For these results, it would appear that the
leadership perception of the teachers explains a less than a significant amount of the
variance of the schools QDI score in the schools used for this sample.
Finally, in regards to research question 4: Are there differences between school
principals’ and teachers’ perceptions as measured by the leadership score computed from
this survey instrument related to school achievement as measured by the QDI score,
controlling for the percent of free lunch students?
For this analysis, first a difference score was calculated by subtracting each
teacher mean aggregate score from each school from the principal mean aggregate score
for the school. This yielded a score that was positive if the principal had rated him or
herself higher that the rating of the teacher as measured by the aggregate score from the
survey instrument. Most of the principals had rated themselves at least slightly higher that
their corresponding teachers had rated them.

71
Once this difference score was computed a regression analysis was used to test for
any significant differences in the explanation of variance of the school’s QDI score while
controlling for the covariate of school socio-economic status as reported by the
percentage of students eating free and reduced lunches. The analysis resulted in a non-
significant amount of the variance being able to be explained by the difference score in
leadership perception of the principals’ score and the teachers’ of the principal as
reported in the form of the leadership score computed by the teacher scores on the survey
instrument. For the variable of socio-economic status (SES), reported as the percentage of
students eating free or reduced lunch in the school, again nearly 62% of the variance was
described by the variable of the SES of the school with F(1, 37) = 62.11,
p < .001. In regards to the amount of variance explained by the difference in the teachers’
leadership score of the principal and the actual principals’ self-report leadership score,
there was found to be a less than significant amount of the variance explained by the
perception of the difference score of the principals leadership ability by the teachers score
of the principal as reported in the form of the teachers’ leadership score and the
principals’ self-reported score with the statistical analysis yielding the result of Fcha(1,
36) = .158, p =.693, which is not statistically significant. The adjusted R² value decreased
from the value with SES, Adjusted R² = .617, p = .000, to the value with the difference
score of the teachers’ perception of the principals’ ability and the principals leadership
score equaling a less than significant impact on explaining part of the variance in the
dependent variable of the QDI with Adjusted R² = ..608, p = .693.
These results suggest that the difference between the teachers’ perception of the
principals’ leadership ability and the leadership score of the principal as measured by the

72
leadership score on this survey instrument does not have as much of an impact on
explaining of the variance, only 0.9%, in the QDI score while controlling for the SES of
the school. For these results, it would appear that the difference score of the leadership
perception of the teachers and that of the leadership score of the principals explains a less
than a significant amount of the variance of the schools QDI score in the schools used for
this sample.
Ancillary Findings
After the statistical analyses of the data for this study were completed, an
ancillary finding was noticed when the schools were divided into two different
categories. The category labeled high performing school group consists of the star, high
performing, and the successful school labels. The other category is entitled the low
performing schools group which consists of the schools in the academic watch, at risk of
failing, low performing, and failing labels. The data shows that both the high performing
group principals’ and teachers’ have higher perceptions of leadership than the low
performing group principals’ and teachers’. The high performing group principals (n =
23) had a higher perception of leadership (M = 3.75, sd = 0.39). The low performing
group principals (n = 16) had a lower perception of leadership (M = 3.20, sd = 0.35). In
addition, the higher group teachers (n = 23) had a higher perception of leadership (M =
2.89, sd = 0.41), and lower group teachers (n= 16) had a lower perception of leadership
(M = 2.18, sd = 0.47).
Table E1 contains the descriptive statistics for individual items on the survey
instrument for principals in the high performing schools group and the low performing
schools group. The high performing school principals and the low performing school

73
principals means for the domains of Involvement in Curriculum, Instruction, and
Assessment (Prin. High M = 3.83, Prin. Low M = 3.25), Knowledge of Curriculum,
Instruction, and Assessment (Prin. High M = 3.87, Prin. Low M = 3.69), and
Communication (Prin. High M = 3.78, Prin. Low M = 3.56) were similar. Domains that
saw larger areas of difference between the two principal groups were the areas of Focus
(Prin. High M = 3.83, Prin. Low M = 3.19) and Optimizer (Prin. High M = 3.7, Prin. Low
M = 3.06).
Table F1 contains the descriptive statistics for individual items on the survey
instrument for teachers in the high performing schools group and the low performing
schools group. The high performing school teachers and the low performing school
teachers means for the domains of Communication (Teach. High M = 3.64, Teach. Low
M = 2.95) and Ideals/Beliefs (Teach. High M = 3.65, Teach. Low M = 2.96) were similar.
Domains that saw larger areas of difference between the two teacher groups were the
areas of Focus (Teach. High M = 3.07, Teach. Low M = 2.22) and Culture (Teach. High
M = 3.08, Prin. Low M = 2.2).
Summary
In reviewing the results of the information from the following statistical tests the
following conclusions have been drawn. The first conclusion is that in regards to
research question one, there does appear to be a significant difference in the leadership
perception score of the self-reported score and that of the score reported for the teachers
for that same principal. Secondly, in regards to research question two, there does indeed
appear to be a significant relationship between the principals’ leadership score and the
QDI score for the schools in this sample.

74
The next conclusion surrounds research question three. The conclusion drawn
from this statistical analysis suggests that there is no significant relationship between the
leadership score recorded by the teachers’ of the school in regards to the leadership of the
principal in regards to the QDI score. Lastly, the conclusions drawn from the data on the
testing of research question four would suggest that there is a non-significant difference
in the amount of variance explained by free and reduced lunch and that of the difference
score between the perceptions of the principal and the teachers perceptions of the
principals leadership as measured by the leadership score on this survey instrument.

75
CHAPTER V
DISCUSSION
Introduction
This study sought to determine if there was a quantifiable relationship between
the leadership of the principal of a school and student achievement. The following
contains a discussion of the results of this study as it pertains to the research questions
that guided the analysis of the data. Limitations will be discussed as they pertain to the
conducting of this research project. This will be followed by recommendations for policy
or practice for secondary schools. In conclusion, recommendations for further research
will be expanded upon.
Discussion
In regards to the first research question which dealt with whether there is a
relationship between school principals’ and teachers’ perceptions of the principals’
demonstration of Leadership Responsibilities and student achievement, the following
results were found. From the analyses there was found to be a significant relationship
between the principal’s score and the teacher’s score of that principal. In nearly all cases
the principal rated themselves higher than the teachers for that school by nearly one
whole point.
This leads one to believe that the teachers do not have access to the knowledge
and skills needed to rate the principal effectively. This finding could also be explained by
the fact that teachers may not have had sufficient time or opportunity to observe the
principal to be able to rate the principal effectively on items included in the survey. In the

76
final analysis of research question 1, it seems clear that teachers rated principals clearly
lower than the principals rated themselves.
It is my belief that this rating was brought about by the fact that many principals
continue using an authoritarian style of leadership. This style of leadership is explained
by the focus on rules, policy, and procedures and is very reminiscent of what Bolman and
Deal (2008) called the Structural Frame of leadership in their book Reframing
Organizations: Artistry, Choice, and Leadership. Used ineffectively, this model can
digress into a situation where the school leader can be seen as a tyrant that micro-
manages every aspect of the school or organization. This in turn can lead to low morale.
According to John Kotter in his book A Sense of Urgency (2008), this type of
behavior can help to facilitate one of the worst ills that can grab hold of an organization.
That dreadful situation is one of having a “false sense of urgency” (Kotter, 2008, pp.10-
11). This frantic search for a magic bullet can be brought on by the tyrannical activities of
leadership gone wrong. This could cause skepticism on the part of teachers asked to rate
the leadership ability of their principal.
In looking at research question two, this study sought to discover as to whether
there was a relationship between the school principals’ leadership score on the survey
instrument and school achievement on Algebra I, Biology I, English II, and United States
History Area Tests as measured by the Mississippi Subject Area Tests as reported in the
form of the QDI score for the school, controlling for the percent of free and reduced
lunch students, the following results were noted. There was found to be a significant
amount of the difference in the principal’s perception of the job the principal was doing
as measured by their self-report and the QDI for the school. This was found while

77
controlling for the variable of free and reduced lunch. So, when taking the socio-
economic status out of the equation, the principal’s perception of his or her leadership
ability was found to have an impact on student achievement as measured by the QDI
score.
Other researchers have used quantifiable means to describe such impacts of
leadership on student achievement. In his work Visible Learning, John Hattie (2009)
looked at the effect size of various educational variables in relation to student
achievement. According to Hattie (2009), the concept of effect size can be described in
the following manner, “effect size provides a common expression of the magnitude of
study outcomes for many types of outcome variables” (p. 7). In looking at variables
related to the field of education, Hattie concluded from the research that an effect size of
(d = 0.40) should be considered to be significant. According to Hattie, “The effect size of
0.40 sets a level where the effects of innovation enhance achievement in such a way that
we can notice a real-world differences, and this should be a benchmark of real-world
change” (p. 17).
In relation to the findings of research question number two, the synthesis of the
800+ meta-analyses in Dr. Hattie’s research found the overall effect size of principal
leadership to be significant, (d = 0.36). This data is based on the synthesis of 11 meta-
analyses that contain a total of 491 studies with over 1.13 million participants (Hattie,
2009). In addition, effect sizes where much larger when principals focused on those tasks
more closely associated with instructional leadership, (d = 0.66). In contrast, according to
the research, the effect size of principals that focused on other domains of leadership
were much lower, (d = 0.09).

78
Those dimensions of leadership that had the highest effect size on student
achievement were the principal being directly involved with professional development
(d = 0.91), monitoring and evaluating teaching and the curriculum (d = 0.74), and
maintaining focus on goals and expectations (d = 0.54). In looking at the research on
involvement in professional development, the researchers found that it was important that
the principal be actively involved in championing the innovation. In regards to
monitoring and evaluating, the research suggests that this should include the principal
engaging in multiple classroom visits and provide both formative and summative
feedback for teachers. This feedback should be given in the spirit of providing the
opportunity for professional growth (Reeves, 2009). Lastly, the focusing on goals and
expectations, according to the research by Douglas Reeves in The Learning Leader
(2006), allows teachers and principals to use their finite amount of energy on the most
important tasks.
In Douglas Reeves’ latest book Finding Your Leadership Focus (2011), this
researcher believes that Reeves explains a rational for this finding. The research in this
book was based on an analysis of more than 2,000 schools in the United States and
Canada surrounding leadership or school initiatives, many of which dealt with improving
student achievement. This study found that the three most important behaviors of the
many identified for school leaders to attend to over the past several studies could be
narrowed down to just three specific behaviors. According to Reeves, the three behaviors
most correlated with student achievement are “focus,” “monitoring,” and “efficacy”
(Reeves, p. 26).

79
It is the third of these behaviors that I believe help explain the research finding
associated with research question two. The idea of efficacy deals with the belief that adult
action in the school has the most significant impact on student achievement. Robert
Marzano, in his book What Works in Schools: Translating Research into Action (2003),
made this point very well in the negative sense when he recounts that his research
suggested that if a child has a poor teacher three consecutive years in school that the child
cannot recover.
Douglas Reeves relates this phenomenon to the Rosenthal and Jacobson study of
2003 entitled “Pygmalion in the Classroom.” This study concluded that the perceptions of
student ability by teachers of their students impacted student success. Reeves (2011) goes
on to assert that, “four decades of research and practice on the power of efficacy leads to
the inescapable conclusion that the beliefs of teachers and school leaders have a
significant effect, for better or worse, on the performance of students” (p. 31). The results
obtained from these studies support the finding of this study in regards to research
question two.
In discussing research question three, which sought to determine if there was a
relationship between the school teachers’ perceptions of the principals’ demonstration of
Leadership Responsibilities as measured by the leadership score computed from this
survey instrument and school achievement based on the school QDI score as measured by
the Mississippi Subject Area Tests, controlling for the percent of free and reduced lunch
students.
The conclusion drawn from this statistical analysis suggests that there is no
significant relationship between the leadership score recorded by the teachers’ of the

80
school in regards to the leadership of the principal in regards to the QDI score. The
results of the analysis of the data for this portion of the study failed to find a significant
amount of the variance being able to be explained by the leadership perception of the
teachers’ of the principal as reported in the form of the leadership score computed by the
teacher scores on the survey instrument. For these results, it would appear that the
leadership perception of the teachers explains a non-significant amount of the variance of
the schools QDI score in the schools used for this sample.
Looking back at some of the research previously mentioned in this chapter, I
would assert that the reasons for the non-significant impact of the teacher’s scores related
to the principals leadership on the QDI score is that teachers are not in a position to
accurately assess all of the leadership behaviors exhibited by the principal. In addition,
the efficacy of the principal is essential in the feeling of the principal that he or she can
make a difference in student achievement. As mentioned earlier, this efficacy has been
proven by other researchers to have a significant impact on the learning outcomes of
students. These outcomes would directly affect student scores on the Mississippi subject
area tests. These results would certainly affect the school QDI score which in turn affects
the school accountability level.
In reference to research question four, this study sought to discover as to whether
or not there were differences between school principals’ and teachers’ perceptions as
measured by the leadership score computed from this survey instrument related to school
achievement as measured by the QDI score, controlling for the percent of free and
reduced lunch students. In looking at the results of the analysis for this question, it was
found that most of the principals had rated themselves at least slightly higher that their

81
corresponding teachers had rated them. The analysis resulted in a non-significant amount
of the variance being able to be explained by the difference score in leadership perception
of the principals’ score and the teachers’ of the principal as reported in the form of the
leadership score computed by the teacher scores on the survey instrument.
Lastly, the conclusions drawn from the data on the testing of research question
four would suggest that there is a non-significant difference in the amount of variance
explained by free and reduced lunch and that of the difference score between the
perceptions of the principal and the teachers perceptions of the principal’s leadership as
measured by the leadership score on this survey instrument. Again, this could be
explained by teachers dealing with principals that been trained in the structural frame of
leadership in a classical sense (Bolman & Deal, 2008).
Another plausible explanation is what Mike Schmoker in his book Results Now
(2006) calls the “buffer” (Schmoker, p. 13). The idea of the buffer, explains Schmoker,
are the unwritten mores that persist inside and outside our schools that regardless of how
dismal things may be, schools seem to have been given a pass when it comes to criticisms
of success or the lack thereof. This persistent issue may cause a disconnect between
teachers and the school leaders that are responsible for providing their evaluations and
feedback.
Schmoker goes on to propose another explanation that could be plausible in
explaining why there is disconnect in the perception of teachers and principals. In chapter
two of the book Results Now, Schmoker (2006) asserts that schools have traditionally
been halls of isolation. He goes so far as to say that we as educators may actually be
guilty of “institutionalizing mediocrity” (Schmoker, p. 27). This being the case, as

82
accountability pressures mount for teachers; they could be becoming disenfranchised
with the leadership structure that has persisted in schools from the beginning of the
American public education system.
This very structured framework in which the principal was possibly, in the eyes of
the teachers, supposed to be able to shield teachers from the negativity of failing
accountability could explain some of these causes of angst. As teachers are starting to
revaluate this historical structure of schools, they could be expecting more from their
school principal than what the principal may be equipped to deliver. This could help to
explain the disconnect in the scores between the leadership perceptions of the principals
and the teachers’ perceptions of the principals.
Limitations
In the previous sections of this chapter, the groundwork for the discussion of
limitations that occurred with this study has been laid. The first would be that the teachers
may not have been fit with the skills that they needed to accurately assess the principal’s
leadership ability. Teachers could have also lacked the time needed or opportunity to
observe some of the behaviors questioned in the questionnaire.
Additionally, it could have been that the only teachers that responded were those
that were biased toward the principal. These persons could have really liked the principal
and therefore would have rated the principal artificially high. On the other end of the
spectrum, it could be that some of the teachers used this opportunity to really rate their
principal very low in an attempt to exact some type of revenge.
Lastly, for this sample to be more applicable to other regions, the sample would
need to contain schools from other parts of the country. Sample size would certainly

83
prevent this study from being able to be generalized to other regions. The fact that at this
point, the different parts of the country are all on unique accountability systems designed
by the prospective states would again limit the generalizability or applicability of this
study’s results. Not until a common system of accountability is in place for the United
States would this issue be solved.
Implications for Policy and Practice
Current research supports the finding of this study that leadership does have a
significant impact on student achievement. When other factors are controlled for, such as
socioeconomic status, leadership has been shown to have a significant effect on the
achievement level of students. This has implications for the importance of training,
hiring, and retention policies for schools.
If a significant amount of the variance in achievement can be explained by
leadership, it would make intuitive sense that district would want to focus training and
other resources into this area. As researchers Douglas Reeves and others have stated,
leadership is essential for student achievement. One of the areas Reeves mentions in his
latest book Finding Your Leadership Focus (2011) relates to “monitoring and evaluating”
(Reeves, p. 28). The frequency and the fidelity of the monitoring and evaluating can have
a significant impact on achievement. In addition, providing feedback to teachers in this
process is also critical.
In addition to monitoring and evaluating, providing focus is a very important
factor in principals fostering effectiveness in schools. Douglas Reeves (2011) suggests
that it is in the purveyance of the school leader to help the school and teachers maintain
focus on “six or fewer priorities” (p. 27). Any more than six priorities strain the ability of

84
the staff to focus on what is important and limits the ability of the initiatives to be
implemented effectively. The implementation is only accomplished through proper
monitoring, evaluating, and the use of formative feedback with the mission of providing
for professional growth (Reeves, 2011).
Finally, the last area that research suggests could help improve schools and should
be considered with implications of policy and practice is the idea of efficacy. The key,
according to Reeves, is to focus not only on the effect data which is student learning
results, but also the cause data which is defined as the actions of the adults in the school
building. To do this, schools must celebrate the successes they have and bring attention to
the fact that adult action has a profound effect on student achievement. This can be done
by what Reeves (2006) calls “Data Walls” which could be considered a science fair for
adults (p. 196). In this process teachers actually create presentation boards that outline the
successful strategies they have enacted with the coinciding student effects shown as well.
This gives a visual of how adults impact the achievement in a positive way and help lead
to discussion of effective practice amongst colleagues.
All of these areas mentioned, speak to the importance of leadership as it relates to
student achievement. As Marzano, Waters, and McNulty (2005) stated in their
conclusions following their School Leadership that Works study, everything rises and
falls on leadership. Whether one is talking about curriculum, instruction, or safety, school
leadership must be in place to maintain a high probability of success.
Recommendations for Future Research
The following are some of the inquiry questions that could seek to guide the
possibility of further research. Recommendations for future research would surround the

85
question of what were some of the root causes for the disconnect between the perceptions
of the teachers and the principals perceptions of the principals leadership? Next, could
more effective communication between the school principals and teachers foster a
yielding of similar results of further evaluations of leadership? Lastly, could this sharing
of perceptions yield to even greater improvements in student achievement scores? These
are all questions that could help guide further study into the findings of this study.
Summary
This research study sought at the core to seek a link between principal or school
leadership and student achievement. A review of the findings of this study shows that
there was a statistically significant impact of leadership on the QDI scores for schools,
which can be related directly to student achievement. These findings are certainly
consistent with the findings of many other researchers that have correlated principal
leadership to student achievement.
This sincere hope of this researcher is that these findings will have an impact on
future policy or research. The impact seen in the literature review and other studies is too
strong to ignore. Implications exist in this study for policy and current practitioners.
Current principals should be assured that they, as much any other factors, have a
significant impact on student achievement. This study also sought to control for
socioeconomic status, thus making even clearer the picture that the leadership of our
schools is very important, and certainly warrants further research.

86
APPENDIX A
PERMISSION LETTER

87
APPENDIX B
LEADERSHIP QUESTIONAIRE

88

89

90

91

92

93
APPENDIX C
IRB APPROVAL FORM

94
APPENDIX D
COVER LETTER

95
APPENDIX E
DESCRIPTIVE STATISTICS FOR INDIVIDUAL PRINCIPAL SURVEY ITEMS
Table E1 Descriptive Statistics for Individual Principal Survey Items
Survey Item
Prin. High (M)
Prin. High (sd)
Prin. Low (M)
Prin. Low (sd)
1 Culture 3.83 .49 3.38 .50
2 Order 3.83 .39 3.19 .54
3 Culture 3.74 .45 3.13 .50
4 Order 3.7 .47 3.19 .54
5 Discipline 3.78 .42 3.19 .54
6 Resources 3.74 .45 3.31 .48
7 Discipline 3.7 .56 3.19 .54
8 Resources 3.7 .47 3.31 .48
9 Curr., Inst., As. 3.87 .34 3.69 .48
10 Focus 3.83 .39 3.19 .40
11 Curr., Inst., As. 3.83 .39 3.25 .45
12 Focus 3.74 .54 3.25 .45
13 Knowledge of C,I, A 3.87 .34 3.69 .48
14 Visibility 3.78 .42 3.06 .57
15 Knowledge of C, I, A 3.83 .39 3.13 .50
16 Visibility 3.87 .34 3.13 .50
17 Contingent Rewards 3.7 .47 3.13 .50
18 Communication 3.78 .52 3.13 .50
19 Contingent Rewards 3.74 .54 3.19 .40
20 Communication 3.78 .52 3.56 .89
21 Outreach 3.7 .56 3.19 .40
22 Input 3.7 .56 3 .51
23 Outreach 3.78 .52 3.19 .40
24 Input 3.7 .64 3.06 .57
25 Affirmation 3.7 .64 3.06 .44
26 Relationship 3.7 .56 3.06 .44
27 Affirmation 3.65 .65 3.13 .50
28 Relationship 3.87 .34 3.81 .40
29 Change Agent 3.83 .39 3.13 .50
30 Optimizer 3.7 .56 3.06 .44
31 Change Agent 3.74 .54 2.94 .44
32 Optimizer 3.78 .52 3.13 .50
33 Ideals/Beliefs 3.78 .42 3.25 .45
34 Monitors/Evaluates 3.78 .42 3.06 .44
35 Intellectual Stimulation 3.7 .56 3.06 .44
36 Ideals/Beliefs 3.96 .21 3.81 .40
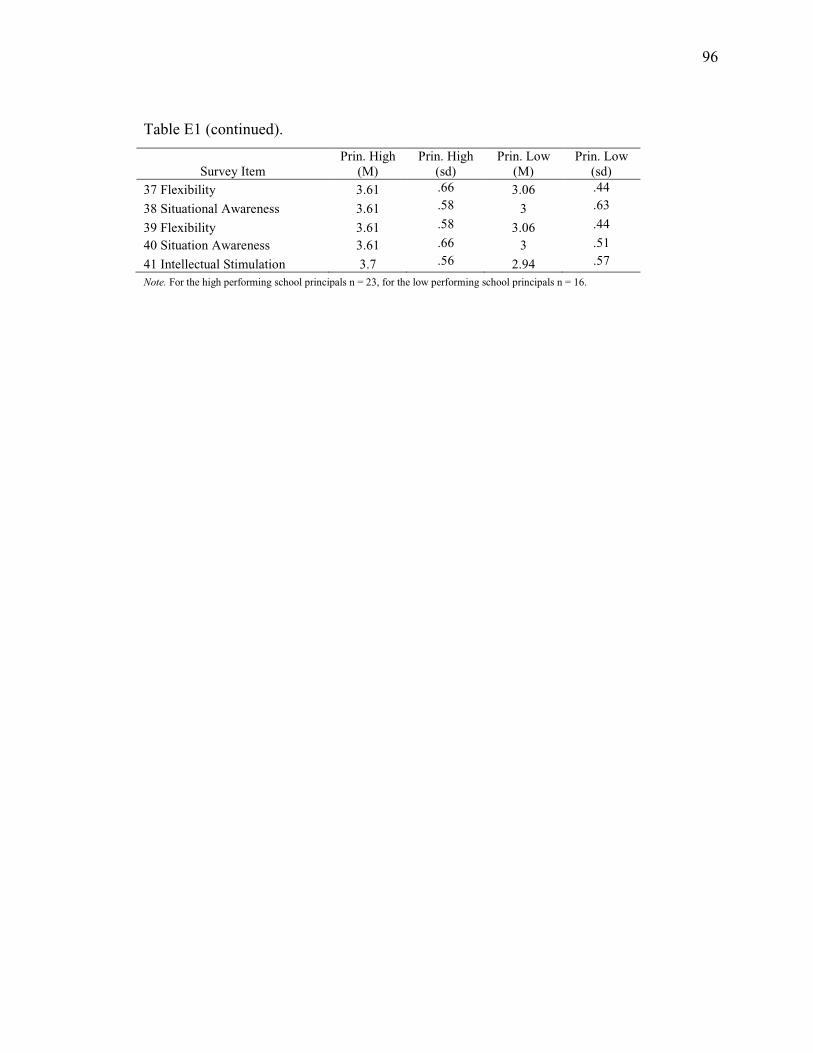
96
Table E1 (continued).
Note. For the high performing school principals n = 23, for the low performing school principals n = 16.
Survey Item
Prin. High (M)
Prin. High (sd)
Prin. Low (M)
Prin. Low (sd)
37 Flexibility 3.61 .66 3.06 .44
38 Situational Awareness 3.61 .58 3 .63
39 Flexibility 3.61 .58 3.06 .44
40 Situation Awareness 3.61 .66 3 .51
41 Intellectual Stimulation 3.7 .56 2.94 .57

97
APPENDIX F
DESCRIPTIVE STATISTICS FOR INDIVIDUAL TEACHER SURVEY ITEMS
Table F1 Descriptive Statistics for Individual Teacher Survey Items
Survey Item
Teach. High (M)
Teach. High (sd)
Teach. Low (M)
Teach. Low (sd)
1 Culture 3.08 .48 2.2 .54
2 Order 3.12 .61 2.21 .49
3 Culture 3.12 .54 2.28 .57
4 Order 3.11 .45 2.28 .59
5 Discipline 3.11 .51 2.14 .49
6 Resources 3.11 .59 2.3 .75
7 Discipline 3.11 .61 2.19 .45
8 Resources 3.16 .51 2.28 .64
9 Curr., Inst., As. 3.48 .56 2.79 .40
10 Focus 3.07 .54 2.22 .58
11 Curr., Inst., As. 3.14 .57 2.25 .68
12 Focus 3.17 .47 2.24 .63
13 Knowledge of C,I, A 3.46 .54 2.76 .50
14 Visibility 3.11 .61 2.17 .69
15 Knowledge of C, I, A 3.14 .53 2.25 .80
16 Visibility 3.11 .53 2.19 .64
17 Contingent Rewards 3.11 .54 2.25 .57
18 Communication 3.14 .52 2.23 .64
19 Contingent Rewards 3.09 .56 2.23 .55
20 Communication 3.64 .41 2.95 .31
21 Outreach 3.04 .47 2.2 .67
22 Input 3.04 .48 2.1 .53
23 Outreach 3.12 .47 2.17 .69
24 Input 3.04 .58 2.05 .52
25 Affirmation 3.05 .64 2.16 .60
26 Relationship 3.03 .54 2.14 .58
27 Affirmation 3.08 .54 2.29 .65
28 Relationship 3.54 .48 2.89 .44
29 Change Agent 3.1 .59 2.13 .65
30 Optimizer 3.03 .62 2.14 .65
31 Change Agent 3.04 .51 2.1 .64
32 Optimizer 3.13 .50 2.19 .71
33 Ideals/Beliefs 3.14 .63 2.22 .71
34 Monitors/Evaluates 3.06 .56 2.16 .69
35 Intellectual Stimulation 3.07 .53 2.14 .53

98
Table F1 (continued).
Survey Item
Teach. High (M)
Teach. High (sd)
Teach. Low (M)
Teach. Low (sd)
36 Ideals/Beliefs 3.65 .51 2.96 .45
37 Flexibility 2.94 .74 1.97 .47
38 Situational Awareness 3.05 .60 2.16 .48
39 Flexibility 3.08 .61 2.19 .62
40 Situation Awareness 3.03 .64 2.14 .56
41 Intellectual Stimulation 3.13 .58 2.13 .66 Note. For the high performing school teachers n = 23, for the low performing school teachers n = 16.

99
REFERENCES
Ainsworth, L. (2003). Power standards: Identifying the standards that matter the most.
Englewood, CO: The Lead and Learn Press.
Ainsworth, L. & Viegut, D. (2006). Common formative assessments: How to connect
standards based instruction and assessment. Thousand Oaks, CA: Corwin Press.
Ainsworth, L. (2008). Common formative assessments: The power of assessments for
learning. Englewood, CO: The Lead and Learn Press.
Barth, R. (2001). Learning by heart. San Francisco, CA: Jossey-Bass.
Bennis, W. (2009). On becoming a leader. Philadelphia, PA: Perseus Books.
Block, P. (2003). The answer to how is yes: Acting on what matters. San-Francisco, CA:
Barrett-Koehler.
Bolman, L. & Deal, T. (2008). Reframing organizations: Artistry, choice, and leadership.
San Francisco, CA: Jossey-Bass.
Bossidy, L. & Charan, R. (2002). Execution: The discipline of getting things done. New
York, NY: Crown Business.
Cameron, G., & Waters, T. (2003). The balanced leadership framework: Connecting
vision with action. Denver, CO: McREL.
Chenowith, K. (2009). How it’s being done. Cambridge, MA: Harvard Education Press.

100
Childress, S., Elmore, R., & Grossman, A. (2006). How to manage urban school districts.
Harvard Business Review, 84(11), 130-138.
Cohen, J. (2010, September). The new standards for learning. Principal Leadership, 28-
32.
Collins, J., & Porras, J. (1997). Built to last: Successful habits of visionary companies.
New York, NY: Harper Business.
Commission on No Child Left Behind. (2007). Beyond NCLB: Fulfilling the promise to
our nation’s children. Washington, DC: The Aspen Institute.
Conzemius, A. & O’Neill, J. (2005). The handbook for smart school teams. Bloomington,
IN: Solution Tree Press.
Council of Chief State School Officers. (2008). Educational leadership policy standards:
As adopted by the National Policy Board for Educational Administration.
Washington, DC: CCSSO.
Day, C. (2007, Fall). What being a successful principle really means: An international
perspective. Educational Leadership and Administration: Teaching and Program
Development, 19, 13-24. Retrieved from www.caddogap.com
Deming, W. (1986). Out of crisis. Cambridge, MA: MIT Center for Advanced
Engineering.
DuFour, R., DuFour, R., & Eaker, R. (2004). Whatever it takes: How professional
learning communities respond when kids don’t learn. Bloomington, IN: National
Educational Service.
101
DuFour, R., DuFour, R., Eaker, R. & Many, T. (2006). Learning by doing: A handbook
for professional learning communities at work. Bloomington, IN: Solution Tree
Press
DuFour, R., DuFour, R., & Eaker, R. (2008). Revisiting professional learning
communities at work: New insights for improving schools. Bloomington, IN:
Solution Tree Press
DuFour, R., DuFour, R., Eaker, R., & Karhanek, G. (2010). Raising the bar and closing
the gap: Whatever it takes. Bloomington, IN: Solution Tree Press.
Eaker, R. (2002). Cultural shifts: Transforming schools into professional learning
communities. In R. DuFour, R. DuFour, & R. Eaker (Eds.) Getting started:
Reculturing schools to become professional learning communities (pp. 9-30).
Bloomington, IN: National Education Service.
Educational Leadership Policy Standards: ISLLC 2008. As adopted by the National
Policy Board for Educational Administration on December 12, 2007. (2008).
Retrieved from www.ccsso.org
Elmore, R. (2000). Building a new structure for school leadership. Washington, DC:
Albert Shanker Institute.
Elmore, R. (2002). The limits of change. Harvard Education Letter, 18(8), 8.
Elmore, R. (2003). Knowing the right thing to do: School improvement and performance
based on accountability. Washington, DC: NGA Center for Best Practice.

102
Fulton, K., Yoon, I., & Lee, C. (2005). Induction into learning communities. Washington,
DC: National Commission on Teaching and America’s Future. Retrieved from
www.nctaf.org
Goddard, R. (2001). Collective efficacy: A neglected construct in the study of schools
and achievement. Journal of Educational Psychology, 93(3), 467-476.
Goodlad, J. (1984). A place called school: Prospects for the future. New York, NY:
McGraw-Hill.
Hattie, J. (2009). Visible learning: A synthesis of over 800 meta-analyses relating to
achievement. New York, NY: Routledge.
Individuals with Disabilities Education Act 2004. (2004). Retrieved from idea.ed.gov
Kaizen. (2011). In Encyclopedia Britannica online. Retrieved from www.britannica.com
Kotter, J. & Cohen, D. (2002). Leading change. Cambridge, MA: Harvard Business
Press.
Kotter, J (2008). A sense of urgency. Cambridge, MA: Harvard Business Press.
Kouzes, J., & Posner, B. (1999). Challenge is the opportunity for greatness. Innovative
Leader, 8(6), 85-89.
Leadership. (2011). In Merriam-Webster Dictionary online. Retrieved from
http://www.merriam-webster.com/dictionary/leadership

103
Leithwood, K, Louis, K., Anderson, S., & Wahlstrom, K. (2004, September). How
leadership influences student learning. Retrieved from
www.wallacefoundation.org
Maxwell, J. (1993). Developing the leader within you. Nashville, TN: Thomas Nelson.
Marzano, R. (2003). What works in schools: Translating research into action.
Alexandria, VA: ASCD.
Marzano, R., Waters, T., & McNulty, B. (2005). School leadership that works: From
research to results. Alexandria, VA: ASCD.
McLaughlin, M. & Talbert, J. (2001). Professional communities and the work of high
school teaching. Chicago, IL: University of Chicago Press.
Mississippi Department of Education. (2010). Superintendents annual report 2009-2010.
Retrieved from www.mde.k12.ms.us
National Association of Secondary School Principals. (2001). Leading learning
communities: Standards for what principals should know and be able to do.
Retrieved from elan.wallacefoundation.org
National Center for Educational Statistics (NCES). (2005). Digest of education statistics.
Retrieved from nces.ed.gov
National Center on Response to Intervention. (2006). What is response to intervention?
Retrieved from www.rti4success.org
No Child Left Behind Act. (2001). Retrieved from www.edu.gov

104
Pfeffer, J. & Sutton, R. (2000). The knowing-doing gap: How smart companies turn
knowledge into action. Boston, MA: Harvard Business School.
Reeves, D. (2004). Accountability for action: A blueprint for learning organizations.
Englewood, CO: Lead and Learn Press.
Reeves, D. (2004). Accountability for learning: How teachers and school leaders take
charge. Alexandria, VA: ASCD.
Reeves, D. (2004). 90-90-90 schools. Retrieved from www.leadandlearn.com
Reeves, D. (2006). The learning leader: How to focus school improvement for better
results. Alexandria, VA: ASCD.
Reeves, D. (2008). Reframing teacher leadership to improve your school. Alexandria,
VA: ASCD.
Reeves, D. (2009). Assessing educational leaders: Evaluating performance for improved
individual and organizational results. Thousand Oaks, CA: Corwin Press.
Reeves, D. (2010). Transforming professional development into student results.
Alexandria,VA: ASCD.
Reeves, D. (2011). Finding your leadership focus: What matters most for student results.
New York, NY: Teachers College Press.
Responsibility. (2011). In Merriam-Webster Dictionary online. Retrieved from
www.merriam-webster.com
105
Robinson, V. (2007, October). School leadership and student outcomes: Identifying what
works and why [Monograph]. ACEL, 41, 6-32.
Robinson, V., Lloyd, C., & Rowe, K. (2008). The impact of leadership on student
outcomes: An analysis of differential effects of leadership types. Educational
Administration Quarterly, 44(5), 635-639.
Salkind, N. (2010). Statistics for people who think they hate statistics. Thousand Oaks,
CA: Sage.
Scheerens, J. & Bosker, R. (1997). The foundations of educational effectiveness. New
York, NY: Elsevier.
Schmoker, M. (1999). Results: The key to continuous school improvement (2nd ed.).
Alexandria, VA: ASCD.
Schmoker, M. (2001). The results fieldbook: Practical strategies for dramatically
improved schools. Alexandria, VA: ASCD.
Schmoker, M. (2006). Results now: How we can achieve unprecedented improvements in
teaching and learning. Alexandria, VA: ASCD.
School Administrator. (2011). In Merriam-Webster Dictionary online. Retrieved from
www.merriam-webster.com
School Leader. (2011). In Merriam-Webster Dictionary online. Retrieved from
www.merriam-webster.com

106
School Principal. (2011). In Merriam-Webster Dictionary online. Retrieved from
www.merriam-webster.com
Short, P, & Greer, J. (2002) Leadership in empowered schools: Themes from innovative
efforts. Columbus, OH: Merrill Prentice Hall.
Stiggins, R. J. (2002). Assessment crises: The absence of assessment for learning. Phi
Delta Kappan, 83(10), 67-74.
Stiggins, R. (2007). Assessment for learning: An essential foundation of productive
instruction. In D. Reeves (Ed.), Ahead of the curve: The power of assessment to
transform teaching and learning (59-76). Bloomington, IN: Solution Tree Press.
Teddlie, C. & Reynolds, D. (2000). The international handbook of school effectiveness
research. New York, NY: The Falmer Press.