Embed Size (px)
Citation preview

1
LEADERSHIP ATTRIBUTES OF ENROLLMENT MANAGERS IN HIGHER EDUCATION INSTITUTIONS IN THE UNITED STATES
By
KRISTY ROBERTSON PRESSWOOD
A DISSERTATION PRESENTED TO THE GRADUATE SCHOOL OF THE UNIVERSITY OF FLORIDA IN PARTIAL FULFILLMENT
OF THE REQUIREMENTS FOR THE DEGREE OF DOCTOR OF PHILOSOPHY
UNIVERSITY OF FLORIDA
2011

2
© 2011 Kristy Robertson Presswood

3
To my husband, Clay

4
ACKNOWLEDGMENTS
I wish to thank my husband, Clay, he is my greatest supporter and best friend.
Without him, none of this would be possible for we live a busy life with many obstacles.
As for obstacles, I also wish to acknowledge to my beautiful children. Although there
were many days when I did not write a word because of a sore throat, field trip or times
of just wanting to be mom, the end result is worth every minute. I took full advantage of
the time to complete my degree because my family is important to me and I did not want
to sacrifice time with my children. Emily, Samantha and Trevor all made sacrifices to
allow me to complete this project and I will spend the rest of my life making every
second with each of them an important one.
I thank my dissertation chair, Dr. Dale F. Campbell, for his continued support and
patience throughout my course of study. To my supervisory committee, Dr. David S.
Honeyman, Dr. Bernard Oliver and Dr. Lynn Leverty, I extend my heartfelt gratitude for
their persistence and guidance.
Lastly, I am grateful for my extended family at Daytona State College. Daytona
State College understands the importance of leadership development and invests in its
future leaders. Thank you for investing in me.

5
TABLE OF CONTENTS page
ACKNOWLEDGMENTS .................................................................................................. 4
LIST OF TABLES ............................................................................................................ 7
LIST OF FIGURES .......................................................................................................... 8
ABSTRACT ..................................................................................................................... 9
CHAPTER
1 BACKGROUND OF THE STUDY ........................................................................... 11
Statement of the Problem ....................................................................................... 11 Purpose of the Study .............................................................................................. 14 Research Questions ............................................................................................... 17 Significance of the Study ........................................................................................ 17 Definition of Terms .................................................................................................. 18 Limitations ............................................................................................................... 22 Summary ................................................................................................................ 23
2 A CONTEXT FOR INQUIRY ................................................................................... 24
The Problem ........................................................................................................... 24 Changing Workforce ............................................................................................... 25
Aging Workforce ............................................................................................... 25 Generational Differences .................................................................................. 27 Impact of Technological Advances ................................................................... 29
Leadership .............................................................................................................. 32 Gender in Leadership ....................................................................................... 36
Talent Management ................................................................................................ 37 Leadership Development.................................................................................. 38 Succession Planning ........................................................................................ 41
Role of the Registrar ............................................................................................... 45 Closing the ‘Gap’ .................................................................................................... 47 Summary ................................................................................................................ 49
3 RESEARCH METHODOLOGY ............................................................................... 52
Purpose of the Study .............................................................................................. 52 Research Problem .................................................................................................. 53 Research Hypothesis .............................................................................................. 54 Research Design .................................................................................................... 55 Methodology ........................................................................................................... 55 Instrumentation ....................................................................................................... 56
6
The Population ........................................................................................................ 59 Procedure for Data Collection ................................................................................. 60 Analysis of Data ...................................................................................................... 60 Research Instrument............................................................................................... 62 Summary ................................................................................................................ 63
4 RESULTS ............................................................................................................... 69
Aggregate Data-Descriptive Statistics..................................................................... 69 Research Hypothesis One ...................................................................................... 70 Research Hypothesis Two ...................................................................................... 74 Research Hypothesis Three ................................................................................... 77 Research Hypothesis Four ..................................................................................... 81 Summary ................................................................................................................ 84
5 SUMMARY, RECOMMENDATIONS AND CONCLUSOIN ..................................... 86
Summary of Results................................................................................................ 87 Research Question 1 ........................................................................................ 87 Research Question 2 ........................................................................................ 89 Research Question 3 ........................................................................................ 89 Research Question 4 ........................................................................................ 92
Recommendations for Further Study ...................................................................... 94 Implications for Higher Education Administrators ................................................... 97 Conclusion .............................................................................................................. 97
APPENDIX
A CLUSTER DESCRIPTIONS ................................................................................. 100
B DATA FOR THE REGISTRAR SUBCATEGORY ................................................. 104
C DATA FOR THE DOCTORAL GRANTING SUBCATEGORY .............................. 116
E DATA FOR THE INSTITUTIONAL SIZE SUBCATEGORY .................................. 128
F DATA FOR THE GENDER SUBCATEGORY ....................................................... 140
G BUREAU OF LABOR STATISTICS ...................................................................... 152
H LEADERSHIP ATTRIBUTES ................................................................................ 154
LIST OF REFERENCES ............................................................................................. 158
BIOGRAPHICAL SKETCH .......................................................................................... 165

7
LIST OF TABLES
Table page 2-1 Leadership gap/deficit summary ......................................................................... 51
3-1 Single dimension & comp validities Saville Consulting WAVE© Assessment, 2009 ................................................................................................................... 64
3-2 Reliability summary Saville Consulting WAVE© Assessment, 2009 ................... 65
3-3 WAVE attribute links in other research ............................................................... 67
4-1 Mean, standard deviation, Skewness and Kurtosis of the aggregate population ........................................................................................................... 70
4-2 Kolmogorov-Smirnova and Shapiro-Wilk: aggregate population ....................... 70
4-3 Mean scores and standard deviations for the registrar and non-registrar groups (0=non-registrar; 1=registrar) .................................................................. 72
4-4 Summary ANOVA for the registrar and non-registrar groups for each of the four constructs .................................................................................................... 73
4-5 Mean scores and standard deviations for the doctoral and non-doctoral granting institution groups (0=non-doctoral granting; 1=doctoral granting) ......... 76
4-6 Summary ANOVA for the doctoral granting and non-doctoral granting groups for each of the four constructs ............................................................................ 76
4-7 Mean scores and standard deviations by institutional size (0=less than 10,000 enrollments; 1=10,000 or more enrollments) .......................................... 79
4-8 Summary ANOVA by institutional size for each of the four constructs ............... 80
4-9 Mean scores and standard deviations by gender (0=male, 1=female) ............... 82
4-10 Summary ANOVA by gender for each of the four constructs ............................. 83
4-11 Hypotheses Summary ........................................................................................ 85

8
LIST OF FIGURES
Figure page 1-1 Population summary of enrollment management positions (HEP) ...................... 19
3-1 Theoretical structure of Saville WAVE Assessment, 2009 ................................. 66
3-2 Cluster section chart ........................................................................................... 66
4-1 Psychometric profile’s cluster and section means for both registrar and other enrollment manager line graph ........................................................................... 72
4-2 Hypothesis test summary for registrar group ...................................................... 73
4-3 Psychometric profile’s cluster and section means for both doctoral granting and non-doctoral granting institutions line graph ................................................ 75
4-4 Hypothesis test summary for doctoral granting group ........................................ 77
4-5 Psychometric profile’s cluster and section means for institutions with enrollment of 10,000 or more and institutions with enrollments of less than 10,000 line graph ................................................................................................ 79
4-6 Hypothesis test summary for institutional size group .......................................... 80
4-7 Psychometric profile’s cluster and section means for both females and males line graph ............................................................................................................ 82
4-8 Hypothesis test summary for gender group ........................................................ 83
A-1 The thought cluster, sections, and dimensions ................................................. 100
A-2 The influence cluster, sections, and dimensions .............................................. 101
A-3 The adaptability cluster, sections, and dimensions ........................................... 102
A-4 The delivery cluster, sections, and dimensions ................................................ 103

9
Abstract of Dissertation Presented to the Graduate School of the University of Florida in Partial Fulfillment of the Requirements for the Degree of Doctor of Philosophy
LEADERSHIP ATTRIBUTES OF ENROLLMENT MANAGERS IN HIGHER
EDUCATION INSTITUTIONS IN THE UNITED STATES
By
Kristy Robertson Presswood
May 2011
Chair: Dale F. Campbell Major: Higher Education Administration
Literature documents the ever growing need for new leaders with newly defined
leadership skills in nearly every industry. Corporate and higher education leaders must
be prepared to adapt to the changing workforce and to address the leadership skills
gaps that exist. Identifying the leadership attributes necessary for each position within
an organization will be important as organizations struggle to meet the demand of a
dwindling trained leadership base. Leadership demands in higher education are being
created in academic affairs, student affairs and business affairs due to a domino effect
of vacancies being filled. One purpose of this report was to identify the leadership
attributes for enrollment managers in higher education institutions and to help build a
basis for future research on the development of a leadership training program.
This study built upon previous research to draw stronger conclusions regarding the
leadership attributes of enrollment managers. Enrollment management leaders who do
not hold the position of registrar exhibited stronger communication skills and ability to
impact decision making than their registrar colleagues, while enrollment management
leaders from doctoral granting institutions exhibited more vision than their counterparts
from non-doctoral granting institutions. These factors are small in comparison to the full

10
array of leadership attributes reviewed. Registrar/enrollment managers, overall, do not
differ in their leadership attributes when compared by institution type, institutional size,
position and gender. The findings support the leadership attributes identified by the
American Association of Collegiate Registrar and Admissions Officers (AACRAO) as
necessary job qualities for the future enrollment manager/registrar. This further
supports the need for future studies examining the need for leadership development
within the area of enrollment management. Senior student affairs officer positions are
typically filled from within the institution and the current non-registrar enrollment
manager, having the skills necessary to move into the senior student affairs position,
may likely be promoted to this position and will create the domino effect for leadership in
their current role (Amey, 2002; Hamilton, 2004; Campbell, 2006).
Results from this research study provide a base framework for future studies on
leadership attributes of mid-level higher education administrators and can be used to
support leadership selection and development initiatives for future enrollment managers
as the domino effect from turnover begins to unravel. Discovering what leadership
attributes are needed to be successful will assist in determining the best candidate.
11
CHAPTER 1 BACKGROUND OF THE STUDY
This chapter will introduce the issues that contribute to the increased demand for
leaders in key higher education positions, where the vacancies are expected to have
the greatest impact, the importance of leadership training and the need for succession
planning. In addition, it will address questions related to individual and institutional
similarities. The chapter will define the research problem and will describe the purpose
and significance of the study. Finally, the chapter will conclude with the overall
organization of the study.
Statement of the Problem
The changing demographics of today’s workforce is impacting the numbers of
qualified leaders and changing the skills necessary for leaders to succeed (Jackson,
2010; Bruck, 2010; Weinstein, 2010). The American Association of Retired Persons
(AARP) reports that the unemployment rate for individuals aged fifty-five or older
declined from October 2010 to January 2011 and that almost half of the employees
between the ages of 45-70 plan to work into their seventies due to the current economic
environment (Jackson, 2010; Flecke, 2011). According to the Bureau of Labor
Statistics, the numbers of individuals employed in non-seasonal positions forty-five
years of age or older in the fourth quarter of 2010 was 61,408 or 44% of the employed
population. In the fourth quarter of 1996, however, the number of employed individuals
meeting the same criteria was 59,907 or 41% of the employed population (Appendix F).
The overall workforce, due to the economic crisis, is declining, but the numbers indicate
that those forty-five or older represent nearly half of the workforce in the United States.

12
In the next few years, unprecedented numbers of employees will retire and take with
them a wealth of knowledge and history (Jackson, 2010).
Additionally, the leadership traits necessary for future leaders is changing. The
Society for Human Resource Management (SHRM) and AARP have identified the issue
of filling the retirement void not as one of too few people, but of too few skilled people
(Jackson, 2010). The Center for Creative Leadership (CCL) conducted a survey in
2009 in response to growing concern that organizations are reporting talent deficiencies
within their employment base (Leslie, 2009). CCL identified the seven leadership skills
viewed as important for future leaders as leading employees, strategic planning,
inspiring commitment, managing change, resourcefulness, being a quick learner, and
doing whatever it takes (Leslie, 2009). They went on to note that leaders lack the skills
they need to be effective and that ‘resourcefulness’ , defined as working effectively with
top management, was the only skill that was found to be a top ten current skill and a top
ten needed skill. When comparing this attribute with those in the Saville WAVE
instrument, it most closely correlates with the cluster to thought (Figure A-1). CCL
refers to this leadership skills disparity as a leadership deficit (Leslie, 2009).
Leaders in higher education are also feeling the impact of an aging workforce in
positions at every level. Charles Shults (2001) conducted research for the American
Association of Community Colleges that found that retirements of top level
administrators in community colleges posed a critical problem for the leadership of the
future. Additionally, a follow-up study conducted in 2005 revealed that a domino effect
of presidential vacancies was creating leadership gaps in key administrative positions of
institutional researchers, directors of learning resources, registrars, directors of financial

13
aid, directors of admissions, directors of accounting and directors of human resources
(Campbell, 2006). In 2007, the American Council on Education (ACE) released the
latest version of the American College President Study. According to this study, the
average age of president’s grew from fifty-two in the 1986 study to sixty-one in the 2007
study. Additionally, the percentage of president’s over the age of sixty-one grew from
fourteen percent in 1986 to forty-nine percent in 2007 (ACE, 2007).
Impending retirements of administrative/professionals in higher education
continues to impact the need for additional training and leadership preparation. In 2006,
the American Association of Collegiate Registrar and Admissions Officers (AACRAO),
the National Council for Student Development (NCSD) and the Council for Resource
Development (CRD) joined in a FuturesLeaders Administrative Work Profiling Session.
During this session, they restated the growing need for effectively trained administrators
and identified the registrar position within enrollment management as the one key
position whose nature of work had changed the most dramatically. The registrar
position had evolved from one of legal implementation of student policies and student
privacy to one providing strategic planning and decision making. The participants in the
work profiling session agreed that the registrar position should be re-titled as
dean/director of enrollment management and registrar (FuturesLeaders-ATG Work
Profiling, 2006).
The participants of the FuturesLeaders Administrative Work Profiling Session
expressed concern regarding the lack of a structured career path for individuals serving
in the position of registrar. The dean/director of enrollment management and registrar
position should serve as a natural succession to fill the senior student affairs vacancy.
14
Student affairs officers are typically promoted from within the same college and tend to
remain at the same institution for more than ten years (Amey, 2002). As the number of
senior student affairs positions become vacant, it is critical that the candidates ready to
move into these positions are trained and well prepared. Additionally, it is imperative
that the successors to those being promoted are duly prepared for their new roles. The
registrar/enrollment managers of today will need to ensure they appropriately train and
transfer knowledge to their successors.
Purpose of the Study
The purpose of this study was to determine if enrollment managers from differing
institutions, holding different positions within enrollment management had common
leadership attributes. The study built upon the previous research of Kachik (2003),
Campbell (2006), Basham (2007), Tunks (2007), Berry (2008) and O’Daniels (2009) in
identifying leadership attributes of college leaders and in determining the strength of
leadership development and effective job selection.
As noted earlier, the next positions that are to be in the most demand and in a
critical shortage are institutional researchers, directors of learning resources, registrars,
directors of financial aid, directors of admissions, directors of accounting and directors
of human resources. This study focused specifically on the growing need for registrars
and directors of admissions. Registrars rank among the highest of the top positions in
which the turnover will occur (Campbell, 2006). As stated earlier, most individuals have
a career path that is closely aligned to a chosen education track, but there is not an
educational degree for registrar or admissions directors. In a 2002 study, fifty-three
percent of senior college administrators held only a master’s degree. An additional
thirty-eight percent had earned a doctorate degree. Of those, the majority of the senior

15
respondents with doctoral degrees were either presidents or chief academic officers
(Amey, 2002). Selecting the right person for the job is of utmost importance in today’s
demanding environment. Selecting an individual for a career that does not have an
education path can be even more difficult.
Discovering what leadership attributes are needed by the successful enrollment
manager candidate will assist in determining the best candidate. Leadership attributes
reviewed in this study are presented in Appendix G. Although the attributes of each
study were not exact matches, the researcher created cross-walk correlations between
each study’s indicators and descriptions and matched them to the leadership attributes
used in the research instrument (Appendix G). The non-profit sector began
experiencing a leadership gap in 2006 and commissioned the Bridgespan Report in
response. Although the report does not indicate specific leadership attributes desired
for future non-profit leader’s, Spillett does list key descriptors that would make the new
leader successful (Spillett, 2006). These descriptors have been matched to the
leadership attributes defined in this study for further examination. Kachik’s 2003 study
compared the leadership attributes of corporate leaders to community college
administrators utilizing the Occupational Personality Questionnaire (OPQ) as the
research instrument. She identified variances in the leadership attributes of corporate
leaders in comparison to community college administrator’s based on their gender.
Research regarding gender and leadership attributes was also conducted on a group of
community college administrators from the United States (O’Daniels, 2009). This study
will build upon this research of defining leadership attributes and analyzing data to

16
determine if leadership attributes are different for female registrars as compared to male
registrars.
A study describing the leadership attributes of community college presidents in
1997 found that the leadership attributes of the current community college president
was very similar to those attributes envisioned for the 21st century community college
president (Campbell and Leverty, 1997). This study also used the OPQ as its research.
Building upon the findings from the community college president’s study, additional
research has been conducted examining cohorts of higher education doctoral students,
chief business officers, national council for continuing education and training members,
and other community college administrators or board members (Tunks, 2007; Basham,
2007; Berry, 2008; O’Daniels, 2009).
This study built upon the previous research conducted on leadership attributes in
the business sector, non-profit sector and in higher education and will continue the trend
of further examination of leadership attributes in higher education to the mid-level
managers. Specifically, the overall leadership attributes of enrollment managers in
higher education institutions within the United States. This study helped to identify the
traits necessary for the new work profile of a successful registrar and may help to drive
trainings targeted at preparing future registrars for the position. Research on the
importance of leadership development and succession planning will also be extended
through this study. Results from this research study will provide a base framework for
future studies on leadership attributes of mid-level higher education administrators.
This study examined the leadership attributes of successful future enrollment
management administrators by examining the following: if leadership attributes of

17
administrators differ by type of institution; if leadership traits of administrators differ by
size of institution; and if leadership traits of administrators differ by gender. In addition,
it is hoped that trainings could be developed to help better prepare and equip new
candidates for these career opportunities.
Research Questions
This study will provide some insight into the attributes most desired in quality
candidates. Specifically, the researcher will address the following questions:
1) Do registrars at differing institutions throughout the United States share common leadership attributes as other enrollment management professionals?
2) Is there a significant relationship between type of institution as defined by doctoral granting versus non-doctoral granting and leadership attributes for individuals in enrollment management positions?
3) Is there a significant relationship between size of institution and the leadership attributes for individuals in enrollment management positions?
4) Is there a significant relationship between the leadership attributes for males versus females for individuals in enrollment management positions?
Significance of the Study
The changing/aging workforce is creating a need for a new set of highly skilled
leaders. While the cost is significant, the need for making the right choice with senior
hires is more important than ever. The cost of making the wrong selection could cost
colleges millions (Campbell & Associates, 2002). Technology advancements have also
significantly impacted the workforce. The methods of knowledge exchange and
information sharing are constantly changing and evolving (GCN, 2011). Technology
has moved beyond local data storage to global network transparency. Companies must
be prepared to adapt their security training and employee development to the emerging
services that are making their way into enterprise (GCN, 2011).

18
Due to these changes, the leadership attributes new leaders should have need to
be defined. Studies have been conducted by the Society of Human Resource
Management (SHRM), Center for Creative Leadership (CCL), Boston Consulting Group
and American Management Association (AMA) to address the changing workforce
demographics of the aging society and the technological advancements (Leslie, 2009;
BNA, 2010; Jackson, 2010; Minter, 2010). These studies indicate leadership skills gaps
exist in nearly every industry and offer guidance on how industries should begin to
address these gaps. This study provided baseline data on specific higher education
positions that can help aid in the development of leadership training programs,
succession planning and can augment the hiring processes. Many higher education
positions are specialized administrative roles with no clear career paths (Campbell,
2006). The results of this data, combined with previous research may help to better
define career paths within institutions.
This study built upon the previous research of Kachik (2003), Campbell (2006),
Basham (2007), Tunks (2007), Berry (2008) and O’Daniels (2009) in identifying
leadership attributes of college leaders and in determining the strength of leadership
development and effective job selection. This study continued the trend of further
examination of leadership attributes in higher education to the mid-level manager.
Specifically, the overall leadership attributes of enrollment managers in higher education
institutions within the United States.
Definition of Terms
The Higher Education Publication directory (HEP) defines the responsibilities of
the registrar as student registration, scheduling of classes, examinations and classroom
facilities, student records and related matters. The admissions director responsibilities
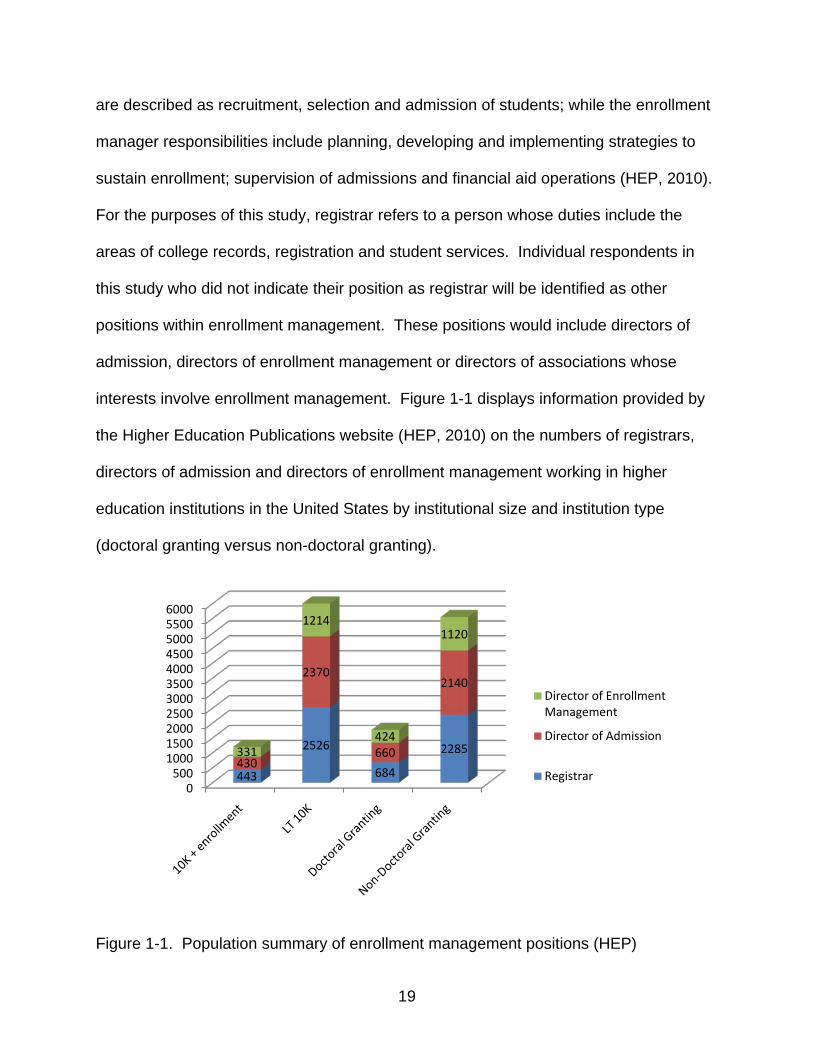
19
are described as recruitment, selection and admission of students; while the enrollment
manager responsibilities include planning, developing and implementing strategies to
sustain enrollment; supervision of admissions and financial aid operations (HEP, 2010).
For the purposes of this study, registrar refers to a person whose duties include the
areas of college records, registration and student services. Individual respondents in
this study who did not indicate their position as registrar will be identified as other
positions within enrollment management. These positions would include directors of
admission, directors of enrollment management or directors of associations whose
interests involve enrollment management. Figure 1-1 displays information provided by
the Higher Education Publications website (HEP, 2010) on the numbers of registrars,
directors of admission and directors of enrollment management working in higher
education institutions in the United States by institutional size and institution type
(doctoral granting versus non-doctoral granting).
Figure 1-1. Population summary of enrollment management positions (HEP)
0500
10001500200025003000350040004500500055006000
443
2526
684
2285430
2370
660
2140
331
1214
424
1120
Director of Enrollment Management
Director of Admission
Registrar

20
Doctoral granting institutions are those identified as offering a doctorate degree
or a specialist degree as the highest degree conferred. Those identified as non-doctoral
granting institutions are those institutions identified as conferring any degree other than
a doctorate or a specialist degree.
Small colleges are those institutions identified with enrollments of less than five
thousand. Moderate colleges are those institutions identified with enrollments of
between five thousand and ten thousand. Medium colleges are those institutions
identified with enrollments of between ten thousand and twenty thousand. Lastly, large
institutions are those identified with enrollments of greater than twenty thousand. For
the purposes of this study, the institutions have been categorized into small/moderate
sized institutions and medium/large sized institutions. The enrollment benchmarks for
size are in relation to the American Association of Collegiate Registrar and Admissions
Officers (AACRAO) membership dues schedule.
The WAVE refers to the personality test and correlating reports, the Executive
Summary, the Psychometric Profile, the Entrepreneurial Potential Summary, and the
Entrepreneurial Profile, developed by Saville Holdings, Ltd.
Thought Construct refers to the cluster of thought within the Saville WAVE
profile. This cluster contains the sections of vision, judgment and evaluation.
Respondents scoring high in the cluster of thought may be considered inventive,
abstract thinkers with the ability to develop effective strategies, the concepts within the
vision section. They may also be quick learners who are able to identify the core of a
problem and enjoy practical work, the concepts within the judgment section. Lastly,
respondents scoring high in the cluster of thought may enjoy solving problems, are

21
strong communicators and are comfortable working with numerical data, the concepts
within the section of evaluation.
Influence Construct refers to the cluster of influence within the Saville WAVE
profile. The cluster contains the sections of leadership, impact and communication.
Respondents scoring high in the cluster of influence are comfortable making quick
decisions, want to take the lead and attach importance to their ability to motivate others,
the concepts within the section of leadership. They are also eager to bring others to
their point of view, frequently change other’s ideas and enjoy giving presentations, the
concepts within the section of impact. Lastly, respondents scoring high on the cluster of
influence want others to know about their successes, attach a high degree of
importance to networking and are quick to establish rapport with people, the concepts
within the section of communication.
Adaptability Construct refers to the cluster of adaptability within the Saville WAVE
profile. The cluster contains the sections of support, resilience and flexibility.
Respondents scoring high in the cluster of adaptability believe they work well on a team,
understand how others feel and are very tolerant of people, the concepts within the
section of support. They are also quick to resolve disagreements, are self-confident
and are calm under pressure, the concepts within the section of resilience. Lastly,
respondents scoring high on the cluster of adaptability respond well to feedback, are
optimistic and enjoy new challenges, the concepts within the section of flexibility.
Delivery Cluster refers to the cluster of delivery within the Saville WAVE profile.
The cluster contains the sections of structure, drive and implementation. Respondents
scoring high in the cluster of delivery are well organized, are concerned with ethical

22
matters and work at a fast pace, the concepts within the section of structure. They also
consider themselves to be very energetic, ambitious and highly competitive, the
concepts within the section of drive. Lastly, respondents scoring high on the construct
of delivery regard may regard themselves as perfectionists, are conscientious about
meeting deadlines and need to have rules and adhere strictly to them, concepts within
the section of implementation.
Leadership attributes for the purpose of this study refers to concepts defining
effective leaders. The attributes examined are relative to the constructs of thought,
influence, adaptability and delivery as defined above. Additionally, Appendix G displays
how these attributes relate to the attributes defined in other research.
Limitations
Data collected at the 2006 AACRAO State and Regional Leadership Workshop
represents a small group of national enrollment management leaders and therefore
does not represent all enrollment managers at every type of institution.
This study included respondents at institutions within the United States and may
not be generalized for other international institutions. The respondents of this study did
not state their ages for study review based on generational differences.
The respondents are volunteers and are expected to have provided honest
answers to their own leadership style. Due to the nature of the response, some bias
may be present. Additionally, the instrument is computer based and is administered in
an unsupervised environment. Assumptions have been made that the respondents
concentrated on the instrument during the administration of the test.

23
Summary
This first chapter has provided an introduction to the importance of leadership
development and succession planning in an ever changing workforce demographic. A
comprehensive review of literature pertinent to this study is presented in Chapter 2.
The research methodology of the study is described in Chapter 3, which includes the
study population, the definition of terms, the data collection, the instrumentation and the
methods of analyzing the data. In Chapter 4, the results of the data analyses are
presented. The study is completed in Chapter 5 with a summary including a set of
conclusions, recommendations for future study and implications in higher education.

24
CHAPTER 2 A CONTEXT FOR INQUIRY
This chapter presents a literature review of leadership attributes, leadership
development and succession planning in businesses and higher education. Results
from this research study will provide a base framework for future studies on leadership
attributes of mid-level higher education administrators. This chapters is divided into five
sections: (a) statement of problem, (b) changing workforce, (c) leadership, (d) talent
management, and (e) role of the registrar. The chapter will conclude with a summary
linking these areas together to set a research rationale for the present study.
The Problem
Selecting the right person for the job is of utmost importance in today’s demanding
environment. Selecting an individual for a career that does not have an education path
can be even more difficult. Businesses are facing a changing workforce demographic
that is creating a leadership skills gap (Smith, 2010). The changing workforce and the
impact of technological advances on daily business activities are creating a ‘current
leadership crisis’ (Smith, 2010). According to a study conducted by Campbell in 2006
higher education is not immune to this crisis. The next positions that are to be in the
most demand and in a critical shortage for higher education are institutional
researchers, directors of learning resources, registrars, directors of financial aid,
directors of admissions, directors of accounting and directors of human resources.
Supporting the findings of the CCL study (2009), a group of community college
presidents stated in a FuturesLeaders Administrative Work Profiling session in 2006,
that even though they were satisfied with the job performance of their current registrar,
they would not rehire that individual if the position were to become vacated

25
(FuturesLeaders-ATG, 2006). They determined that the current registrar skills do not
match the skills needed for the future registrar/enrollment manager. The need for a
better equipped leader combined with the impending shortages has colleges concerned
about their future leadership.
This study focused on the role of the registrar as one of the highest demand
positions. The registrar position was traditionally the policy interpreter and enforcer for
a college. This individual would implement the procedures for which policies would be
adhered to and disseminate the information appropriately. Strong logic and
communication skills were critical in this role (Stewart & Wright, 1997). As enrollment
growth has expanded, so has the role of the registrar. Many registrar positions today
also hold responsibilities in enrollment management. These individuals remain
responsible for the policy implementation, but they are also involved in the development
and decision making of the policies. They now must interpret entering student trends
and the technological needs for their staff in order to continue to provide effective
services. Today’s registrar must have strong logic and communication skills, but may
also need numeric reasoning and complex decision making skills (FuturesLeaders-ATG
Work Profiling, 2006). The leadership attributes for this position have clearly evolved,
however, these new traits may not be the same for all types of colleges.
Changing Workforce
Aging Workforce
Marie Von Ebner-Eschenbach said: "in youth we learn; in age we understand”.
This statement holds the key to the fear many business leaders have regarding an
aging workforce (Jackson, 2010). Baby boomers, individuals born between 1946 and
1964, currently represent nearly one-half of the workforce in the United States (Arnone,

26
2006). “There are 76 million boomers and they are turning 65 at the rate of one every
eight seconds” (Minter, 2010). In 2006, approximately 36 million people were 65 years
or older. By 2030, that number will represent nearly 20% of the population or one in
every five Americans (Arnone, 2006).
The American Association of Retired Persons (AARP) reports that almost half of
the employees between the ages of 45-70 will work into their seventies due to the
current economic environment (Jackson, 2010). Jackson feels this will lessen the talent
gap for many companies who have not begun to prepare for the mass exodus of
knowledge. However, others feel that the delay may only prove to “magnify the ill effect
when it comes to fruition” (Bruck, 2010). As noted earlier, unprecedented numbers of
employees will retire and take with them a wealth of knowledge and history in the next
five years (Jackson, 2010).
In addition to the rapid pace in which individuals will be leaving the workforce, the
decline of well prepared new workers is creating a leadership skills gap. The Center for
Creative Leadership (CCL) conducted a study of more than 2,200 from companies all
over the world (Leslie, 2009). This study revealed the seven competencies for success
as “leading people, strategic planning, managing change, inspiring commitment,
resourcefulness, the ability to do whatever it takes and the quality of being a quick
learner” (Weinstein, 2010). The Society for Human Resource Management (SHRM)
and AARP are working together to promote awareness of the aging workforce. They
identify the issue of filling the retirement void not as one of too few people, but of too
few skilled people (Jackson, 2010). The entering workforce is fewer in number than the
baby boomers exiting and they lack the skills employer’s require (Jackson, 2010). CCL

27
refers to the gap between the skills needed and the current skill level as “the current
leadership crisis” (Smith, 2010).
In 2007, the American Council on Education (ACE) released the latest version of
the American College President Study. According to this study, the average age of
president’s grew from fifty-two in the 1986 study to sixty-one in the 2007 study.
Additionally, the percentage of president’s over the age of sixty-one grew from fourteen
percent in 1986 to forty-nine percent in 2007 (ACE, 2007). These impending
retirements are paving the way for current administrators to take on the presidential
roles (Campbell & Kachik, 2002). A follow-up study conducted in 2005 revealed that a
domino effect of presidential vacancies was creating leadership gaps in key
administrative positions of institutional researchers, directors of learning resources,
registrars, directors of financial aid, directors of admissions, directors of accounting and
directors of human resources (Campbell, 2006).
Generational Differences
Generational differences are also leading towards a change in the workforce
dynamic. Today’s organizations include four different generations with varying ideas of
job desires and expectations (Jackson, 2010). Although the date ranges for each of
these generational classifications are reported differently, the four categories in the
workforce are the Traditionalists, the Boomers, the Xers and the Millennials (Clare,
2009). The Traditionalists (1922-1945) and many of the Boomers (1946-1963) are
typically the current leaders within the organization and are retiring or nearing retirement
age. They hold a great deal of organizational knowledge and the importance of
organizations to ignite the knowledge transfer is evident.

28
The Xers (1964-1976) are the next in line to receive the leadership positions, but
are they prepared? These individuals were raised using technology, are able to multi-
task and are self-reliant (Simons, 2010). These leaders will value a casual, friendly
work environment with flexibility and freedom. These leaders will need to be prepared
to mentor the next generation of leaders, the millennials (Simons, 2010).
The Millennials (1977-1998) are much more social than their predecessors. They
care about much more than money and enjoy balance between their work and social
lives (Fallon, 2009). This new population of employee was raised with continual
communication, made to feel special, were provided instant gratification and are
extremely competitive (Fallon, 2009; Clare, 2009; Tyler, 2007). Technology has
afforded them the opportunity to never be truly alone and this has hindered their
decision making ability (Tyler, 2007). Unlike the Xers, the millennial employees value
interactive relationships and consider their family as friends (Smith, 2010). The
‘helicopter parent’ of the millennial employee has transitioned from the college campus
to the workplace. They seek advice and input from their parents on even the smallest
decisions (Tyler, 2007).
The Traditionalists and the Boomers desired independence and have difficulty
understanding the need for parental connectivity the Millennials desire (Tyler, 2007).
The Xers also struggle with this concept as they were raised as latch-key kids and are
closer to their friends than their family (Smith, 2010). The Xers will need to mentor the
Millennials in a structured, supportive work environment with personalized work (Smith,
2010). In addition to the change in mentoring style, feedback is important to the
Millennial. Employers who provide regular feedback on their progress will find more

29
success in the Millennial employees and will provide them with more job satisfaction,
even more than a pay raise would provide (Fallon, 2010).
Identifying the reasons why each generation chooses to stay and work in certain
positions can help bridge the communication gaps. “Understanding the needs and traits
of each will be critical if we are to engage and motivate these employees and empower
them to strengthen the corporate culture” (Jackson, 2010). Mentoring is a common
theme among writers discussing the growth of the Millennial employee (Clare, 2009;
Fallon, 2010; Buchanan, 2010). Mentoring can also help with the knowledge transfer
that will need to occur as the Traditionalists and Boomers leave the workforce. “The
future of succession planning may well include a move from meeting promotion needs
to meeting knowledge transfer needs” (Rothwell, 2010).
Impact of Technological Advances
Technological advances are also changing the look of the workforce and
consumer expectations. In his opening statements to the House Science and
Technology Committee in April 2009, Bart Gordon stated that “information technology is
a major driver of economic growth and that advances in the field have the potential to
dramatically influence all aspects of our lives from manufacturing and healthcare to
education and entertainment” (Gordon, 2009). Businesses are changing the way they
conduct everyday activities because of these advances. A company with 20 to 49
employees will spend an average of $88,000 a year on technology if they want to stay
up to date with the latest advances (Hall, 2000). Technology life spans are short and
companies willing to keep current with the latest trends need to develop technology
plans that are compatible with their employees and their customers (Hall, 2000). The
healthcare industry discovered the impact of technology on their industry when George
30
W. Bush worked with the 109th Congress to debate whether to improve the quality and
efficiency of care (Braller, 2010). The health IT industry became united at creating the
necessary tools. These tools are now being challenged by President Obama and the
111th Congress to drive the changes in health care spending and policy (Braller, 2010).
These technological changes have impacted how everyone within the healthcare
industry conducts daily business. Technology has impacted every aspect of business
operations. Even the recruitment of new employees has been changed by technology.
In 2011, UBM Studios Unicruit offered a virtual career fair for bringing college students,
alumni and employers together in an online platform for career exploration
opportunities. Some of the companies participating in the virtual career fair included:
Intel, ABC Supply, Secret Service, Department of Treasury, Vanguard, IBM, Amazon,
GEICO and Walgreens (Closeup Media, 2011).
In 1997, social networking was at its infancy with the introduction of web
communities like classmates.com and sixdegrees.com. Social networks are defined as
"web-based services that allow individuals to (a) construct a public or semi-public profile
within a bounded system, (b) articulate a list of other users with whom they share a
connection, and (c) view and traverse their list of connections and those made by others
within the system" (Boyd & Ellison, 2008). From 2002-2004, however, social networking
blossomed with the creation of Friendster.com, Linkedin, MySpace and the most
popular, Facebook. The creation of these sites and the technological evolution that they
have spawned has created a change in the way students view education. It is
interesting that the phenomenon that educators are now embracing to enhance student
engagement actually began on a campus. Facebook, with more than 150 million users,

31
was originally launched as a student project on the Harvard campus and remained
campus-based for its first two years (Nickson, 2009).
In addition to the plethora of social networking sites, there are also hundreds of
mediums in which to view them. Darla Jackson has stated that 2010 was the “Year of
the iPad”. Recent technological advancements and products introduced include the
Sony Reader, Amazon’s e-reader, the Kindle, and Apple’s iPad (Jackson, 2010).
Technology is changing how our students learn and how our employees work. This
change is also impacting how leaders must lead the new technologically acute
employee (Fallon, 2009).
EDUCAUSE Center for Applied Research (ECAR) conducted a study in 2007 on
undergraduate students and information technology. The study found that the students
owned more technology than the students in the previous two studies. Additionally, the
student’s usage patterns of these technologies had changed (Borreson & Salaway,
2007). More than eighty percent of the respondents in the study were engaged in social
networking (Borreson & Salaway, 2007). These technologies allow students to have
access to information wherever they are and is changing the face of education.
Technology has begun to change the look of colleges and the roles of registrars.
The new generation of student is more technically adept than their predecessors.
During the first major role change for registrars, in the 1970s, mainframe computers
were the budding technology. Mainframe systems were internally controlled and
allowed for internal efficiencies and effective data collection (Stewart & Wright, 1997).
As described earlier, data is everywhere and regulating and monitoring its access is
becoming increasingly more difficult.

32
Technology plays a crucial role in the job responsibilities of a registrar. Simply, the
registrar is the keeper of student data and the gatekeeper to accessing this information.
“Rapidly changing technology makes it challenging to keep abreast of the privacy,
security, and management of information and identities” (McConahay, West, Hanson &
Woodbeck, 2009). A registrar must understand how a student will want to receive
information and then communicate that need to the technological staff who can deliver
the product.
Leadership
Leadership is a word that is often used to describe the characteristics of the top
managers, however, it is the application of these characteristics that exhibits the true
meaning. Literature contains many examples of leadership characteristics. The seven
attributes essential to leadership, according to Bennis, are “technical competence,
conceptual skills, track record, people skills, taste, judgment and character” (Bennis,
1989). Furthermore, he describes the three characteristics most prevalent in leaders
are drive, competence and integrity. Morley and Eadie observed that leadership is not
well defined and is more of an art than a science (Morley & Eadie, 2001). So what
makes an effective leader? Identifying the crucial leadership attributes for a given job
helps make this determination.
Leadership attributes differ in their definition, description and in their importance in
the position they are needed. Stogill’s research in 1948 compared the common traits
and skills shared between leaders and experts (Stogill, 1948, 1974 (as cited in
Germaine, 2008). The common skills and traits were identified as ambitious, able to
judge/assess, outgoing, self-confident/self-assured, knowledge, problem-solving skills,
intuitive, able to deduce, able to improve, charisma and drive (Germaine, 2008). These

33
skills identified in 1948 closely mirror the skills described as needed for today’s
businesses in the 2009 study by the Center for Creative Leadership (CCL). The skills
described by CCL as necessary for the future business leaders are leading people,
strategic planning, inspiring commitment, managing change, resourcefulness,
participative management, being a quick learner, employee development, doing
whatever it takes and balancing personal life and work (Leslie, 2009). These
competencies compliment the emergent themes of leadership competencies identified
by the American Association of Community Colleges (AACC). These themes are
organizational strategy, resource management, communication, collaboration, advocacy
and professionalism (Campbell, Syed and Morris, 2010).
The key leadership attributes of the new non-profit leader, however, differ
somewhat in their trait descriptions. These attributes are described as future focused,
passionate communication, relationship building, accountability, organizational skills
and team building (Spillett, 2006). The differences between the leadership attribute
description of the corporate leader and that of the non-profit leader may be key to the
job expectations. Research indicates that position plays a role in determining what
leadership attributes are important for a given position (Lovell & Kosten, 2000; Campbell
& Leverty, 2007; Berry, 2008; O’Daniels, 2009). Determining how closely the higher
education leaders mirror the business leader or the non-profit leader can help to
determine their most effective leadership attributes.
A study of college of union director’s found that these leaders were
transformational leaders and exhibited leadership attributes of influence and motivation
(Mironack, 2003). A study describing the leadership attributes of community college

34
presidents in 1997 found that the leadership attributes of the current community college
president was very similar to those attributes envisioned for the 21st century community
college president (Campbell and Leverty, 1997). In a 2008 study of community college
business officers and workforce development officers and national continuing education
trainers, Berry found that each group had distinct work styles from one another and that
developing a program for identifying the job attributes was beneficial (Berry, 2008). The
leadership attributes of the community college presidents and those of the chief
business officers share some similarities, but are not a perfect match as the job
requirements call for differing leadership attributes.
The skills needed to be an effective student affairs’ administrator were reviewed by
Lovell and Kosten (2000) and it was found that there are skills, knowledge bases and
personal traits that help define the role. Specifically, the knowledge of student
development theory and functional area responsibilities and the personal traits of
integrity and cooperation are necessary to a successful student affairs officer (Lovell &
Kosten, 2000). The traditional effective student affairs practitioner is “a strong
communicator and good listener who can motivate others, plan, implement and deal
with conflict and crisis situations” (Kleinglass, 2005). Student affairs leader qualities are
often associated with student feelings (Lovell & Kosten, 2000).
As leaders they, “influence the thoughts, behaviors, and/or feelings of others”
(Gardner & Larkin, 1996). “Leadership is any attempt to influence the behavior of
another individual or group” (Hershey & Blanchard, 2007). Leadership is a “shared,
interactive, culturally framed activity” (Bensimon & Neumann, 1993). These qualities

35
match those identified by Lovell and Kosten for the student affairs administrator in that
they exhibit integrity and cooperation (Lovell & Kosten, 2000).
The registrar position can be defined as a mid-level administrative position in
higher education. The Higher Education Publication directory (HEP) defines the
responsibilities of the registrar as student registration, scheduling of classes,
examinations and classroom facilities, student records and related matters. The
admissions director responsibilities are described as recruitment, selection and
admission of students; while the enrollment manager responsibilities include planning,
developing and implementing strategies to sustain enrollment; supervision of
admissions and financial aid operations (HEP, 2010). Comparing the leadership
attributes of individuals within these positions will help to build careers paths and
leadership training opportunities. The American Association of Collegiate Registrar and
Admissions Officers (AACRAO) worked with the FuturesLeaders-ATG group to define
the important attributes for the new registrar/enrollment manager as strong
communication, numeric reasoning and logic (FuturesLeaders-ATG Work Profiling,
2006). The changing workforce demographics and the innovation of technology are
redefining the job responsibilities of many positions in every industry. The new
responsibilities these changes are placing on the new registrar/enrollment manager can
impact the success of the institution. As a component of the person specific review and
job description development for the new registrar/enrollment manager, the objective to
“champion technology and utilize it to project trends appropriately, maintaining student
privacy as required” was described as a necessary attribute. Additionally, three of the

36
nine stated job objectives dealt directly with the use, collection and dissemination of
data (FuturesLeaders-ATG Work Profiling, 2006).
Gender in Leadership
Literature supports the theory that leadership attributes between males and
females differ, however, they are not in agreement as to what the strongest leadership
attributes are for women (Powell, 1988). In a 1995 study by Gibson, found that many
leadership behaviors and styles did not vary across gender. (Gibson, 1995 (as cited in
Kachik, 2003). However, Balkis and Isiker indicate that gender differences do exist
between males and females in terms of thinking styles (Balkis and Isiker, 2005 (as cited
in O’Daniels, 2009).
Kachik’s 2003 study specifically focused on gender as a variable in the
relationships between personality testing and the managerial environment. The study
was comprised of male and female leaders from community college administration and
private sector business. The study concluded that there were differences in the
characteristics males and females, however, they were not as prevalent in every
construct. The detail conscious attribute showed to be the most significant with females
being more precise and accurate than their male counterparts. The greatest
significance was found between male community college administrators and female
corporate leaders (Kachik, 2003). The study also compared the leadership attributes of
female corporate leaders with those of female community college leaders and found
that female community college leaders are more detail conscious and that the
leadership attributes of the female corporate leader was more comparable to those of
the male community college administrator. Further research on gender leadership
attributes by O’Daniels found that females were more principled and striving than their

37
male counterparts in that they are more discreet in work situations and are ambitious
(O’Daniels, 2009).
Talent Management
Businesses have concentrated on talent management for years. More than just
human resource management, talent management includes, “workforce planning, talent
gap analysis, recruiting, staffing, education and development, retention, talent reviews,
succession planning, and evaluation (McCauley & Wakefield, 2006). Identifying the
employees who have the aspiration and engagement to succeed in leadership roles will
be the key to the future success of businesses (Minter, 2010). Talent management will
be the most important aspect for human resource divisions in this growing environment.
“Leading-edge companies are increasingly adopting sophisticated methods of
analyzing employee data to enhance their competitive advantage” (Davenport, Harris &
Shapiro, 2010). Companies such as Google, P&G, Royal Bank of Scotland and Intel
have all established analytics groups to gather more insight into their people practices.
In 2009, Harrah’s Entertainment used organizational psychologists to create predictive
assessments for candidates in an external sales force. The results of the hiring from
these assessments helped reverse a decline in sales (Davenport, Harris & Shapiro,
2010).
Generational factors and job desire match is another component to talent
management that is allowing companies to begin to revamp their industries. As
mentioned earlier, the Millennial employee values giving back (Fallon, 2009). An
employer who can recognize this trait could allow employees to modify their work
schedules in order for them to become engaged within a particular cause. These types
of changes could enhance employee engagement and employee satisfaction for

38
business. Absenteeism and turnover rates go down, while employee satisfaction
improves when employees are given the opportunity to negotiate their work schedules
with others (Bruck, 2010). Additionally, the ability to create a flexible work schedule is
appealing to the older employee who may be interested in continuing to work, but are
not interested in maintaining the long hours (Jackson, 2010). This could be helpful in
slowing the leadership exodus and allowing for more time for knowledge transfer.
Leadership Development
Turnover has been a focus of the leadership development discussion for the past
15 years (Campbell, 2006). An aging workforce combined with the decreasing numbers
of college graduates has created a great demand of leadership development. All
industries will need to prepare the future leaders of their organizations. As noted earlier,
one of every five Americans is expected to be 65 years of age or older by 2030 (Arnone,
2006). Additionally, eighty million workers are expected to retire over the next 25 years
(Sacks, 2006). The infusion of leadership development initiatives and strategies within
all levels of business, industry, and educational institutions will help to prepare for the
impeding impact of retirements.
Although business and industry have traditionally been more proactive in utilizing
and providing a variety of venues to create leadership opportunities for their employees
they too are experiencing growing pains. A survey on CEO succession planning
conducted in 2010 found that although 69% of the respondents felt that they needed to
have someone ready to step into the position now, only 54% were actually grooming
someone to take the helm (Heidrick & Struggles, 2010). The survey also noted that
nearly half of the respondents could not identify an internal CEO candidate if the current
CEO were to leave (Heidrick & Struggles, 2010). Still others like Hewlett-Packard (HP)

39
have found ways to grow their own leaders. HP narrowed the search for a new CEO
down to three internal candidates in 2010 (Ricadela & Brady, 2010).
Some businesses are recognizing these issues, however, and are beginning to
train a new class of leaders. W.R. Grace, a chemical manufacturing company,
recognized the impending leadership gap and developed a manufacturing leadership
program in 2002 (Minter, 2010). This program allows recent college graduates the
opportunity to work within the organization for two-years, rotating between different sites
and different locations. The program is designed to allow participants to determine
which areas of the organization they like best and to help them hone their skills to be
key candidates when leadership openings occur (Minter, 2010).
Like industry, colleges have gone through cycles of preparing future leaders and
are currently on an upward trend of recognizing the need. The importance of
succession planning in higher education has continued to grow since the late 1990s.
Magner has claimed, “succession planning is going to change higher education”
(Magner, 2009). Many colleges are embracing the concept of succession planning and
creating programs within their own institutions. The approaches to these programs may
be different, but they are all seeking to build the leaders for tomorrow’s higher education
institutions.
Kennesaw State University offers a program that focuses on addressing core
leadership competencies through a variety of interactive classroom sessions, field trips
and social activities. The program participants are able to learn more about the mission
and strategic goals of Kennesaw State while gaining exposure to leadership roles at the
institution (Davis, 2011). The University of California at Riverside offers employees the

40
opportunity to enhance their current skills for future leadership positions through the
Management Skills Assessment Program (MSAP). This program is designed to allow
employees to enhance their effectiveness in their current role and become more
competitive within the workforce (Davis, 2011).
Daytona State College began the Leadership Development Institute (LDI) in 2003
(Carroll & Phillips, 2004). The LDI program is a year-long program that employees of all
levels are eligible to attend. The program enrollment is limited and employees must
apply to participate. LDI offers a full agenda of leadership training, assessments,
mentoring and formal education opportunities. LDI is one component of the College’s
succession plan (Carroll & Phillips, 2004).
In 2002, the presidents of all community colleges in Massachusetts also
recognized the impending problems of future retirements and became the official
sponsors of the Community College Leadership Academy (CCLA) (Crosson, Douglas,
O’Meara & Sperling, 2005). This program provides a year-long experience for senior
and middle management and faculty from throughout community colleges in
Massachusetts. The program features day-long monthly seminars, required readings
and writings, and activities. The program is designed to help hone leadership skills
(Crosson, Douglas, O’Meara & Sperling, 2005).
Each of these programs offer exposure to leadership concepts and current
campus leaders for the participants, but do not seem to be fulfilling the noticeable gap in
leadership. “Leaders seem caught in the currency of leadership succession patterns,
still assuming traditional paths into senior administrative positions” (Amey, 2002).

41
Rothwell (2010) explained that even succession planning is an ever-changing
process. The future of succession planning must be focused not on meeting
promotional needs, but on the need for transfer of knowledge. Additionally, there
should be an increase in the integration of succession planning and career development
(Rothwell, 2010). The idea of creating a technical succession plan versus a
management succession plan ensures that individuals nearing retirement with specific
technical abilities will have transferred the knowledge to others prior to their departure.
National organizations have also developed programs specific to their niche of
employee to help train leaders for the new college leadership roles. Some of these
programs include Future Leaders Institute, Institute for Aspiring Senior Student Affairs
Officer, Millenium Leadership Initiative, Women’s Leadership Institute and HERS
Summer Institute (ACE, 2011). Each of these programs is designed specifically for
select higher education populations and is focused on creating leaders for the
impending vacancies. Additionally, they provide a networking and mentoring
opportunity for participants in the same field.
One trend that colleges and industry must focus on, however, is the idea that more
training does not always lead to more qualified candidates (Bos, 2007). Effective
participant selection and program evaluation must accompany any leadership
development program in order to truly yield positive results (Harrison, McKinnon &
Terry, 2006).
Succession Planning
Succession planning began in the middle-ages as a transfer of land and authority
to an heir and has grown to a concept of focusing talent (Hartley, 2008). The current,
“talent age”, is one in which succession is not just defined for leadership, but is an

42
inclusive strategy for everyone within an organization (Hartley, 2008). Succession
planning is integral to business success and can be defined, “a systematic process of
developing individuals to fill an organization’s key roles.” (Harrison, McKinnon & Terry,
2006). Growing talent within an organization can provide stability and can maintain
historical knowledge (Smith, 2010).
During a time when the workforce is aging and the number of qualified candidates
is declining, the need for succession planning in business is great. Due to the aging
workforce, technological advances and potential gaps in leadership, business and
industry have also recognized the need to transcend succession planning beyond the
top positions within the organization and are now focusing on the lower levels (Bos,
2007). Organizations positioned to succeed will need to recognize that leadership gaps
will occur at every level and will be prepared to address them.
Ernst & Young conducted a survey in 2006 with the Human Capital Leadership
Institute to determine how organizations are responding to the aging workforce.
(Arnone, 2006). The study found that few employers are undertaking programs aimed
at retaining older workers (Arnone, 2006). If efforts are not focused on retaining an
older workforce, then there must be a rising group of leaders ready to fill the roles. In
response to this, Boston Consulting Group and the world Federation of People
Management Associations, released a report in 2010 on the importance of companies
focusing their efforts on managing talent (BNA, 2010). The report found that fifty-six
percent of the survey respondents mentioned the existence of “a critical talent gap for
senior managers’ successors” (BNA, 2010). Another study released by Bridgespan in
2009 found that there would be a need to hire 640,000 senior-level non-profit managers
43
by 2016. Additionally, between June 2007 and December 2008, seventy-seven
thousand non-profit management jobs were opened and one out of every four (25%)
was filled internally (Josyln, 2009). If “homegrown talent” is the most effective to
assume leadership within the company, why is it that more than half of the executive
positions are filled from outside candidates? (BNA, 2010).
The educational level of applicants has also been reviewed. A report by Spellings
in 2006, however, indicated that higher education was in need of reform and that the
numbers of graduates was declining. Additionally, this report called for the business
community to become directly involved with higher education leaders in developing the
strategies to improve the system (Spellings, 2006). To further complicate the problem
for community colleges, the number of individuals seeking advanced degrees in
community college administration has been declining over the past two decades
(Patton, 2004).
Corporations with effective succession management plans are poised for the
crisis. Google has created a talent value model of succession planning that helps
identify why employees choose to stay with the company and creates a distribution
curve based on employee performance. The plan helps individuals who might be
“misplaced or poorly managed” by identifying the lowest five percent of performers and
infusing an active plan for improvement (Davenport, Harris & Shapiro, 2010).
Companies like Disney and GE also embraced this concept early and were able to
handpick successors for their top positions (Barden 2006).
The answer lies in the design of the succession plan and in the leadership
development tied to the plan. Studies indicate that comprehensive succession planning
44
and dedication of senior management to talent development yield better corporate
success (Minter, 2010). The American Management Association (AMA) conducted a
study on global leadership development and found “significant statistical correlation”
between market performance and the firms with global leadership development
programs (Minter, 2010).
Higher education institutions have recognized this trend and are seeking ways to
ensure a viable workforce is available. Growing demand for college leadership and a
gap in the leadership talent available makes succession planning and leadership
development a priority for higher education (Campbell, 2006). Talent management
including these concepts is the key to this transformation. Leadership style and
behavior can be modified through specific training or educational programs to better
equip the leaders of the future (Tunks, 2007). Community colleges are leading the way
for higher education in the concept of leadership development and succession planning
(Dembicki, 2006). In 2006, sixteen community colleges, two community college districts
and five state system leadership development programs were examined and similar
approaches were highlighted. These successful approaches included involvement of
upper administration in the program development and implementation, flexible
curriculum, program delivery that includes team building and mentoring and evaluation
for continual program growth (Dembicki, 2006).
Leadership development and succession planning may help to address the need.
Colleges and universities, however, have hiring practices that indicate a need for
leadership evolution (Barden, 2006). Colleges and universities are immune to fashions
and trends, they are stable and well defined. This high level of consistency has led

45
some college leaders to the notion that only real change can occur with the hiring of
outside leadership, causing the leadership evolution (Barden, 2006). However,
promotions within education tend to be based upon an individual’s academic success
and not necessarily on the best fit for the institution (Yieldler and Codling, 2004).
Role of the Registrar
The rapid changes in workforce demands, student needs and technology are also
forcing a change in the required attributes of a registrar. The new registrar/enrollment
management leaders will need to adapt to this change and continue to be at the
forefront of effective student communication.
The first registrar was appointed at Oxford in 1446 and remained a part-time
position in the United States until the early 1900s (Stewart & Wright, 1997). Early job
duties included record keeping, registering students, scheduling high school visits,
admitting students, awarding financial aid and conducting research. In 1974, the Family
Educational Rights and Privacy Act (FERPA) was signed into law and thus created a
new definition of registrar (USDOE, www.ed.gov). The new registrars were now
expected to be more data oriented, be able to respond to new legislative mandates,
provide good customer service and keep up with the growing enrollments (Pelham,
Presswood & Roof, 2006). This was the beginning of the concept of enrollment
management. Enrollment management can be defined as “a comprehensive process
designed to help an institution achieve and maintain the optimum recruitment, retention,
and graduation rates of students, where ‘optimum’ is defined within the academic
context of the institution” (Dolence, 1993). Current job duties of registrars vary between
institutions, but most contain the following, as described in a 2010 State University of
New York human resources job posting may include:

46
overall responsibility for initiating and maintaining the permanent academic record of each student and for the registration of all students; work with the academic staff in coordinating the time schedule for classes including the assignment of classroom space; maintains accurate records of all college courses and curriculum requirements; has the responsibility for planning for and supervising all pre-registration and registration for classes; preparation and printing of all registration material and forms for each registration period; initiation and maintenance of all student academic records including the collection of grades, reporting of grades, preparation of grade reports and transcripts, deficiency reports, preparation of an honors list, probation status reports, class ranking, and microfilming/imaging of student records; must have a thorough awareness of the continually increasing application of computerization and computer technology on all phases of registrar operations; works closely with institutional research and computer staff in compiling statistical data required for various college class size, faculty load and enrollment reports; is responsible for working with campus departments, divisions and schools to determine eligibility of students for graduation; maintains close liaison with the student accounting office in determining eligibility for registration and graduation; is responsible for all the administrative affairs of the registrar's office.” (SUNY, 2010)
Registrars are a hybrid between the student affairs administrator and the
academic officer. Some institutions have reporting structures where the registrar is
housed with student affairs; such as Seminole State College in Florida or California
State Polytechnic University in Pomona, California (Seminole State College, 2010;
California State Polytechnic University, 2010). Other institutions, however, have
structures that have the registrar report through the division of academic affairs; such as
Rhode Island College in Providence, RI or Slippery Rock University in Slippery Rock,
PA (Rhode Island College, 2010; Slippery Rock University, 2010). As the job duties of
the registrar range from student advocate to interpreter of academic policy, it is easy to
see why the position could exist in either realm.
Kendra Hamilton (2004) explored the traditional pathways to the college/university
presidency and found that student affairs professionals are beginning to break new
ground and are finding ways to move into the top job. Her study agreed with Amey’s

47
study in 2002 that indicated the traditional path to the presidency is through academic
affairs, however, her study went on to state that student affairs leaders who have a
Ph.D., teach, publish and participate in their academic discipline are more likely to be
promoted to a presidency. The driving question is in what field should the student
affairs administrator earn their Ph.D.? (Hamilton, 2004). As many succession plans
involve the development of employees through the advancement of degrees, this
question is at the heart of the issues of student affairs officers. The traditional route to
the presidency, chief academic officer, has an academic discipline and field in which to
focus. The student affairs officer could study student counseling, student development
or higher education and stay on top of their own field while working to progress. The
registrar position, however, is a hybrid of academic and student affairs. This position
does not have a traditional educational route and therefore, a succession plan for a
registrar must be developed.
Closing the ‘Gap’
Hiring the right person for the job is becoming more important as the numbers of
vacancies grows. Tools that can identify the best person-job fit will help reduce turnover
and help companies keep their hiring costs lower. Business and industry are utilizing
personality questionnaires and simulations during the interview process to identify
person matches. Forty percent of median-sized companies are using personality
questionnaires and an additional thirty-two percent use simulations during the interview
process (Campbell, 2009). Colleges, conversely, are not utilizing these tools in
identifying candidates with only four percent of community college leaders indicating
they use these tools (Campbell, 2009). “Hiring the right person at the outset for any
administrative position is crucial to the future of a college” (Campbell 2009).

48
In 1997, the 21st Century Education Leadership Profiles Project was created to
assist in developing and selecting professionals to address the leadership gap
(Campbell, Syed & Morris, 2010). The project focused on the leadership attributes and
work styles of successful college presidents. The Profiles Project and additional
research conducted at the University of Florida, have recognized the Occupational
Personality Questionnaire (OPQ) as contributing to the translation of work styles and
confirm that it can be used to assess managerial, professional, entrepreneurial and
personal qualities (Campbell, Syed & Morris, 2010). Additionally, research conducted
by O’Daniels and Basham have further indicated that the Saville WAVE instrument
accurately measures what it is designed to measure (O’Daniels, 2009 & Basham,
2007). The WAVE instrument is designed to measure motives, talents and preferred
culture of respondents for use in selecting and training (Saville, 2006).
The changing demographics of the workforce, the dynamics of technology, the
new millennial employee and student have created a need for a newly defined registrar.
The American Association of Collegiate Registrar and Admission Officers (AACRAO)
worked with Saville Consulting in 2007 to develop a person specification and a job
description for the newly title dean/director of enrollment and registrar. As a component
of the person specific review and job description development, the objective to
“champion technology and utilize it to project trends appropriately, maintaining student
privacy as required” was described as a necessary attribute. Additionally, three of the
nine stated job objectives dealt directly with the use, collection and dissemination of
data (FuturesLeaders-ATG Work Profiling, 2006).

49
Summary
The changing workforce is creating leadership skills gaps in all industries,
including higher education. The changing face of college campuses through the
advancement of technology, the aging population, the lack of prepared college
graduates and the impending retirements will change the roles of the new
administrators. These changes have created a demand for a new work profile of the
registrar/enrollment manager within higher education. The registrar is a key position in
higher education administration and this position will face dramatic changes. The
registrar must be knowledgeable in the field of technology and in their ability to bridge
the gap between the needs of students, employees and information technology
professionals. The lack of an educational career path for this field is making it more
difficult to determine the potential leadership pool.
This study built upon the leadership attributes identified in other senior college
administration positions from previous research and in the research indicating the
importance of leadership development and succession planning. This study identified
the traits necessary for the new work profile of a successful registrar and may help to
drive trainings targeted at preparing future registrars for the position. This chapter has
provided a literature review of the changing workforce demographic, leadership
attributes, talent management (leadership development and succession planning) and
specific job responsibilities of the higher education registrar. Table 2-1 summarizes the
leadership gap that exists in every industry and states possible solutions that have been
provided in this chapter. The research methodology of the study is described in the
next chapter, which includes the study population, the data collection, the

50
instrumentation and the methods of analyzing the data to address the research
questions.

51
Table 2-1. Leadership gap/deficit summary Business Sector Research to support Proposed solutions International businesses
Center for creative leadership (2009)
Smith (2010)
Communicate specific behaviors and skills desired Assess leaders on key skills Create training programs Expose current managers to the needed skills Support learning Encourage managers to have career goals Develop succession plan Evaluate and measure program success
American corporations
Kachik (2003) Leslie (CCL 2009) Smith (2010) American Association
of Retired Persons (AARP ) - 2009
Society of Human Resources Management (SHRM ) – 2009
Communicate specific behaviors and skills desired Assess leaders on key skills Create training programs Expose current managers to the needed skills Support learning Encourage managers to have career goals Develop succession plan Evaluate and measure program success Create flexible schedules and other incentives to
maintain and recruit the older employee
Non-profit leadership
Spillett, et. al (Bridgespan report 2006)
Provide development opportunities in budgeting, working with trustees and fundraising/development
Modify compensation and benefit packages to make the positions more appealing
Community college leadership
Campbell & Leverty (1997)
Shults (2001) Kachik (2003) Campbell (2006) American Council on
Education (2007) Basham (2007) Tunks (2007) Berry (2008) O’Daniels (2009)
Leadership development programs Succession planning Identify specific skills needed Assess leaders on key skills
Higher education leadership
Lovell & Kosten (2000) Tunks (2007) Berry (2008) Middlehurst (2008) Mann (2010)
Leadership development Building leadership legitimacy through ‘track-
record’ of success Mentoring and coaching Peer collaboration

52
CHAPTER 3 RESEARCH METHODOLOGY
This chapter defines the research methodology used in the research study. The
purpose of the study and the design are detailed. The research problem is defined in
detail. The study sample, research instrument and data collection method are
described.
Purpose of the Study
The primary purpose of this study was to determine if enrollment managers from
differing institutions, holding different positions within enrollment management had
common leadership attributes. The study built upon the previous research of Kachik
(2003), Campbell (2006), Basham (2007), Tunks (2007), Berry (2008) and O’Daniels
(2009) in identifying leadership attributes of college leaders and in determining the
strength of leadership development and effective job selection.
As noted earlier, the next positions that are to be in the most demand and in a
critical shortage are institutional researchers, directors of learning resources, registrars,
directors of financial aid, directors of admissions, directors of accounting and directors
of human resources. This study focused specifically on the growing need for registrars
and directors of admissions. Registrars rank among the highest of the top positions in
which the turnover will occur (Campbell, 2006). As stated earlier, most individuals have
a career path that is closely aligned to a chosen education track, but there is not an
educational degree for registrar or admissions directors. Selecting the right person for
the job is of utmost importance in today’s demanding environment. Discovering what
leadership attributes are needed by the successful enrollment manager candidate will
assist in determining the best candidate.

53
This study continued the trend of further examination of leadership attributes in
higher education to the mid-level manager. Specifically, the overall leadership attributes
of enrollment managers in higher education institutions within the United States. This
study examined the leadership attributes of successful future enrollment management
administrators by examining the following: if leadership attributes of administrators
differ by type of institution; if leadership traits of administrators differ by size of
institution; and if leadership traits of administrators differ by gender. Results from this
research study will provide a base framework for future studies on leadership attributes
of mid-level higher education administrators.
Research Problem
Critical shortages in administrative positions in higher education across the United
States are expected in the next five years. In 2005, a group of community college
presidents were asked to project retirements within their institutions. As noted earlier,
this study indicated that student affairs administrators are among the highest in which
this turnover will occur (Campbell, 2006). Some of the presidents within this group also
indicated that, even though they were satisfied with the job performance of their current
registrar, they would not rehire that individual if the position were to become vacated.
The registrar position was traditionally the policy interpreter and enforcer for a
college. This individual would implement the procedures for which policies would be
adhered to and disseminate the information appropriately. Strong logic and
communication skills were critical in this role (Stewart & Wright, 1997). As enrollment
growth has expanded, so has the role of the registrar. Many registrar positions today
also hold responsibilities in enrollment management. These individuals remain
responsible for the policy implementation, but they are also involved in the development

54
and decision making of the policies. They now must interpret entering student trends
and the technological needs for their staff in order to continue to provide effective
services. Today’s registrar must have strong logic and communication skills, but may
also need numeric reasoning and complex decision making skills (FuturesLeaders-ATG
Work Profiling, 2006). The leadership attributes for this position have clearly evolved,
however, these new traits may not be the same for all types of colleges.
This study provided some insight into the attributes most desired in quality
candidates. Specifically, the researcher addressed the following questions:
1) Do registrars at differing institutions throughout the United States share common leadership attributes as other enrollment management professionals?
2) Is there a significant relationship between type of institution as defined by doctoral granting versus non-doctoral granting and leadership attributes for individuals in enrollment management positions?
3) Is there a significant relationship between size of institution and the leadership attributes for individuals in enrollment management positions?
4) Do female enrollment management professions at differing institutions throughout the United States share common leadership attributes as male enrollment management professionals?
Research Hypothesis
H0-1: Those leaders identified in registrar positions will not exhibit any significant difference on the constructs of thought, influence, adaptability or delivery than their enrollment management counterparts.
H1: Those leaders identified in registrar positions will exhibit significant difference on the constructs of thought, influence, adaptability or delivery than their enrollment management counterparts.
H0-2: Those leaders identified in any enrollment management position working at doctoral granting institution will not exhibit any significant difference on the constructs of thought, influence, adaptability and delivery than their enrollment management counterparts at non-doctoral granting institutions.
H2: Those leaders identified in any enrollment management position working at doctoral granting institution will exhibit significant difference on the constructs

55
of thought, influence, adaptability and delivery than their enrollment management counterparts at non-doctoral granting institutions.
H0-3: Those leaders identified in any enrollment management position working at large/medium sized institution will not exhibit any significant difference on the constructs of thought, influence, adaptability and delivery than their enrollment management counterparts at small/moderate sized institution.
H3: Those leaders identified in any enrollment management position working at large/medium sized institution will exhibit significant difference on the constructs of thought, influence, adaptability and delivery than their enrollment management counterparts at small/moderate sized institution.
H0-4: Those female leaders identified in any enrollment management position will not exhibit any significant difference on the constructs of thought, influence, adaptability and delivery than their male enrollment management counterparts.
H4: Those female leaders identified in any enrollment management position will exhibit significant difference on the constructs of thought, influence, adaptability and delivery than their male enrollment management counterparts.
Research Design
Survey research was conducted to analyze the leadership attributes of admission,
registrar and enrollment managers at varying educational institutions throughout the
United States that are members of the American Association of Collegiate Registrar and
Admission Officers, hereto throughout referred to as AACRAO. Statistical analysis,
including analysis of variance and descriptive statistics was used to determine if there is
a relationship between leadership attributes among individuals in similar positions at
differing institutions, if these attributes remain the same if the institution type changes, if
these attributes remain the same if the institution size changes and if the WAVE is a
suitable tool for determining these attributes.
Methodology
To explore the research questions, a leadership inventory was selected and
distributed to a diverse population of admissions officers, registrars and enrollment

56
managers throughout the United States. The diversity is defined by location of
institution, type of institution, type of position and size of institution. The leadership
inventory selected was the Saville Consulting WAVE assessment.
As data from the WAVE was collected in December 2006, through collaboration
between the American Association of Collegiate Registrar and Admissions Officers,
AACRAO, and Saville Consulting for a diverse group of admissions, registrar and
enrollment managers, the researcher requested access to this data to address the
research questions.
The data analysis summarized the individual responses into four distinct
categories. The categories are gender of leader, size of institution, type of institution
and type of position. The gender is defined as either male or female and is self
reported in the inventory survey. The size of the institution is defined by either
small/moderate schools with enrollments of less than 10,000 in the Fall 2009 integrated
postsecondary data system (IPEDS) report or medium/large schools with enrollments of
10,000 or greater in the Fall 2009 IPEDS report. The type of institution is defined by
either doctoral degree granting or non-doctoral degree granting as defined by the
National Center for Educational Statistics website. (http://nces.ed.gov/globallocator/).
The types of positions are registrars or other enrollment management or admissions
professional as a self-identified component of the survey instrument.
Instrumentation
The instrument used for this research, WAVE, is a “behavioral questionnaire
developed for use in selecting, developing and establish career paths in businesses”
(Saville & Holdsworth LTD., 1996(as cited in Campbel & Kachik, 2002 and Basham,
2007). The WAVE is a personality test based upon four clusters, including thought,

57
influence, adaptability and delivery. See Appendix A. Each of the four clusters contains
three sections, each of the three sections contains three dimensions and each of the
three dimensions contains three facets. Overall, there are 108 facets. Each facet is
presented two to three times throughout the questionnaire.
This study focused specifically at comparing each group defined above within
each cluster. The cluster of thought contains the sections of vision, judgment and
evaluation. The cluster of influence contains the sections of leadership, impact and
communication. The cluster of adaptability contains the sections of support, resilience
and flexibility. The cluster of delivery contains the sections of structure, drive and
implementation. Each of these clusters is further display in Appendix A.
The WAVE is validation centric. It is designed to reveal personality characteristics
of an individual, assesses the individual’s leadership potential and describes the
environments in which the individual will work best or in which they should not work
(Saville, 2006). The questionnaire takes about 35-45 minutes to complete.
Respondents can receive a wide variety of reports from the test. The respondents in
this study received the Types report and the Expert report. The Types report outlines
the typical approach the respondent would have in their work setting towards people
and tasks. A respondent could be identified as an adaptor, transformer, individualist or
influencer in regards to people and a thinker, transactor, preserver or doer in relation to
accomplishing tasks. The two traits combined help to describe the respondent’s
leadership style. One example may be that the respondent’s results indicate that they
are an influencer-transactor. This type of leadership style is indicative of someone who
is capable of leading people to deliver impressive results. They create a compelling

58
vision and use assertive approaches to get people to buy into their plans. They know
exactly where they are going and focus on getting results. This single-minded pursuit of
a clear direction can at times lead to an autocratic leadership style (Saville, 2006).
The expert report provides the respondent with an executive summary of their
results, grouped under the four major cluster headings of thought, influence, adaptability
and delivery. Under each of the four major clusters, the sten score for each is displayed
for all 36 dimensions. The report also defines the response summary and rates the
respondent’s acquiescence when answering questions, consistency of rankings, the
motive-talent agreement and the normative-ipsative agreement. Scale descriptions of
these can be found in the 2005 Saville Consulting Technical Document.
Saville Consulting’s extensive research indicates the best predictor of performance at work is generally the score indicated by the sten marker (combined Normative-ipsative). Information is also provided on subtle differences highlighted by the profiler: facet range, motive-talent split and normative-ipsative split. (Saville, 2006)
Results from the WAVE test-retest were based on a sample size of 112 with a
retest period of one month. The alternative form normative, ipsative and combined were
based on a sample size of 1153 Results indicate a mean reliability of 0.79, the
minimum 0.71 and maximum of 0.91 as shown in Table 3-2. (Saville, 2006).
The validity of the WAVE instrument and dimensions, as mentioned earlier, is
based on validation centric development, where items are selected for inclusion in the
instrument based on their validity in predicting external job performance criteria (Saville,
2006). The WAVE instrument has also been correlated against the 16PF, the Myers
Briggs Type Indicator, the Gordon Personal Profile,and the DISC. Results of construct
validation studies suggest the WAVE is valid and measures what it is intending to
measure (Saville, 2006). Additionally, previous studies utilizing the WAVE and its base

59
prediction inventory, the OPQ have been conducted to confirm that the instrument is
“valid, reliable, and does measure what it intends to measure” (Basham, 2007).
The Population
The population for this study consisted of members of AACRAO in admissions
officer, registrar and enrollment manager positions at institutions of higher education in
the United States. The population of seventy individuals represents fifty-four institutions
from twenty-nine states. Thirty-seven (54%) of the population is made up of individuals
from doctoral degree granting institutions. Thirty (42%) of the population are males.
The institution size will be segmented into two distinct categories; small/moderate
and medium/large. Small colleges are those institutions who enroll less than five
thousand students. Moderate colleges are those institutions who enroll between five
thousand and ten thousand students. Medium colleges are those institutions who enroll
between ten thousand and twenty thousand students. Lastly, large colleges are those
institutions who enroll more than twenty thousand students. There are sixteen
individuals from small institutions, fifteen from moderate institutions, eleven from
medium institutions and twenty-six from large institutions. Combined into the two
segments, there are thirty-one small/moderate institutions and thirty-seven
medium/large institutions.
The position types will be segmented into two distinct categories; registrar and
other enrollment management/admissions professionals. The population consists of
thirty-two registrars and thirty-five other enrollment management/admissions
professionals. Two individuals are not associated with a specific institution and one
individual cannot be classified into one of the three defined positions, however, all have
a direct relationship with enrollment management functions.

60
Procedure for Data Collection
In December 2006, AACRAO held its annual State and Regional Leadership
workshop. This workshop is comprised of registrars, admissions officers or enrollment
managers from institutions throughout the United States. These individuals were
selected to attend the workshop as a part of their leadership in their state or regional
associations. Attendees were invited to participate in the online questionnaire between
October and December 2006. The participants were assured of anonymity in the
reporting and were treated in accordance with the ethical standards of the American
Psychological Association. Saville Consulting, Ltd., agreed to release a small subset of
the collected data for the dissertation research in return for first right of viewing after
defense.
Analysis of Data
Parametric statistical tests rely on two key and fundamental assumptions. First,
these tests are based on the assumption that the frequency of the data are normally
distributed for both the sample population and for the total population from which the
sample is taken. Secondly, they rely on the assumption of equal variance between the
test populations. When these parameters cannot be assumed, non-parametric
statistical tests should be performed to make statistically reliable inferences based on
the test datasets. Non-parametric tests are also well suited for analyses that are based
on relative small sample and cell sizes.
The researcher used both the Kolmogorov-Smirnova and the Shapiro-Wilk tests to
examine the normality of the construct data for the total and test populations. These
same tests were used to determine the degree of normality for these data in the sample
populations as well.

61
The first hypothesis was analyzed by grouping those respondents in the sample
who are identified as registrars from those in the sample identified as an other
enrollment management/admissions professional and comparing them to one another
with respect to the specific constructs of thought, influence, adaptability and delivery in
the WAVE instrument. A two-way mixed measure analysis of variance (ANOVA) was
used between the means for the group of registrars and those from the group of
enrollment management/admissions professionals using data from the executive
summary, psychometric profile and expert reports.
The second hypothesis was analyzed by grouping those respondents in the
sample who are identified as leaders from doctoral degree granting institutions from
those in the sample identified as leaders from non-doctoral degree granting institutions
and comparing them to one another with respect to the specific constructs of thought,
influence, adaptability and delivery, respectively, in the WAVE instrument. A two-way
mixed measure analysis of variance (ANOVA) was used between the means for the
group from doctoral degree granting institutions and those from non-doctoral degree
granting institutions using data from the executive summary, psychometric profile and
expert reports.
The third hypothesis was analyzed by grouping those respondents in the sample
who are identified as leaders from a large/medium sized institution from those in the
sample identified as leaders from a small/moderate sized institution and comparing
them to one another with respect to the specific constructs of thought, influence,
adaptability and delivery, respectively, in the WAVE instrument. A two-way mixed
measure analysis of variance (ANOVA) was used between the means for the group

62
from the large/medium sized institutions and those from the small/moderate sized
institutions using data from the executive summary, psychometric profile and expert
reports.
Lastly, the fourth hypothesis was analyzed by grouping those respondents in the
sample who are identified as females from those in the sample identified as males and
comparing them to one another with respect to the specific constructs of thought,
influence, adaptability and delivery, respectively, in the WAVE instrument. A two-way
mixed measure analysis of variance (ANOVA) will be used between the means for the
group of females and those from the group of males using data from the executive
summary, psychometric profile and expert reports.
Research Instrument
The Saville Consulting Wave Professional Styles questionnaires use a validation
centric development approach to maximize the validity of the instrument. This validation
method determines the validity of the item among other criteria. “The average validity of
one Professional Styles scale in relationship to its work performance criterion is 0.39
and the composite validity of more than one Professional Styles scale across criteria is
0.46” (Saville Consulting Wave, 2006).
Figure 3-1 shows the structure of the WAVE with four clusters, twelve sections and
thirty-six dimensions. This study focused on the four clusters in all comparative data
analysis. As displayed in Table 3-1 and as provided by the Saville Consulting Wave
research, there are 36 dimensions of the Wave instrument. As displayed in Table 3-2,
these dimensions have a combined score (ipsative and normative) of 0.86 in reliability
with a minimum of 0.78 and a maximum of 0.93 (Saville Consulting Wave, 2006).

63
Summary
This chapter has provided an explanation of the research methodology used in the
research study, including, the study population, the WAVE questionnaire characteristics,
the data collection and the methods of analyzing the data. The next chapter will present
the results of the research questions in examining the leadership attributes of
registrar/enrollment managers throughout the United States.

64
Table 3-1. Single dimension & comp validities Saville Consulting WAVE© Assessment, 2009
Criterion Single Dimension* Validity IA
Single Dimension* Validity SA
Cross Validated** Composite Validity IA
Cross Validated** Composite Validity SA
Generating Ideas .42 .44 .44 .41 Exploring Possibilities .21 .36 .44 .47 Developing Strategies .54 .56 .68 .68 Providing Insights NS .20 .42 .38 Implementing Practical Solutions
NS NS .09 .29
Developing Expertise .19 .19 .35 .38 Analyzing Situations .26 .34 .30 .36 Documenting Facts .29 .27 .29 .27 Interpreting Data .46 .42 .44 .62 Making Decisions .48 .50 .64 .64 Leading People .68 .66 .70 .70 Providing Inspirations .62 .64 .64 .64 Convincing People .26 .26 .56 .60 Challenging Ideas .47 .49 .45 .47 Articulating Information .66 .60 .68 .68 Impressing People .32 .30 .56 .45 Developing Relationships .42 .50 .64 .66 Establishing Rapport .63 .57 .71 .67 Team Working .32 .32 .46 .40 Understanding People .35 .31 .47 .40 Valuing Individuals .34 .28 .46 .44 Resolving Conflict .38 .38 .48 .40 Conveying Self-Confidence .40 .34 .66 .78 Coping with Pressure .36 .34 .32 .30 Inviting Feedback .26 .22 .40 .32 Thinking Positively .40 .38 .42 .48 Embracing Change .42 .48 .42 .34 Organizing Resources .32 .38 .22 .42 Upholding Standards .21 .21 .20 .16 Completing Tasks .26 .31 .34 .41 Taking Action .54 .56 .56 .54 Pursuing Goals .28 .42 .44 .46 Tackling Business Challenges .42 .38 .48 .45 Checking Details .39 .31 .24 .23 Meeting Timescales .45 .43 .41 .43 Following Procedures .26 .24 .44 .14 Key: SA = Supervised Access Form, IA = Invited Access Form, *Dimension validity is the correlation between a single Professional Styles scale dimension (weighted combination of ipsative and normative scores) with the matched work performance criterion. Total sample matched is N=556-658 (sample size varied due to no evidence option on criterion ratings). **Cross validated is the correlation of the composite regression equation from initial sample on hold out sample based on a hold out sample of N=252-316. All validities are corrected for attenuation based on reliability of the criteria (based on 236 pairs of criterion ratings). No further corrections were applied (e.g. restriction of range, predictor unreliability). The composite validity of each of the two Professional Styles forms in relation to overall job proficiency is 0.34 and 0.42 (N=325). The composite validity of each of the two Professional Styles forms in establishing external ratings of potential for promotion is 0.54 and 0.64 (N=324).

65
Table 3-2. Reliability summary Saville Consulting WAVE© Assessment, 2009 Professional Styles Dimension
Alternate Form Normative
Alternate Form Ipsative
Alternate Form Combined
Test-Retest Normative
Inventive 0.91 0.87 0.91 0.88 Abstract 0.85 0.77 0.83 0.76 Strategic 0.84 0.79 0.84 0.73 Insightful 0.82 0.72 0.79 0.76 Pragmatic 0.85 0.83 0.86 0.81 Learning Oriented 0.86 0.84 0.87 0.78 Analytical 0.85 0.79 0.84 0.73 Factual 0.79 0.79 0.81 0.77 Rational 0.91 0.88 0.92 0.82 Purposeful 0.87 0.80 0.87 0.71 Directing 0.89 0.84 0.89 0.83 Empowering 0.90 0.85 0.89 0.80 Convincing 0.85 0.78 0.84 0.74 Challenging 0.86 0.81 0.86 0.86 Articulate 0.91 0.86 0.91 0.86 Self-promoting 0.89 0.84 0.89 0.80 Interactive 0.90 0.85 0.90 0.89 Engaging 0.87 0.83 0.87 0.79 Involving 0.79 0.81 0.81 0.74 Attentive 0.83 0.85 0.86 0.71 Accepting 0.78 0.82 0.81 0.75 Resolving 0.88 0.84 0.88 0.80 Self-assured 0.86 0.78 0.85 0.76 Composed 0.90 0.84 0.89 0.72 Receptive 0.81 0.73 0.78 0.80 Positive 0.85 0.81 0.85 0.82 Change Oriented 0.85 0.82 0.86 0.76 Organized 0.86 0.86 0.88 0.77 Principled 0.81 0.77 0.81 0.80 Activity Oriented 0.90 0.86 0.89 0.78 Dynamic 0.87 0.81 0.87 0.78 Striving 0.86 0.79 0.85 0.80 Enterprising 0.93 0.89 0.93 0.91 Meticulous 0.87 0.87 0.89 0.80 Reliable 0.89 0.89 0.91 0.83 Compliant 0.89 0.90 0.91 0.83
Alternate Form Normative, Ipsative and Combined (all based on N = 1153) Normative Test Re-Test reliability on Invited Access Normative N = 112.

66
4 clusters
12 sections 36 dimensions 108 facets
4 Clusters Yields 12 sections: Thought (vision, judgment, evaluation) Influence (leadership, impact, communication) Adaptability (support, resilience, flexibility) Delivery (structure, drive, implementation)
SAVILLE CONSULTING WAVE© ASSESSMENT, 2009
Figure 3-1. Theoretical structure of Saville WAVE Assessment, 2009
Figure 3-2. Cluster section chart

67
Table 3-3. WAVE attribute links in other research
Attribute Business/ Corporate
Community College President
College Chief Business Officer (CCBO)
National Council for Continuing Education Trainers (NCCET)
Other higher education admin.
Student Affairs Officers
Registrar/ enrollment manager
Thought Vision (inventive, abstract, strategic)
Spillett (2006) Leslie (2009)
Campbell & Leverty (1997)
Berry (2008)
Berry (2008) Tunks (2007) O’Daniels (2009)
Judgment (insightful, practically
minded, learning oriented)
Kachik (2003) Berry (2008)
Kachik (2003) O’Daniels (2009)
Lovell & Kosten (2000)
Evaluation (analytical, factual, rational)
Kachik (2003 Campbell & Leverty (1997)
Berry (2008)
Kachik (2003) Tunks (2007) O’Daniels (2009)
Lovell & Kosten (2000)
Saville (2007)
Influence Leadership (purposeful, directing, empowering)
Spillett (2006) Leslie (2009)
Campbell & Leverty (1997)
Berry (2008)
Tunks (2007) O’Daniels (2009)
Impact (convincing, challenging, articulate)
Spillett (2006) Leslie (2009)
Campbell & Leverty (1997)
Tunks (2007) O’Daniels (2009)
Lovell & Kosten (2000)
Saville (2007)

68
Table 3-3. Continued Attribute
Business/ Corporate
Community College President
College Chief Business Officer (CCBO)
National Council for Continuing Education Trainers (NCCET)
Other higher education admin.
Student Affairs Officers
Registrar/ enrollment manager
Adaptability Support (involving, attentive, accepting)
Spillett (2006)
Campbell & Leverty (1997)
Tunks (2007)
Lovell & Kosten (2000)
Resilience (resolving, self assured, composed)
Campbell & Leverty (1997)
O’Daniels (2009)
Flexibility (receptive, positive, change oriented)
Leslie (2009) Campbell & Leverty (1997)
Tunks (2007) O’Daniels (2009)
Delivery Structure (organized, principled, activity oriented)
Spillett (2006) Leslie (2009)
Campbell & Leverty (1997)
Berry (2008)
Berry (2008) O’Daniels (2009)
Lovell & Kosten (2000)
Saville (2007)
Drive (dynamic, striving, enterprising)
Leslie (2009) Campbell & Leverty (1997)
Berry (2008) Tunks (2007) O’Daniels (2009)
Saville (2007)
Implementation (meticulous, reliable, compliant)
Spillett (2006)
Tunks (2007)
Lovell & Kosten (2000)

69
CHAPTER 4 RESULTS
The primary purpose of this study was to determine if enrollment managers from
differing institutions, holding different positions within enrollment management had
common leadership attributes. All results of this study including analysis of variance
and descriptive statistics will be described in this chapter. These findings answered the
four research questions posed in Chapter 1 and contained the statistical analysis
described in Chapter 3. This chapter presents the results of the research questions in
examining the leadership attributes of registrar/enrollment managers throughout the
United States. The results for each of the hypothesis will be shown in order. Chapter
five will present a discussion of the findings and recommendations on how to further
expand upon this research.
Aggregate Data-Descriptive Statistics
The aggregate group the mean, standard deviation, skewness, kurtosis and test of
normality (Kolmogorov-Smirnova and Shapiro-Wilk) are presented in Table 4-1 and
Table 4-2. The aggregate data appears to be distributed normally for all but the
construct of adaptability with no large deviations for skewness or kurtosis. The data also
suggests the respondents are overall slightly more positive in self-ratings in the
construct of thought (M=6.459, SD=1.251) than the constructs of influence, delivery and
adaptability.
The results of these tests for the total population are posted in Tables 4-1 and 4-2
suggest that the distribution is sufficiently normal for the constructs of influence and
delivery, but are not sufficiently normal for the constructs of thought and adaptability.
Furthermore, the tests for normality indicate that the constructs are not sufficiently

70
normal for all comparison groups as it relates to each construct (see Figures 4-2, 4-4, 4-
6, and 4-8, respectively).
Based on the results of the normality tests, the researcher decided to employ both
parametric and non-parametric statistical analysis. The parametric tests were used
because of their relative statistical power; while, non-parametric tests provided a
secondary level of analysis that allows the results to withstand the scrutiny of the
highest standards of statistical practice.
Table 4-1. Mean, standard deviation, Skewness and Kurtosis of the aggregate
population
Aggregate Data
Mean SD Rank Skewness Kurtosis Thought 6.45 1.25 1 -0.68 0.21 Influence 5.49 0.94 4 -0.06 0.08 Delivery 5.86 0.98 2 -0.30 -0.33 Adaptability 5.80 1.08 3 -1.07 1.10
Table 4-2. Kolmogorov-Smirnova and Shapiro-Wilk: aggregate population
Kolmogorov-Smirnova Shapiro-Wilk Statistic Df Sig. Statistic Df Sig. Thought .115 70 .023 .963 70 .038 Influence .069 70 .200 .988 70 .773 Delivery .082 70 .200 .984 70 .537 Adaptability .177 70 .000 .921 70 .000
Research Hypothesis One
This hypothesis centered on the general research question of whether or not
registrars at differing institutions throughout the United States share common leadership

71
attributes as other enrollment management professionals. The specific attributes
considered are the constructs of thought, influence, adaptability and delivery1
H0-1: Those leaders identified in registrar positions will not exhibit any significant difference on the constructs of thought, influence, adaptability or delivery than their enrollment management counterparts.
.
H1: Those leaders identified in registrar positions will exhibit significant difference on the constructs of thought, influence, adaptability or delivery than their enrollment management counterparts.
The dataset was divided into two samples, one containing those individuals who
indicated their position as a registrar (n = 32) and those who indicated a position other
than registrar (n = 38). A two-way analysis of variance (ANOVA) yielded a significant
effect for the registrar subcategory in the construct of influence, F(1, 68) = 4.539, p =
.037<.05 significance level, such that respondents indicating they were not registrars
was slightly higher in the construct of influence (M=5.71, SD=.868) than for registrars
(M=5.24, SD=.979). The construct of thought, F(1, 68) = 2.535, p = .116, adaptability,
F(1, 68) = .319, p= .574, and delivery, F(1,68) = 1.446, p= .233 were not significant
between the registrar and non-registrar respondents. Additionally, a non-parametric
test of the hypothesis for each construct was run and indicated the same significance
results with a significance factor of .027 for influence. The psychometric profile’s cluster
and section means are displayed graphically for both groups in Figure 4-1. The
registrar group descriptive data indicating the means and standard deviations for each
where 0=non-registar and 1=registrar can be found in Table 4-3. The registrar group
ANOVA data indicating the significance of the construct of influence can be found in
Table 4-4. The non-parametric data for the registrar group is displayed in Figure 4-2.
1 Thought(Vision, Judgment, Evaluation); Influence (Leadership, Impact, Communication); Adaptability (Support, Resilience, Flexibility); Delivery (Structure, Drive, Implementation)

72
Figure 4-1. Psychometric profile’s cluster and section means for both registrar and other enrollment manager line graph
Table 4-3. Mean scores and standard deviations for the registrar and non-registrar groups (0=non-registrar; 1=registrar)
N Mean Std.
Deviation Std. Error
95% Confidence Interval for
Mean
Minimum Maximum Lower Bound
Upper Bound
Thought .00 38 6.24 1.24 .20 5.83 6.65 3.33 8.88 1.00 32 6.71 1.22 .21 6.27 7.15 3.00 8.44 Total 70 6.45 1.25 .14 6.16 6.75 3.00 8.88
Influence .00 38 5.71 .86 .14 5.42 5.99 3.11 7.66 1.00 32 5.24 .97 .17 4.89 5.59 3.22 7.55 Total 70 5.49 .94 .11 5.27 5.72 3.11 7.66
Adaptability .00 38 5.73 1.15 .18 5.35 6.11 2.33 7.66 1.00 32 5.88 1.01 .17 5.51 6.24 3.44 7.22 Total 70 5.80 1.08 .12 5.54 6.06 2.33 7.66
Delivery .00 38 5.99 .92 .158 5.67 6.31 3.88 7.77 1.00 32 5.70 .98 .17 5.35 6.06 3.44 7.33 Total 70 5.86 .98 .11 5.62 6.09 3.44 7.77
4
4.5
5
5.5
6
6.5
7
Non
Registrar

73
Table 4-4. Summary ANOVA for the registrar and non-registrar groups for each of the
four constructs
Sum of Squares df Mean Square F Sig.
Thought Between Groups 3.880 1 3.880 2.535 .116
Within Groups 104.069 68 1.530 Total 107.949 69
Influence Between Groups 3.844 1 3.844 4.539 .037
Within Groups 57.582 68 .847 Total 61.426 69
Adaptability Between Groups .381 1 .381 .319 .574
Within Groups 81.197 68 1.194 Total 81.578 69
Delivery Between Groups 1.390 1 1.390 1.446 .233
Within Groups 65.386 68 .962 Total 66.776 69
Figure 4-2. Hypothesis test summary for registrar group

74
Research Hypothesis Two
This hypothesis centered on the general research question of whether or not
enrollment managers at doctoral granting institutions throughout the United States
share common leadership attributes as other enrollment management professionals at
non-doctoral granting institutions. The specific attributes considered are the constructs
of thought, influence, adaptability and delivery. 2
H0-2: Those leaders identified in any enrollment management position working at doctoral granting institution will not exhibit any significant difference on the constructs of thought, influence, adaptability and delivery than their enrollment management counterparts at non-doctoral granting institutions.
H2: Those leaders identified in any enrollment management position working at doctoral granting institution will exhibit significant difference on the constructs of thought, influence, adaptability and delivery than their enrollment management counterparts at non-doctoral granting institutions.
The dataset was divided into two samples, one containing those individuals whose
institution confers doctoral degrees (n = 43) and those whose institutions do not confer
doctoral degrees (n = 25). A two-way analysis of variance (ANOVA) yielded a
significant effect for the doctoral granting subcategory in the construct of thought, F(1,
66) = 7.477, p= .008<.05 significance, such that respondents indicating they were from
doctoral granting institutions was significantly higher in the construct of thought
(M=6.76, SD=1.11) than for those from non-doctoral granting institutions (M=5.93,
SD=1.37). The constructs of influence, F(1, 66) = 1.626, p= .207, adaptability, F(1, 66)
= .713, p=.401 and delivery, F(1,66) = .724, p=.398 did not show significance between
the doctoral granting institution respondents and non-doctoral granting respondents.
2 Thought(Vision, Judgment, Evaluation); Influence (Leadership, Impact, Communication); Adaptability (Support, Resilience, Flexibility); Delivery (Structure, Drive, Implementation)

75
Additionally, a non-parametric test of the hypothesis for each construct was run and
indicated the same significance results with a significance factor of p=.016 for thought.
The psychometric profile’s cluster and section means are displayed graphically for both
groups in Figure 4-3. The doctoral granting group descriptive data indicating the means
and standard deviations for each where 0=non-doctoral granting and 1=doctoral
granting can be found in Table 4-5, the doctoral granting group ANOVA data indicating
the significance of the construct of influence can be found in Table 4-6. The non-
parametric data for the doctoral group is displayed in Figure 4-4.
Figure 4-3. Psychometric profile’s cluster and section means for both doctoral granting and non-doctoral granting institutions line graph
3.5
4
4.5
5
5.5
6
6.5
7
7.5
Doc
Non

76
Table 4-5. Mean scores and standard deviations for the doctoral and non-doctoral granting institution groups (0=non-doctoral granting; 1=doctoral granting)
N Mean
Std. Deviati
on Std. Error
95% Confidence Interval for Mean
Minimum Maximum Lower Bound
Upper Bound
Thought .00 25 5.92 1.37 .27 5.36 6.49 3.00 7.88 1.00 43 6.76 1.10 .16 6.42 7.10 4.44 8.88 Total 68 6.45 1.26 .15 6.14 6.76 3.00 8.88
Influence .00 25 5.29 .90 .18 4.92 5.66 3.22 7.00 1.00 43 5.60 .97 .14 5.30 5.90 3.11 7.66 Total 68 5.49 .95 .11 5.25 5.72 3.11 7.66
Adaptability .00 25 5.64 1.04 .20 5.21 6.08 2.33 7.00 1.00 43 5.88 1.13 .17 5.53 6.23 3.00 7.66 Total 68 5.79 1.10 .13 5.53 6.06 2.33 7.66
Delivery .00 25 6.02 1.11 .22 5.56 6.48 3.44 7.77 1.00 43 5.81 .89 .13 5.54 6.09 3.88 7.66 Total 68 5.89 .98 .11 5.65 6.13 3.44 7.77
Table 4-6. Summary ANOVA for the doctoral granting and non-doctoral granting groups
for each of the four constructs
Sum of Squares df Mean Square F Sig.
Thought Between Groups 10.980 1 10.980 7.477 .008
Within Groups 96.925 66 1.469 Total 107.905 67
Influence Between Groups 1.464 1 1.464 1.626 .207
Within Groups 59.406 66 .900 Total 60.870 67
Adaptability Between Groups .872 1 .872 .713 .401
Within Groups 80.658 66 1.222 Total 81.529 67
Delivery Between Groups .698 1 .698 .724 .398
Within Groups 63.658 66 .965 Total 64.356 67

77
Figure 4-4. Hypothesis test summary for doctoral granting group
Research Hypothesis Three
This hypothesis centered on the general research question of whether or not
enrollment managers at large/medium sized (10,000 or more enrollments) institutions
throughout the United States share common leadership attributes as other enrollment
management professionals at small/moderate sized (less than 10,000 enrollments)

78
granting institutions. The specific attributes considered are the constructs of thought,
influence, adaptability and delivery.3
H0-3: Those leaders identified in any enrollment management position working at large/medium sized institution will not exhibit any significant difference on the constructs of thought, influence, adaptability and delivery than their enrollment management counterparts at small/moderate sized institution.
H3: Those leaders identified in any enrollment management position working at large/medium sized institution will exhibit significant difference on the constructs of thought, influence, adaptability and delivery than their enrollment management counterparts at small/moderate sized institution.
The dataset was divided into two samples, one containing those individuals whose
institutions have yearly enrollments of 10,000 or more (n = 37) and those whose
institutions have less than 10,000 yearly enrollments (n = 31). A two-way analysis of
variance (ANOVA) yielded no significant effect for respondents in the institutional size
subcategory in the constructs of thought, F(1,66) = 2.855, p =.096, influence, F(1, 66) =
.281, p=.598, adaptability, F(1, 66) = .985, p=.325, or delivery, F(1,66) = 1.200, p=.277
between the respondents from institutions with small/medium enrollments of less than
10,000 and those at moderate/large institutions with enrollments of 10,000 or greater.
Additionally, a non-parametric test of the hypothesis for each construct was run and
indicated the similar significance results. The psychometric profile’s cluster and section
means are displayed graphically for both groups in Figure 4-5. The institution size
group descriptive data indicating no significance in any construct can be found in Table
4-7. The institution size group ANOVA data can be found in Table 4-8. The non-
parametric data for the institution size is displayed in Figure 4-6.
3 Thought(Vision, Judgment, Evaluation); Influence (Leadership, Impact, Communication); Adaptability (Support, Resilience, Flexibility); Delivery (Structure, Drive, Implementation)

79
Figure 4-5. Psychometric profile’s cluster and section means for institutions with enrollment of 10,000 or more and institutions with enrollments of less than 10,000 line graph
Table 4-7. Mean scores and standard deviations by institutional size (0=less than 10,000 enrollments; 1=10,000 or more enrollments)
N Mean Std.
Deviation Std. Error
95% Confidence Interval for Mean
Minimum Maximum Lower Bound
Upper Bound
Thought .00 31 6.17 1.21 .21 5.73 6.62 3.33 8.00 10.00 37 6.69 1.28 .21 6.26 7.11 3.00 8.88 Total 68 6.45 1.26 .15 6.14 6.76 3.00 8.88
Influence .00 31 5.42 .93 .16 5.07 5.76 3.11 7.22 10.00 37 5.54 .97 .16 5.22 5.87 3.22 7.66
Total 68 5.49 .95 .11 5.25 5.72 3.11 7.66 Adaptability .00 31 5.65 1.29 .23 5.17 6.12 2.33 7.66
10.00 37 5.91 .90 .14 5.61 6.22 3.44 7.22 Total 68 5.79 1.10 .13 5.53 6.06 2.33 7.66
Delivery .00 31 6.03 1.15 .20 5.61 6.45 3.44 7.77 10.00 37 5.77 .80 .13 5.50 6.04 4.11 7.33 Total 68 5.89 .98 .11 5.65 6.13 3.44 7.77
4
4.5
5
5.5
6
6.5
7
Thou
ght
Visi
on
Judg
men
t
Eval
uatio
n
Influ
ence
Lead
ersh
ip
Impa
ct
Com
mun
icat
ion
Ada
ptab
ility
Supp
ort
Resi
lienc
e
Flex
ibili
ty
Del
iver
y
Stru
ctur
e
Dri
ve
Impl
emen
tatio
n
10+
LT10

80
Table 4-8. Summary ANOVA by institutional size for each of the four constructs
Sum of Squares df Mean Square F Sig.
Thought Between Groups 4.475 1 4.475 2.855 .096
Within Groups 103.430 66 1.567 Total 107.905 67
Influence Between Groups .258 1 .258 .281 .598
Within Groups 60.612 66 .918 Total 60.870 67
Adaptability Between Groups 1.199 1 1.199 .985 .325
Within Groups 80.331 66 1.217 Total 81.529 67
Delivery Between Groups 1.150 1 1.150 1.200 .277
Within Groups 63.207 66 .958 Total 64.356 67
Figure 4-6. Hypothesis test summary for institutional size group

81
Research Hypothesis Four
This hypothesis centered on the general research question of whether or not
female enrollment managers at institutions throughout the United States share common
leadership attributes as male enrollment management professionals. The specific
attributes considered are the constructs of thought, influence, adaptability and delivery.4
H0-4: Those female leaders identified in any enrollment management position will not exhibit any significant difference on the constructs of thought, influence, adaptability and delivery than their male enrollment management counterparts.
H4: Those female leaders identified in any enrollment management position will exhibit significant difference on the constructs of thought, influence, adaptability and delivery than their male enrollment management counterparts.
The dataset was divided into two samples, one containing the responses of the
female respondents (n = 40) and one containing the responses of the male respondents
(n = 30). A two-way analysis of variance (ANOVA) yielded no significant effect for
respondents in the gender subcategory in the constructs of thought, F(1,68) = 1.023,
p=.315, influence, F(1, 68) = .073, p=.788, adaptability, F(1, 68) = .812, p=.371, or
delivery, F(1,68) = 2.626, p=.110, between the male and female respondents. The
psychometric profile’s cluster and section means are displayed graphically for both
groups in Figure 4-7. Additionally, a non-parametric test of the hypothesis for each
construct was run and indicated the similar significance results. The gender group
descriptive data indicating no significance in any construct can be found in Table 4-9.
The gender group ANOVA data can be found in Table 4-10. The non-parametric data
for the gender group is displayed in Figure 4-8.
4 Thought(Vision, Judgment, Evaluation); Influence (Leadership, Impact, Communication); Adaptability (Support, Resilience, Flexibility); Delivery (Structure, Drive, Implementation)

82
Figure 4-7. Psychometric profile’s cluster and section means for both females and males line graph
Table 4-9. Mean scores and standard deviations by gender (0=male, 1=female)
N Mean Std.
Deviation Std. Error
95% Confidence Interval for Mean
Minimum Maximum Lower Bound
Upper Bound
Thought .00 30 6.63 1.30 .23 6.14 7.11 3.55 8.88 1.00 40 6.32 1.21 .19 5.94 6.71 3.00 8.44
Total 70 6.45 1.25 .14 6.16 6.75 3.00 8.88 Influence .00 30 5.46 .90 .16 5.12 5.80 3.22 7.66
1.00 40 5.52 .98 .15 5.21 5.83 3.11 7.55 Total 70 5.49 .94 .11 5.27 5.72 3.11 7.66
Adaptability .00 30 5.93 1.03 .18 5.54 6.32 3.44 7.66 1.00 40 5.69 1.12 .17 5.34 6.05 2.33 7.22
Total 70 5.80 1.08 .12 5.54 6.06 2.33 7.66 Delivery .00 30 5.64 1.13 .20 5.22 6.06 3.44 7.77
1.00 40 6.02 .83 .13 5.75 6.29 4.11 7.55 Total 70 5.86 .98 .11 5.62 6.09 3.44 7.77
4.5
5
5.5
6
6.5
7
7.5
Thou
ght
Visi
on
Judg
men
t
Eval
uatio
n
Influ
ence
Lead
ersh
ip
Impa
ct
Com
mun
icat
ion
Ada
ptab
ility
Supp
ort
Resi
lienc
e
Flex
ibili
ty
Del
iver
y
Stru
ctur
e
Dri
ve
Impl
emen
tatio
n
F
M

83
Table 4-10. Summary ANOVA by gender for each of the four constructs Sum of Squares df Mean Square F Sig.
Thought Between Groups 1.601 1 1.601 1.023 .315
Within Groups 106.348 68 1.564 Total 107.949 69
Influence Between Groups .066 1 .066 .073 .788
Within Groups 61.360 68 .902 Total 61.426 69
Adaptability Between Groups .963 1 .963 .812 .371
Within Groups 80.614 68 1.186 Total 81.578 69
Delivery Between Groups 2.483 1 2.483 2.626 .110
Within Groups 64.294 68 .945 Total 66.776 69
Figure 4-8. Hypothesis test summary for gender group

84
Summary
In this chapter the results of this study including analysis of variance and
descriptive statistics were presented. A summary of the hypotheses results can be
found in Table 4-11. The analyses needed to answer the research questions in Chapter
3 were also presented. Chapter 5 will discuss these results in detail and use them to
answer the proposed research questions.

85
Table 4-11. Hypotheses Summary Hypothesis Description Result H1 Those leaders identified in registrar positions
will exhibit significant difference on the constructs of thought, influence, adaptability or delivery than their enrollment management counterparts.
Differences in the construct of influence, F(1, 68) = 4.539, p = .037<.05 significance level Non-registrar enrollment mangers yielded higher scores
H2 Those leaders identified in any enrollment management position working at doctoral granting institution will exhibit significant difference on the constructs of thought, influence, adaptability and delivery than their enrollment management counterparts at non-doctoral granting institutions.
Differences in the construct of thought, F(1, 66) = 7.477, p= .008<.05 significance Enrollment managers at non-doctoral granting institutions yielder higher scores
H3 Those leaders identified in any enrollment management position working at large/medium sized institution will exhibit significant difference on the constructs of thought, influence, adaptability and delivery than their enrollment management counterparts at small/moderate sized institution.
Fail to reject the null hypothesis
H4 Those female leaders identified in any enrollment management position will exhibit significant difference on the constructs of thought, influence, adaptability and delivery than their male enrollment management counterparts.
Fail to reject the null hypothesis

86
CHAPTER 5 SUMMARY, RECOMMENDATIONS AND CONCLUSOIN
This chapter presents additional analyses and conclusions based on the
results from the previous chapter, while comparing the findings to literature. This
chapter also presents recommendations for further research and implications for
higher education.
The purpose of this study was to compare leadership attributes of
registrar/enrollment managers in the United States to determine if there were
common attributes based on the type of institution, the size of institution, their
position or their gender. Another purpose of this study was the further explore
the research of leadership attributes and to provide a base framework for future
studies of mid-level higher education administrators.
Specifically, this study provided some insight into the attributes most
desired in quality candidates and addressed the following questions:
1) Do registrars at differing institutions throughout the United States share common leadership attributes as other enrollment management professionals?
2) Is there a significant relationship between size of institution and the leadership attributes for individuals in enrollment management positions?
3) Is there a significant relationship between type of institution as defined by doctoral granting versus non-doctoral granting and leadership attributes for individuals in enrollment management positions?
4) Is there a significant relationship between the leadership attributes for males versus females for individuals in enrollment management positions?
The next four sections will focus on the findings from the previous chapter
and answer each of these questions. These sections will resolve the research
questions by comparing the leadership attributes of the population in respect to
87
the constructs of thought, influence, adaptability and delivery in respect to their
position, institutional size, type of institution and gender.
Summary of Results
Research Question 1
Do registrars at differing institutions throughout the United States share
common leadership attributes as other enrollment management professionals?
The results indicate that enrollment managers, whether they are registrars
or leaders from another area within enrollment management do not have differing
leadership attributes. The construct of influence was the only cluster, of the four
within the WAVE, that showed variability in the responses between those who
indicated their position as registrar and those who were in other enrollment
management roles. The influence cluster is further defined by the sections of
leadership, impact and communication. There are also nine dimensions, three
for each section, within the cluster of influence (Appendix A). When reviewing
the data to the section and dimension levels, the section of communication was
the only section of the three within the cluster of influence that showed
significant.
Additionally, all three of the dimensions within the section of communication
indicated significance. Comparing the means for the registrar and the non-
registrars within each of these dimensions shows that those that indicated they
were not registrars ranked themselves higher in all three of the dimensions within
the section of communication (self-promoting, interaction and engaging
dimensions).
88
The results of the analysis of the data indicate that registrars and other
enrollment managers do not differ in their leadership attributes. However, those
non-registrar enrollment managers consider themselves to be better
communicators than their registrar colleagues. This finding is consistent with the
findings of the previous research. The studies of non-profit leaders, community
college presidents, college chief business officers, student affairs officers and
other higher education administrators all propose that communication is a key
leadership attribute for the future leader (Table 3-3). The leadership attribute of
communication includes the skills of networking, establishing rapport and giving a
good first impression (Appendix G).
The CCL leadership study did not indicate communication, as defined in
this study, as one of the top ten attributes needed for the future leader, but it is
within the top twenty (Leslie, 2009). The finding is also consistent with the job
description profiling of the new registrar/enrollment manager attributes defined in
the job description developed in the FuturesLeaders-ATG Work Profiling session
with AACRAO in 2006. That session found that the new registrar must have
strong logic and communication skills (FuturesLeaders-ATG Work Profiling
session, 2006). Additionally, Kleinglass noted that the qualities of the senior
student affairs officers include strong communication (Kleinglass, 2005). This
further supports the concepts that student affairs administrators are typically
promoted from within and that the current non-registrar enrollment manager has
the skills necessary to move into the senior student affairs position and will

89
create the domino effect for leadership in their current role (Amey, 2002;
Hamilton, 2004; Campbell, 2006).
Research Question 2
Is there a significant relationship between type of institution, as defined by
doctoral granting versus non-doctoral granting, and leadership attributes for
individuals in enrollment management positions?
The results indicate that enrollment managers, whether they are from
doctoral granting institutions or non-doctoral granting institutions tend to not differ
in their leadership attributes. The construct of thought was the only cluster, of
the four within the WAVE, that showed variability in the responses between those
who indicated they worked at a doctoral degree granting institution and those
whose institutions do not confer doctoral degrees. As described earlier and
displayed in Appendix A, the cluster of thought has three sections (vision,
judgment and evaluation) and each of these sections has three dimensions.
Further examination of the results of the data indicate that respondents from
doctoral granting institutions rated themselves higher in the section of evaluation
and the dimensions of abstract (thought cluster/vision section), learning oriented
(thought cluster/judgment section) and change oriented (adaptability
cluster/flexibility section).
The results of the analysis of this data indicate that individuals from doctoral
granting institutions are problem solvers who enjoy thinking about and
developing concepts, are motivated by learning new things, are strong
communicators and enjoy new challenges. In comparing with other leaders
specific to doctoral granting institutions, this is consistent with Mironack’s 2003

90
study of college union directors. His study found that these leaders were
transformational leaders and exhibited behaviors of influence and motivation.
The previous research of non-profit leaders and corporate leaders support this
finding as a key leadership attribute for the new leader (Spillett, 2006; Kachik,
2003; Leslie, 2009). Each of these studies indicates attributes within the thought
cluster as critical for the future leader. Only the CCL study, however, also
identifies the attribute of flexibility as a key future leader attribute (Leslie, 2009).
Higher education and community college studies find importance in the
leadership attributes of the thought cluster, even though the majority of
respondents are from non-doctoral granting institutions (Campbell & Leverty,
1997; Kachik, 2003; Tunk, 2007; Berry, 2008, O’Daniels, 2009). This further
supports the idea that the leadership attribute is job specific within the
organization and that individuals fulfilling different responsibilities will have a
need for differing leadership attributes.
Respondents from non-doctoral granting institutions, in contrast, show
stronger significance in the section of implementation(meticulous, reliable,
compliant) and the dimensions of principled (delivery cluster/structure section)
and compliant (delivery cluster/implementation section). All of these attributes
are within the delivery cluster. This indicates that these individuals need
structure and are pleased with following set requirements. These results are
consistent with the WAVE scale in that they indicate that individuals scoring high
on compliant are very likely to score low on change oriented (Saville, 2005). All
previous studies displayed in Table 3-3 indicate structure as a key leadership

91
attribute for the future leader. Compliant, however, is only supported by the
research on the leadership attributes of non-profit leaders, student affairs officers
and other higher education administrators (Lovell & Kosten, 2000; Spillett, 2006;
Tunks, 2007). This further supports the concept that leadership attributes are
position driven. Non-profit leaders and student affairs officers likely must comply
to state policies, government regulations or funding provider limitations and a
strong leader will understand the need for compliance. Overall, those
respondents from the doctoral granting institutions are more change oriented
while those from the non-doctoral granting institutions are more compliant.
Research Question 3
Is there a significant relationship between size of institution and the
leadership attributes for individuals in enrollment management positions?
The results indicate that enrollment managers, regardless of the size of
institution in which they work do not differ in their leadership attributes. For each
of the four clusters examined, there are three sections and three dimensions.
When reviewing the data to the section and dimension levels none of the twelve
sections showed significance. In the cluster of thought the three sections are
vision, judgment and evaluation. In the section of evaluation there are three
dimensions (analytical, factual and rational). Comparing the means for the
small/medium institutions to the moderate/large institutions shows that those
enrollment managers working at moderate/large institutions ranked themselves
higher in the dimension of analytical.
The results of the analysis of the data indicate that enrollment managers
from different size institutions do not differ in their leadership attributes.

92
Enrollment managers at moderate/large institutions consider themselves to be
more analytical than those respondents from small/medium sized institutions.
Analytical, for the purposes of this study, indicates an individual is a good
problem solver, probing and effective at analyzing information. Previous studies
of corporate leaders, college chief business officers, student affairs officers and
other higher education administrators indicate that analytical is a key leadership
attribute for the future leader (Lovell & Kosten, 2000; Kachik, 2003; Berry, 2008;
O’Daniel, 2009). The non-profit leader of the future and the international leaders
in the CCL study both indicate that analytical is not a key attribute for future
leaders in their industry (Spillett, 2006; Leslie, 2009). These differing concepts
regarding the attribute of analytical support the concept that leadership attributes
are position specific and that organizations’ need to define the attributes for each
position in order to effectively identify the best candidate.
Research Question 4
Is there a significant relationship between the leadership attributes for
males versus females for individuals in enrollment management positions?
The results indicate that enrollment managers, whether they are male or
female do not differ in their leadership attributes. There were no significant
differences between the leadership attributes of males or females in any of the
four constructs. When reviewing the data to the section and dimension levels,
the section of structure was the only one that showed significant with a p=.007.
The dimension of activity oriented (delivery cluster/drive section) also showed
significant with a p=.009 indicating that females tend to rank themselves higher in
this category. Structure, for the purposes of this study, the leader exhibiting this

93
attribute is organized, principled and activity oriented. The results of the analysis
of the data indicate that female respondents tend to find importance in planning,
work at a fast pace, cope well with multi-tasking and like to follow set procedures
at higher levels than their male counterparts. These factors are comparable to
Kachik’s 2003 study in the aspect of detail conscious. That study found that
female administrators are more detail conscious and precise than male
administrators. A direct conclusion that females are more detail conscious
cannot be drawn, however, without further examination of the differences in the
populations. The Kachik study compared community college administrators with
corporate leaders.
Further examination of the data revealed that the dimension of rational
(thought cluster/evaluation section) showed significant with a p=.021. This
finding indicates that the male respondents tend to rank themselves higher in this
category. For the purposes of this study, rational refers to number fluency,
technology aware and objective. The data also shows that the male respondents
tend to see problems solving as one of their strengths, are comfortable working
with numerical data and are highly competitive at higher levels than their female
counterparts. This is particularly important for the future role of the registrar.
The leadership attributes defined by AACRAO at the FuturesLeaders-ATG Work
Profiling session in 2006 listed numeric reasoning and complex decision making
as two of the desired attributes for future registrar/enrollment managers
(FuturesLeaders-ATG Work Profiling, 2006). Overall, this data shows that

94
enrollment managers tend to not have differing leadership attributes regardless
of their gender.
Recommendations for Further Study
As the literature reviewed demonstrated, leadership styles can be defined
(Bennis, 1989; Lovell & Kosten, 2000; Kachik, 2003; O’Daniels, 2009), learned
(Tunks, 2007), and the WAVE instrument is a valid instrument in building job
profiles and informing the development of a structured candidate selection
process (Basham, 2007; Berry, 2008). There is little research, however, on the
specific leadership attributes of enrollment managers and, even less with specific
focus on registrars. This study built upon to the leadership research from other
positions and has added some focus to the area of enrollment management.
The American Association of Collegiate Registrar and Admissions Officers
(AACRAO) worked with the FuturesLeaders-ATG Group in 2006 to develop a
new job description for registrars. The first important component of this job
description was to rename the position to dean/director of enrollment and
registrar. The key factors in making this distinction was that the position now
requires more strategic planning and decision making (Campbell, 2006). Given
this information and the fact that enrollment managers tend to not differ in their
leadership attributes, with a few exceptions, further examination of the data could
help to confirm the attributes described by AACRAO and better define the
specific attributes that make an effective registrar. Further examination could
also assist in the creation of training programs specifically suited for enrollment
managers.

95
Another area where this study could be expanded is in the idea of
succession planning and its link to the economy. Economy has had an impact on
the speed in which predicted retirements have occurred (Jackson, 2010).
Studies have been reporting on the looming leadership gap since early 2000 and
yet the workforce is still aging and nearing retirement (Jackson, 2010). In higher
education, the turnover rate has progressed slower than originally projected as
well. The economy may be the factor that has slowed retirements. Amey’s study
(2002) indicated that student affairs officers tended to remain at the same
institution longer and tended to be promoted from within the same institution.
The review of labor statistics found that, despite the aging workforce, the
percentage of the workforce forty-five years of age or older has increased by 4%
between 2006 and 2010. Many attribute this to the economy and the need for
individuals to remain employed, but how is this change impacting succession
planning? Further research as to how the economy impacts succession planning
and the continued funding of leadership development programs should be
reviewed. As indicated by Rothwell in 2010, succession planning is also an
evolving process and must be reviewed (Rothwell, 2010).
Review of the labor statistics highlights the growing Hispanic population, as
well as the declining white population. These changes, combined with the
demographic changes noted earlier lead to the question of cultural awareness
requirements for the new registrar/enrollment manager. Further research on the
cultural awareness necessary for the new leader and how the generational

96
differences impact the definition of culture will provide a great framework for
identifying new leadership attributes.
Doctoral granting institutions versus non-doctoral granting institutions were
a part of this study and the leadership attributes of leaders within each of these
types of institutions should be further examined. Further research is needed to
determine if the organizational structure of enrollment management differs
between doctoral granting and non-doctoral granting institutions and if this
impacts the differences noted in the leadership attributes. Further research could
also examine if the culture at these differing types of institutions contributes to
the differences in leadership attributes.
Research also indicated that the chief academic officers are the highest
percentage of positions that progress towards the presidency and the attrition of
these leaders is low at an average of only 4.7 years on the job (Mann, 2010). If
knowledge transfer is the key to the next phases of succession planning, then an
administrator willing to remain with an organization may be more appealing
(Rothwell, 2010). As indicated earlier, Amey’s study (2002) indicated that
student affairs officers tended to remain at the same institution longer and tended
to be promoted from within the same institution. Further examination of the
subset of senior student affairs officers who later become presidents and of what
type of institution they were promoted from (doctoral versus non-doctoral) and
what their institutions organizational structure was (enrollment management
within academic affairs or student affairs) could help to colleges prepare stronger
career paths for enrollment management professionals. Furthermore, the

97
comparison and regression analysis of enrollment manager leadership data with
other leadership groups within higher education could be segmented by
institution type, size, location and other factors that may draw more conclusive
links between where the enrollment managers of today need to grow in their
leadership skills in order to remain competitive for the role of president.
Implications for Higher Education Administrators
The data collected will help to establish baseline information on leadership
attributes of individuals working in admission, registrar and enrollment
management positions. The data can be subcategorized by type of institution,
size of institution and position level and compared to other position groups so
that position-related trainings specific to small community colleges, large
universities, mid-level admissions staff and other targeted groups could be
developed.
Higher education administrators will need to understand the vital role
enrollment managers will continue to play in the daily operations of each
institution and will need to help prepare for the vacancies that are looming. The
new enrollment manager is technically adept and understands the technological
abilities of the incoming freshmen. In addition to strong leadership and
communication skills, the new registrar/enrollment managers should be
connected to all aspects of college administration with an understanding of
operations, finance, student relations, technology and academics.
Conclusion
Corporate and higher education leaders must be prepared to adapt to the
changing workforce and the address the leadership skills gaps that exist.

98
Identifying the leadership attributes necessary for each position within an
organization will be important as organizations struggle to meet the demand of a
dwindling trained leadership base. One purpose of this report was to identify the
leadership attributes for enrollment managers in higher education institutions and
to help build a basis for future research on the development of a leadership
training program.
This study built upon previous research to draw stronger conclusions
regarding the leadership attributes of enrollment managers. The study found that
enrollment management leaders who do not hold the position of registrar
exhibited stronger communication skills and ability to impact decision making
than their registrar colleagues, while enrollment management leaders from
doctoral granting institutions exhibited more vision than their counterparts from
non-doctoral granting institutions. These factors are small in comparison to the
full array of leadership attributes reviewed. Registrar/enrollment managers,
overall, do not differ in their leadership attributes. The findings support the
leadership attributes identified by AACRAO as necessary job qualities for the
future enrollment manager/registrar. Further research should be conducted to
determine the need for leadership development within the area of enrollment
management. Senior student affairs officer positions are typically filled from
within the institution and the current non-registrar enrollment manager, having
the skills necessary to move into the senior student affairs position, may likely be
promoted to this position and will create the domino effect for leadership in their
current role (Amey, 2002; Hamilton, 2004; Campbell, 2006).

99
Results from this research study provide a base framework for future
studies on leadership attributes of mid-level higher education administrators and
can be used to support leadership selection and development initiatives for future
enrollment managers as the domino effect from turnover begins to unravel.
Discovering what leadership attributes are needed to be successful will assist in
determining the best candidate. .

100
APPENDIX A CLUSTER DESCRIPTIONS
Recall from Figure 3-1 the WAVE is composed of four clusters: thought, influence,
adaptability, and delivery. Each of these clusters is divided into three sections, three
dimensions per section, and three facets per dimension yielding a total of 12 sections,
36 dimensions and 108 facets.
Thought Cluster
The thought cluster (see Figure A-1) is composed of vision, judgment, and
evaluation sections and inventive, abstract, strategic, insightful, practically minded,
learning oriented, analytical, factual, and rational dimensions.
Cluster Section Dimension Facets
Inventive Creative, original, radical Vision Abstract Conceptual, theoretical, learning by thinking Strategic Developing strategy, visionary, forward thinking Insightful Discerning, seeking improvement, intuitive Thought Judgment Practically Minded Practical, learning by doing common sense focused Learning Oriented Open to learning, learning by reading, quick learning Analytical Problem solving, analyzing information, probing Evaluation Factual Written communication,
logical, fact finding Rational Number fluency, technology aware, objective Figure A-1. The thought cluster, sections, and dimensions

101
Influence Cluster
The influence cluster (see Figure A-2) is composed of leadership, impact, and
communication sections and purposeful, directing, empowering, convincing,
challenging, articulate, self promoting, interactive, and engaging dimensions.
Cluster Section Dimension Facets Purposeful Decisive, making decisions definite Leadership Directing Leadership oriented, control seeking, coordinating people Empowering Motivating others, inspiring, encouraging Convincing Persuasive, negotiative, asserting views Influence Impact Challenging Challenging ideas, prepared to disagree, argumentative Articulate Giving presentations,
eloquent, socially confident Self promoting Immodest, attention seeking, praise seeking Communication Interactive Networking, talkative, lively
Engaging Establishing rapport, friendship seeking, initial impression
Figure A-2. The influence cluster, sections, and dimensions

102
Adaptability Cluster
The adaptability cluster (see Figure A-3) is composed of support, resilience, and
flexibility sections and involving, attentive, accepting, resolving, self assured, composed,
receptive, positive, and change oriented dimensions.
Cluster Section Dimension Facets Involving Team oriented, democratic, decision sharing Support Attentive Empathic, listening, psychologically minded Accepting Trusting, tolerant,considerate Resolving Conflict resolution, handling angry and upset people Adaptability Resilience Self assured Self-confident, self-valuing, self-directing Composed Calm, poised, copes with
pressure Receptive Receptive to feedback, open to criticism, feedback seeking Flexibility Positive Optimistic, cheerful, buoyant Change oriented Accepting challenges, accepting change, tolerant
of uncertainty
Figure A-3. The adaptability cluster, sections, and dimensions

103
Delivery Cluster
The delivery cluster (see Figure A-4) is composed of structure, drive and
implementation sections and organized, principled, activity oriented, dynamic, striving,
enterprising, meticulous, reliable, and compliant dimensions.
Cluster Section Dimension Facets Organized Self organized, planning, prioritizing Structure Principled Proper, discreet, honoring commitments Activity oriented Quick working, busy, multi-tasking Dynamic Energetic, initiating, action oriented Delivery Drive Striving Ambitious, results driven, perservering Enterprising Competitive, enterpreurial, selling Meticulous Quality oriented, thorough, detailed Implementation Reliable Meeting deadlines, finishing Tasks, punctual Compliant Rule bound, following
Procedures, risk averse
Figure A-4. The delivery cluster, sections, and dimensions

104
APPENDIX B DATA FOR THE REGISTRAR SUBCATEGORY
1-Registrar; 0-Non-Registrar
N Mean Std. Deviation Std. Error
95% Confidence Interval for Mean
Minimum Maximum Lower Bound Upper Bound
Thought .00 38 6.242690079 1.2474479016 .2023627714 5.832664157 6.652716001 3.3333333 8.8888890
1.00 32 6.715277769 1.2246432636 .2164883891 6.273746788 7.156808749 3.0000000 8.4444450
Total 70 6.458730166 1.2507891790 .1494979011 6.160490013 6.756970318 3.0000000 8.8888890
Vision .00 38 6.008771926 1.8510395320 .3002782635 5.400350372 6.617193481 1.6666666 9.3333330
1.00 32 6.812500006 1.3005030935 .2298986391 6.343618640 7.281381372 3.6666667 8.6666670
Total 70 6.376190477 1.6612679990 .1985595040 5.980075105 6.772305849 1.6666666 9.3333330
Inventive .00 38 5.658 2.2212 .3603 4.928 6.388 2.0 10.0
1.00 32 6.250 1.5658 .2768 5.685 6.815 4.0 9.0
Total 70 5.929 1.9584 .2341 5.462 6.396 2.0 10.0
Abstract .00 38 5.763 2.2110 .3587 5.036 6.490 1.0 10.0
1.00 32 7.125 1.8622 .3292 6.454 7.796 3.0 10.0
Total 70 6.386 2.1555 .2576 5.872 6.900 1.0 10.0
Strategic .00 38 6.605 2.1877 .3549 5.886 7.324 1.0 10.0
1.00 32 7.063 1.8826 .3328 6.384 7.741 3.0 10.0
Total 70 6.814 2.0522 .2453 6.325 7.304 1.0 10.0
Judgment .00 38 6.377192974 1.1654976005 .1890686771 5.994103445 6.760282502 3.3333333 8.0000000
1.00 32 6.583333309 1.3333333014 .2357022548 6.102615391 7.064051227 3.6666667 9.0000000
Total 70 6.471428556 1.2400883527 .1482189077 6.175739925 6.767117186 3.3333333 9.0000000
Insightful .00 38 6.421 1.8691 .3032 5.807 7.035 3.0 10.0
1.00 32 6.813 1.7309 .3060 6.188 7.437 3.0 10.0
Total 70 6.600 1.8050 .2157 6.170 7.030 3.0 10.0

105
Practically minded .00 38 6.211 1.7730 .2876 5.628 6.793 2.0 10.0
1.00 32 6.063 1.9166 .3388 5.371 6.754 3.0 10.0
Total 70 6.143 1.8280 .2185 5.707 6.579 2.0 10.0
Learning oriented .00 38 6.500 1.8270 .2964 5.899 7.101 3.0 10.0
1.00 32 6.875 2.1365 .3777 6.105 7.645 1.0 10.0
Total 70 6.671 1.9688 .2353 6.202 7.141 1.0 10.0
Evaluation .00 38 6.342105211 1.5663250861 .2540914814 5.827266966 6.856943455 3.0000000 9.3333330
1.00 32 6.749999994 1.6805870801 .2970886302 6.144083738 7.355916250 1.6666666 9.6666670
Total 70 6.528571397 1.6206128531 .1937002847 6.142149902 6.914992892 1.6666666 9.6666670
Analytical .00 38 6.421 1.8691 .3032 5.807 7.035 2.0 10.0
1.00 32 6.969 1.9258 .3404 6.274 7.663 1.0 10.0
Total 70 6.671 1.9013 .2273 6.218 7.125 1.0 10.0
Factual .00 38 6.737 1.7962 .2914 6.146 7.327 3.0 10.0
1.00 32 6.813 2.0389 .3604 6.077 7.548 2.0 10.0
Total 70 6.771 1.8971 .2268 6.319 7.224 2.0 10.0
Rational .00 38 5.868 1.9888 .3226 5.215 6.522 2.0 9.0
1.00 32 6.469 1.9341 .3419 5.771 7.166 2.0 10.0
Total 70 6.143 1.9729 .2358 5.672 6.613 2.0 10.0
Influence .00 38 5.713450289 .8678560633 .1407848439 5.428193100 5.998707479 3.1111112 7.6666665
1.00 32 5.243055537 .9790466561 .1730726324 4.890071577 5.596039498 3.2222223 7.5555553
Total 70 5.498412689 .9435190348 .1127720944 5.273438516 5.723386861 3.1111112 7.6666665
Leadership .00 38 6.052631532 1.4633178403 .2373814996 5.571650926 6.533612137 3.0000000 9.3333330
1.00 32 6.145833334 1.2866490774 .2274495719 5.681946874 6.609719795 3.3333333 8.3333330
Total 70 6.095238070 1.3762920480 .1644983631 5.767072815 6.423403325 3.0000000 9.3333330
Purposeful .00 38 5.711 2.1423 .3475 5.006 6.415 1.0 9.0
1.00 32 5.750 2.0791 .3675 5.000 6.500 1.0 10.0
Total 70 5.729 2.0985 .2508 5.228 6.229 1.0 10.0

106
Directing .00 38 6.263 1.9821 .3215 5.612 6.915 1.0 9.0
1.00 32 6.500 1.2700 .2245 6.042 6.958 4.0 9.0
Total 70 6.371 1.6869 .2016 5.969 6.774 1.0 9.0
Empowering .00 38 6.184 1.9708 .3197 5.536 6.832 3.0 10.0
1.00 32 6.188 1.6152 .2855 5.605 6.770 2.0 9.0
Total 70 6.186 1.8041 .2156 5.756 6.616 2.0 10.0
Impact .00 38 5.552631571 1.0347601457 .1678602614 5.212514375 5.892748767 2.6666667 7.6666665
1.00 32 5.125000003 1.2999862185 .2298072676 4.656304991 5.593695016 2.6666667 8.0000000
Total 70 5.357142854 1.1745029011 .1403799469 5.077092523 5.637193186 2.6666667 8.0000000
Convincing .00 38 4.921 1.6665 .2703 4.373 5.469 2.0 8.0
1.00 32 4.469 1.7036 .3012 3.855 5.083 1.0 8.0
Total 70 4.714 1.6866 .2016 4.312 5.116 1.0 8.0
Challenging .00 38 5.105 1.8276 .2965 4.505 5.706 2.0 9.0
1.00 32 4.375 1.7735 .3135 3.736 5.014 2.0 9.0
Total 70 4.771 1.8271 .2184 4.336 5.207 2.0 9.0
Articulate .00 38 6.632 1.8515 .3004 6.023 7.240 2.0 10.0
1.00 32 6.531 1.7410 .3078 5.904 7.159 1.0 10.0
Total 70 6.586 1.7896 .2139 6.159 7.012 1.0 10.0
Communication .00 38 5.535087695 1.2143770085 .1969979641 5.135931905 5.934243485 3.0000000 8.3333330
1.00 32 4.458333325 1.3326611445 .2355834331 3.977857745 4.938808905 1.0000000 7.3333335
Total 70 5.042857126 1.3713439801 .1639069558 4.715871696 5.369842556 1.0000000 8.3333330
Self promoting .00 38 5.026 1.9100 .3098 4.399 5.654 2.0 10.0
1.00 32 4.156 1.6086 .2844 3.576 4.736 1.0 8.0
Total 70 4.629 1.8192 .2174 4.195 5.062 1.0 10.0
Interactive .00 38 6.237 1.6347 .2652 5.700 6.774 2.0 9.0
1.00 32 4.813 1.6932 .2993 4.202 5.423 1.0 9.0
Total 70 5.586 1.7977 .2149 5.157 6.014 1.0 9.0

107
Engaging .00 38 5.342 1.5117 .2452 4.845 5.839 2.0 9.0
1.00 32 4.406 1.9321 .3415 3.710 5.103 1.0 8.0
Total 70 4.914 1.7672 .2112 4.493 5.336 1.0 9.0
Adaptability .00 38 5.733918126 1.1525427167 .1869671174 5.355086762 6.112749490 2.3333333 7.6666665
1.00 32 5.881944419 1.0167601380 .1797394971 5.515363298 6.248525540 3.4444444 7.2222223
Total 70 5.801587289 1.0873288632 .1299606565 5.542322873 6.060851704 2.3333333 7.6666665
Support .00 38 5.754385953 1.7530482845 .2843819840 5.178173320 6.330598585 2.0000000 9.0000000
1.00 32 6.041666625 1.5969280036 .2822996551 5.465912682 6.617420568 2.6666667 8.3333330
Total 70 5.885714260 1.6776312423 .2005152857 5.485697210 6.285731310 2.0000000 9.0000000
Involving .00 38 5.895 2.3572 .3824 5.120 6.670 1.0 10.0
1.00 32 6.156 2.2734 .4019 5.337 6.976 2.0 10.0
Total 70 6.014 2.3062 .2756 5.464 6.564 1.0 10.0
Attentive .00 38 5.237 2.1864 .3547 4.518 5.955 1.0 10.0
1.00 32 5.375 2.0280 .3585 4.644 6.106 1.0 9.0
Total 70 5.300 2.1014 .2512 4.799 5.801 1.0 10.0
Accepting .00 38 6.132 1.8035 .2926 5.539 6.724 3.0 9.0
1.00 32 6.594 1.5629 .2763 6.030 7.157 3.0 9.0
Total 70 6.343 1.7015 .2034 5.937 6.749 3.0 9.0
Resilience .00 38 5.754385947 1.1719550744 .1901162177 5.369173900 6.139597995 2.3333333 7.6666665
1.00 32 5.812500025 .9310937094 .1645956690 5.476804945 6.148195105 3.3333333 7.0000000
Total 70 5.780952383 1.0615300669 .1268771106 5.527839473 6.034065293 2.3333333 7.6666665
Resolving .00 38 5.447 1.8556 .3010 4.837 6.057 2.0 10.0
1.00 32 5.313 2.0547 .3632 4.572 6.053 1.0 10.0
Total 70 5.386 1.9359 .2314 4.924 5.847 1.0 10.0
Self-assured .00 38 5.947 1.8151 .2944 5.351 6.544 2.0 10.0
1.00 32 6.313 1.6740 .2959 5.709 6.916 3.0 9.0
Total 70 6.114 1.7491 .2091 5.697 6.531 2.0 10.0

108
Composed .00 38 5.868 1.6953 .2750 5.311 6.426 1.0 9.0
1.00 32 5.813 1.4906 .2635 5.275 6.350 3.0 8.0
Total 70 5.843 1.5938 .1905 5.463 6.223 1.0 9.0
Flexibility .00 38 5.692982463 1.3542981970 .2196961782 5.247835723 6.138129203 1.3333334 7.6666665
1.00 32 5.791666631 1.4731770887 .2604233773 5.260529651 6.322803611 2.6666667 8.3333330
Total 70 5.738095226 1.4003597830 .1673750076 5.404191222 6.071999230 1.3333334 8.3333330
Receptive .00 38 5.553 1.9270 .3126 4.919 6.186 1.0 10.0
1.00 32 5.219 2.0278 .3585 4.488 5.950 1.0 9.0
Total 70 5.400 1.9664 .2350 4.931 5.869 1.0 10.0
Positive .00 38 5.658 1.6810 .2727 5.105 6.210 2.0 8.0
1.00 32 5.656 1.8597 .3288 4.986 6.327 1.0 9.0
Total 70 5.657 1.7519 .2094 5.239 6.075 1.0 9.0
Change Oriented .00 38 5.868 1.9888 .3226 5.215 6.522 1.0 10.0
1.00 32 6.500 2.0791 .3675 5.750 7.250 1.0 10.0
Total 70 6.157 2.0404 .2439 5.671 6.644 1.0 10.0
Delivery .00 38 5.991228047 .9749554962 .1581586661 5.670768150 6.311687945 3.8888888 7.7777777
1.00 32 5.708333363 .9872746849 .1745271561 5.352382881 6.064283844 3.4444444 7.3333335
Total 70 5.861904763 .9837534567 .1175810276 5.627337031 6.096472495 3.4444444 7.7777777
Structure .00 38 6.236842111 1.2942652642 .2099575505 5.811427704 6.662256517 3.6666667 8.6666670
1.00 32 6.260416638 1.3486602278 .2384116981 5.774172773 6.746660502 2.6666667 8.0000000
Total 70 6.247619037 1.3097992228 .1565509504 5.935308437 6.559929638 2.6666667 8.6666670
Organized .00 38 6.105 1.8569 .3012 5.495 6.716 2.0 10.0
1.00 32 6.156 1.9026 .3363 5.470 6.842 1.0 9.0
Total 70 6.129 1.8644 .2228 5.684 6.573 1.0 10.0
Principled .00 38 6.342 1.6154 .2621 5.811 6.873 3.0 9.0
1.00 32 6.813 1.5332 .2710 6.260 7.365 3.0 9.0
Total 70 6.557 1.5847 .1894 6.179 6.935 3.0 9.0

109
Activity Oriented .00 38 6.263 1.7810 .2889 5.678 6.849 1.0 9.0
1.00 32 5.813 1.6932 .2993 5.202 6.423 1.0 8.0
Total 70 6.057 1.7436 .2084 5.641 6.473 1.0 9.0
Drive .00 38 6.026315779 1.5253248774 .2474403693 5.524953968 6.527677590 3.6666667 9.0000000
1.00 32 5.354166678 1.1971815217 .2116337931 4.922536711 5.785796645 2.6666667 8.3333330
Total 70 5.719047619 1.4160748131 .1692533130 5.381396498 6.056698739 2.6666667 9.0000000
Dynamic .00 38 6.526 1.9692 .3194 5.879 7.174 3.0 10.0
1.00 32 5.688 1.9250 .3403 4.993 6.382 2.0 10.0
Total 70 6.143 1.9802 .2367 5.671 6.615 2.0 10.0
Striving .00 38 6.500 1.7359 .2816 5.929 7.071 3.0 9.0
1.00 32 6.438 1.5850 .2802 5.866 7.009 3.0 9.0
Total 70 6.471 1.6570 .1980 6.076 6.867 3.0 9.0
Enterprising .00 38 5.053 1.7850 .2896 4.466 5.639 2.0 9.0
1.00 32 3.938 1.4128 .2497 3.428 4.447 1.0 6.0
Total 70 4.543 1.7083 .2042 4.136 4.950 1.0 9.0
Implementation .00 38 5.710526318 1.5347253057 .2489653201 5.206074663 6.214977974 3.0000000 8.6666670
1.00 32 5.510416684 1.5356792972 .2714723112 4.956745255 6.064088113 2.3333333 8.3333330
Total 70 5.619047629 1.5272993236 .1825471847 5.254875960 5.983219298 2.3333333 8.6666670
Meticulous .00 38 5.553 1.7351 .2815 4.982 6.123 2.0 8.0
1.00 32 5.625 1.8622 .3292 4.954 6.296 2.0 9.0
Total 70 5.586 1.7815 .2129 5.161 6.010 2.0 9.0
Reliable .00 38 5.474 2.1275 .3451 4.774 6.173 2.0 9.0
1.00 32 5.313 2.3478 .4150 4.466 6.159 1.0 9.0
Total 70 5.400 2.2159 .2648 4.872 5.928 1.0 9.0
Compliant .00 38 6.105 1.8127 .2941 5.509 6.701 2.0 9.0
1.00 32 5.594 1.6822 .2974 4.987 6.200 2.0 9.0
Total 70 5.871 1.7604 .2104 5.452 6.291 2.0 9.0

110
ANOVA
Sum of Squares df Mean Square F Sig.
Thought Between Groups 3.880 1 3.880 2.535 .116
Within Groups 104.069 68 1.530 Total 107.949 69
Vision Between Groups 11.222 1 11.222 4.258 .043
Within Groups 179.205 68 2.635 Total 190.427 69
Inventive Between Groups 6.090 1 6.090 1.602 .210
Within Groups 258.553 68 3.802 Total 264.643 69
Abstract Between Groups 32.217 1 32.217 7.597 .007
Within Groups 288.368 68 4.241 Total 320.586 69
Strategic Between Groups 3.632 1 3.632 .861 .357
Within Groups 286.954 68 4.220 Total 290.586 69
Judgment Between Groups .738 1 .738 .476 .492
Within Groups 105.371 68 1.550 Total 106.110 69
Insightful Between Groups 2.662 1 2.662 .815 .370
Within Groups 222.138 68 3.267 Total 224.800 69
Practically minded Between Groups .381 1 .381 .112 .738
Within Groups 230.191 68 3.385 Total 230.571 69

111
Learning oriented Between Groups 2.443 1 2.443 .627 .431
Within Groups 265.000 68 3.897 Total 267.443 69
Evaluation Between Groups 2.890 1 2.890 1.102 .298
Within Groups 178.330 68 2.623 Total 181.221 69
Analytical Between Groups 5.211 1 5.211 1.451 .233
Within Groups 244.232 68 3.592 Total 249.443 69
Factual Between Groups .099 1 .099 .027 .869
Within Groups 248.243 68 3.651 Total 248.343 69
Rational Between Groups 6.261 1 6.261 1.623 .207
Within Groups 262.311 68 3.858 Total 268.571 69
Influence Between Groups 3.844 1 3.844 4.539 .037
Within Groups 57.582 68 .847 Total 61.426 69
Leadership Between Groups .151 1 .151 .079 .780
Within Groups 130.548 68 1.920 Total 130.698 69
Purposeful Between Groups .027 1 .027 .006 .938
Within Groups 303.816 68 4.468 Total 303.843 69
Directing Between Groups .974 1 .974 .339 .562
Within Groups 195.368 68 2.873 Total 196.343 69

112
Empowering Between Groups .000 1 .000 .000 .994
Within Groups 224.586 68 3.303 Total 224.586 69
Impact Between Groups 3.177 1 3.177 2.348 .130
Within Groups 92.006 68 1.353 Total 95.183 69
Convincing Between Groups 3.554 1 3.554 1.254 .267
Within Groups 192.732 68 2.834 Total 196.286 69
Challenging Between Groups 9.264 1 9.264 2.849 .096
Within Groups 221.079 68 3.251 Total 230.343 69
Articulate Between Groups .175 1 .175 .054 .817
Within Groups 220.811 68 3.247 Total 220.986 69
Communication Between Groups 20.140 1 20.140 12.494 .001
Within Groups 109.620 68 1.612 Total 129.760 69
Self promoting Between Groups 13.150 1 13.150 4.155 .045
Within Groups 215.192 68 3.165 Total 228.343 69
Interactive Between Groups 35.242 1 35.242 12.765 .001
Within Groups 187.743 68 2.761 Total 222.986 69
Engaging Between Groups 15.214 1 15.214 5.166 .026
Within Groups 200.271 68 2.945 Total 215.486 69

113
Adaptability Between Groups .381 1 .381 .319 .574
Within Groups 81.197 68 1.194 Total 81.578 69
Support Between Groups 1.434 1 1.434 .506 .479
Within Groups 192.763 68 2.835 Total 194.197 69
Involving Between Groups 1.188 1 1.188 .221 .640
Within Groups 365.798 68 5.379 Total 366.986 69
Attentive Between Groups .332 1 .332 .074 .786
Within Groups 304.368 68 4.476 Total 304.700 69
Accepting Between Groups 3.711 1 3.711 1.287 .261
Within Groups 196.061 68 2.883 Total 199.771 69
Resilience Between Groups .059 1 .059 .051 .821
Within Groups 77.694 68 1.143 Total 77.752 69
Resolving Between Groups .316 1 .316 .083 .774
Within Groups 258.270 68 3.798 Total 258.586 69
Self-assured Between Groups 2.316 1 2.316 .754 .388
Within Groups 208.770 68 3.070 Total 211.086 69
Composed Between Groups .054 1 .054 .021 .885
Within Groups 175.217 68 2.577 Total 175.271 69

114
Flexibility Between Groups .169 1 .169 .085 .771
Within Groups 135.140 68 1.987 Total 135.310 69
Receptive Between Groups 1.937 1 1.937 .497 .483
Within Groups 264.863 68 3.895 Total 266.800 69
Positive Between Groups .000 1 .000 .000 .997
Within Groups 211.771 68 3.114 Total 211.771 69
Change Oriented Between Groups 6.929 1 6.929 1.681 .199
Within Groups 280.342 68 4.123 Total 287.271 69
Delivery Between Groups 1.390 1 1.390 1.446 .233
Within Groups 65.386 68 .962 Total 66.776 69
Structure Between Groups .010 1 .010 .006 .941
Within Groups 118.365 68 1.741 Total 118.375 69
Organized Between Groups .045 1 .045 .013 .910
Within Groups 239.798 68 3.526 Total 239.843 69
Principled Between Groups 3.844 1 3.844 1.543 .218
Within Groups 169.428 68 2.492 Total 173.271 69
Activity Oriented Between Groups 3.528 1 3.528 1.163 .285
Within Groups 206.243 68 3.033 Total 209.771 69

115
Drive Between Groups 7.848 1 7.848 4.089 .047
Within Groups 130.515 68 1.919 Total 138.363 69
Dynamic Between Groups 12.223 1 12.223 3.217 .077
Within Groups 258.349 68 3.799 Total 270.571 69
Striving Between Groups .068 1 .068 .024 .876
Within Groups 189.375 68 2.785 Total 189.443 69
Enterprising Between Groups 21.602 1 21.602 8.171 .006
Within Groups 179.770 68 2.644 Total 201.371 69
Implementation Between Groups .696 1 .696 .295 .589
Within Groups 160.257 68 2.357 Total 160.952 69
Meticulous Between Groups .091 1 .091 .028 .867
Within Groups 218.895 68 3.219 Total 218.986 69
Reliable Between Groups .451 1 .451 .091 .764
Within Groups 338.349 68 4.976 Total 338.800 69
Compliant Between Groups 4.545 1 4.545 1.477 .228
Within Groups 209.298 68 3.078 Total 213.843 69

116
APPENDIX C DATA FOR THE DOCTORAL GRANTING SUBCATEGORY
0 = Non-Doctoral Granting; 1=Doctoral Granting
N Mean Std. Deviation Std. Error
95% Confidence Interval for Mean
Minimum Maximum Lower Bound Upper Bound
Thought .00 25 5.928888892 1.3732002789 .2746400558 5.362059676 6.495718108 3.0000000 7.8888890
1.00 43 6.762273909 1.1091467726 .1691432971 6.420928916 7.103618902 4.4444447 8.8888890
Total 68 6.455882359 1.2690617246 .1538963393 6.148703980 6.763060738 3.0000000 8.8888890
Vision .00 25 5.866666728 1.6969471904 .3393894381 5.166201355 6.567132101 1.6666666 8.6666670
1.00 43 6.682170516 1.6199050908 .2470332104 6.183637314 7.180703718 3.6666667 9.3333330
Total 68 6.382352947 1.6832653110 .2041259022 5.974915941 6.789789953 1.6666666 9.3333330
Inventive .00 25 5.680 1.8868 .3774 4.901 6.459 2.0 9.0
1.00 43 6.093 1.9738 .3010 5.486 6.700 3.0 10.0
Total 68 5.941 1.9385 .2351 5.472 6.410 2.0 10.0
Abstract .00 25 5.640 2.0992 .4198 4.773 6.507 1.0 10.0
1.00 43 6.791 2.1332 .3253 6.134 7.447 2.0 10.0
Total 68 6.368 2.1779 .2641 5.840 6.895 1.0 10.0
Strategic .00 25 6.280 2.2642 .4528 5.345 7.215 1.0 10.0
1.00 43 7.163 1.9140 .2919 6.574 7.752 3.0 10.0
Total 68 6.838 2.0777 .2520 6.335 7.341 1.0 10.0
Judgment .00 25 6.079999976 1.5039453612 .3007890722 5.459201842 6.700798110 3.3333333 8.3333330
1.00 43 6.682170523 1.0388065216 .1584165094 6.362473064 7.001867982 4.3333335 9.0000000
Total 68 6.460784293 1.2538886656 .1520563356 6.157278576 6.764290009 3.3333333 9.0000000
Insightful .00 25 6.320 1.7963 .3593 5.579 7.061 3.0 10.0
1.00 43 6.721 1.8429 .2810 6.154 7.288 3.0 10.0
Total 68 6.574 1.8229 .2211 6.132 7.015 3.0 10.0

117
Practically minded .00 25 5.920 2.0396 .4079 5.078 6.762 2.0 9.0
1.00 43 6.256 1.7195 .2622 5.727 6.785 3.0 10.0
Total 68 6.132 1.8358 .2226 5.688 6.577 2.0 10.0
Learning oriented .00 25 6.000 2.3094 .4619 5.047 6.953 1.0 10.0
1.00 43 7.070 1.6959 .2586 6.548 7.592 3.0 10.0
Total 68 6.676 1.9958 .2420 6.193 7.160 1.0 10.0
Evaluation .00 25 5.839999952 1.7403703184 .3480740637 5.121610393 6.558389511 1.6666666 8.0000000
1.00 43 6.922480593 1.4617471842 .2229143558 6.472621210 7.372339976 4.6666665 9.6666670
Total 68 6.524509769 1.6434362926 .1992959242 6.126713439 6.922306099 1.6666666 9.6666670
Analytical .00 25 5.760 2.0058 .4012 4.932 6.588 1.0 9.0
1.00 43 7.209 1.6841 .2568 6.691 7.728 4.0 10.0
Total 68 6.676 1.9273 .2337 6.210 7.143 1.0 10.0
Factual .00 25 5.920 1.9562 .3912 5.113 6.727 2.0 9.0
1.00 43 7.186 1.7218 .2626 6.656 7.716 4.0 10.0
Total 68 6.721 1.8993 .2303 6.261 7.180 2.0 10.0
Rational .00 25 5.840 1.8412 .3682 5.080 6.600 2.0 9.0
1.00 43 6.372 2.0589 .3140 5.738 7.006 2.0 10.0
Total 68 6.176 1.9846 .2407 5.696 6.657 2.0 10.0
Influence .00 25 5.297777812 .9013706339 .1802741268 4.925710301 5.669845323 3.2222223 7.0000000
1.00 43 5.602067142 .9747646149 .1486502102 5.302078873 5.902055411 3.1111112 7.6666665
Total 68 5.490196065 .9531565884 .1155872145 5.259483019 5.720909110 3.1111112 7.6666665
Leadership .00 25 5.906666648 1.4159147907 .2831829581 5.322205748 6.491127548 3.3333333 8.3333330
1.00 43 6.286821674 1.3185316946 .2010741984 5.881037514 6.692605835 3.0000000 9.3333330
Total 68 6.147058797 1.3572266202 .1645879033 5.818539967 6.475577627 3.0000000 9.3333330
Purposeful .00 25 5.520 2.1432 .4286 4.635 6.405 1.0 10.0
1.00 43 5.884 2.0841 .3178 5.242 6.525 1.0 9.0
Total 68 5.750 2.0974 .2544 5.242 6.258 1.0 10.0

118
Directing .00 25 6.080 1.4697 .2939 5.473 6.687 4.0 9.0
1.00 43 6.674 1.7004 .2593 6.151 7.198 1.0 9.0
Total 68 6.456 1.6339 .1981 6.060 6.851 1.0 9.0
Empowering .00 25 6.120 2.0478 .4096 5.275 6.965 2.0 9.0
1.00 43 6.302 1.6695 .2546 5.789 6.816 3.0 10.0
Total 68 6.235 1.8048 .2189 5.798 6.672 2.0 10.0
Impact .00 25 5.160000020 1.2878348237 .2575669647 4.628407932 5.691592108 2.6666667 7.6666665
1.00 43 5.441860449 1.1167813779 .1703075635 5.098165871 5.785555027 2.6666667 8.0000000
Total 68 5.338235291 1.1809609588 .1432125521 5.052381841 5.624088742 2.6666667 8.0000000
Convincing .00 25 4.360 1.9122 .3824 3.571 5.149 1.0 8.0
1.00 43 4.907 1.5708 .2395 4.424 5.390 3.0 8.0
Total 68 4.706 1.7109 .2075 4.292 5.120 1.0 8.0
Challenging .00 25 4.880 1.7870 .3574 4.142 5.618 2.0 9.0
1.00 43 4.744 1.8528 .2826 4.174 5.314 2.0 9.0
Total 68 4.794 1.8167 .2203 4.354 5.234 2.0 9.0
Articulate .00 25 6.240 1.9425 .3885 5.438 7.042 1.0 9.0
1.00 43 6.674 1.6579 .2528 6.164 7.185 2.0 10.0
Total 68 6.515 1.7661 .2142 6.087 6.942 1.0 10.0
Communication .00 25 4.826666640 1.0720351542 .2144070308 4.384152277 5.269181003 3.0000000 7.3333335
1.00 43 5.077519379 1.4617471733 .2229143541 4.627660000 5.527378758 1.0000000 7.6666665
Total 68 4.985294107 1.3288904014 .1611516321 4.663634104 5.306954111 1.0000000 7.6666665
Self promoting .00 25 4.480 1.8055 .3611 3.735 5.225 2.0 10.0
1.00 43 4.674 1.7958 .2739 4.122 5.227 1.0 9.0
Total 68 4.603 1.7884 .2169 4.170 5.036 1.0 10.0
Interactive .00 25 5.360 1.5242 .3048 4.731 5.989 3.0 9.0
1.00 43 5.605 1.9166 .2923 5.015 6.194 1.0 9.0
Total 68 5.515 1.7746 .2152 5.085 5.944 1.0 9.0

119
Engaging .00 25 4.640 1.3808 .2762 4.070 5.210 1.0 7.0
1.00 43 4.953 1.8892 .2881 4.372 5.535 1.0 8.0
Total 68 4.838 1.7157 .2081 4.423 5.254 1.0 8.0
Adaptability .00 25 5.648888880 1.0485537703 .2097107541 5.216067156 6.081710604 2.3333333 7.0000000
1.00 43 5.883720912 1.1367293865 .1733496063 5.533887243 6.233554580 3.0000000 7.6666665
Total 68 5.797385606 1.1031123557 .1337720223 5.530375532 6.064395680 2.3333333 7.6666665
Support .00 25 5.826666620 1.4437604859 .2887520972 5.230711582 6.422621658 3.3333333 8.3333330
1.00 43 5.922480598 1.8485475075 .2819008521 5.353581646 6.491379549 2.0000000 9.0000000
Total 68 5.887254871 1.7002684840 .2061878397 5.475702220 6.298807521 2.0000000 9.0000000
Involving .00 25 6.120 1.6411 .3282 5.443 6.797 3.0 9.0
1.00 43 6.116 2.5468 .3884 5.332 6.900 2.0 10.0
Total 68 6.118 2.2429 .2720 5.575 6.661 2.0 10.0
Attentive .00 25 4.960 1.9035 .3807 4.174 5.746 1.0 9.0
1.00 43 5.372 2.1715 .3311 4.704 6.040 1.0 10.0
Total 68 5.221 2.0722 .2513 4.719 5.722 1.0 10.0
Accepting .00 25 6.400 1.8257 .3651 5.646 7.154 3.0 9.0
1.00 43 6.279 1.6666 .2541 5.766 6.792 3.0 9.0
Total 68 6.324 1.7142 .2079 5.909 6.738 3.0 9.0
Resilience .00 25 5.653333352 1.0907014140 .2181402828 5.203113936 6.103552768 2.3333333 7.3333335
1.00 43 5.798449605 1.0341766602 .1577104621 5.480177007 6.116722203 3.3333333 7.6666665
Total 68 5.745098041 1.0495480249 .1272763931 5.491053297 5.999142785 2.3333333 7.6666665
Resolving .00 25 5.240 1.6401 .3280 4.563 5.917 1.0 8.0
1.00 43 5.326 2.0086 .3063 4.707 5.944 1.0 10.0
Total 68 5.294 1.8693 .2267 4.842 5.747 1.0 10.0
Self-assured .00 25 5.960 1.8592 .3718 5.193 6.727 2.0 9.0
1.00 43 6.163 1.6752 .2555 5.647 6.678 3.0 10.0
Total 68 6.088 1.7341 .2103 5.668 6.508 2.0 10.0

120
Composed .00 25 5.760 1.6902 .3380 5.062 6.458 1.0 9.0
1.00 43 5.907 1.5555 .2372 5.428 6.386 3.0 8.0
Total 68 5.853 1.5954 .1935 5.467 6.239 1.0 9.0
Flexibility .00 25 5.466666664 1.4529662998 .2905932600 4.866911653 6.066421675 1.3333334 7.6666665
1.00 43 5.930232540 1.3792838467 .2103388147 5.505751626 6.354713453 2.6666667 8.3333330
Total 68 5.759803909 1.4140324538 .1714766225 5.417535138 6.102072680 1.3333334 8.3333330
Receptive .00 25 5.600 2.1409 .4282 4.716 6.484 1.0 9.0
1.00 43 5.395 1.8405 .2807 4.829 5.962 1.0 10.0
Total 68 5.471 1.9430 .2356 5.000 5.941 1.0 10.0
Positive .00 25 5.360 1.9339 .3868 4.562 6.158 1.0 9.0
1.00 43 5.744 1.6343 .2492 5.241 6.247 2.0 9.0
Total 68 5.603 1.7461 .2117 5.180 6.026 1.0 9.0
Change Oriented .00 25 5.440 2.0429 .4086 4.597 6.283 1.0 8.0
1.00 43 6.651 1.9381 .2956 6.055 7.248 2.0 10.0
Total 68 6.206 2.0484 .2484 5.710 6.702 1.0 10.0
Delivery .00 25 6.026666692 1.1163211401 .2232642280 5.565871973 6.487461411 3.4444444 7.7777777
1.00 43 5.816537458 .8964242817 .1367034214 5.540658785 6.092416132 3.8888888 7.6666665
Total 68 5.893790853 .9800730209 .1188513114 5.656562643 6.131019063 3.4444444 7.7777777
Structure .00 25 6.373333336 1.6139438907 .3227887781 5.707130041 7.039536631 2.6666667 8.6666670
1.00 43 6.240310063 1.1063204315 .1687122841 5.899834889 6.580785236 3.6666667 8.0000000
Total 68 6.289215678 1.3055620566 .1583226547 5.973202336 6.605229019 2.6666667 8.6666670
Organized .00 25 6.360 2.2338 .4468 5.438 7.282 1.0 10.0
1.00 43 6.093 1.6156 .2464 5.596 6.590 2.0 9.0
Total 68 6.191 1.8549 .2249 5.742 6.640 1.0 10.0
Principled .00 25 7.160 1.5460 .3092 6.522 7.798 5.0 9.0
1.00 43 6.302 1.5045 .2294 5.839 6.765 3.0 9.0
Total 68 6.618 1.5648 .1898 6.239 6.996 3.0 9.0

121
Activity Oriented .00 25 5.600 2.3274 .4655 4.639 6.561 1.0 9.0
1.00 43 6.326 1.2858 .1961 5.930 6.721 3.0 8.0
Total 68 6.059 1.7610 .2135 5.633 6.485 1.0 9.0
Drive .00 25 5.400000016 1.2397729304 .2479545861 4.888246902 5.911753130 3.0000000 8.3333330
1.00 43 5.961240300 1.4910833372 .2273880772 5.502352582 6.420128018 2.6666667 9.0000000
Total 68 5.754901960 1.4207857692 .1722955823 5.410998539 6.098805382 2.6666667 9.0000000
Dynamic .00 25 5.960 1.8367 .3673 5.202 6.718 3.0 10.0
1.00 43 6.279 2.1081 .3215 5.630 6.928 2.0 10.0
Total 68 6.162 2.0045 .2431 5.677 6.647 2.0 10.0
Striving .00 25 6.160 1.5727 .3145 5.511 6.809 3.0 9.0
1.00 43 6.767 1.6306 .2487 6.266 7.269 3.0 9.0
Total 68 6.544 1.6248 .1970 6.151 6.937 3.0 9.0
Enterprising .00 25 4.080 1.4697 .2939 3.473 4.687 2.0 7.0
1.00 43 4.837 1.8248 .2783 4.276 5.399 1.0 9.0
Total 68 4.559 1.7310 .2099 4.140 4.978 1.0 9.0
Implementation .00 25 6.306666708 1.5089854270 .3017970854 5.683788138 6.929545278 3.3333333 8.6666670
1.00 43 5.248062007 1.4458351503 .2204877934 4.803099626 5.693024388 2.3333333 8.0000000
Total 68 5.637254912 1.5461237045 .1874950395 5.263013247 6.011496577 2.3333333 8.6666670
Meticulous .00 25 6.040 1.6452 .3290 5.361 6.719 2.0 9.0
1.00 43 5.349 1.8630 .2841 4.775 5.922 2.0 9.0
Total 68 5.603 1.8050 .2189 5.166 6.040 2.0 9.0
Reliable .00 25 6.080 2.4651 .4930 5.062 7.098 1.0 9.0
1.00 43 5.047 1.9634 .2994 4.442 5.651 2.0 9.0
Total 68 5.426 2.2012 .2669 4.894 5.959 1.0 9.0
Compliant .00 25 6.800 1.4434 .2887 6.204 7.396 4.0 9.0
1.00 43 5.349 1.6745 .2554 4.833 5.864 2.0 9.0
Total 68 5.882 1.7323 .2101 5.463 6.302 2.0 9.0

122
ANOVA
Sum of Squares df Mean Square F Sig.
Thought Between Groups 10.980 1 10.980 7.477 .008
Within Groups 96.925 66 1.469 Total 107.905 67
Vision Between Groups 10.514 1 10.514 3.870 .053
Within Groups 179.323 66 2.717 Total 189.837 67
Inventive Between Groups 2.697 1 2.697 .715 .401
Within Groups 249.068 66 3.774 Total 251.765 67
Abstract Between Groups 20.933 1 20.933 4.654 .035
Within Groups 296.876 66 4.498 Total 317.809 67
Strategic Between Groups 12.320 1 12.320 2.937 .091
Within Groups 276.900 66 4.195 Total 289.221 67
Judgment Between Groups 5.732 1 5.732 3.798 .056
Within Groups 99.607 66 1.509 Total 105.340 67
Insightful Between Groups 2.541 1 2.541 .762 .386
Within Groups 220.091 66 3.335 Total 222.632 67
Practically minded Between Groups 1.783 1 1.783 .525 .471
Within Groups 224.026 66 3.394 Total 225.809 67
Learning oriented Between Groups 18.092 1 18.092 4.799 .032

123
Within Groups 248.791 66 3.770 Total 266.882 67
Evaluation Between Groups 18.524 1 18.524 7.527 .008
Within Groups 162.435 66 2.461 Total 180.959 67
Analytical Between Groups 33.206 1 33.206 10.162 .002
Within Groups 215.676 66 3.268 Total 248.882 67
Factual Between Groups 25.340 1 25.340 7.730 .007
Within Groups 216.352 66 3.278 Total 241.691 67
Rational Between Groups 4.476 1 4.476 1.139 .290
Within Groups 259.407 66 3.930 Total 263.882 67
Influence Between Groups 1.464 1 1.464 1.626 .207
Within Groups 59.406 66 .900 Total 60.870 67
Leadership Between Groups 2.285 1 2.285 1.245 .269
Within Groups 121.134 66 1.835 Total 123.418 67
Purposeful Between Groups 2.091 1 2.091 .472 .495
Within Groups 292.659 66 4.434 Total 294.750 67
Directing Between Groups 5.586 1 5.586 2.128 .149
Within Groups 173.282 66 2.625 Total 178.868 67
Empowering Between Groups .526 1 .526 .159 .691

124
Within Groups 217.710 66 3.299 Total 218.235 67
Impact Between Groups 1.256 1 1.256 .899 .346
Within Groups 92.187 66 1.397 Total 93.443 67
Convincing Between Groups 4.730 1 4.730 1.631 .206
Within Groups 191.388 66 2.900 Total 196.118 67
Challenging Between Groups .292 1 .292 .087 .769
Within Groups 220.826 66 3.346 Total 221.118 67
Articulate Between Groups 2.983 1 2.983 .956 .332
Within Groups 206.002 66 3.121 Total 208.985 67
Communication Between Groups .995 1 .995 .560 .457
Within Groups 117.324 66 1.778 Total 118.319 67
Self promoting Between Groups .598 1 .598 .185 .669
Within Groups 213.682 66 3.238 Total 214.279 67
Interactive Between Groups .946 1 .946 .297 .587
Within Groups 210.039 66 3.182 Total 210.985 67
Engaging Between Groups 1.554 1 1.554 .524 .472
Within Groups 195.667 66 2.965 Total 197.221 67
Adaptability Between Groups .872 1 .872 .713 .401

125
Within Groups 80.658 66 1.222 Total 81.529 67
Support Between Groups .145 1 .145 .049 .825
Within Groups 193.546 66 2.933 Total 193.691 67
Involving Between Groups .000 1 .000 .000 .995
Within Groups 337.059 66 5.107 Total 337.059 67
Attentive Between Groups 2.685 1 2.685 .622 .433
Within Groups 285.007 66 4.318 Total 287.691 67
Accepting Between Groups .231 1 .231 .078 .781
Within Groups 196.651 66 2.980 Total 196.882 67
Resilience Between Groups .333 1 .333 .299 .586
Within Groups 73.471 66 1.113 Total 73.804 67
Resolving Between Groups .116 1 .116 .033 .857
Within Groups 234.002 66 3.545 Total 234.118 67
Self-assured Between Groups .650 1 .650 .214 .645
Within Groups 200.820 66 3.043 Total 201.471 67
Composed Between Groups .342 1 .342 .132 .717
Within Groups 170.188 66 2.579 Total 170.529 67
Flexibility Between Groups 3.397 1 3.397 1.717 .195

126
Within Groups 130.568 66 1.978 Total 133.966 67
Receptive Between Groups .662 1 .662 .173 .679
Within Groups 252.279 66 3.822 Total 252.941 67
Positive Between Groups 2.333 1 2.333 .763 .386
Within Groups 201.946 66 3.060 Total 204.279 67
Change Oriented Between Groups 23.190 1 23.190 5.934 .018
Within Groups 257.927 66 3.908 Total 281.118 67
Delivery Between Groups .698 1 .698 .724 .398
Within Groups 63.658 66 .965 Total 64.356 67
Structure Between Groups .280 1 .280 .162 .689
Within Groups 113.921 66 1.726 Total 114.201 67
Organized Between Groups 1.127 1 1.127 .324 .571
Within Groups 229.388 66 3.476 Total 230.515 67
Principled Between Groups 11.629 1 11.629 5.035 .028
Within Groups 152.430 66 2.310 Total 164.059 67
Activity Oriented Between Groups 8.323 1 8.323 2.754 .102
Within Groups 199.442 66 3.022 Total 207.765 67
Drive Between Groups 4.980 1 4.980 2.523 .117

127
Within Groups 130.269 66 1.974 Total 135.248 67
Dynamic Between Groups 1.609 1 1.609 .397 .531
Within Groups 267.611 66 4.055 Total 269.221 67
Striving Between Groups 5.833 1 5.833 2.251 .138
Within Groups 171.034 66 2.591 Total 176.868 67
Enterprising Between Groups 9.064 1 9.064 3.121 .082
Within Groups 191.700 66 2.905 Total 200.765 67
Implementation Between Groups 17.716 1 17.716 8.208 .006
Within Groups 142.447 66 2.158 Total 160.163 67
Meticulous Between Groups 7.552 1 7.552 2.365 .129
Within Groups 210.727 66 3.193 Total 218.279 67
Reliable Between Groups 16.885 1 16.885 3.621 .061
Within Groups 307.747 66 4.663 Total 324.632 67
Compliant Between Groups 33.291 1 33.291 13.097 .001
Within Groups 167.767 66 2.542 Total 201.059 67

128
APPENDIX D DATA FOR THE INSTITUTIONAL SIZE SUBCATEGORY
0 = Less than 10,000 enrollments; 10=10,000 or more enrollments
N Mean Std. Deviation Std. Error
95% Confidence Interval for Mean
Minimum Maximum Lower Bound Upper Bound
Thought .00 31 6.175627226 1.2140379347 .2180476499 5.730314516 6.620939935 3.3333333 8.0000000
10.00 37 6.690690714 1.2825020608 .2108420400 6.263083237 7.118298190 3.0000000 8.8888890
Total 68 6.455882359 1.2690617246 .1538963393 6.148703980 6.763060738 3.0000000 8.8888890
Vision .00 31 6.000000055 1.7659327920 .3171708925 5.352250677 6.647749432 1.6666666 8.6666670
10.00 37 6.702702668 1.5630450226 .2569630188 6.181557511 7.223847825 3.6666667 9.3333330
Total 68 6.382352947 1.6832653110 .2041259022 5.974915941 6.789789953 1.6666666 9.3333330
Inventive .00 31 5.645 1.9244 .3456 4.939 6.351 2.0 9.0
10.00 37 6.189 1.9413 .3192 5.542 6.836 3.0 10.0
Total 68 5.941 1.9385 .2351 5.472 6.410 2.0 10.0
Abstract .00 31 5.871 2.3628 .4244 5.004 6.738 1.0 10.0
10.00 37 6.784 1.9456 .3199 6.135 7.432 2.0 10.0
Total 68 6.368 2.1779 .2641 5.840 6.895 1.0 10.0
Strategic .00 31 6.484 2.1583 .3876 5.692 7.276 1.0 10.0
10.00 37 7.135 1.9883 .3269 6.472 7.798 3.0 10.0
Total 68 6.838 2.0777 .2520 6.335 7.341 1.0 10.0
Judgment .00 31 6.344086016 1.2779725047 .2295306377 5.875321917 6.812850115 3.3333333 8.3333330
10.00 37 6.558558524 1.2423942748 .2042483606 6.144323649 6.972793399 3.6666667 9.0000000
Total 68 6.460784293 1.2538886656 .1520563356 6.157278576 6.764290009 3.3333333 9.0000000
Insightful .00 31 6.387 1.6058 .2884 5.798 6.976 3.0 9.0
10.00 37 6.730 1.9951 .3280 6.065 7.395 3.0 10.0
Total 68 6.574 1.8229 .2211 6.132 7.015 3.0 10.0

129
Practically minded .00 31 6.065 2.0645 .3708 5.307 6.822 2.0 10.0
10.00 37 6.189 1.6472 .2708 5.640 6.738 3.0 10.0
Total 68 6.132 1.8358 .2226 5.688 6.577 2.0 10.0
Learning oriented .00 31 6.581 1.9455 .3494 5.867 7.294 3.0 10.0
10.00 37 6.757 2.0603 .3387 6.070 7.444 1.0 10.0
Total 68 6.676 1.9958 .2420 6.193 7.160 1.0 10.0
Evaluation .00 31 6.182795629 1.4111689582 .2534534269 5.665174676 6.700416582 3.0000000 9.0000000
10.00 37 6.810810805 1.7839139577 .2932736481 6.216024279 7.405597332 1.6666666 9.6666670
Total 68 6.524509769 1.6434362926 .1992959242 6.126713439 6.922306099 1.6666666 9.6666670
Analytical .00 31 6.194 1.7401 .3125 5.555 6.832 2.0 10.0
10.00 37 7.081 2.0052 .3297 6.412 7.750 1.0 10.0
Total 68 6.676 1.9273 .2337 6.210 7.143 1.0 10.0
Factual .00 31 6.419 1.5226 .2735 5.861 6.978 3.0 10.0
10.00 37 6.973 2.1536 .3541 6.255 7.691 2.0 10.0
Total 68 6.721 1.8993 .2303 6.261 7.180 2.0 10.0
Rational .00 31 5.935 1.8962 .3406 5.240 6.631 3.0 9.0
10.00 37 6.378 2.0595 .3386 5.692 7.065 2.0 10.0
Total 68 6.176 1.9846 .2407 5.696 6.657 2.0 10.0
Influence .00 31 5.422939094 .9386178345 .1685807396 5.078651292 5.767226895 3.1111112 7.2222223
10.00 37 5.546546500 .9744254840 .1601945628 5.221656868 5.871436132 3.2222223 7.6666665
Total 68 5.490196065 .9531565884 .1155872145 5.259483019 5.720909110 3.1111112 7.6666665
Leadership .00 31 5.999999968 1.4375905359 .2581988824 5.472687502 6.527312433 3.0000000 8.3333330
10.00 37 6.270270249 1.2929959136 .2125672188 5.839163947 6.701376550 3.6666667 9.3333330
Total 68 6.147058797 1.3572266202 .1645879033 5.818539967 6.475577627 3.0000000 9.3333330
Purposeful .00 31 5.677 2.3436 .4209 4.818 6.537 1.0 10.0
10.00 37 5.811 1.8979 .3120 5.178 6.444 1.0 9.0
Total 68 5.750 2.0974 .2544 5.242 6.258 1.0 10.0

130
Directing .00 31 6.065 1.8246 .3277 5.395 6.734 1.0 9.0
10.00 37 6.784 1.3971 .2297 6.318 7.250 4.0 9.0
Total 68 6.456 1.6339 .1981 6.060 6.851 1.0 9.0
Empowering .00 31 6.258 1.9827 .3561 5.531 6.985 3.0 9.0
10.00 37 6.216 1.6689 .2744 5.660 6.773 2.0 10.0
Total 68 6.235 1.8048 .2189 5.798 6.672 2.0 10.0
Impact .00 31 5.236559148 1.2388571176 .2225053068 4.782142689 5.690975608 2.6666667 7.6666665
10.00 37 5.423423411 1.1403071124 .1874653345 5.043226091 5.803620731 2.6666667 8.0000000
Total 68 5.338235291 1.1809609588 .1432125521 5.052381841 5.624088742 2.6666667 8.0000000
Convincing .00 31 4.581 1.7659 .3172 3.933 5.228 1.0 8.0
10.00 37 4.811 1.6806 .2763 4.250 5.371 1.0 8.0
Total 68 4.706 1.7109 .2075 4.292 5.120 1.0 8.0
Challenging .00 31 5.000 1.9664 .3532 4.279 5.721 2.0 9.0
10.00 37 4.622 1.6890 .2777 4.058 5.185 2.0 9.0
Total 68 4.794 1.8167 .2203 4.354 5.234 2.0 9.0
Articulate .00 31 6.129 1.7271 .3102 5.496 6.763 2.0 9.0
10.00 37 6.838 1.7562 .2887 6.252 7.423 1.0 10.0
Total 68 6.515 1.7661 .2142 6.087 6.942 1.0 10.0
Communication .00 31 5.032258061 1.1749069272 .2110195135 4.601298721 5.463217401 2.3333333 7.3333335
10.00 37 4.945945930 1.4604107192 .2400900433 4.459020753 5.432871106 1.0000000 7.6666665
Total 68 4.985294107 1.3288904014 .1611516321 4.663634104 5.306954111 1.0000000 7.6666665
Self promoting .00 31 4.516 1.8774 .3372 3.827 5.205 1.0 10.0
10.00 37 4.676 1.7329 .2849 4.098 5.253 1.0 9.0
Total 68 4.603 1.7884 .2169 4.170 5.036 1.0 10.0
Interactive .00 31 5.613 1.8381 .3301 4.939 6.287 2.0 9.0
10.00 37 5.432 1.7407 .2862 4.852 6.013 1.0 9.0
Total 68 5.515 1.7746 .2152 5.085 5.944 1.0 9.0

131
Engaging .00 31 4.968 1.4488 .2602 4.436 5.499 2.0 8.0
10.00 37 4.730 1.9242 .3163 4.088 5.371 1.0 8.0
Total 68 4.838 1.7157 .2081 4.423 5.254 1.0 8.0
Adaptability .00 31 5.652329752 1.2991741444 .2333385646 5.175788828 6.128870675 2.3333333 7.6666665
10.00 37 5.918918889 .9082190563 .1493102931 5.616103579 6.221734199 3.4444444 7.2222223
Total 68 5.797385606 1.1031123557 .1337720223 5.530375532 6.064395680 2.3333333 7.6666665
Support .00 31 5.526881694 1.8273116823 .3281948666 4.856618357 6.197145030 2.0000000 9.0000000
10.00 37 6.189189154 1.5466820472 .2542729623 5.673499685 6.704878623 2.6666667 8.3333330
Total 68 5.887254871 1.7002684840 .2061878397 5.475702220 6.298807521 2.0000000 9.0000000
Involving .00 31 5.839 2.0992 .3770 5.069 6.609 2.0 10.0
10.00 37 6.351 2.3596 .3879 5.565 7.138 2.0 10.0
Total 68 6.118 2.2429 .2720 5.575 6.661 2.0 10.0
Attentive .00 31 4.774 2.3052 .4140 3.929 5.620 1.0 10.0
10.00 37 5.595 1.8022 .2963 4.994 6.195 2.0 9.0
Total 68 5.221 2.0722 .2513 4.719 5.722 1.0 10.0
Accepting .00 31 5.968 1.9914 .3577 5.237 6.698 3.0 9.0
10.00 37 6.622 1.4014 .2304 6.154 7.089 4.0 9.0
Total 68 6.324 1.7142 .2079 5.909 6.738 3.0 9.0
Resilience .00 31 5.698924726 1.1622291263 .2087425132 5.272615641 6.125233811 2.3333333 7.6666665
10.00 37 5.783783792 .9597331744 .1577791620 5.463792820 6.103774764 3.3333333 7.0000000
Total 68 5.745098041 1.0495480249 .1272763931 5.491053297 5.999142785 2.3333333 7.6666665
Resolving .00 31 5.323 1.8688 .3356 4.637 6.008 1.0 10.0
10.00 37 5.270 1.8951 .3116 4.638 5.902 1.0 10.0
Total 68 5.294 1.8693 .2267 4.842 5.747 1.0 10.0
Self-assured .00 31 5.806 1.7208 .3091 5.175 6.438 2.0 10.0
10.00 37 6.324 1.7329 .2849 5.747 6.902 3.0 9.0
Total 68 6.088 1.7341 .2103 5.668 6.508 2.0 10.0

132
Composed .00 31 5.968 1.7413 .3128 5.329 6.606 1.0 9.0
10.00 37 5.757 1.4796 .2432 5.263 6.250 3.0 8.0
Total 68 5.853 1.5954 .1935 5.467 6.239 1.0 9.0
Flexibility .00 31 5.731182810 1.5333800662 .2754031899 5.168734461 6.293631159 1.3333334 7.6666665
10.00 37 5.783783749 1.3268737073 .2181366938 5.341382029 6.226185469 2.6666667 8.3333330
Total 68 5.759803909 1.4140324538 .1714766225 5.417535138 6.102072680 1.3333334 8.3333330
Receptive .00 31 5.484 2.0796 .3735 4.721 6.247 1.0 9.0
10.00 37 5.459 1.8498 .3041 4.843 6.076 1.0 10.0
Total 68 5.471 1.9430 .2356 5.000 5.941 1.0 10.0
Positive .00 31 5.548 2.0630 .3705 4.792 6.305 1.0 9.0
10.00 37 5.649 1.4571 .2395 5.163 6.134 2.0 9.0
Total 68 5.603 1.7461 .2117 5.180 6.026 1.0 9.0
Change Oriented .00 31 6.161 2.0672 .3713 5.403 6.920 1.0 10.0
10.00 37 6.243 2.0603 .3387 5.556 6.930 1.0 10.0
Total 68 6.206 2.0484 .2484 5.710 6.702 1.0 10.0
Delivery .00 31 6.035842294 1.1537689442 .2072230197 5.612636428 6.459048159 3.4444444 7.7777777
10.00 37 5.774774781 .8040050901 .1321776226 5.506706138 6.042843425 4.1111110 7.3333335
Total 68 5.893790853 .9800730209 .1188513114 5.656562643 6.131019063 3.4444444 7.7777777
Structure .00 31 6.408602181 1.6071822347 .2886584507 5.819082978 6.998121384 2.6666667 8.6666670
10.00 37 6.189189149 .9985809008 .1641656888 5.856245700 6.522132597 4.0000000 8.0000000
Total 68 6.289215678 1.3055620566 .1583226547 5.973202336 6.605229019 2.6666667 8.6666670
Organized .00 31 6.290 2.2685 .4074 5.458 7.122 1.0 10.0
10.00 37 6.108 1.4488 .2382 5.625 6.591 2.0 8.0
Total 68 6.191 1.8549 .2249 5.742 6.640 1.0 10.0
Principled .00 31 6.710 1.5747 .2828 6.132 7.287 4.0 9.0
10.00 37 6.541 1.5740 .2588 6.016 7.065 3.0 9.0
Total 68 6.618 1.5648 .1898 6.239 6.996 3.0 9.0

133
Activity Oriented .00 31 6.226 2.1089 .3788 5.452 6.999 1.0 9.0
10.00 37 5.919 1.4216 .2337 5.445 6.393 1.0 8.0
Total 68 6.059 1.7610 .2135 5.633 6.485 1.0 9.0
Drive .00 31 5.688172032 1.3359292894 .2399399835 5.198149213 6.178194852 3.0000000 8.3333330
10.00 37 5.810810819 1.5041927657 .2472877674 5.309287981 6.312333656 2.6666667 9.0000000
Total 68 5.754901960 1.4207857692 .1722955823 5.410998539 6.098805382 2.6666667 9.0000000
Dynamic .00 31 6.290 2.1165 .3801 5.514 7.067 2.0 10.0
10.00 37 6.054 1.9285 .3170 5.411 6.697 3.0 10.0
Total 68 6.162 2.0045 .2431 5.677 6.647 2.0 10.0
Striving .00 31 6.355 1.4271 .2563 5.831 6.878 3.0 9.0
10.00 37 6.703 1.7774 .2922 6.110 7.295 3.0 9.0
Total 68 6.544 1.6248 .1970 6.151 6.937 3.0 9.0
Enterprising .00 31 4.419 1.4782 .2655 3.877 4.962 2.0 8.0
10.00 37 4.676 1.9301 .3173 4.032 5.319 1.0 9.0
Total 68 4.559 1.7310 .2099 4.140 4.978 1.0 9.0
Implementation .00 31 6.010752697 1.6089653490 .2889787075 5.420579442 6.600925951 3.3333333 8.6666670
10.00 37 5.324324335 1.4390636585 .2365806081 4.844516623 5.804132047 2.3333333 8.3333330
Total 68 5.637254912 1.5461237045 .1874950395 5.263013247 6.011496577 2.3333333 8.6666670
Meticulous .00 31 5.935 1.8246 .3277 5.266 6.605 2.0 9.0
10.00 37 5.324 1.7647 .2901 4.736 5.913 2.0 9.0
Total 68 5.603 1.8050 .2189 5.166 6.040 2.0 9.0
Reliable .00 31 5.903 2.5736 .4622 4.959 6.847 1.0 9.0
10.00 37 5.027 1.7715 .2912 4.436 5.618 2.0 9.0
Total 68 5.426 2.2012 .2669 4.894 5.959 1.0 9.0
Compliant .00 31 6.194 1.6817 .3020 5.577 6.810 2.0 9.0
10.00 37 5.622 1.7536 .2883 5.037 6.206 2.0 9.0
Total 68 5.882 1.7323 .2101 5.463 6.302 2.0 9.0

134
ANOVA
Sum of Squares df Mean Square F Sig.
Thought Between Groups 4.475 1 4.475 2.855 .096
Within Groups 103.430 66 1.567 Total 107.905 67
Vision Between Groups 8.329 1 8.329 3.029 .086
Within Groups 181.508 66 2.750 Total 189.837 67
Inventive Between Groups 4.992 1 4.992 1.335 .252
Within Groups 246.772 66 3.739 Total 251.765 67
Abstract Between Groups 14.055 1 14.055 3.054 .085
Within Groups 303.754 66 4.602 Total 317.809 67
Strategic Between Groups 7.154 1 7.154 1.674 .200
Within Groups 282.066 66 4.274 Total 289.221 67
Judgment Between Groups .776 1 .776 .490 .487
Within Groups 104.564 66 1.584 Total 105.340 67
Insightful Between Groups 1.980 1 1.980 .592 .444
Within Groups 220.652 66 3.343 Total 222.632 67
Practically minded Between Groups .262 1 .262 .077 .783
Within Groups 225.547 66 3.417 Total 225.809 67
Learning oriented Between Groups .523 1 .523 .130 .720

135
Within Groups 266.359 66 4.036 Total 266.882 67
Evaluation Between Groups 6.653 1 6.653 2.519 .117
Within Groups 174.306 66 2.641 Total 180.959 67
Analytical Between Groups 13.287 1 13.287 3.722 .058
Within Groups 235.595 66 3.570 Total 248.882 67
Factual Between Groups 5.170 1 5.170 1.443 .234
Within Groups 236.521 66 3.584 Total 241.691 67
Rational Between Groups 3.309 1 3.309 .838 .363
Within Groups 260.574 66 3.948 Total 263.882 67
Influence Between Groups .258 1 .258 .281 .598
Within Groups 60.612 66 .918 Total 60.870 67
Leadership Between Groups 1.232 1 1.232 .666 .418
Within Groups 122.186 66 1.851 Total 123.418 67
Purposeful Between Groups .300 1 .300 .067 .796
Within Groups 294.450 66 4.461 Total 294.750 67
Directing Between Groups 8.726 1 8.726 3.385 .070
Within Groups 170.141 66 2.578 Total 178.868 67
Empowering Between Groups .030 1 .030 .009 .925

136
Within Groups 218.206 66 3.306 Total 218.235 67
Impact Between Groups .589 1 .589 .419 .520
Within Groups 92.854 66 1.407 Total 93.443 67
Convincing Between Groups .894 1 .894 .302 .584
Within Groups 195.224 66 2.958 Total 196.118 67
Challenging Between Groups 2.415 1 2.415 .729 .396
Within Groups 218.703 66 3.314 Total 221.118 67
Articulate Between Groups 8.474 1 8.474 2.789 .100
Within Groups 200.511 66 3.038 Total 208.985 67
Communication Between Groups .126 1 .126 .070 .792
Within Groups 118.193 66 1.791 Total 118.319 67
Self promoting Between Groups .429 1 .429 .133 .717
Within Groups 213.850 66 3.240 Total 214.279 67
Interactive Between Groups .549 1 .549 .172 .679
Within Groups 210.436 66 3.188 Total 210.985 67
Engaging Between Groups .956 1 .956 .321 .573
Within Groups 196.265 66 2.974 Total 197.221 67
Adaptability Between Groups 1.199 1 1.199 .985 .325

137
Within Groups 80.331 66 1.217 Total 81.529 67
Support Between Groups 7.399 1 7.399 2.621 .110
Within Groups 186.292 66 2.823 Total 193.691 67
Involving Between Groups 4.433 1 4.433 .880 .352
Within Groups 332.626 66 5.040 Total 337.059 67
Attentive Between Groups 11.353 1 11.353 2.712 .104
Within Groups 276.338 66 4.187 Total 287.691 67
Accepting Between Groups 7.212 1 7.212 2.510 .118
Within Groups 189.670 66 2.874 Total 196.882 67
Resilience Between Groups .121 1 .121 .109 .743
Within Groups 73.682 66 1.116 Total 73.804 67
Resolving Between Groups .046 1 .046 .013 .910
Within Groups 234.071 66 3.547 Total 234.118 67
Self-assured Between Groups 4.524 1 4.524 1.516 .223
Within Groups 196.947 66 2.984 Total 201.471 67
Composed Between Groups .751 1 .751 .292 .591
Within Groups 169.779 66 2.572 Total 170.529 67
Flexibility Between Groups .047 1 .047 .023 .880

138
Within Groups 133.919 66 2.029 Total 133.966 67
Receptive Between Groups .010 1 .010 .003 .959
Within Groups 252.931 66 3.832 Total 252.941 67
Positive Between Groups .170 1 .170 .055 .816
Within Groups 204.110 66 3.093 Total 204.279 67
Change Oriented Between Groups .113 1 .113 .027 .871
Within Groups 281.004 66 4.258 Total 281.118 67
Delivery Between Groups 1.150 1 1.150 1.200 .277
Within Groups 63.207 66 .958 Total 64.356 67
Structure Between Groups .812 1 .812 .473 .494
Within Groups 113.389 66 1.718 Total 114.201 67
Organized Between Groups .560 1 .560 .161 .690
Within Groups 229.955 66 3.484 Total 230.515 67
Principled Between Groups .483 1 .483 .195 .660
Within Groups 163.576 66 2.478 Total 164.059 67
Activity Oriented Between Groups 1.589 1 1.589 .509 .478
Within Groups 206.176 66 3.124 Total 207.765 67
Drive Between Groups .254 1 .254 .124 .726

139
Within Groups 134.995 66 2.045 Total 135.248 67
Dynamic Between Groups .942 1 .942 .232 .632
Within Groups 268.279 66 4.065 Total 269.221 67
Striving Between Groups 2.041 1 2.041 .771 .383
Within Groups 174.827 66 2.649 Total 176.868 67
Enterprising Between Groups 1.108 1 1.108 .366 .547
Within Groups 199.656 66 3.025 Total 200.765 67
Implementation Between Groups 7.948 1 7.948 3.446 .068
Within Groups 152.216 66 2.306 Total 160.163 67
Meticulous Between Groups 6.300 1 6.300 1.962 .166
Within Groups 211.979 66 3.212 Total 218.279 67
Reliable Between Groups 12.950 1 12.950 2.742 .102
Within Groups 311.683 66 4.722 Total 324.632 67
Compliant Between Groups 5.517 1 5.517 1.862 .177
Within Groups 195.541 66 2.963 Total 201.059 67

140
APPENDIX E DATA FOR THE GENDER SUBCATEGORY
0 = Male; 1=Female
N Mean Std. Deviation Std. Error
95% Confidence Interval for Mean
Minimum Maximum Lower Bound Upper Bound
Thought .00 30 6.633333323 1.3000802144 .2373610867 6.147875393 7.118791254 3.5555556 8.8888890
1.00 40 6.327777798 1.2124577625 .1917064048 5.940014993 6.715540602 3.0000000 8.4444450
Total 70 6.458730166 1.2507891790 .1494979011 6.160490013 6.756970318 3.0000000 8.8888890
Vision .00 30 6.599999977 1.7668726906 .3225853430 5.940238871 7.259761082 1.6666666 9.3333330
1.00 40 6.208333353 1.5792231843 .2496971098 5.703273276 6.713393429 3.6666667 9.0000000
Total 70 6.376190477 1.6612679990 .1985595040 5.980075105 6.772305849 1.6666666 9.3333330
Inventive .00 30 6.133 1.9429 .3547 5.408 6.859 2.0 10.0
1.00 40 5.775 1.9805 .3131 5.142 6.408 2.0 9.0
Total 70 5.929 1.9584 .2341 5.462 6.396 2.0 10.0
Abstract .00 30 6.567 2.2846 .4171 5.714 7.420 1.0 10.0
1.00 40 6.250 2.0724 .3277 5.587 6.913 2.0 10.0
Total 70 6.386 2.1555 .2576 5.872 6.900 1.0 10.0
Strategic .00 30 7.100 2.1066 .3846 6.313 7.887 2.0 10.0
1.00 40 6.600 2.0102 .3178 5.957 7.243 1.0 10.0
Total 70 6.814 2.0522 .2453 6.325 7.304 1.0 10.0
Judgment .00 30 6.399999963 1.3544307497 .2472840914 5.894247210 6.905752717 3.6666667 9.0000000
1.00 40 6.525000000 1.1618030321 .1836971887 6.153437364 6.896562636 3.3333333 8.3333330
Total 70 6.471428556 1.2400883527 .1482189077 6.175739925 6.767117186 3.3333333 9.0000000
Insightful .00 30 6.767 1.8696 .3413 6.069 7.465 3.0 10.0
1.00 40 6.475 1.7685 .2796 5.909 7.041 3.0 10.0
Total 70 6.600 1.8050 .2157 6.170 7.030 3.0 10.0

141
Practically minded .00 30 5.933 2.1324 .3893 5.137 6.730 2.0 10.0
1.00 40 6.300 1.5722 .2486 5.797 6.803 3.0 9.0
Total 70 6.143 1.8280 .2185 5.707 6.579 2.0 10.0
Learning oriented .00 30 6.500 2.1132 .3858 5.711 7.289 2.0 10.0
1.00 40 6.800 1.8701 .2957 6.202 7.398 1.0 10.0
Total 70 6.671 1.9688 .2353 6.202 7.141 1.0 10.0
Evaluation .00 30 6.899999983 1.5416316868 .2814621501 6.324345251 7.475654716 3.3333333 9.3333330
1.00 40 6.249999957 1.6412593520 .2595058892 5.725099752 6.774900163 1.6666666 9.6666670
Total 70 6.528571397 1.6206128531 .1937002847 6.142149902 6.914992892 1.6666666 9.6666670
Analytical .00 30 7.167 1.6626 .3036 6.546 7.788 3.0 10.0
1.00 40 6.300 2.0026 .3166 5.660 6.940 1.0 10.0
Total 70 6.671 1.9013 .2273 6.218 7.125 1.0 10.0
Factual .00 30 6.767 2.1445 .3915 5.966 7.567 3.0 10.0
1.00 40 6.775 1.7170 .2715 6.226 7.324 2.0 10.0
Total 70 6.771 1.8971 .2268 6.319 7.224 2.0 10.0
Rational .00 30 6.767 1.6543 .3020 6.149 7.384 4.0 9.0
1.00 40 5.675 2.0803 .3289 5.010 6.340 2.0 10.0
Total 70 6.143 1.9729 .2358 5.672 6.613 2.0 10.0
Influence .00 30 5.462962917 .9064750915 .1654989518 5.124479555 5.801446279 3.2222223 7.6666665
1.00 40 5.525000018 .9809800434 .1551065638 5.211267379 5.838732656 3.1111112 7.5555553
Total 70 5.498412689 .9435190348 .1127720944 5.273438516 5.723386861 3.1111112 7.6666665
Leadership .00 30 6.055555500 1.4676154540 .2679486966 5.507538883 6.603572117 3.3333333 9.3333330
1.00 40 6.124999998 1.3219330806 .2090159725 5.702225288 6.547774707 3.0000000 8.3333330
Total 70 6.095238070 1.3762920480 .1644983631 5.767072815 6.423403325 3.0000000 9.3333330
Purposeful .00 30 5.833 2.2756 .4155 4.984 6.683 1.0 10.0
1.00 40 5.650 1.9813 .3133 5.016 6.284 1.0 9.0
Total 70 5.729 2.0985 .2508 5.228 6.229 1.0 10.0
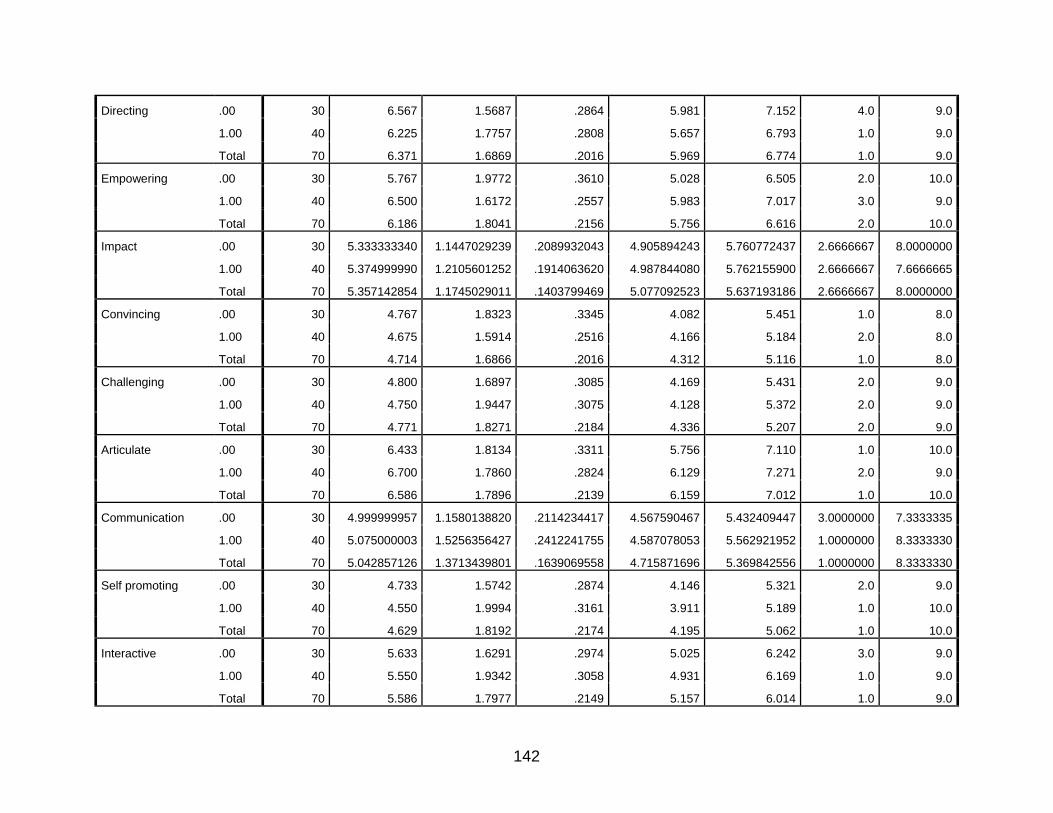
142
Directing .00 30 6.567 1.5687 .2864 5.981 7.152 4.0 9.0
1.00 40 6.225 1.7757 .2808 5.657 6.793 1.0 9.0
Total 70 6.371 1.6869 .2016 5.969 6.774 1.0 9.0
Empowering .00 30 5.767 1.9772 .3610 5.028 6.505 2.0 10.0
1.00 40 6.500 1.6172 .2557 5.983 7.017 3.0 9.0
Total 70 6.186 1.8041 .2156 5.756 6.616 2.0 10.0
Impact .00 30 5.333333340 1.1447029239 .2089932043 4.905894243 5.760772437 2.6666667 8.0000000
1.00 40 5.374999990 1.2105601252 .1914063620 4.987844080 5.762155900 2.6666667 7.6666665
Total 70 5.357142854 1.1745029011 .1403799469 5.077092523 5.637193186 2.6666667 8.0000000
Convincing .00 30 4.767 1.8323 .3345 4.082 5.451 1.0 8.0
1.00 40 4.675 1.5914 .2516 4.166 5.184 2.0 8.0
Total 70 4.714 1.6866 .2016 4.312 5.116 1.0 8.0
Challenging .00 30 4.800 1.6897 .3085 4.169 5.431 2.0 9.0
1.00 40 4.750 1.9447 .3075 4.128 5.372 2.0 9.0
Total 70 4.771 1.8271 .2184 4.336 5.207 2.0 9.0
Articulate .00 30 6.433 1.8134 .3311 5.756 7.110 1.0 10.0
1.00 40 6.700 1.7860 .2824 6.129 7.271 2.0 9.0
Total 70 6.586 1.7896 .2139 6.159 7.012 1.0 10.0
Communication .00 30 4.999999957 1.1580138820 .2114234417 4.567590467 5.432409447 3.0000000 7.3333335
1.00 40 5.075000003 1.5256356427 .2412241755 4.587078053 5.562921952 1.0000000 8.3333330
Total 70 5.042857126 1.3713439801 .1639069558 4.715871696 5.369842556 1.0000000 8.3333330
Self promoting .00 30 4.733 1.5742 .2874 4.146 5.321 2.0 9.0
1.00 40 4.550 1.9994 .3161 3.911 5.189 1.0 10.0
Total 70 4.629 1.8192 .2174 4.195 5.062 1.0 10.0
Interactive .00 30 5.633 1.6291 .2974 5.025 6.242 3.0 9.0
1.00 40 5.550 1.9342 .3058 4.931 6.169 1.0 9.0
Total 70 5.586 1.7977 .2149 5.157 6.014 1.0 9.0

143
Engaging .00 30 4.633 1.8096 .3304 3.958 5.309 1.0 8.0
1.00 40 5.125 1.7274 .2731 4.573 5.677 1.0 9.0
Total 70 4.914 1.7672 .2112 4.493 5.336 1.0 9.0
Adaptability .00 30 5.937037033 1.0380923825 .1895288715 5.549406967 6.324667099 3.4444444 7.6666665
1.00 40 5.699999980 1.1250408953 .1778845845 5.340194446 6.059805514 2.3333333 7.2222223
Total 70 5.801587289 1.0873288632 .1299606565 5.542322873 6.060851704 2.3333333 7.6666665
Support .00 30 5.811111080 1.8459509606 .3370229937 5.121821663 6.500400497 2.0000000 9.0000000
1.00 40 5.941666645 1.5614433250 .2468858672 5.442292843 6.441040447 2.0000000 8.3333330
Total 70 5.885714260 1.6776312423 .2005152857 5.485697210 6.285731310 2.0000000 9.0000000
Involving .00 30 6.200 2.3547 .4299 5.321 7.079 2.0 10.0
1.00 40 5.875 2.2892 .3620 5.143 6.607 1.0 10.0
Total 70 6.014 2.3062 .2756 5.464 6.564 1.0 10.0
Attentive .00 30 4.767 2.0957 .3826 3.984 5.549 1.0 10.0
1.00 40 5.700 2.0406 .3226 5.047 6.353 1.0 9.0
Total 70 5.300 2.1014 .2512 4.799 5.801 1.0 10.0
Accepting .00 30 6.467 1.8520 .3381 5.775 7.158 3.0 9.0
1.00 40 6.250 1.5973 .2526 5.739 6.761 3.0 9.0
Total 70 6.343 1.7015 .2034 5.937 6.749 3.0 9.0
Resilience .00 30 6.022222250 .9302631324 .1698420340 5.674856288 6.369588212 4.3333335 7.6666665
1.00 40 5.599999983 1.1277388205 .1783111639 5.239331610 5.960668355 2.3333333 7.6666665
Total 70 5.780952383 1.0615300669 .1268771106 5.527839473 6.034065293 2.3333333 7.6666665
Resolving .00 30 5.633 1.8473 .3373 4.944 6.323 1.0 10.0
1.00 40 5.200 2.0026 .3166 4.560 5.840 1.0 10.0
Total 70 5.386 1.9359 .2314 4.924 5.847 1.0 10.0
Self-assured .00 30 6.367 1.6914 .3088 5.735 6.998 3.0 9.0
1.00 40 5.925 1.7887 .2828 5.353 6.497 2.0 10.0
Total 70 6.114 1.7491 .2091 5.697 6.531 2.0 10.0

144
Composed .00 30 6.067 1.4368 .2623 5.530 6.603 4.0 9.0
1.00 40 5.675 1.7005 .2689 5.131 6.219 1.0 8.0
Total 70 5.843 1.5938 .1905 5.463 6.223 1.0 9.0
Flexibility .00 30 5.977777763 1.3531099741 .2470429519 5.472518195 6.483037331 2.6666667 8.3333330
1.00 40 5.558333323 1.4250256166 .2253163336 5.102588020 6.014078625 1.3333334 7.6666665
Total 70 5.738095226 1.4003597830 .1673750076 5.404191222 6.071999230 1.3333334 8.3333330
Receptive .00 30 5.733 1.9989 .3649 4.987 6.480 1.0 10.0
1.00 40 5.150 1.9289 .3050 4.533 5.767 1.0 9.0
Total 70 5.400 1.9664 .2350 4.931 5.869 1.0 10.0
Positive .00 30 5.633 1.7117 .3125 4.994 6.272 2.0 9.0
1.00 40 5.675 1.8030 .2851 5.098 6.252 1.0 9.0
Total 70 5.657 1.7519 .2094 5.239 6.075 1.0 9.0
Change Oriented .00 30 6.567 1.9772 .3610 5.828 7.305 1.0 10.0
1.00 40 5.850 2.0575 .3253 5.192 6.508 1.0 10.0
Total 70 6.157 2.0404 .2439 5.671 6.644 1.0 10.0
Delivery .00 30 5.644444450 1.1347673283 .2071792211 5.220715366 6.068173534 3.4444444 7.7777777
1.00 40 6.024999998 .8312842696 .1314375838 5.759142390 6.290857605 4.1111110 7.5555553
Total 70 5.861904763 .9837534567 .1175810276 5.627337031 6.096472495 3.4444444 7.7777777
Structure .00 30 5.766666653 1.4833688720 .2708248641 5.212767613 6.320565693 2.6666667 8.6666670
1.00 40 6.608333325 1.0429180636 .1648998247 6.274791947 6.941874703 4.3333335 8.6666670
Total 70 6.247619037 1.3097992228 .1565509504 5.935308437 6.559929638 2.6666667 8.6666670
Organized .00 30 5.633 2.1251 .3880 4.840 6.427 1.0 9.0
1.00 40 6.500 1.5689 .2481 5.998 7.002 3.0 10.0
Total 70 6.129 1.8644 .2228 5.684 6.573 1.0 10.0
Principled .00 30 6.233 1.6543 .3020 5.616 6.851 3.0 9.0
1.00 40 6.800 1.5055 .2380 6.319 7.281 3.0 9.0
Total 70 6.557 1.5847 .1894 6.179 6.935 3.0 9.0

145
Activity Oriented .00 30 5.433 2.0625 .3766 4.663 6.203 1.0 9.0
1.00 40 6.525 1.3006 .2056 6.109 6.941 2.0 9.0
Total 70 6.057 1.7436 .2084 5.641 6.473 1.0 9.0
Drive .00 30 5.888888880 1.4915684040 .2723218870 5.331928085 6.445849675 3.6666667 9.0000000
1.00 40 5.591666673 1.3618478473 .2153270512 5.156126601 6.027206744 2.6666667 8.6666670
Total 70 5.719047619 1.4160748131 .1692533130 5.381396498 6.056698739 2.6666667 9.0000000
Dynamic .00 30 6.067 2.1485 .3923 5.264 6.869 2.0 10.0
1.00 40 6.200 1.8701 .2957 5.602 6.798 3.0 10.0
Total 70 6.143 1.9802 .2367 5.671 6.615 2.0 10.0
Striving .00 30 6.600 1.8118 .3308 5.923 7.277 3.0 9.0
1.00 40 6.375 1.5473 .2447 5.880 6.870 3.0 9.0
Total 70 6.471 1.6570 .1980 6.076 6.867 3.0 9.0
Enterprising .00 30 5.000 1.6815 .3070 4.372 5.628 2.0 9.0
1.00 40 4.200 1.6672 .2636 3.667 4.733 1.0 8.0
Total 70 4.543 1.7083 .2042 4.136 4.950 1.0 9.0
Implementation .00 30 5.277777813 1.6794529194 .3066247494 4.650659787 5.904895840 2.3333333 8.6666670
1.00 40 5.874999990 1.3685259170 .2163829467 5.437324168 6.312675812 3.3333333 8.3333330
Total 70 5.619047629 1.5272993236 .1825471847 5.254875960 5.983219298 2.3333333 8.6666670
Meticulous .00 30 5.233 1.8696 .3413 4.535 5.931 2.0 9.0
1.00 40 5.850 1.6878 .2669 5.310 6.390 2.0 9.0
Total 70 5.586 1.7815 .2129 5.161 6.010 2.0 9.0
Reliable .00 30 5.200 2.4691 .4508 4.278 6.122 1.0 9.0
1.00 40 5.550 2.0248 .3202 4.902 6.198 2.0 9.0
Total 70 5.400 2.2159 .2648 4.872 5.928 1.0 9.0
Compliant .00 30 5.400 1.6733 .3055 4.775 6.025 2.0 9.0
1.00 40 6.225 1.7612 .2785 5.662 6.788 3.0 9.0
Total 70 5.871 1.7604 .2104 5.452 6.291 2.0 9.0

146
ANOVA
Sum of Squares df Mean Square F Sig.
Thought Between Groups 1.601 1 1.601 1.023 .315
Within Groups 106.348 68 1.564 Total 107.949 69
Vision Between Groups 2.630 1 2.630 .952 .333
Within Groups 187.797 68 2.762 Total 190.427 69
Inventive Between Groups 2.201 1 2.201 .570 .453
Within Groups 262.442 68 3.859 Total 264.643 69
Abstract Between Groups 1.719 1 1.719 .367 .547
Within Groups 318.867 68 4.689 Total 320.586 69
Strategic Between Groups 4.286 1 4.286 1.018 .317
Within Groups 286.300 68 4.210 Total 290.586 69
Judgment Between Groups .268 1 .268 .172 .680
Within Groups 105.842 68 1.556 Total 106.110 69
Insightful Between Groups 1.458 1 1.458 .444 .507
Within Groups 223.342 68 3.284 Total 224.800 69
Practically minded Between Groups 2.305 1 2.305 .687 .410

147
Within Groups 228.267 68 3.357 Total 230.571 69
Learning oriented Between Groups 1.543 1 1.543 .395 .532
Within Groups 265.900 68 3.910 Total 267.443 69
Evaluation Between Groups 7.243 1 7.243 2.831 .097
Within Groups 173.978 68 2.558 Total 181.221 69
Analytical Between Groups 12.876 1 12.876 3.701 .059
Within Groups 236.567 68 3.479 Total 249.443 69
Factual Between Groups .001 1 .001 .000 .986
Within Groups 248.342 68 3.652 Total 248.343 69
Rational Between Groups 20.430 1 20.430 5.599 .021
Within Groups 248.142 68 3.649 Total 268.571 69
Influence Between Groups .066 1 .066 .073 .788
Within Groups 61.360 68 .902 Total 61.426 69
Leadership Between Groups .083 1 .083 .043 .836
Within Groups 130.616 68 1.921 Total 130.698 69
Purposeful Between Groups .576 1 .576 .129 .720
Within Groups 303.267 68 4.460 Total 303.843 69
Directing Between Groups 2.001 1 2.001 .700 .406

148
Within Groups 194.342 68 2.858 Total 196.343 69
Empowering Between Groups 9.219 1 9.219 2.911 .093
Within Groups 215.367 68 3.167 Total 224.586 69
Impact Between Groups .030 1 .030 .021 .884
Within Groups 95.153 68 1.399 Total 95.183 69
Convincing Between Groups .144 1 .144 .050 .824
Within Groups 196.142 68 2.884 Total 196.286 69
Challenging Between Groups .043 1 .043 .013 .911
Within Groups 230.300 68 3.387 Total 230.343 69
Articulate Between Groups 1.219 1 1.219 .377 .541
Within Groups 219.767 68 3.232 Total 220.986 69
Communication Between Groups .096 1 .096 .051 .823
Within Groups 129.664 68 1.907 Total 129.760 69
Self promoting Between Groups .576 1 .576 .172 .680
Within Groups 227.767 68 3.350 Total 228.343 69
Interactive Between Groups .119 1 .119 .036 .849
Within Groups 222.867 68 3.277 Total 222.986 69
Engaging Between Groups 4.144 1 4.144 1.333 .252

149
Within Groups 211.342 68 3.108 Total 215.486 69
Adaptability Between Groups .963 1 .963 .812 .371
Within Groups 80.614 68 1.186 Total 81.578 69
Support Between Groups .292 1 .292 .102 .750
Within Groups 193.905 68 2.852 Total 194.197 69
Involving Between Groups 1.811 1 1.811 .337 .563
Within Groups 365.175 68 5.370 Total 366.986 69
Attentive Between Groups 14.933 1 14.933 3.504 .066
Within Groups 289.767 68 4.261 Total 304.700 69
Accepting Between Groups .805 1 .805 .275 .602
Within Groups 198.967 68 2.926 Total 199.771 69
Resilience Between Groups 3.056 1 3.056 2.782 .100
Within Groups 74.696 68 1.098 Total 77.752 69
Resolving Between Groups 3.219 1 3.219 .857 .358
Within Groups 255.367 68 3.755 Total 258.586 69
Self-assured Between Groups 3.344 1 3.344 1.095 .299
Within Groups 207.742 68 3.055 Total 211.086 69
Composed Between Groups 2.630 1 2.630 1.036 .312

150
Within Groups 172.642 68 2.539 Total 175.271 69
Flexibility Between Groups 3.016 1 3.016 1.550 .217
Within Groups 132.294 68 1.945 Total 135.310 69
Receptive Between Groups 5.833 1 5.833 1.520 .222
Within Groups 260.967 68 3.838 Total 266.800 69
Positive Between Groups .030 1 .030 .010 .922
Within Groups 211.742 68 3.114 Total 211.771 69
Change Oriented Between Groups 8.805 1 8.805 2.150 .147
Within Groups 278.467 68 4.095 Total 287.271 69
Delivery Between Groups 2.483 1 2.483 2.626 .110
Within Groups 64.294 68 .945 Total 66.776 69
Structure Between Groups 12.144 1 12.144 7.774 .007
Within Groups 106.231 68 1.562 Total 118.375 69
Organized Between Groups 12.876 1 12.876 3.858 .054
Within Groups 226.967 68 3.338 Total 239.843 69
Principled Between Groups 5.505 1 5.505 2.231 .140
Within Groups 167.767 68 2.467 Total 173.271 69
Activity Oriented Between Groups 20.430 1 20.430 7.337 .009

151
Within Groups 189.342 68 2.784 Total 209.771 69
Drive Between Groups 1.514 1 1.514 .753 .389
Within Groups 136.849 68 2.012 Total 138.363 69
Dynamic Between Groups .305 1 .305 .077 .783
Within Groups 270.267 68 3.975 Total 270.571 69
Striving Between Groups .868 1 .868 .313 .578
Within Groups 188.575 68 2.773 Total 189.443 69
Enterprising Between Groups 10.971 1 10.971 3.918 .052
Within Groups 190.400 68 2.800 Total 201.371 69
Implementation Between Groups 6.114 1 6.114 2.685 .106
Within Groups 154.838 68 2.277 Total 160.952 69
Meticulous Between Groups 6.519 1 6.519 2.086 .153
Within Groups 212.467 68 3.125 Total 218.986 69
Reliable Between Groups 2.100 1 2.100 .424 .517
Within Groups 336.700 68 4.951 Total 338.800 69
Compliant Between Groups 11.668 1 11.668 3.924 .052
Within Groups 202.175 68 2.973 Total 213.843 69
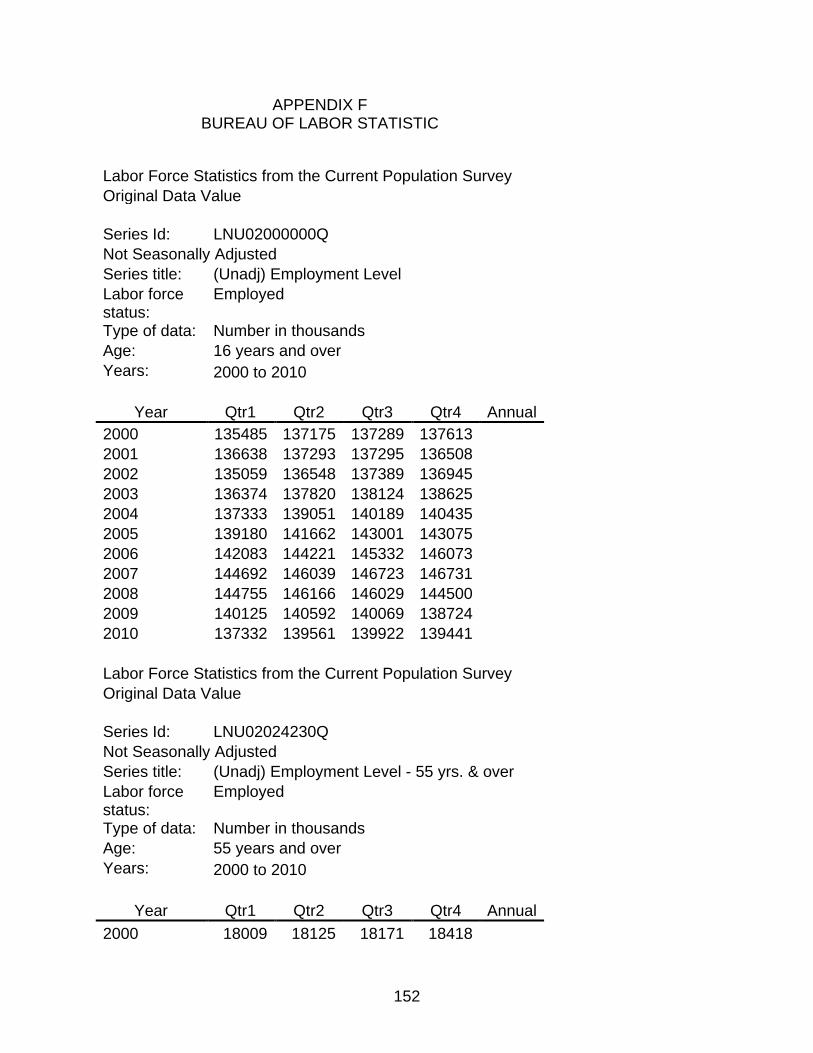
152
APPENDIX F BUREAU OF LABOR STATISTIC
Labor Force Statistics from the Current Population Survey Original Data Value
Series Id: LNU02000000Q Not Seasonally Adjusted Series title: (Unadj) Employment Level Labor force status:
Employed
Type of data: Number in thousands Age: 16 years and over Years: 2000 to 2010
Year Qtr1 Qtr2 Qtr3 Qtr4 Annual 2000 135485 137175 137289 137613
2001 136638 137293 137295 136508 2002 135059 136548 137389 136945 2003 136374 137820 138124 138625 2004 137333 139051 140189 140435 2005 139180 141662 143001 143075 2006 142083 144221 145332 146073 2007 144692 146039 146723 146731 2008 144755 146166 146029 144500 2009 140125 140592 140069 138724 2010 137332 139561 139922 139441
Labor Force Statistics from the Current Population Survey Original Data Value
Series Id: LNU02024230Q Not Seasonally Adjusted Series title: (Unadj) Employment Level - 55 yrs. & over Labor force status:
Employed
Type of data: Number in thousands Age: 55 years and over Years: 2000 to 2010
Year Qtr1 Qtr2 Qtr3 Qtr4 Annual 2000 18009 18125 18171 18418

153
2001 18532 18799 18941 19319 2002 19415 19825 20131 20548 2003 20896 21041 21096 21794 2004 21867 21878 22159 22696 2005 22768 23380 23548 24077 2006 24149 24605 24721 25380 2007 25178 25572 25832 26306 2008 26489 26664 26764 27248 2009 27006 27115 27030 27378 2010 27505 27975 27975 28163
Labor Force Statistics from the Current Population Survey Original Data Value
Series Id: LNU02000093Q Not Seasonally Adjusted Series title: (Unadj) Employment Level - 45-54 yrs. Labor force status:
Employed
Type of data: Number in thousands Age: 45 to 54 years Years: 2000 to 2010
Year Qtr1 Qtr2 Qtr3 Qtr4 Annual 2000 30055 30231 30183 30770
2001 30880 31043 31052 31168 2002 31128 31129 31302 31567 2003 31568 31893 31925 32270 2004 32223 32353 32545 32756 2005 32818 33160 33330 33521 2006 33686 33942 34053 34527 2007 34370 34521 34520 34839 2008 34549 34563 34499 34508 2009 33728 33696 33408 33621 2010 33158 33281 33080 33245

154
APPENDIX G LEADERSHIP ATTRIBUTES
Saville WAVE Dimension
WAVE description OPQ OPQ high level attribute
Inventive (Thought/Vision)
Creative, original, radical Artistic Innovative
Shows artistic appreciation Enjoys creating novel solutions
Abstract (Thought/Vision)
Conceptual, theoretical, learning by thinking
Conceptual Enjoys working with theory
Strategic (Thought/Vision)
Developing strategy, visionary, forward thinking
Forward Planning Enjoys forming short & long term plans
Insightful (Thought/Judgment)
Discerning, seeking improvement, intuitive
Decisive Likes to make quick decisions
Practically minded (Thought/Judgment)
Practical, learning by doing, common sense focused
Practical Enjoys repairing things
Learning oriented (Thought/Judgment)
Analytical (Thought/Evaluation)
Problem solving, analyzing information, probing
Critical Critically evaluates ideas
Factual (Thought/Evaluation)
Written communication, logical, fact finding
Detail Conscious Is concerned about details
Rational (Thought/Evaluation)
Number fluency, technology aware, objective
Data Rational Judges on basis of data/logic
Purposeful (Influence/Leadership
Decisive, making decision, definite
Decisive Likes to make quick decisions

155
Directing (Influence/Leadership)
Leadership oriented, control seeking, coordinating people
Controlling Prefers to direct or take control
Empowering (Influence/Leadership)
Motivating others, inspiring, encouraging
Persuasive Can sell and be persuasive
Convincing (Influence/Impact)
Persuasive, negotiative, asserting views
Persuasive Independent
Can sell and be persuasive Argues strongly for opinions
Challenging (Influence/Impact)
Challenging ideas, prepared to disagree, argumentative
Independent Tough Minded
Argues strongly for opinions Does not suffer hurt feelings
Articulate (Influence/Impact)
Giving presentations, eloquent, socially confident
Socially Confident Is confident with people
Self promoting
Interactive (Influence/Communication)
Networking, talkative, lively Outgoing Socially Confident
Is talkative and outgoing Is confident with people
Engaging (Influence/Communication)
Establishing rapport, friendship seeking, initial impression
Socially Confident Is confident with people
Involving (Adaptability/Support)
Team oriented, democratic, decision sharing
Affiliative Democratic
Likes to work with groups/teams Consults others before deciding
Attentive (Adaptability/Support)
Empathetic, listening, psychologically minded
Caring
Is empathetic and tolerant Likes analyzing others’

156
Behavioral behaviors Accepting (Adaptability/Support)
Trusting, tolerant, considerate
Caring Is empathetic and tolerant
Resolving Self-assured (Adaptability/Resilience)
Self confident, self valuing, self directing
Optimistic Keeps optimistic outlook
Composed (Adaptability/Resilience)
Calm, poised, copes with pressure
Relaxed Can switch off work pressures
Receptive (Adaptability/Flexibility)
Receptive to feedback, open to criticism, feedback seeking
Tough Minded Does not suffer hurt feelings
Positive (Adaptability/Flexibility)
Optimistic, cheerful, buoyant Optimistic Keeps optimistic outlook
Change oriented (Adaptability/Flexibility)
Accepting challenges, accepting change, tolerant of uncertainty
Change Oriented Seeks change/variety in work
Organized (Delivery/Structure)
Self organized, planning, prioritizing
Forward Planning Enjoys forming short & long term plans
Principled Activity oriented (Delivery/Structure)
Quick working, busy, multi-tasking
Active Enjoys active jobs/activities
Dynamic (Delivery/Drive)
Energetic, initiating, action oriented
Active Enjoys active jobs/activities
Striving (Delivery/Drive)
Ambitious, results driven, persevering
Achieving Is ambitious for success
Enterprising (Delivery/Drive)
Competitive, entrepreneurial, selling
Competitive Likes to compete and win
Meticulous (Delivery/Implementati
Quality oriented, thorough, detailed
Detail Conscious Is concerned about details

157
on) Reliable (Delivery/Implementation)
Meeting deadlines, finishing tasks, punctual
Conscientious See routine tasks through
Compliant (Delivery/Implementation)
Rule bound, following procedures, risk averse
Traditional Follow conventional approach

158
LIST OF REFERENCES
American Association of Collegiate Registrar and Admission Officers (AACRAO) Online dues schedule. (2010). AACRAO. http://www.aacrao.org/membership/join/webins.pdf
American Council on Education Study. (2007). The American College President. ACE
Publications. http://store.acenet.edu/showItem.aspx?product=311940&session=CAE29684BB84406EA7E4AC0630CF330E
Amey, M. J. & Van Der Linden, K. E. (2002). Career paths for community college
leaders. AACC Research Briefs, No. 2. Retrieved November 18, 2009 from ERIC database #465400.
Amey, M. J., Van Der Linden, K. E., & Brown, D. F. (2002). Perspectives on community
college leadership: Twenty years in the making. Community College Journal of Research and Practice, 26, 573-589. Retrieved November 18, 2009 from Academic Search Premier Database.
Arnone, W. (2006). Are employers prepared for the aging U.S. workforce? Benefits
Quarterly. Fourth quarter 2006, pp 7-12. Balkis, M., & Isiker, G. B. (2005). The relationship between thinking styles and
personality types. Social Behavior and Personality, 33, 283-294. Barden, D. (2006). The internal heir apparent. Chronicle of Higher Education. Vol 52,
Issue 28, pp2-3. Retrieved November 29, 2006 from Academic Search Premier Database.
Basham, M. (2007). A Cognitive Application of Personality Testing: Measuring
Entrepreneurialism in America’s Community Colleges (Doctoral dissertation, University of Florida, 2007). UF Online Dissertations.
Bennis, Warren (1989). On becoming a leader. Reading, MA: Addison-Wesley. Benisom, E., & Neumann, A. (1993). Redesigning collegiate leadership: Teams and
teamwork in higher education. Baltimore: Johns Hopkins University Press. Berry, J. (2008). Baseline Development to Streamline Executive Selection (Masters
thesis, University of Florida, 2008). UF Online Thesis. BNA (2010). HR faces growing leadership development deficits, study says. HR
Focus. 87: no 11. ISSN: 1059-6038. Retrieved February 17, 2011 from Wilson Web.

159
Borreson, J. and Salaway, G. (2007). The ECAR study of undergraduate students and information technology, 2007. EDUCAUSE. www.educause.edu/ecar/
Bos, J. (2007). Top trends in training and leadership development. Workforce Management. www.workforce.com. Pp 35-38. Retrieved March 10, 2008. Boyd, D. M. and Ellison, N. B. (2008), Social Network Sites: Definition, History, and
Scholarship. Journal of Computer-Mediated Communication, 13: 210–230. Braller, D. (2010). Perspective: presidential leadership and health information
technology. Retrieved March 13, 2011: http://web.ebscohost.com/ehost/pdfviewer/pdfviewer?hid=8&sid=f92d5121-dc72-4be1-8214-cfd844cd8687%40sessionmgr14&vid=8
Bruck, L. (2010). The workforce talent drain. EHS Today: Distributor Focus. A1-A4.
ISSN: 1945-9599. Buchanan, L. (2010). Meet the millennials. INC. pp 166. ISSN: 0162-8968. California State Polytechnical University. (2010). http://www.csupomona.edu/ Campbell, D. F. (2006). The new leadership gap: Shortages in administrative positions.
Community College Journal, 76, 10-14. Retrieved October 15, 2008 from Academic Search Premier Database.
Campbell, D. F. (2009). Your next leader: piecing together the executive search
process. Community College Journal, 34-35. Campbell, D. F. & Associates (2002). The Leadership Gap: Model Strategies For
Leadership Development. Washington: Community College Press. Campbell, D. F. & Kachik, C. (2002). “Leadership profile research and consortium.” In
Campbell, D. F. & Associates, The Leadership Gap: Model Strategies For Leadership Development. Washington: Community College Press.
Campbell, D. F. & Leverty, L. H. (1997). Developing & selecting leaders for the 21st
century. Community College Journal, Vol 67, no. 4. Campbell, D. F.; Syed, S., & Morris, P. (2010). “Minding the gap: filling a void in
community college leadership development.” In New Directions for Community Colleges. Wiley InterScience. www.interscience.wiley.com.
Carroll, C. & Phillips, L. (2004). Succession Planning: Daytona Beach Community
College Prepares Tomorrow’s Leaders. The Bottomline – Newsletter of Community College Business Officers. Summer 2004.

160
Clare, C. (2009). Generational differences turning challenges into opportunities. J Prop Manage. 74 no 5: 41-43. www.irem.org/jpm. Retrieved February 17, 2011 from Wilson Web.
Closeup Media (2011). UBM Studios unicruit names Intel as platinum sponsor for
veterans. http://financial.tmcnet.com//news/2011/02/16/5315945.htm Crosson, P., Douglas, K., O’Meara, K. and Sperlin, Charmian (2005). A Community
College Leadership Academy: Developing Leaders for Massachuttes. Community College Review, Vol 33 Issue 2, 45-63. Retrieved March 29, 2009 from Academic Search Premier.
Davenport, T.; Harris, J. & Shapiro, J. (2010). Competing on talent analytics. Harvard
Business Review. 52-59. Retrieved on February 17, 2011 from Academic Search Premier Database.
Davis, G. P. (2011) Preparing leaders for the future: a toolkit for developing
administrators in higher education. www.acenet.edu. Dembicki, M. (2006). Hot issues: report highlights leadership program practices.
AACC website. http://www.aacc.nche.edu. Retrieved October 6, 2006. Dolence, M. (1993) Strategic enrollment management: a primer for campus
administrators. AACRAO Guide Publication. Fallon, T. (2009). Retain and motivate the next generation: 7 ways to get the most out
of your millennial workers. Supervision. 70 no 5: 4-7. Retrieved February 20, 2011 from Wilson Web.
FuturesLeaders-ATG Work Profiling Session (2006). Dean/Director Enrollment and
Registrar. Unpublished document. GCN (2011). Technology vs. experience: the changing workforce.
http://gcn.com/articles/2011/01/28/Commentary-next-gen-mobile-workers.aspx?p=1
Gardner, H. & Larkin, E. (1996). Leading minds: An anatomy of leadership. New York:
Harper Collins. Germain, M. L. (2008). Traits and skills theory as the nexus between leadership and
expertise: reality or fallacy? St. Thomas University Dissertation retrieved January 15, 2011.
Gibson, C. B. (1995). An investigation of gender differences in leadership across four
countries. Journal of International Business Studies. 26, 255-275.

161
Gordon, B. (2009). Congressional testimony: opening statement to the House Science and Technology Committee. Retrieved February 19, 2011 from MasterFIlE Premier, access number 32Y3403614931.
Hall, A. (2000). Taming the techno beast: technology is running wild, learn to manage
change, or you’ll get eaten alive. Business Week. 30-42. Hamilton, K. (2004) A pathway to the presidency. Black Issues in Higher Education.
21, 20, p38-41. Retrieved February 23, 2007 from Academic Search Premier.. Harrison, M., McKinnon, T, and Terry, P. (Oct 2006). Effective succession planning:
how to design and implement a successful succession plan. TD pp 22-23. Hartley, L. (2008). Succession planning through the ages. Workforce Management. 87
no 14. Retrieved February 20, 2011 from Wilson Web. Heidrick & Struggles (2010). New CEO and board research reveals serious gaps in
CEO succession planning. Boardmember.com http://www.boardmember.com/New-CEO-and-Board-Research-Reveals-Serious-Gaps-in-CEO-Succession-Planning.aspx Retrieved February 15, 2011.
Hershey, P. & Blanchard, K. (2007). Management of Organizational Behavior: Leading
Human Resources. Prentice Hall. Higher Education Publications (2010). Select administrators and characteristics.
http://www.hepinc.com/admin_charact_select.php Retrieved February 15, 2011. Jackson, D. (2010). 2010: The year of the iPad? Law Library Journal. Vol 102:3, pp
513-520. Jackson, H. G. (2010). HR, the boomer, exodus and preparing for what’s next. HR
Magazine. 55 no 10 p II-IV. ISSN: 1047-3149. Joslyn, H. (2009). A growing leadership gap. The Chronicle on Philanthropy. 21: no
13. Retrieved February 20, 2011 from Wilson Web. Kachik, C. J. (2003). The five-factor model and Holland’s theory: Community college
and corporate leaders (Doctoral dissertation, University of Florida, 2003). UF Online Dissertations.
Kleinglass, N. (2005). Who is driving the changing landscape in student affairs? New
Directions for Student Services, 112, 25-38. Retrieved March 29, 2009 from Academic Search Premier.
Krieger, L. (2008). WAVE© assessment interpretation. Training. Jacksonville, FL.

162
Leslie, J. (2009). The leadership gap. Center for Creative Leadership. http://www.ccl.org/leadership/pdf/research/leadershipGap.pdf
Lovell, C. & Kosten, L. (2000). Skills, knowledge, and personal traits necessary for
success as a student affairs administrator: A meta-analysis of thirty years of research. NAPSA Journal. Vol 37, No. 4, pp 553-572.
Magner, D. (2009). The leadership pipeline. The Chronicle of Higher Education. Mann, T. (2010). Attrition among chief academic officers threatens strategic plans. The
Chronicle of Higher Education. Retrieved February 20, 2011 from Wilson Web. McCauley, C. and Wakefield, M. (2006). Talent management in the 21st century. The
Journal for Quality and Participation. Winter 2006, pp 4-7. McConahay, M., West, A., Hanson, K. and Woodbeck, D. (2009). The electronic
FERPA: access in the digital age. College & University. Vol 84, No. 3. Middlehurst, R. (2008). Not enough science or not enough learning? Exploring the
gaps between leadership and theory. Higher Education Quarterly. Vol 62, no 4, pp322-339. Retrieved February 20, 2011 from Academic Search Premier.
Minter, S. (2010). Identifying your future leaders. IW. 24-26. www.industryweek.com.
ISSN: 0039-0895. Mironack, M. (2003). Leadership Behaviors Among College Union Directors at
Doctoral-research Universities (Doctoral dissertation, University of Florida, 2003). UF Online Dissertations.
Morley, J. & Eadie, D. (2001). Moving from manager to leader. NACUBO Business
Officer, 34(12), 22-25. National Center for Educational Statistics (2010). http://nces.ed.gov/globallocator/ Nickson, C. (2009). The history of social networking. Digital Trends. Retrieved March
15, 2010 from http://www.digitaltrends.com/features/the-history-of-social-networking/
O’Daniels, T. (2009). Gender in Community College Administration (Doctoral
dissertation, University of Florida, 2009). UF Online Dissertations. Patton, M. (2004). Initiative seeks to inform and prepare new leaders. Community
College Times,Washington: AACC. http://www.aacc.nche.edu/Content/ContentGroups/CC_Times/January_20041/Initiative_Seeks_To_Inform_and_Prepare_New_Leaders.htm, firstaccessed February 2010.

163
Pelham, D., Roof, J., & Presswood, K. (2006). The changing role of the community
college registrar would your president rehire you? AACRAO Annual Conference Presentation.
Powell, G.N. (1988). Women and men in management.
Newbury Park, CA: Sage.
Rhode Island College. (2010). http://www.ric.edu/ Ricadela, A. & Brady, D.(2010) HP said to be near decision on Mark Hurd’s successor.
Bloomberg Business Week. http://www.businessweek.com/news/2010-09-17/hp-said-to-be-near-decision-on-mark-hurd-s-successor.html Retrieved on February 15, 2011.
Rothwell, W. (2010). The Future of Succession Planning. T+D – American Society for
Training and Development. P 51-54. Sacks, D. (2006). Scenes from the ;) culture clash. Fast Company, 102, 73-78. Saville (2006). Technical Document. Unpublished report. Saville, P. & Willson, E. (1991). The reliability and validity of normative and ipsative
approaches in the measurement of personality. Journal of Occupational Psychology, 64, 219-238. Retrieved May 22, 2006 from Academic Search Premier Database.
Seminole State College (2010). http://www.seminolestate.edu/ Shults, Christoper. (2001). The Critical Impact of Impending Retirements on
Community College Leadership. American Association of Community Colleges, Research Brief, No. 1. Leadership Series, 2001.
Simons, N. (2010). Leveraing generational work styles to meet business objectives.
Information Management. 28-33. Retrieved February 17, 2011 from Academic Search Premier Database.
Slippery Rock University. (2010). http://www.sru.edu/index/pages/home.aspx Smith, D. (2010). A leadership skills gap? T&D. 16-17. Spellings, M. (2006). Report commissioned by Secretary of Education. A test of
leadership: charting the future of U.S. higher education. http://www.ed.gov/about/bdscomm/list/hiedfuture/index.html. Retrieved March 5, 2007.

164
Spillett, R. (2006). It begins with leadership and discipline of the board. The Nonprofit’s Sector Leadership Deficit. Bridgespan Report. http://www.bridgespan.org/WorkArea/linkit.aspx?LinkIdentifier=id&ItemID=936
Stewart & Wright (1997) The registrar, a view of the profession. SACRAO Journal. SUNY Rockland Community College. (2010) Registrar job description.
http://www.sunyrockland.edu/Members/inewhem/job-description Tunks, L. (2007). Comparison of the Outcomes of Leadership Behaviors of community
Collge Administrators (Doctoral dissertation, University of Florida, 2007). UF Online Dissertations.
Tyler, K. (2007). The tethered generation. HR Magazine. 52, no 5: 41-46. USDOE (2010) FERPA: Family Educational Rights and Privacy Act.
http://www2.ed.gov/policy/gen/guid/fpco/ferpa/index.html Weinstein, M. (2010). Missing something? Training Magazine. 47 no 1. Retrieved
February 17, 2011 from Wilson Web. Yielder, J. & Codling, A. (2004). Management and leadership in the contemporary
university. Journal of Higher Education Policy and Management, 26(3), 315-328. Retrieved Oct 18, 2006 from Academic Search Premier Database.

165
BIOGRAPHICAL SKETCH
Kristy Robertson Presswood was born in Daytona Beach, Florida in 1971. The
sixth of seven children, she grew up in Daytona Beach, graduating from Mainland High
School in 1989. She is an alum of Daytona State College and earned a Bachelor of
Science degree in Business Administration and a Masters of Business Administration
from the University of Central Florida (UCF) in 1997 and 1999, respectively.
Kristy began working full-time at Daytona State College in 1992. During her
tenure at Daytona State, she graduated with her doctorate in Higher Education
Administration from the University of Florida in 2011. Kristy has worked in nearly every
area of the College giving her a better perspective of the ‘big picture’ and how the
departments relate. She feels communication is the key to ensuring successful
program implementation and continual growth.
Kristy is the Associate Vice President of the College of Education at Daytona State
College. She has been married to James Clayton Presswood nearly 15 years. They
have three children: Emily, age 12; Samantha, age 10; and Trevor, age 7.