Embed Size (px)
Citation preview

Lead Report 2017:
Broken Hill children less than 5 years old


2
This work is copyright. It may be reproduced in whole or part for study or training purposes subject to the inclusion of an acknowledgement of the source. It may not be reproduced for commercial usage or sale. Reproduction for purposes other than those indicated above requires written permission from the NSW Ministry of Health.
© NSW Ministry of Health 2018
Acknowledgements We would like to acknowledge Dr Margaret Lesjak, Dr Todd Green, Dr Hilal Varinli and Tricia Linehan (Western NSW Health Intelligence Unit) for the analysis of data and production of this report.
Contact For further information please contact: Western NSW Health Intelligence Unit Orange Health Service, Bloomfield Campus Locked Bag 6008 Orange NSW 2800 Phone: 02 6369 7958
Citation Lead Report 2017: Broken Hill children less than 5 years old, Western NSW Health Intelligence Unit August 2018

3
Table of Contents Executive Summary .................................................................................................................. 4
Introduction ............................................................................................................................. 5
Population Profile ..................................................................................................................... 7
Methods .................................................................................................................................. 8
Collection of Blood Samples .............................................................................................................. 8
Reporting of Blood Lead Levels ......................................................................................................... 8
Age-sex Standardisation of Results ................................................................................................... 8
Notifiable Blood Lead Levels.............................................................................................................. 8
Participation Rates ............................................................................................................................. 9
Results .................................................................................................................................... 9
Screening of Newborns ...................................................................................................................... 9
Screening of Children Aged 1 tounder 5 years .................................................................................. 10
Screening of Aboriginal Children Aged 1 to <5 years......................................................................... 18
Estimate of Participation Rate ......................................................................................................... 21
Ten year snapshot 2008-2017 .................................................................................................. 22
Conclusion ............................................................................................................................. 23
Appendix 1 ............................................................................................................................. 24
References ............................................................................................................................. 25

4
Executive Summary
The information contained in the 2017 Lead report provides an update on the ongoing public health issue of elevated blood lead levels in children under the age of 5 in Broken Hill.
All children under the age of 5 residing in Broken Hill have been offered blood lead testing since 1991. This testing is voluntary and offered through the Broken Hill Child and Family Health Service and Maari Ma Primary Health Care Service. In addition, screening of umbilical cord blood lead levels of newborns, born in Broken Hill to resident mothers, commenced in 1996.
In April 2016, the NSW Ministry of Health endorsed the revised National Health and Medical Research Council (NHMRC) guidelines for the notification of blood lead levels from 10 µg/dL to 5 µg/dL. This report uses the revised lead blood notification figure and therefore reports on the proportion of children with blood lead levels under 5 µg/dL.
In 2017 there was an increase in the total number of children screened (687 to 730). During this period there was a 6.8% increase in the number of Aboriginal children screened (207 to 221) and a 6.0% increase in the number of non-Aboriginal children screened (480 to 509). The 221 Aboriginal children screened in 2017, represents the highest number screened on record. Aboriginal children tested as a proportion of all children tested has more than doubled since 2010, from 14.6% of all children in 2010 to 30.3% in 2016 and 2017.
The geometric lead mean level (age-sex standardised) for all children (1 to <5 years) was 5.7 µg/dL in 2017, slightly less than 2016 (5.9 µg/dL). However, the mean result for Aboriginal children increased in this period from 7.6 in 2016 to 8.7 μg/dL in 2017, while blood lead levels in non-Aboriginal children decreased, from 5.2 in 2016 to 4.6 µg/dL in 2017. The gap between these results (4.1 μg/dL) remains similar to the 2015 gap, and almost twice as much as the gap of 2.4 in 2016 between Aboriginal and non-Aboriginal children.
The 2017 results show 58% of non-Aboriginal children in Broken Hill had a blood lead level below 5 µg/dL, compared to only 22% of Aboriginal children. The result for Aboriginal children remained the same as 2016 (22%), whilst the result for non-Aboriginal children improved in the same period, increasing from 50% to 58%. When combining the results for Aboriginal and non-Aboriginal children, there was a slight increase (42% to 46%) of all children with blood lead levels below 5 µg/dL between 2016 and 2017.
There remains ongoing work to reduce blood lead levels in Broken Hill. The proportion of Aboriginal children in all lead level categories ≥ 5 µg/dL are higher compared with non-Aboriginal children. Although there has been improvements in non-Aboriginal children results in 2017, of the 386 children at or above 5 µg/dL over half, 55% (213), are non-Aboriginal and 45% (173) Aboriginal. Furthermore, 54% of all children (1 to < 5 years) tested in Broken Hill have blood lead levels above the current NSW Health notifiable level (5.0 µg/dL). In addition a review of blood lead levels by age group found that even for 1 year olds, the mean blood lead level was above the notifiable 5 µg/dL.

5
Introduction
Broken Hill is a historical town founded in 1883 on mining of the ‘line of lode,’ the world’s largest and richest silver-lead-zinc mineral deposit. Since the Broken Hill Proprietary Company Limited was established in 1885, lead poisoning had been evident among early miners and their families. Despite this evidence, lead poisoning was seen mainly as an occupational rather than population health issue.
Since 1991, parents/carers in Broken Hill have been offered voluntary blood lead screening for children under the age of 5 years old. Le ad sc r e e n in g is e n c ou r age d t hr ou gh the combination of: a reminder letter; aligning lead testing with the immunisation schedule; and promotions and advertising in the local media. From 1996, newborn umbilical cord blood has been tested to determine the impact of lead transfer from the mother to the child.
According to the World Health Organisation, blood lead levels around 10.0 µg/dL are now known to cause damage to the developing brain and nervous system of children. In addition, the immune, reproductive and cardiovascular systems are also adversely affected1.
Ingestion of lead is the most common exposure pathway for children. The combination of a child’s innate curiosity and hand-to-mouth behaviour results in bringing lead-containing or lead-coated objects (eg contaminated soil or dust, peeling lead based paint) to their mouth. Exposure pathways also include from a mother to a foetus, inhalation of lead containing dust, and less commonly, absorbed through the skin. Compounding the issue in young children is that they absorb four to five times as much ingested lead compared to an adult from a given source. Undernourished children are also more susceptible to lead because their bodies absorb more lead if other nutrients, such as calcium, are lacking1.
The Broken Hill Community Lead Reference Group, founded in 2008, is a multi-agency group led by the Broken Hill City Council. It consists of community interest groups, mining companies and government agencies representing and advocating for the Broken Hill community regarding lead. The Broken Hill Lead Health Steering Committee, also founded in 2008, was constituted to focus on the health issues related to elevated blood lead levels in children. The Broken Hill Lead Health Steering Committee will be reconvened in late 2018 after a hiatus as a result of the Population Health Directorate restructure. Both groups have an interest in minimising the impact of lead exposure whilst maintaining a viable mining industry in Broken Hill.
Since 1993 blood lead notification levels have been 10 µg/dL, however, in May 2015, the NHMRC completed an evidence review and issued a statement for a revised blood lead notification level of 5 µg/dL2. The evidence review found an association between levels less than 10 µg/dL and health effects. The effects include: reduced Intelligence Quotient and academic achievement in children; behavioural problems in children; a delay in sexual maturation in adolescents and increased blood pressure in adults2. As of April 2016, NSW Health adjusted the notifiable blood level to 5 µg/dL. As a result, less than 5 µg/dL has been used as the benchmark level for this report.
1 World Health Organisation, Childhood Lead Poisoning, 2010 2 National Health & Medical Research Council (NHMRC), Evidence on the Effects of Lead on Human Health, May 2015

6
From July 2015, following significant planning and advocacy, the NSW Government funded the Broken Hill Environmental Lead Program (BHELP) with $13 million, over 5 years. Five people have been recruited to the BHELP program under the auspices of the NSW Environment Protection Authority (EPA). The Broken Hill Lead Steering Committee is made up of representatives from EPA, Far West Local Health District and the Broken Hill Lead Reference Group.
Both the Child & Family Health Service (C&FHS) and Maari Ma have put a lot of effort into engaging with families and keeping them engaged. In 2017, C&FHS introduced education kits for 6 month old children at their immunisation visit, and education was also introduced by Child & Family Nurses at the 6 week Universal Home Health Visit. Maari Ma engages with Aboriginal families regarding lead testing and undertakes home assessments to investigate lead sources for children with blood lead levels over 5 µg/dL. In addition, the Broken Hill hospital maternity unit educates pregnant mothers and provides literature on lead screening and prevention. Tangible incentives have also been offered by both C&FHS and Maari Ma such as cleaning products, towels, sandpits and sand vouchers.
All children over the notifiable level were offered a home assessment, which is required before a family is referred for remediation. At a home visit by C&FHS, all families received a cleaning kit and, if appropriate, a renovator kit or a garden kit. All families accepting a home assessment by Maari Ma are provided a cleaning kit and sand pit.
Future challenges for managing blood lead levels in Broken Hill children that are above the new guidelines include:
• ensuring that all children continue to be screened and that screening data is collected and reported for all children;
• ensuring the community continues to engage in lead remediation activities;
• ensuring that active research into effectiveness of strategies employed continues to direct the way the program is run; and
• maintaining long term momentum in the community to support childhood screening in the first five years of life once the NSW Government funded Broken Hill Environmental Lead Program finishes in 2020.

7
Population Profile
Each Census conducted since lead monitoring began (1991, 1996, 2001, 2006, 2011 and 2016) has seen a decreasing trend in both the number and proportion of children under the age of 5 years residing in the Broken Hill Local Government Area (Table 1). The graph in Figure 1 represents the c h a n g e in estimated resident population by gender for children under 5 years of age in Broken Hill from 1972 to 2016.
Analysis conducted for the annual lead report is stratified by Aboriginality to monitor any inequitable burden of high blood lead levels which may exist. Aboriginal children population numbers are sourced from the Census and are reliant on self-identification. Unlike the total population of under 5 year olds, the number of Aboriginal children has increased from 1996 to 2016 and is projected to continue increasing (Table 1), in addition to the proportion.
Table 1. Demographic profile of children under 5 years of age in Broken Hill
Age in years
1996 2001 2006 2011 2016
All Aboriginal
All Aboriginal
All Aboriginal
All Aboriginal
All Aboriginal
0-4 1,427
112 (8%) 1,255
165 (13%) 1,191 177 (15%) 1,070 176 (16%) 974
182 (19%) Source: Australian Bureau of Statistics (ABS) Census data.
Figure 1. Estimated resident population by gender for children under 5 years of age, Broken Hill, 1972-2016 Source: Based on the Australian Bureau of Statistics estimated resident populations (SAPHaRI). Centre for Epidemiology and Evidence, NSW Ministry of Health.
0
200
400
600
800
1,000
1,200
1,400
1,600
Po
pu
lati
on
Population by sex, Broken Hill LGA under 5 years, 1972 to 2016
Males Females

8
Methods Collection of Blood Samples
For newborn babies, umbilical cord bloods are laboratory tested in the same way as a venous sample. Blood lead levels for children less than five years are taken as either a finger prick (capillary) or venous test. Since October 2008, parents have had the option of having their children screened with a less invasive capillary sampling (finger prick) method. If a child has received both a venous and a capillary test throughout the year, the measurement from the venous test is used. This is because a venous test, though a more invasive procedure than a finger prick, provides a more accurate measure of blood lead levels.
With lead screening aligned, since 2012, with immunisation; testing may occur over the immunisation schedule (12 months, 18 months, 2 years and 4 years of age). Therefore, a child may present at 12 months and 18 months or 18 months and 2 years in the same calendar year. Only the first (younger age) test is used and this is the main reason why there are more children’s first tests in the first 6 months of a year. This also explains the success in capturing those aged between 12 months and less than 3 years.
Reporting of Blood Lead Levels
For analysis and reporting purposes, only a child’s first test in the calendar year is used for calculations, to ensure only one result per child is used per year.
The geometric mean (instead of an arithmetic mean or average) is used to report blood lead levels throughout this report. A geometric mean is calculated by taking the nth root of the product of n numbers. Blood lead levels in an affected location may have the majority of levels in the lower range, however will also have some results which are significantly higher (e.g. 5 to 10 times higher). The geometric mean normalises the ranges being averaged so that no range dominates the weighting.
Age-sex Standardisation of Results
Because children's blood lead levels vary by age and gender, it is difficult to compare blood lead levels from one year to another unless the same proportion of children in each age group is tested in successive years. Therefore age-sex standardisation is used to account for this change. Effectively, this determines what the blood lead level would be if all children in Broken Hill were tested by applying the proportion of children to each age-sex group from the most recent Census (i.e. 2016). This age– sex adjusted population mean is the one reported over time for children aged 1 to <5 years (Figures 3 & 4).
Notifiable Blood Lead Levels
The 5 µg/dL notification level was implemented in February 2016 by NSW Ministry of Health. Throughout this report, less than 5 µg/dL has been used as the benchmark level to enable insight into the extent of lead as an issue for children in Broken Hill – in line with NHMRC and NSW Health guidelines.

9
Participation Rates
The participation rate is intended as an indicator of success of recruitment to screening, through programs such as the 1994 door knock or aligning lead testing with immunisation. Only in census years are LGA populations by single year age group (and gender) available for both Aboriginal and non-Aboriginal people. For intercensal years the most recent census data is used to calculate participation. This is not ideal as census requires a minimum residency period to be counted as a resident, however, Aboriginal families may be more fluid in their movements between extended family and, in Broken Hill, the mining related workforce (and family) can ebb and flow depending on ore prices.
Results Screening of Newborns
Once lead has entered the blood stream, it is stored in bone. For an affected pregnant woman, lead is released from the bones and into the blood and becomes a source of exposure to the developing foetus. Exposure of pregnant women to high levels of lead can cause miscarriage, stillbirth, premature birth and low birth weight, as well as minor malformations3.
In 1996, umbilical cord blood screening commenced in Broken Hill, to determine lead levels in children at birth. To test the lead levels in newborns, a sample of venous blood from the umbilical cord is used. For Broken Hill expectant mothers to birth at the Broken Hill Hospital, they must be considered low risk. If the pregnancy is rated as higher risk, expectant mothers are referred to Flinders Medical Centre or Women’s and Children’s Hospital (both in Adelaide). Details of the criteria for higher risk births are contained in Appendix 1 and include, for example, a Body Mass Index of > 45 at 36 weeks gestation and high risk co-morbidities. Not all births referred to South Australia will have their cord bloods tested unless the mother has requested that results be sent back to Broken Hill.
Historically, from commencement in 1996 there has been a steady decline in umbilical cord blood lead levels, from 2.9 µg/dL in 1996 down to 1.2 µg/dL in 2008. Since 2008, cord blood lead levels have remained relatively stable.
The 2017 umbilical cord lead level geometric mean is 0.78 µg/dL (Figure 2). Although this appears like a significant improvement to years previous to 2016 and 2017, it can’t be accurately compared to those prior years. From 26th April 2016, there was an improvement in recording blood cord levels, through the inclusion of decimal points, resulting in greater accuracy.
In 2017, there was a decrease in total births of Broken Hill mothers at Broken Hill Hospital, to 205, compared to previous years (220 in 2015; 231 in 2016). These totals include women who gave birth in Broken Hill but live elsewhere. There were 168 babies who had cord blood taken to conduct lead level testing with results for 165 reported here. This difference in the total tested (168) and the total records with reportable results (165) is that three consent forms could not be found.
3 World Health Organisation, Childhood Lead Poisoning, 2010

10
Umbilical Cord Blood Lead Screening in Broken Hill newborns 1996-2017
Figure 2. Geometric mean for cord blood lead (PbB) concentration and number of resident newborns screened at Broken Hill Health Service, 1996-2017. The horizontal red line is indicative of the
improvements made in the recording of results since 26th of April 2016. The 2016 and 2017 geometric means should not be compared to the previous years.
Screening of Children Aged 1 to under 5 years
Over the duration of the voluntary blood lead screening program there has been a decreasing trend in the geometric mean blood lead levels in all children tested (1 to <5years), from a high of 16.7 µg/dL in 1991 to an adjusted geometric mean of 5.7 µg/dL in 2017 (Figure 3). The 2017 results are slightly less than 2016 and 2015 (5.9 and 5.8 µg/dL).
This year saw an improvement in the non-Aboriginal children mean results – from 5.2 µg/dL in 2016 to 4.6 µg/dL in 2017. Results for Aboriginal children are further explored later in the report.
The number of all children tested peaked in 1994, with 948 children screened, as a result of a major resource intensive door-knocking campaign in 1994 to raise awareness in the wider community. The
falling trend since then was reversed in 2012, with the inclusion of blood lead screening with routine immunisation at the Broken Hill Child and Family Health Centre and expansion of testing at Maari
2.9
2.7
2.42.5 2.5
2.1
1.8
1.6 1.61.5
1.41.3
1.2 1.2 1.2 1.2 1.2 1.2 1.21.1
0.8 0.8
197
252246
229221
234
192
222
206215
197
217 220
197 195
171
198
174169
177
165 165
0
50
100
150
200
250
300
0
0.5
1
1.5
2
2.5
3
3.5
Nu
mb
er
of
Ch
ild
ren
Scre
en
ed
Geo
metr
ic M
ean
Pb
B (
ug
/dL
)
Year
Blood Lead Concentration Children Screened

11
Ma Primary Health Care service.
In 2017, a total of 730 children had at least one test, a significant increase from the 687 tested in 2016. This increase was due to increases in both Aboriginal and non-Aboriginal children tested. The number of Aboriginal children tested increased by 6.8% from 207 to 221 (2016 to 2017) and non-Aboriginal children tested increased by 6% from 480 in 2016 to 509 in 2017.

12
Blood lead levels in all children and children identifying as Aboriginal aged 1 to <5years in Broken Hill, 1991-2017
Figure 3. Population age-sex standardised geometric mean blood lead concentration and number of all children and Aboriginal* children screened aged between 1 to <5 years in Broken Hill, 1991-2017. The red vertical line indicates the point in which both venous and capillary samples are
reported together and the blue the inclusion of screening with childhood immunisation. *There were no recorded tests for Aboriginal children in 1991. Standardisation applied only from 1997 onwards, due to small sample size. Additionally, Aboriginal status was only consistently collected from 1997.
16.7
14.2 13.8
12.311 10.6
9.6
8.9
8.4
8.47.6
7 7.16.2
5.5 5.9
5.84.9
5.74.7 4.5
5.4 5.6 5.25.8
5.95.7
21.922.9
13.3
16.2
14.9
11.7 11.5
12
12
10.510.3
10.7
9.6
8.7
10.58.4
6.2
9.17.7
6.5
8.5 8.27.5
9.3
7.6
8.7
778
727
537
948
779
567
733
814
734
633 624603
506
556 548
449 458
361 361
397
554
674695
719679 687
730
4 6 8 7 9 3255
8… 7090 84 97
120105
69 82
63 3758 102
159
156183 178 207 221
0
100
200
300
400
500
600
700
800
900
1000
0
5
10
15
20
25
Nu
mb
er
of
Ch
ild
ren
Sc
ree
ne
d
Ge
om
etr
ic M
ean
Pb
B μ
g/d
L
Year
All children tested mean Aboriginal children tested mean Number of all children screened Number of Aboriginal children screened
13
The proportion of all children with blood lead levels under the benchmark (<5 µg/dL) has risen from 13% in 2000 to 46% in 2017 (Figure 4). At the same time, the geometric mean has fallen from 8.4 µg/dL (2000) to fluctuate between 5 and 6 µg/dL since 2005. Although the proportion of all children with blood lead levels <5µg/dL has increased from 2000 to 2017, the proportions in this range peaked in 2010, when 59% of all children had blood lead levels below 5 µg/dL. Exceptions to the downward trend are seen in 2014 and 2017. The proportion of children in the 5 to <10 µg/dL range has decreased from 38% in 2016 to 30% in 2017, however the proportions of children in all the higher blood lead categories have remained around 20% (23% in 2017) since 2012, compared to 12 % in 2010 and 2011 (Figure 4). The number of children in the <5 µg/dL category is the second highest since 2000, only 2014 numbers being greater (Figure 5), however the number of children in the categories above > 10 µg/dL has been increasing since 2010. The number of children in the highest category (>29 µg/dL) has been decreasing since 2012.
Anecdotally, additional children may have been tested through alternative health care providers (e.g. private General Practitioners), however there is no obligation to forward these results to the Child and Family Health Centre, and therefore these results are excluded from this analysis. If results from a private practice return as 5 µg/dL or higher, this result will be notified to NSW Health (Public Health).

14
Percentage of children aged 1 – <5 years in Broken Hill by category of blood lead level and age-sex-standardised geometric mean by year
Figure 4. Age-sex standardised percentage of Broken Hill children aged 1 to <5 years in each blood lead category and population age sex standardised geometric mean (2000-2017).
1319
25 23
3237
4534 47 39
59 54 49 4752
4342
46
47 4643 45
40
40 2840
36
41
2834
31 3228
33 38 30
2520
20 1917
1415
15
10 148 8
13 13 1316
1114
9 9 7 76
66 6
3 3 3 34 4 5 6 6 6
6 4 3 6 4 3 4 3 3 1 1 1 2 22
2 2 3
1 1 2 2 1 1 2 2 0 1 1 1 1 2 1 0.9 0.6
8.4
7.67 7.1
6.25.5
5.9 5.8
4.95.7
4.7 4.85.4 5.6 5.2
5.8 5.9 5.7
0
5
10
15
0%
10%
20%
30%
40%
50%
60%
70%
80%
90%
100%
2000 2001 2002 2003 2004 2005 2006 2007 2008 2009 2010 2011 2012 2013 2014 2015 2016 2017
Ge
om
ea
n P
b (
ug
/dl)
Pe
rce
nta
ge
Year
<5ug/dl 5<10 ug/dL 10-<15ug/dL 15-<20 ug/dL 20-29 ug/dL >29 ug/dL PbB

15
Number of children aged 1 to <5 years in Broken Hill by category of blood lead level by year
Figure 5. Count of all tested Broken Hill children in each blood lead category, aged between 1 to <5 years, 2000-2017.
82116
149115
179 204 202158 171
142
233
302331 322
381
300 287344
295282
258
226
220219
124182 130
148
113
186
207 235
205
226 260
220157 126 122
96
9374
6970
36 52
34
42
8790
88
101 79102
55 58 42
33
35 31
2926
11 12
12
16
2526
30
35 39
44
36 2720
28
23 15
18 15
12 53
5
1515
15
15 16
16
87
12
8
6 5
7 7
1 2
2
3
97 2 6
4
0
100
200
300
400
500
600
700
800
2000 2001 2002 2003 2004 2005 2006 2007 2008 2009 2010 2011 2012 2013 2014 2015 2016 2017
Nu
mb
er
of
ch
ild
ern
betw
een
1 a
nd
un
der
5 y
ears
Year<5ug/dl 5<10 ug/dL 10-<15ug/dL 15-<20 ug/dL 20-29 ug/dL >29 ug/dL

16
While the increasing number of children screened aged 1 to <5 years is valuable for addressing lead at a population level, up to 2012 testing was also conducted on children aged between 7 months and < 1 year. Once screening was aligned to the immunisation schedule, testing at this age was discontinued because of resourcing constraints and mean blood lead levels well below the then notifiable level of 10 µg/dL. Even though in 2012 the geometric mean of children under 1 year was 3.9 µg/dL, 25% of children tested would have had notifiable levels using current guidelines.
A review of 2016 and 2017 screening data by age group found that even for 1 year olds the mean blood lead level was above the notifiable 5 µg/dL (Table 2). This has prompted a revision to the 2018 testing regime – reintroduction of testing at 6 months with immunisation. Strategically, any prompting of earlier intervention such as referrals for follow up home assessments and remediation is crucial to reduce blood lead levels.
Table 2 Comparison of geometric mean by age and Aboriginality between 2016 and 2017
2016 2017
Age (years)
All children (µg/dL)
Non Aboriginal (µg/dL)
Aboriginal (µg/dL)
All children (µg/dL)
Non Aboriginal (µg/dL)
Aboriginal (µg/dL)
1 5.7 5.5 6.8 5.2 4.8 7.1
2 5.9 4.8 8.0 5.9 5.0 7.9
3 6.1 5.1 7.7 5.9 4.2 9.6
4 5.8 5.1 7.8 5.4 4.2 9.2

17
Blood lead levels and the number of children tested are both higher in the first half of the year (Figure 6). The number of children presenting for testing drops over the winter months. This may be a result of changes in health seeking behaviours in cooler months as well as children who turn 2 in the second half of the year will have been screened early in the year at 18 months.
Blood lead levels have been shown to be seasonal4, increasing in warm/ hot dry weather. Broken Hill is in an arid location, prone to droughts. Climate change is predicted to bring more extremes, such as longer dry, hot periods with longer intervals between heavier rainfall events so monitoring is justified.
Monthly mean blood lead levels and screening count of children aged 1 to <5 years in 2017
Figure 6. Monthly geometric mean blood lead level comparison of first visit blood lead levels for Broken Hill children aged between 1 to <5 years of age for 2017.
4 Laidlaw MAS, Mielke HW, Filippelli GM, Johnson DL, Gonzales CR. Seasonality and Children’s Blood Lead Levels:
Developing a Predictive Model Using Climatic Variables and Blood Lead Data from Indianapolis, Indiana, Syracuse, New
York, and New Orleans, Louisiana (USA). Environmental Health Perspectives. 2005; 113(6):793-800
6.3 6.76.2
5.8 5.7
4.1
4.65.0
5.25.0
4.5
3.2
82
124
105
55
81
61
4649
36
28
41
22
0
10
20
30
40
50
60
70
80
90
100
110
120
130
0.0
1.0
2.0
3.0
4.0
5.0
6.0
7.0
Nu
mb
er
of
Ch
ild
ren
Scre
en
ed
Geo
metr
ic M
ean
Pb
B (m
g/d
L)
Month (2017)
Blood Lead Concentration Number of Children Screened

18
Screening of Aboriginal Children Aged 1 to <5 years
There has been a historical burden of high blood lead levels in children identified as Aboriginal in Broken Hill. The mean blood lead level for Aboriginal children is higher than the overall geometric mean for all Broken Hill children, however this level has been decreasing. From 2012, when aligning blood lead testing with immunisation began, the proportion of children tested markedly increased. Maari Ma also began doing their own blood lead testing at this time.
In 2017, there was an increase in the Aboriginal age-sex standardised mean, from 7.6 µg/dL (2016) to 8.7 µg/dL in 2017 (Figure 3). As shown in Table 2, Aboriginal children of all ages have a mean blood lead level clearly above 5 µg/dL. The average gap between Aboriginal and non-Aboriginal children is almost the same as that recorded in 2015 - 4.1 µg/dL. In 2017, the geometric means of male children in the 3 and 4 year age groups were higher than the overall age-sex standardized mean of 8.7 µg/dL. In this age group were a number of children who were tested in 2017 but not in 2016. All had high blood lead levels (ranging from 7.6 µg/dL to 26 µg/dL). Some of these children had been tested prior to 2016, others were new to the program.
From 2016 to 2017, there was a 6% increase in the number of Aboriginal children tested (207 to 221)
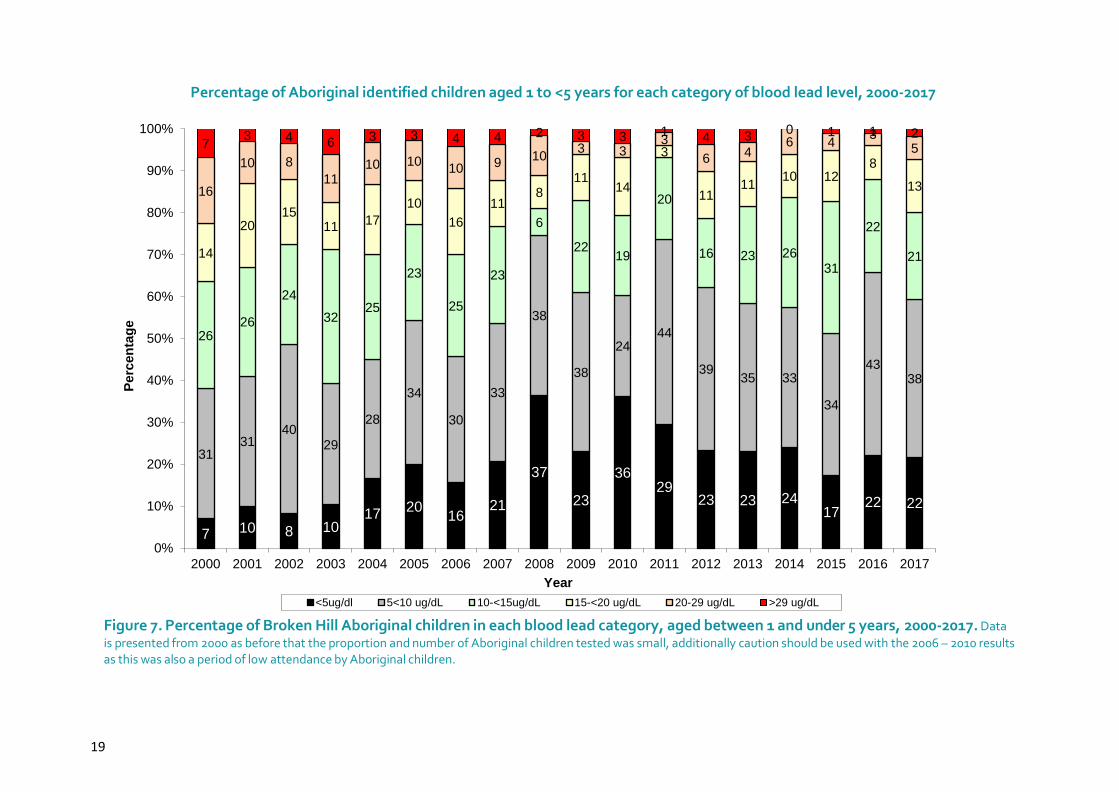
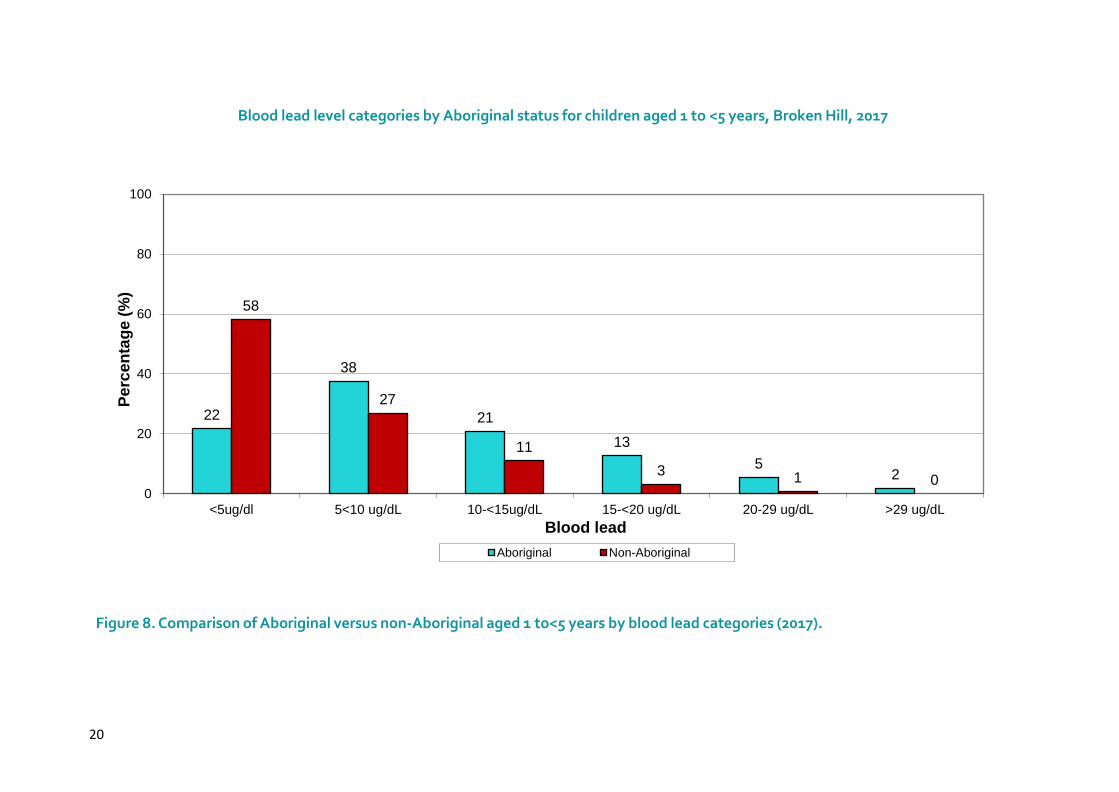
– marking 2017 as the year with the highest number of Aboriginal children tested. In 2010, Aboriginal children tested as a proportion of all children tested was 14.6% and in 2016 and 2017 this proportion had risen to 30.3%. In 2017, 22% of tested Aboriginal children had a blood lead level less than 5 µg/dL, which is the same proportion as 2016. Although this represents an increase from 2015 (17%), it contrasts greatly to a 58% proportion of non-Aboriginal children <5 µg/dL. Previous years have seen a higher proportion of Aboriginal blood lead results under 5 µg/dL. For example, 37% of Aboriginal children had blood lead results under 5 µg/dL in 2008 and 36% in 2010 (Figure 7), though these years were among the lowest numbers of Aboriginal children tested since recording of Aboriginality began (see Figure 3). In 2017, the 5 to < 10 µg/dL category has the highest proportion of the Aboriginal children results (38%) – but the 2016 proportion (43%) was higher for this category.
The discrepancies in blood lead levels between Aboriginal and non-Aboriginal children are greatest in the <5 µg/dL category (Figure 8) – 22% compared to 58% (Aboriginal and non-Aboriginal respectively). In all other lead range categories (i.e. all above 5 µg/dL), the Aboriginal children proportion is higher than the non-Aboriginal children.
The expansion of the blood lead screening program has resulted in a more accurate depiction of the burden of blood lead levels among Aboriginal children. This more accurate picture can better inform public health action to reduce the blood lead level discrepancy between Aboriginal and non- Aboriginal children in Broken Hill.
19
Percentage of Aboriginal identified children aged 1 to <5 years for each category of blood lead level, 2000-2017
Figure 7. Percentage of Broken Hill Aboriginal children in each blood lead category, aged between 1 and under 5 years, 2000-2017. Data
is presented from 2000 as before that the proportion and number of Aboriginal children tested was small, additionally caution should be used with the 2006 – 2010 results as this was also a period of low attendance by Aboriginal children.
7 10 8 1017
2016
21
37
23
3629
23 23 2417
22 22
3131
4029
28
34
30
33
38
38
2444
3935 33
34
4338
2626
24
3225
23
25
23
6
2219
20
16 23 2631
22
2114
2015
1117
10
16
118
1114
3
1111
10 128
1316
10 8
1110 10
10 910
3 33
6 46 4
357
3 4 6 3 3 4 4 2 3 3 1 4 30 1 1 2
0%
10%
20%
30%
40%
50%
60%
70%
80%
90%
100%
2000 2001 2002 2003 2004 2005 2006 2007 2008 2009 2010 2011 2012 2013 2014 2015 2016 2017
Perc
en
tag
e
Year
<5ug/dl 5<10 ug/dL 10-<15ug/dL 15-<20 ug/dL 20-29 ug/dL >29 ug/dL
20
Blood lead level categories by Aboriginal status for children aged 1 to <5 years, Broken Hill, 2017
Figure 8. Comparison of Aboriginal versus non-Aboriginal aged 1 to<5 years by blood lead categories (2017).
22
38
21
13
52
58
27
11
31 0
0
20
40
60
80
100
<5ug/dl 5<10 ug/dL 10-<15ug/dL 15-<20 ug/dL 20-29 ug/dL >29 ug/dL
Pe
rce
nta
ge
(%
)
Blood lead
Aboriginal Non-Aboriginal

21
Estimate of Participation Rate
The estimated participation rate for lead screening in all children at Broken Hill (aged 1 to <5 years) was 94% in 2017. There have been significant increases since the period 2008-2010 (rates around forty percent) to close to 80% and above from 2012 (Figure 9). There is significant under reporting of Aboriginality in the Census, and for 2016 the count of Aboriginal children between 1 and under 5 years old is actually less than the total tested in Broken Hill (162 compared to 221). Therefore, no participation rate calculation for Aboriginal children was performed, as the result exceeds 100%. Both Maari Ma and Child & Family Health Services have made concerted efforts at keeping engaged with families, including tangible incentives in 2016 and 2017, which have been major factors in reversing participation in screening.
Estimate of Participation Rate in Lead Screening, 2007-2017
Figure 9. Estimate of blood lead level screening participation rates for Broken Hill children by Aboriginality aged between 1 and under 5 years old.
0
10
20
30
40
50
60
70
80
90
100
2007 2008 2009 2010 2011 2012 2013 2014 2015 2016 2017
Perc
en
tag
e (
%)
Year

22
Ten year snapshot 2008-2017
Geometric mean by Aboriginal status, children aged 1 to<5 years, 2008-2017
Figure 10. Comparison of age-sex standardised geometric means by Aboriginal status and the difference between Aboriginal and non-Aboriginal children, 2008-2017. The red vertical line indicates
the point in which both venous and capillary samples are reported together and the blue vertical line indicates the inclusion of screening with childhood immunisation.
Subsequent to the introduction of the finger-prick method and aligning testing with immunisation, over the last 10 years there have been significant increases in Aboriginal and non-Aboriginal children tested, (Figure 3) affording a more exact indication of population blood lead levels in children in Broken Hill. Yet over this period the population mean has increased only marginally, from hovering around 5 µg/dL to just under 6 µg/dL from 2015 (see Figure 3). Figure 10 above shows a similar pattern for non-Aboriginal children, though their mean has mostly stayed under 5 µg/dL. Aboriginal children’s geometric mean increased slightly more over this period, probably because of the steady yearly increase in children tested giving a more accurate population mean. The increase in Aboriginal children tested has also influenced the overall population mean as Aboriginal children, as a proportion of all children tested, rose from a low of 17% in 2008 and 10% in 2009 to 30% of all children in 2016 and 2017. The graphs of both Aboriginal and non-Aboriginal children’s means are similar, for most years rising and falling together, though Aboriginal children’s values are more volatile. Thus the gap between Aboriginal and non- Aboriginal children for this period has largely remained between 3-4 µg/dL. The variation in the difference is accounted for by the large fluctuations in Aboriginal children’s geometric means.
0
1
2
3
4
5
6
7
8
9
10
2008 2009 2010 2011 2012 2013 2014 2015 2016 2017
Geo
metr
ic M
ean
μg
/dL
l
Years
Aboriginal children tested mean Non Aboriginal children tested mean Mean Difference

23
Conclusion
Geometric means (age-sex standardised) for all children tested (1 to <5 years) remained almost unchanged from 2016 (and 2015) – 5.9 to 5.7 µg/dL in 2017. The non-Aboriginal blood lead level decreased from 5.2 to 4.6 µg/dL in 2017, however for Aboriginal children blood lead mean result increased in 2017 from 7.6 to 8.7 µg/dL. Mean blood lead levels of all and Aboriginal children aged 1 year were above the notifiable 5 µg/dL and for all subsequent years.
The total number of all children screened increased by 6% from 687 in 2016 to 730 in 2017. In 2017, a total of 221 Aboriginal children were tested – the highest number on record and there were 509 non-Aboriginal children screened. The alignment of immunisation and blood lead testing, the strengthening of the partnership between the Child and Family Health Centre and Maari Ma, and the two services keeping engaged with families, along with tangible incentives, have been major factors in reversing participation in screening.
The 2017 results show 58% of non-Aboriginal children in Broken Hill had a blood lead level below 5 µg/dL, compared to 22% of Aboriginal children. The large gap between Aboriginal and non-Aboriginal children in the proportion under the notifiable blood lead level of 5 µg/dL is reinforced by the difference in geometric mean levels remaining at 4.1, similar to 2015.
While there have been improvements across some lead results for children, the proportion of Aboriginal children in all lead level categories ≥ 5 µg/dL are higher compared with non-Aboriginal children. Although there has been improvements in non-Aboriginal children results in 2017, of the 386 children at or above 5 µg/dL over half 55% (213) are non-Aboriginal and 45% (173) Aboriginal. Fur t hermor e , there have been increases over time to the proportion of children tested with blood lead levels above 5.0 µg/dL – from 41% in 2010 to 54% in 2017. This 13% point increase is similar to the 15.7% point increase in the proportion of Aboriginal children tested, the majority of whom have blood lead levels higher than 5 µg/dL. Reducing blood lead levels among Aboriginal children to match those of non-Aboriginal children remains a challenge, however the majority of children (55%) with blood lead levels at or above 5 µg/dL are non-Aboriginal.
There remains ongoing work to reduce blood lead levels in Broken Hill.

24
Appendix 1
The criteria for birthing in Broken Hill is that they have to be low risk.
The following women are not eligible to give birth in Broken Hill:
• Less than 37 weeks gestation
• BMI >45 at 36 weeks gestation
• High risk comorbidities requiring specialist treatment
• Uncontrolled gestational diabetes
• Severe intrauterine growth restrictions/foetal abnormalities
• High risk pre-eclampsia
• High risk twins or triplets
• Women with type 1 diabetes • Induction of labour or caesarean prior to 38 weeks gestation
All of the above women are referred to Flinders Medical Centre or Women’s & Children Hospital, Adelaide.

25
References
Australian Bureau of Statistics (ABS), Census of Population and Housing, 1996, 2001, 2006, 2011 and 2016 Centre for Epidemiology and Evidence. HealthStats NSW. Sydney: NSW Ministry of Health. Available at: www.healthstats.nsw.gov.au. Accessed [20 May 2018] Laidlaw MAS, Mielke HW, Filippelli GM, Johnson DL, Gonzales CR. Seasonality and Children’s Blood Lead Levels: Developing a Predictive Model Using Climatic Variables and Blood Lead Data from Indianapolis, Indiana, Syracuse, New York, and New Orleans, Louisiana (USA). Environmental Health Perspectives. 2005; 113(6):793-800. doi:10.1289/ehp.7759.
National Health & Medical Research Council (NHMRC), Evidence on the Effects of Lead on Human Health, May 2015
World Health Organization, Childhood Lead Poisoning, 2010