Embed Size (px)
Citation preview
math.univ-toulouse.fr/biostat/mixOmics
Le package mixOmics pour l'intégration de données omiques
S. Déjean(1) - I. González(2) - K-A. Lê Cao(3)
(ordre alphabétique !)
1. Institut de Mathématiques de Toulouse, UMR 5219Université de Toulouse et CNRS
[email protected]. Plateforme Biostatistique, Genopôle Toulouse Midi-Pyrénées
3. Queensland Facility for Advanced [email protected]
2math.univ-toulouse.fr/biostat/mixOmics
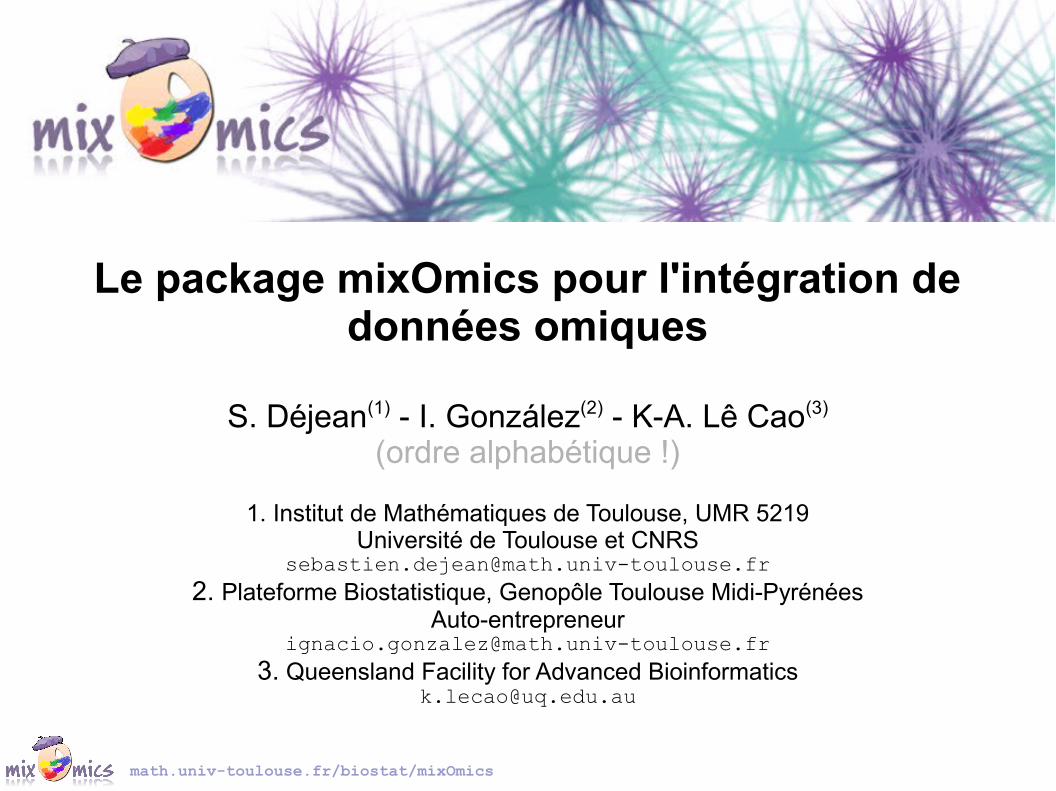
HistoriqueOnce upon a time in Toulouse, a city in South West of France,
two groups of scientists lived nearly together withouttalking to each other.
But one day, they decided to do so and to work together. They had Ph.D students, wrote articles and built R packages...
DNARNA
ATGCCTACCAGT
1n∑i=1
n
X i
X ' X −1 X ' Y
« Stat » « Bio »
1n∑i=1
n
X i
ATGCC
ofw
CCA
mixOmicsSAGMB BMCBioinformatics
J. Biol.Syst.
J. Stat.Soft.
3math.univ-toulouse.fr/biostat/mixOmics
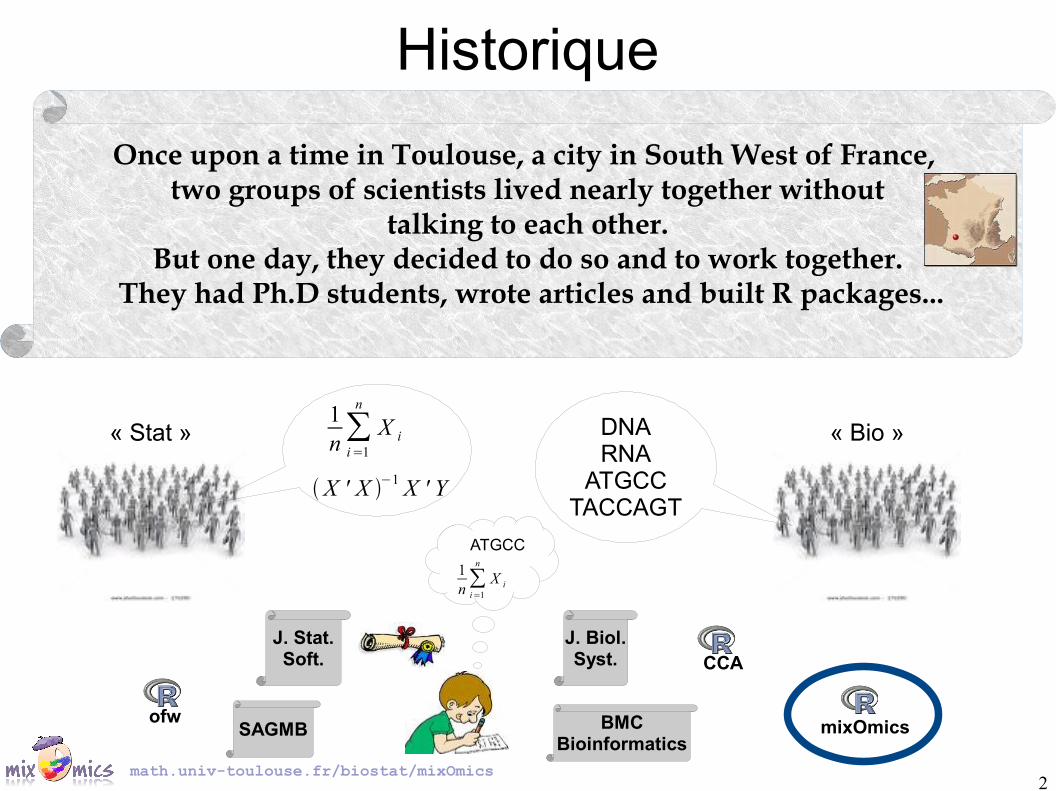
Pourquoi mixOmics ?
Biologicalsystem
Transcript-omics
Prote-omics
Metabol-omics
Lipid-omics
Gen-omics
...-omics
● Each « -omics » data set can be studied separately, but● A great part of relevant information can be extracted from joint analysis of 2 (or more) datasets, so
⇒ Integrate omics data projectin short :
mixOmics
Methodology Applications Software
4math.univ-toulouse.fr/biostat/mixOmics
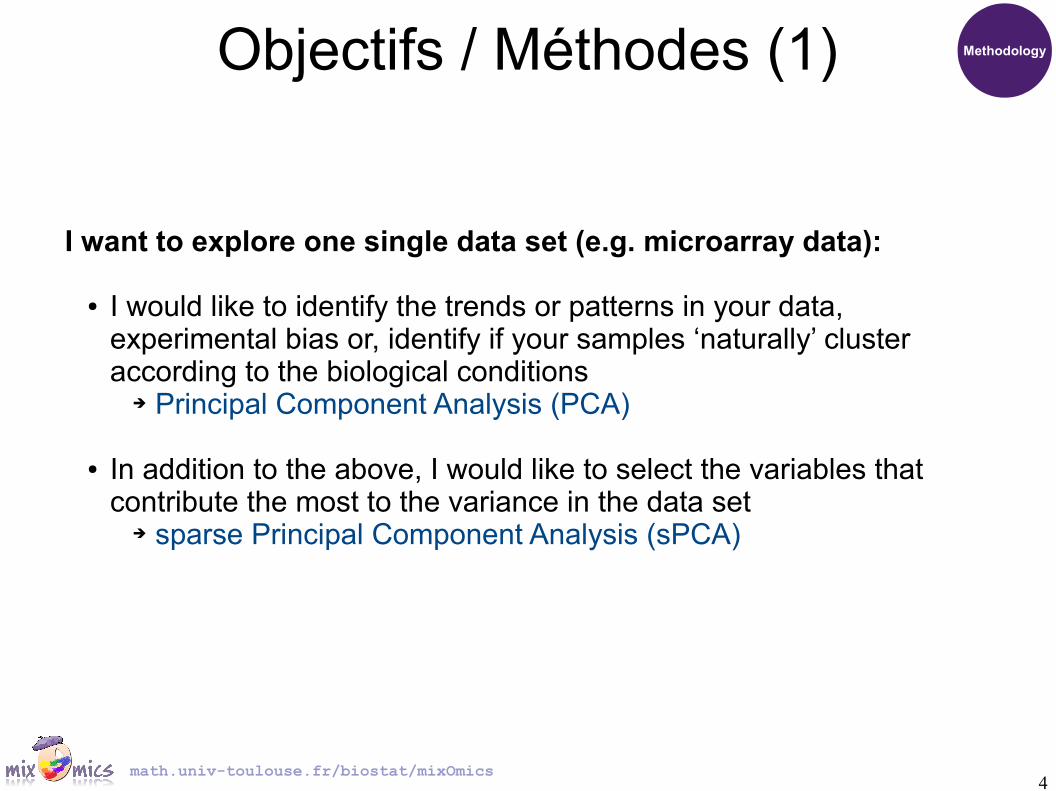
Objectifs / Méthodes (1)
I want to explore one single data set (e.g. microarray data):
● I would like to identify the trends or patterns in your data, experimental bias or, identify if your samples ‘naturally’ cluster according to the biological conditions
➔ Principal Component Analysis (PCA)
● In addition to the above, I would like to select the variables that contribute the most to the variance in the data set
➔ sparse Principal Component Analysis (sPCA)
Methodology
5math.univ-toulouse.fr/biostat/mixOmics
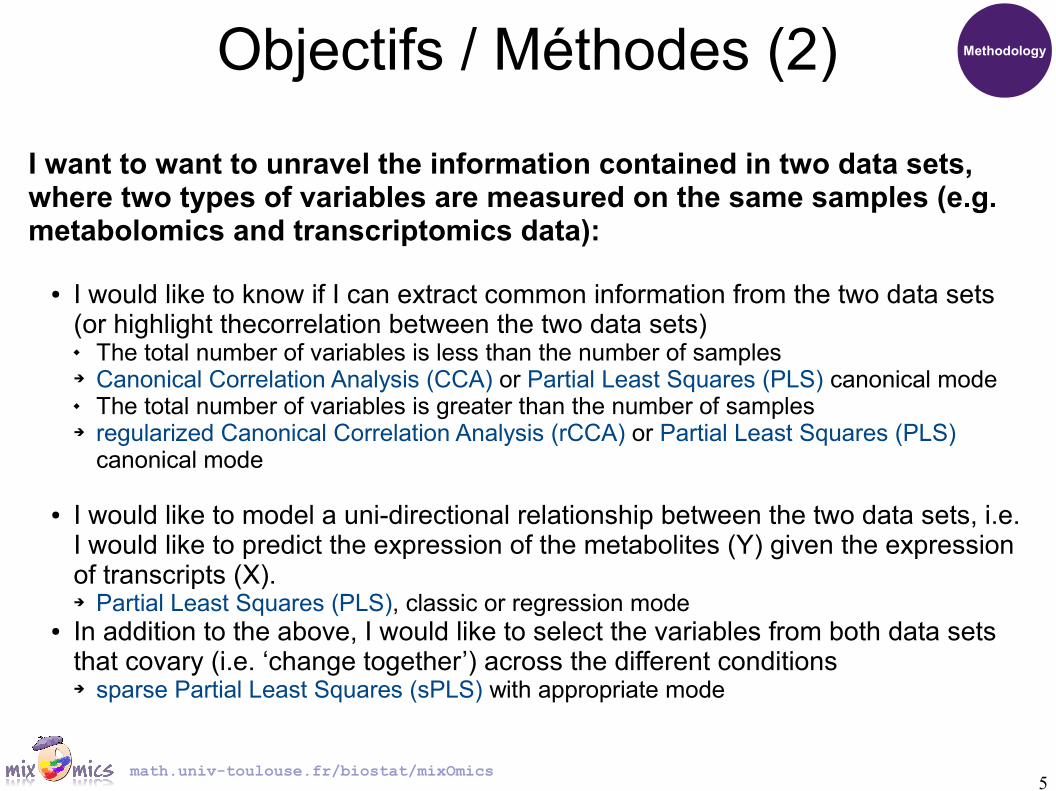
Objectifs / Méthodes (2)
I want to want to unravel the information contained in two data sets, where two types of variables are measured on the same samples (e.g. metabolomics and transcriptomics data):
● I would like to know if I can extract common information from the two data sets (or highlight thecorrelation between the two data sets) The total number of variables is less than the number of samples➔ Canonical Correlation Analysis (CCA) or Partial Least Squares (PLS) canonical mode The total number of variables is greater than the number of samples➔ regularized Canonical Correlation Analysis (rCCA) or Partial Least Squares (PLS)
canonical mode
● I would like to model a uni-directional relationship between the two data sets, i.e. I would like to predict the expression of the metabolites (Y) given the expression of transcripts (X). ➔ Partial Least Squares (PLS), classic or regression mode
● In addition to the above, I would like to select the variables from both data sets that covary (i.e. ‘change together’) across the different conditions➔ sparse Partial Least Squares (sPLS) with appropriate mode
Methodology
6math.univ-toulouse.fr/biostat/mixOmics
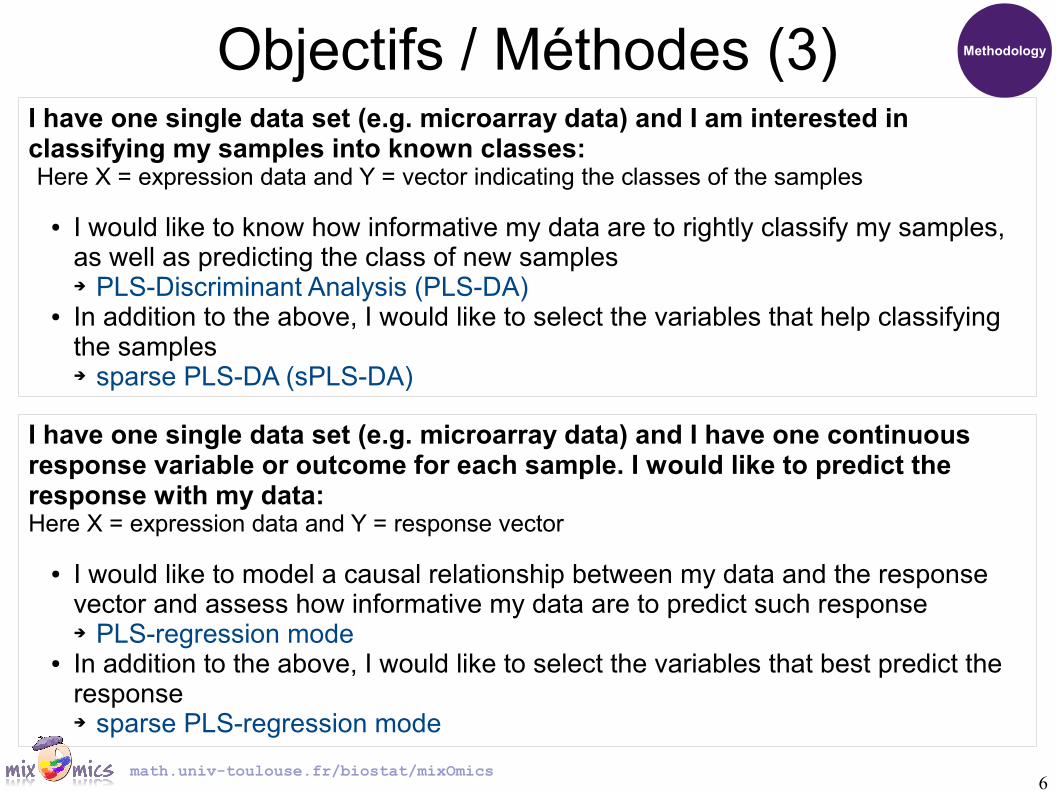
Objectifs / Méthodes (3)I have one single data set (e.g. microarray data) and I am interested in classifying my samples into known classes:Here X = expression data and Y = vector indicating the classes of the samples
● I would like to know how informative my data are to rightly classify my samples, as well as predicting the class of new samples➔ PLS-Discriminant Analysis (PLS-DA)
● In addition to the above, I would like to select the variables that help classifying the samples➔ sparse PLS-DA (sPLS-DA)
I have one single data set (e.g. microarray data) and I have one continuous response variable or outcome for each sample. I would like to predict the response with my data:Here X = expression data and Y = response vector
● I would like to model a causal relationship between my data and the response vector and assess how informative my data are to predict such response➔ PLS-regression mode
● In addition to the above, I would like to select the variables that best predict the response➔ sparse PLS-regression mode
Methodology
7math.univ-toulouse.fr/biostat/mixOmics
Intégration de données : CCA Methodology
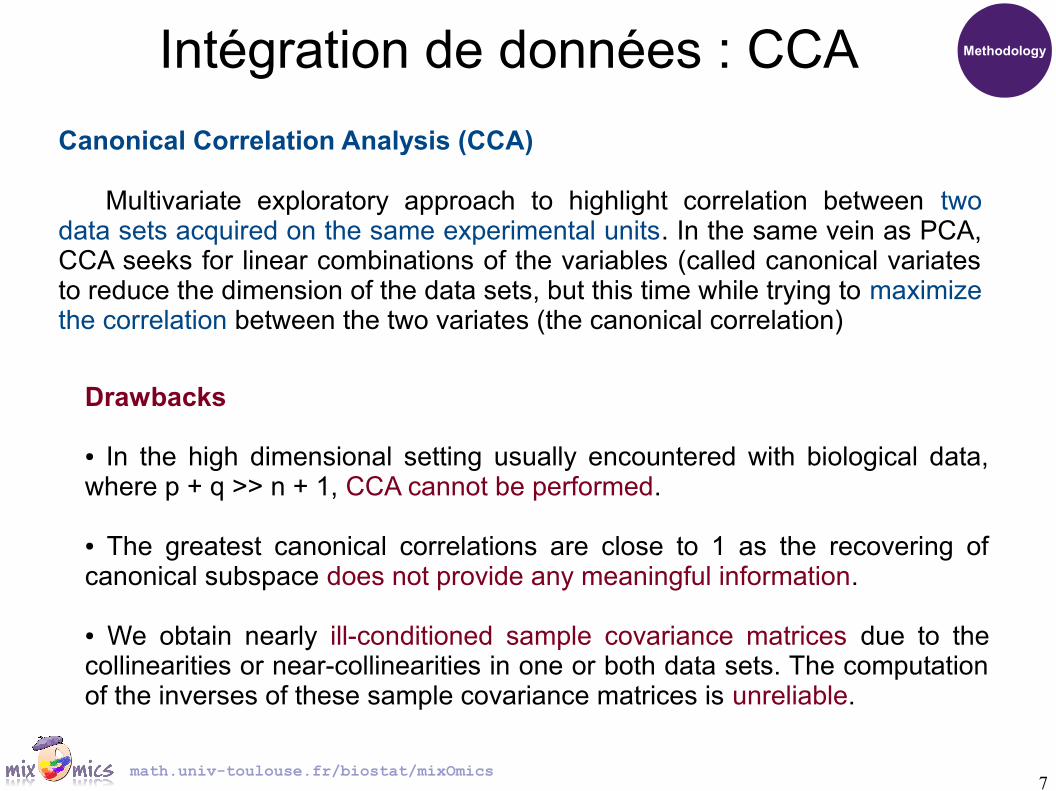
Canonical Correlation Analysis (CCA)
Multivariate exploratory approach to highlight correlation between two data sets acquired on the same experimental units. In the same vein as PCA, CCA seeks for linear combinations of the variables (called canonical variates to reduce the dimension of the data sets, but this time while trying to maximize the correlation between the two variates (the canonical correlation)
Drawbacks
● In the high dimensional setting usually encountered with biological data, where p + q >> n + 1, CCA cannot be performed.
● The greatest canonical correlations are close to 1 as the recovering of canonical subspace does not provide any meaningful information.
● We obtain nearly ill-conditioned sample covariance matrices due to the collinearities or near-collinearities in one or both data sets. The computation of the inverses of these sample covariance matrices is unreliable.
8math.univ-toulouse.fr/biostat/mixOmics
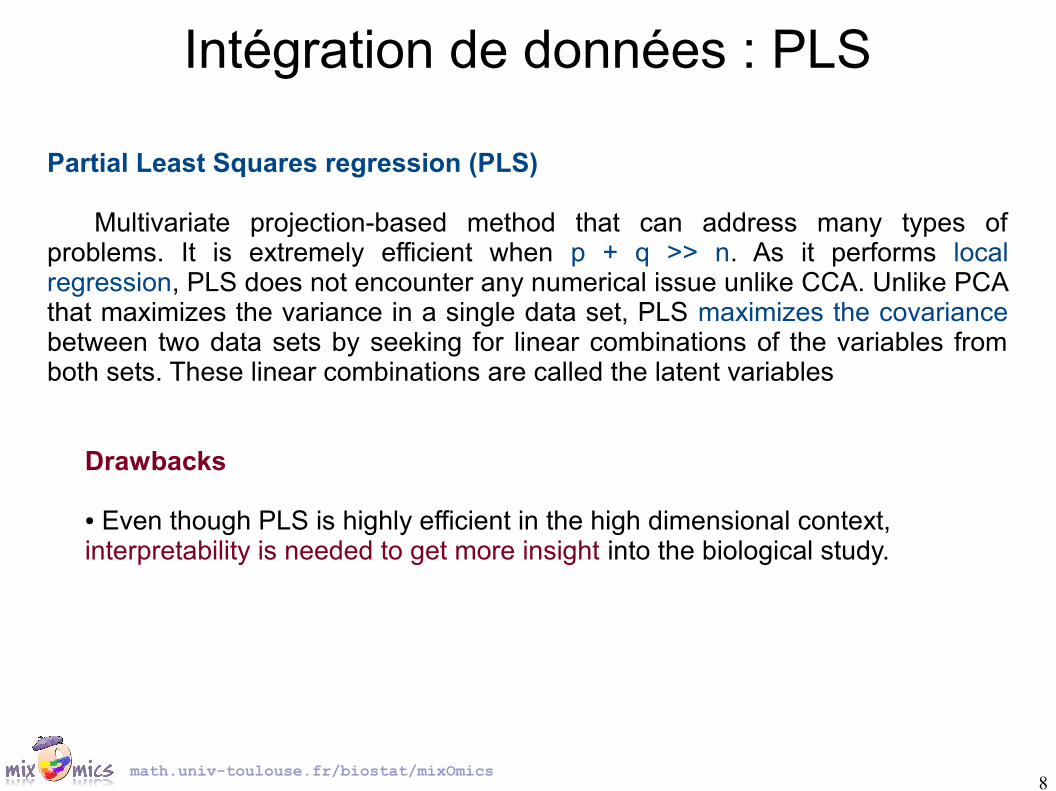
Intégration de données : PLS
Partial Least Squares regression (PLS)
Multivariate projection-based method that can address many types of problems. It is extremely efficient when p + q >> n. As it performs local regression, PLS does not encounter any numerical issue unlike CCA. Unlike PCA that maximizes the variance in a single data set, PLS maximizes the covariance between two data sets by seeking for linear combinations of the variables from both sets. These linear combinations are called the latent variables
Drawbacks
● Even though PLS is highly efficient in the high dimensional context, interpretability is needed to get more insight into the biological study.

9math.univ-toulouse.fr/biostat/mixOmics
Régularisation (ridge, l2) Methodology
(XX ' )−1⇒(XX '+λ X I n)−1
● Classical CCA assumes that p < n and q < n , where p and q are the number of variables in each set.
● Therefore, a regularization step must be included. Such a regularization in this context was first proposed by Vinod (1976), then developed by Leurgans et al. (1993). It consists in the regularization of the empirical covariances matrices of X and Y by adding a multiple of the matrix identity
● In addition to the number of dimensions to choose, in rCCA, the two parameters to tune are therefore the regularization (or l2 penalties) λ
X and λ
Y. This is done
using cross-validation. Note that these two parameters remain unchanged for all dimensions of rCCA. This tuning step may take some computation time.
(YY ')−1⇒(YY '+λY I n)−1
10math.univ-toulouse.fr/biostat/mixOmics
MethodologySparse, lasso, l1
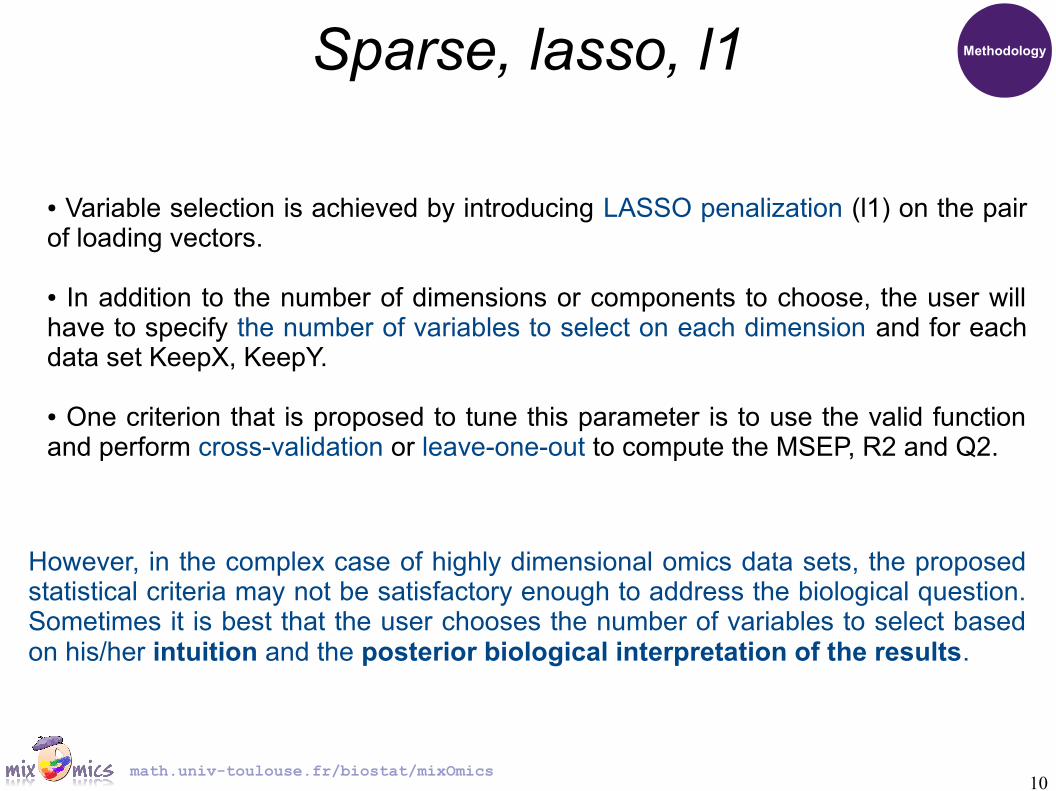
● Variable selection is achieved by introducing LASSO penalization (l1) on the pair of loading vectors.
● In addition to the number of dimensions or components to choose, the user will have to specify the number of variables to select on each dimension and for each data set KeepX, KeepY.
● One criterion that is proposed to tune this parameter is to use the valid function and perform cross-validation or leave-one-out to compute the MSEP, R2 and Q2.
However, in the complex case of highly dimensional omics data sets, the proposed statistical criteria may not be satisfactory enough to address the biological question. Sometimes it is best that the user chooses the number of variables to select based on his/her intuition and the posterior biological interpretation of the results.
11math.univ-toulouse.fr/biostat/mixOmics
Applications
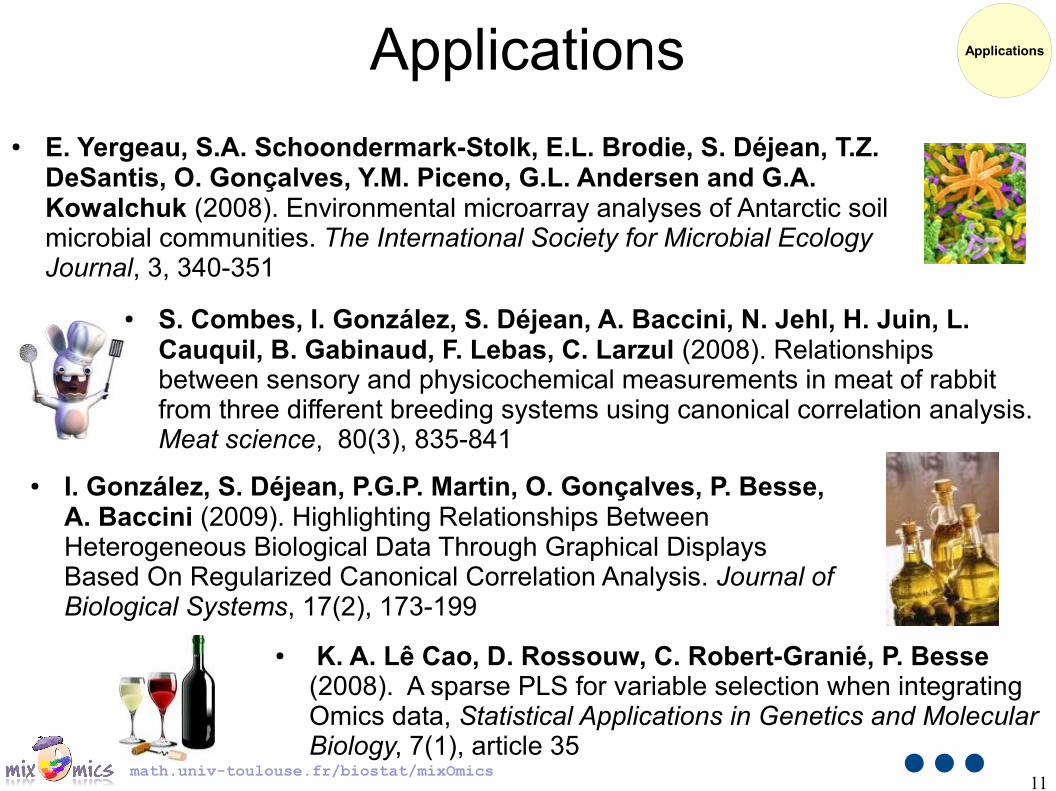
● I. González, S. Déjean, P.G.P. Martin, O. Gonçalves, P. Besse, A. Baccini (2009). Highlighting Relationships Between Heterogeneous Biological Data Through Graphical Displays Based On Regularized Canonical Correlation Analysis. Journal of Biological Systems, 17(2), 173-199
● E. Yergeau, S.A. Schoondermark-Stolk, E.L. Brodie, S. Déjean, T.Z. DeSantis, O. Gonçalves, Y.M. Piceno, G.L. Andersen and G.A. Kowalchuk (2008). Environmental microarray analyses of Antarctic soil microbial communities. The International Society for Microbial Ecology Journal, 3, 340-351
● S. Combes, I. González, S. Déjean, A. Baccini, N. Jehl, H. Juin, L. Cauquil, B. Gabinaud, F. Lebas, C. Larzul (2008). Relationships between sensory and physicochemical measurements in meat of rabbit from three different breeding systems using canonical correlation analysis. Meat science, 80(3), 835-841
● K. A. Lê Cao, D. Rossouw, C. Robert-Granié, P. Besse (2008). A sparse PLS for variable selection when integrating Omics data, Statistical Applications in Genetics and Molecular Biology, 7(1), article 35
Applications
12math.univ-toulouse.fr/biostat/mixOmics
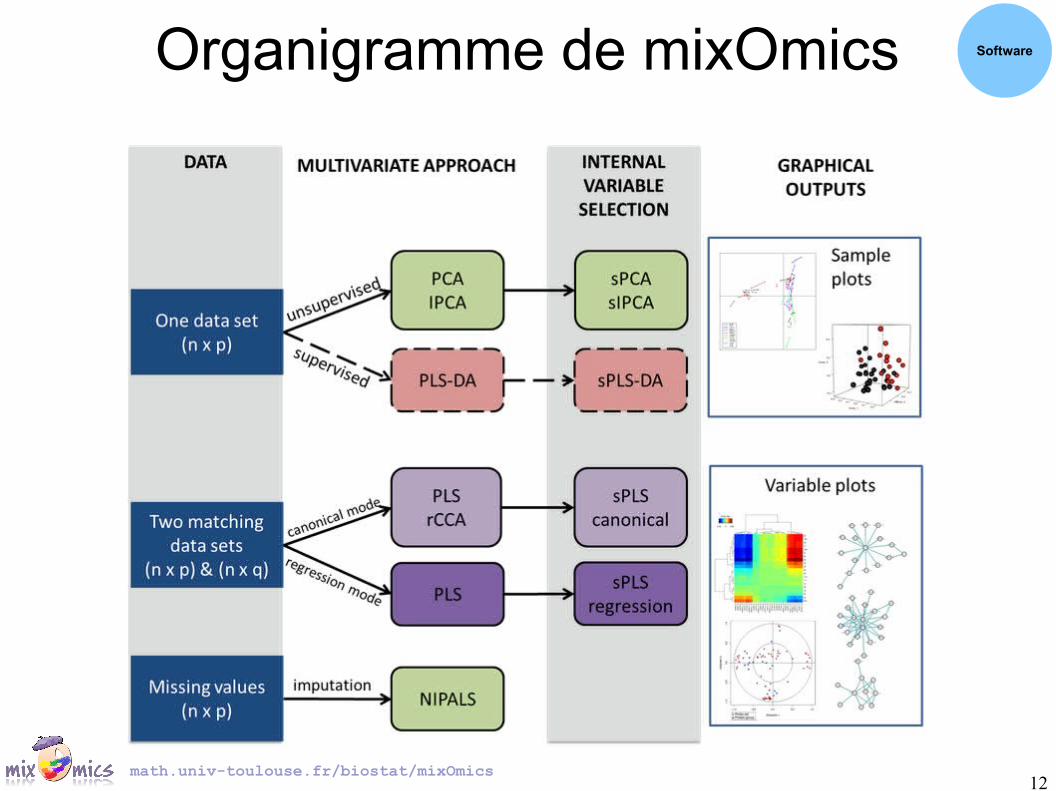
Organigramme de mixOmics Software
13math.univ-toulouse.fr/biostat/mixOmics
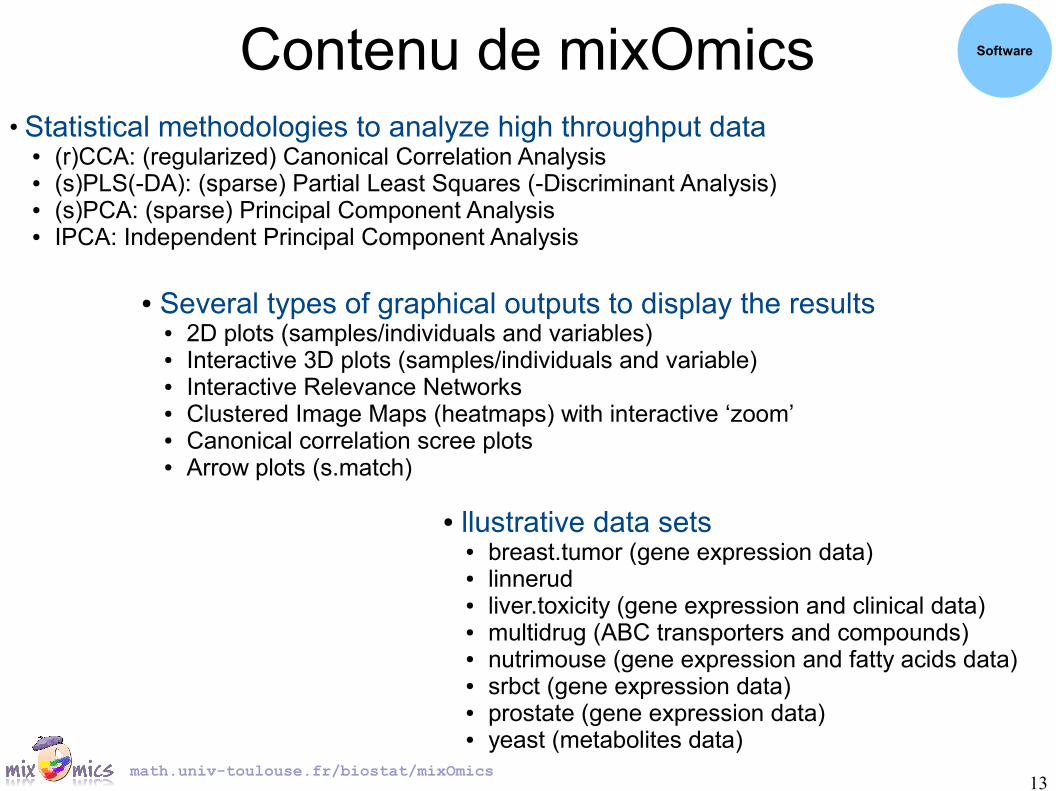
Contenu de mixOmics Software
● Statistical methodologies to analyze high throughput data● (r)CCA: (regularized) Canonical Correlation Analysis● (s)PLS(-DA): (sparse) Partial Least Squares (-Discriminant Analysis)● (s)PCA: (sparse) Principal Component Analysis● IPCA: Independent Principal Component Analysis
● llustrative data sets● breast.tumor (gene expression data)● linnerud● liver.toxicity (gene expression and clinical data)● multidrug (ABC transporters and compounds)● nutrimouse (gene expression and fatty acids data)● srbct (gene expression data)● prostate (gene expression data)● yeast (metabolites data)
● Several types of graphical outputs to display the results● 2D plots (samples/individuals and variables)● Interactive 3D plots (samples/individuals and variable)● Interactive Relevance Networks● Clustered Image Maps (heatmaps) with interactive ‘zoom’● Canonical correlation scree plots● Arrow plots (s.match)
14math.univ-toulouse.fr/biostat/mixOmics
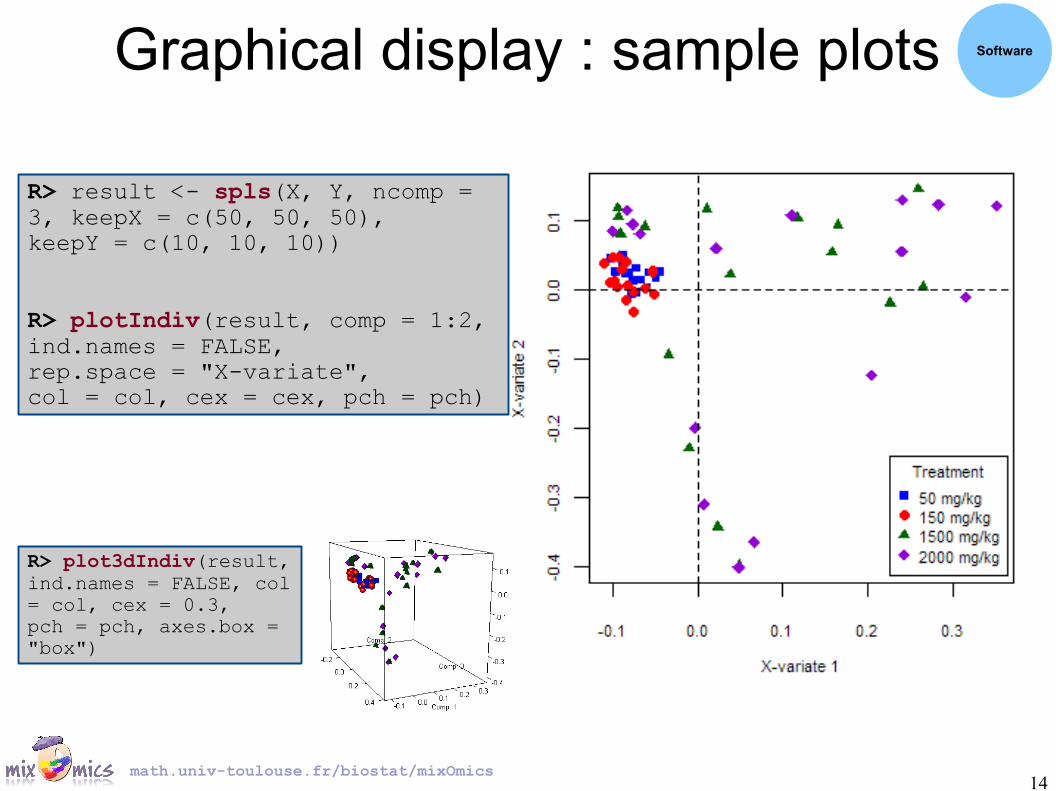
Graphical display : sample plots Software
R> result <- spls(X, Y, ncomp = 3, keepX = c(50, 50, 50),keepY = c(10, 10, 10))
R> plotIndiv(result, comp = 1:2, ind.names = FALSE,rep.space = "X-variate",col = col, cex = cex, pch = pch)
R> plot3dIndiv(result, ind.names = FALSE, col = col, cex = 0.3,pch = pch, axes.box = "box")
15math.univ-toulouse.fr/biostat/mixOmics
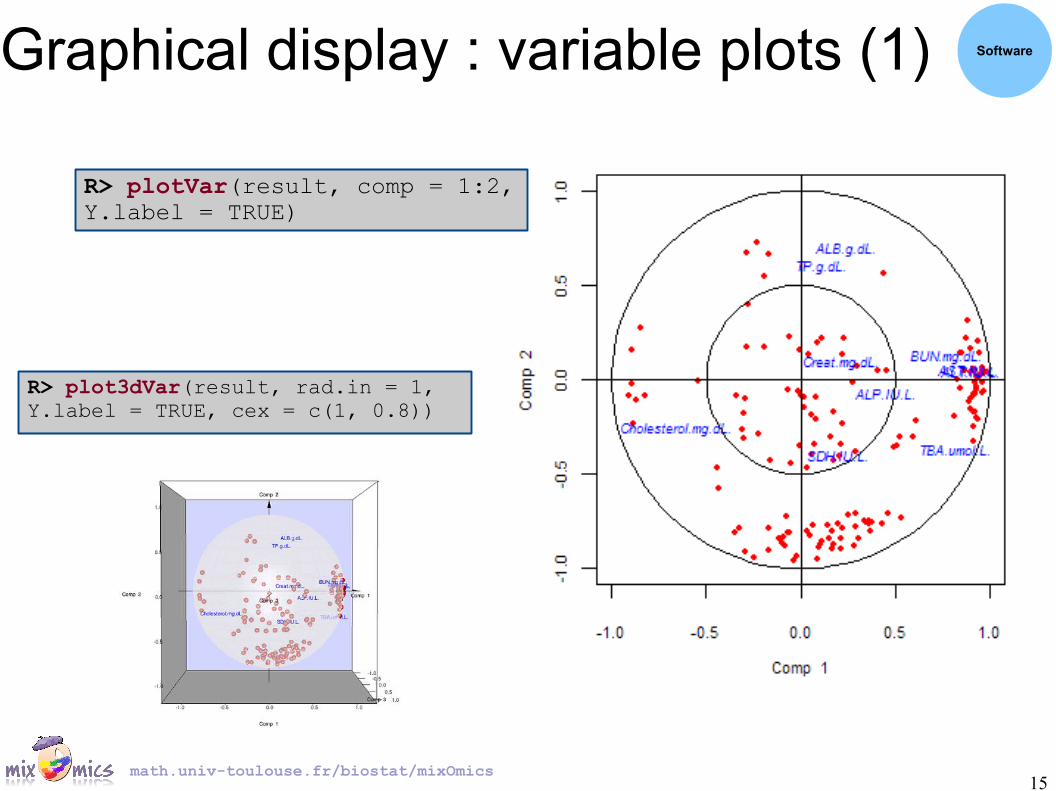
Graphical display : variable plots (1) Software
R> plotVar(result, comp = 1:2, Y.label = TRUE)
R> plot3dVar(result, rad.in = 1, Y.label = TRUE, cex = c(1, 0.8))
16math.univ-toulouse.fr/biostat/mixOmics
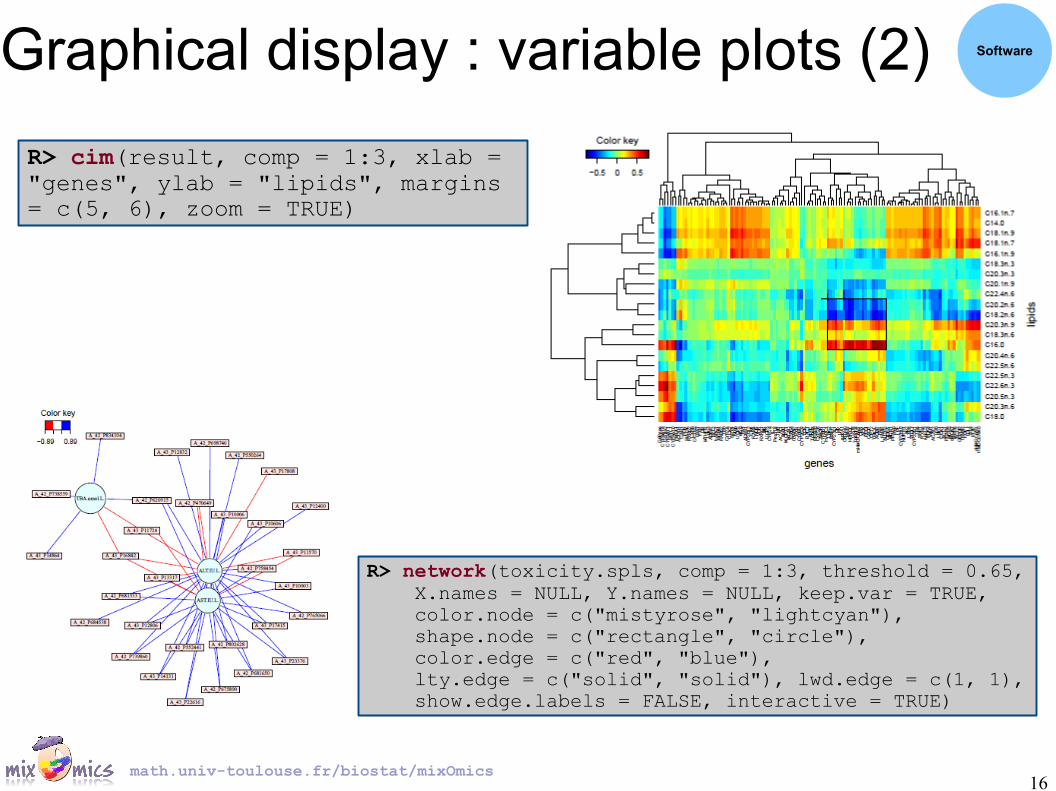
Graphical display : variable plots (2) Software
R> cim(result, comp = 1:3, xlab = "genes", ylab = "lipids", margins = c(5, 6), zoom = TRUE)
R> network(toxicity.spls, comp = 1:3, threshold = 0.65, X.names = NULL, Y.names = NULL, keep.var = TRUE, color.node = c("mistyrose", "lightcyan"), shape.node = c("rectangle", "circle"), color.edge = c("red", "blue"), lty.edge = c("solid", "solid"), lwd.edge = c(1, 1), show.edge.labels = FALSE, interactive = TRUE)
17math.univ-toulouse.fr/biostat/mixOmics
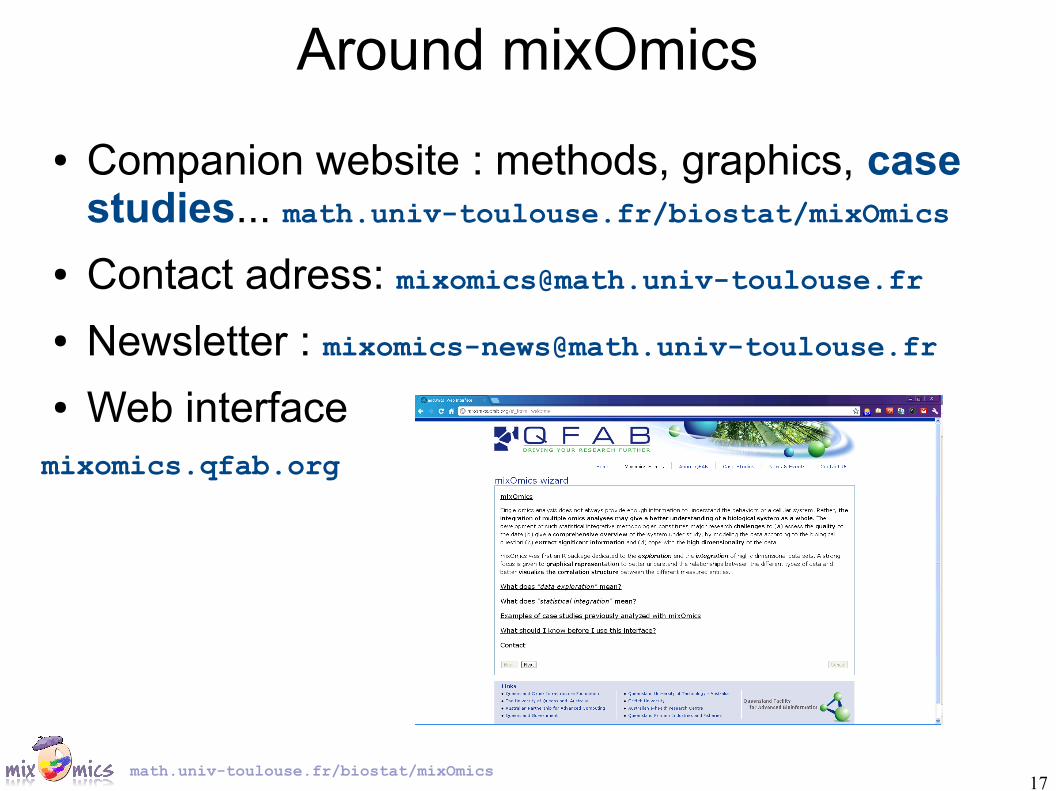
Around mixOmics● Companion website : methods, graphics, case
studies... math.univ-toulouse.fr/biostat/mixOmics● Contact adress: [email protected]● Newsletter : [email protected]● Web interfacemixomics.qfab.org
18math.univ-toulouse.fr/biostat/mixOmics
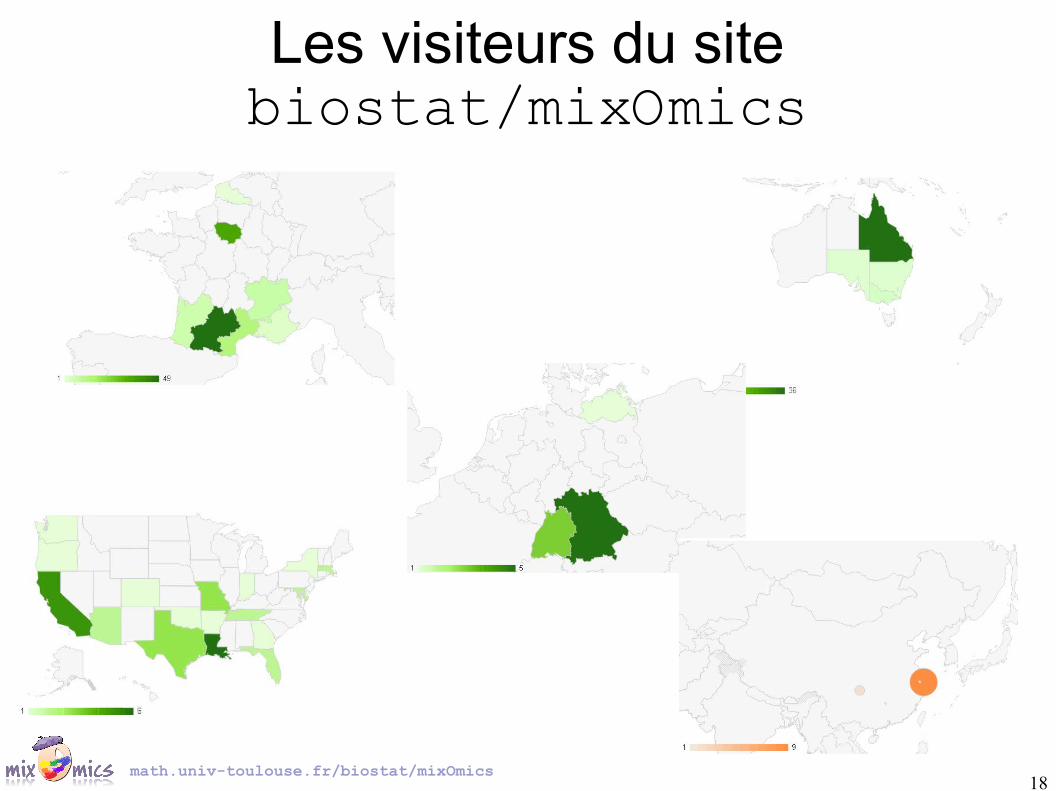
Les visiteurs du site biostat/mixOmics

19math.univ-toulouse.fr/biostat/mixOmics
ContributeursThe mixOmics team (mixomics@math...)
Sébastien Déjean (UPS, Institut de Mathématiques)Ignacio González (Plateforme Biostatistique)Kim-Anh Lê Cao (Queensland Facility for Advanced Bioinformatics)Xin-Yi Chua (Queensland Facility for Advanced Bioinformatics)
Collaborators and Contributors
Philippe Besse (INSA, Institut de Mathématiques)Christele Robert-Granié (INRA, Station d’Amélioration Génétique Animale)Alain Baccini (UPS, Institut de Mathématiques)Pascal Martin (INRA, Unité ToxAlim)Benoit Liquet (Université de Bordeaux)
Students
Pierre Monget, Leigh Coonan, Fangzhou Yao, Zhilun Xu, Jeff Coquery...