Embed Size (px)
DESCRIPTION
Maroc
Citation preview
Insight Report
Klaus Schwab, World Economic Forum
The GlobalCompetitiveness Report2015–2016

The Global Competitiveness Report 2015–2016 | xv
Note: The Global Competitiveness Index captures the fundamentals of an economy. Recent developments, including currency (e.g., Switzerland) and commodity price fluctuations (e.g., Azerbaijan, Qatar, Saudi Arabia), geopolitical uncertainties (e.g., Ukraine), and security issues (e.g., Turkey) must be kept in mind when interpreting the results.
1 Scale ranges from 1 to 7.2 This shows the rank out of the 144 economies in the GCI 2014–2015.3 The trend line shows the evolution in percentile rank since 2007; breaks in the trend line reflect years when the economy was not included in the GCI.
Economy Score1 Prev.2 Trend3
Switzerland 5.76 1
Singapore 5.68 2
United States 5.61 3
Germany 5.53 5
Netherlands 5.50 8
Japan 5.47 6
Hong Kong SAR 5.46 7
Finland 5.45 4
Sweden 5.43 10
United Kingdom 5.43 9
Norway 5.41 11
Denmark 5.33 13
Canada 5.31 15
Qatar 5.30 16
Taiwan, China 5.28 14
New Zealand 5.25 17
United Arab Emirates 5.24 12
Malaysia 5.23 20
Belgium 5.20 18
Luxembourg 5.20 19
Australia 5.15 22
France 5.13 23
Austria 5.12 21
Ireland 5.11 25
Saudi Arabia 5.07 24
Korea, Rep. 4.99 26
Israel 4.98 27
China 4.89 28
Iceland 4.83 30
Estonia 4.74 29
Czech Republic 4.69 37
Thailand 4.64 31
Spain 4.59 35
Kuwait 4.59 40
Chile 4.58 33
Lithuania 4.55 41
Indonesia 4.52 34
Portugal 4.52 36
Bahrain 4.52 44
Azerbaijan 4.50 38
Poland 4.49 43
Kazakhstan 4.49 50
Italy 4.46 49
Latvia 4.45 42
Russian Federation 4.44 53
Mauritius 4.43 39
Philippines 4.39 52
Economy Score1 Prev.2 Trend3
El Salvador 3.87 84
Zambia 3.87 96
Seychelles 3.86 92
Dominican Republic 3.86 101
Kenya 3.85 90
Nepal 3.85 102
Lebanon 3.84 113
Kyrgyz Republic 3.83 108
Gabon 3.83 106
Mongolia 3.81 98
Bhutan 3.80 103
Argentina 3.79 104
Bangladesh 3.76 109
Nicaragua 3.75 99
Ethiopia 3.75 118
Senegal 3.73 112
Bosnia & Herzegovina 3.71 n/a
Cape Verde 3.70 114
Lesotho 3.70 107
Cameroon 3.69 116
Uganda 3.66 122
Egypt 3.66 119
Bolivia 3.60 105
Paraguay 3.60 120
Ghana 3.58 111
Tanzania 3.57 121
Guyana 3.56 117
Benin 3.55 n/a
Gambia, The 3.48 125
Nigeria 3.46 127
Zimbabwe 3.45 124
Pakistan 3.45 129
Mali 3.44 128
Swaziland 3.40 123
Liberia 3.37 n/a
Madagascar 3.32 130
Myanmar 3.32 134
Venezuela 3.30 131
Mozambique 3.20 133
Haiti 3.18 137
Malawi 3.15 132
Burundi 3.11 139
Sierra Leone 3.06 138
Mauritania 3.03 141
Chad 2.96 143
Guinea 2.84 144
Economy Score1 Prev.2 Trend3
Malta 4.39 47
South Africa 4.39 56
Panama 4.38 48
Turkey 4.37 45
Costa Rica 4.33 51
Romania 4.32 59
Bulgaria 4.32 54
India 4.31 71
Vietnam 4.30 68
Mexico 4.29 61
Rwanda 4.29 62
Slovenia 4.28 70
Macedonia, FYR 4.28 63
Colombia 4.28 66
Oman 4.25 46
Hungary 4.25 60
Jordan 4.23 64
Cyprus 4.23 58
Georgia 4.22 69
Slovak Republic 4.22 75
Sri Lanka 4.21 73
Peru 4.21 65
Montenegro 4.20 67
Botswana 4.19 74
Morocco 4.17 72
Uruguay 4.09 80
Iran, Islamic Rep. 4.09 83
Brazil 4.08 57
Ecuador 4.07 n/a
Croatia 4.07 77
Guatemala 4.05 78
Ukraine 4.03 76
Tajikistan 4.03 91
Greece 4.02 81
Armenia 4.01 85
Lao PDR 4.00 93
Moldova 4.00 82
Namibia 3.99 88
Jamaica 3.97 86
Algeria 3.97 79
Honduras 3.95 100
Trinidad and Tobago 3.94 89
Cambodia 3.94 95
Côte d’Ivoire 3.93 115
Tunisia 3.93 87
Albania 3.93 97
Serbia 3.89 94
Emerging and Developing Asia
1
10
19
28
37
46
4
13
22
31
40
7
16
25
34
43
2
11
20
29
38
47
5
14
23
32
41
8
17
26
35
44
3
12
21
30
39
6
15
24
33
42
9
18
27
36
45
99
108
117
120
126
135
102
111
129
138
105
114
123
132
100
118
127
136
103
112
121
130
139
106
115
124
133
101
110
119
128
137
104
113
122
131
140
107
116
125
134
97
95
98
96
109
50
59
68
77
86
53
62
71
80
89
56
65
74
83
92
51
60
69
78
54
72
81
90
57
66
75
93
52
61
70
79
88
55
64
73
82
91
58
67
76
85
94
84
48
63
87
49
Advanced Economies
Middle East, North Africa, and Pakistan
Latin America and the Caribbean
Commonwealth of Independent States
Emerging and Developing Europe
!"#$%#&'()*)+'
!"#$%#&'()*)+'
!"#$%#&'()*)+'
!"#$%#&'()*)+'
!"#$%#&'()*)+'
!"#$%#&'()*)+'
!"#$%#&'()*)+'
!"#$%#&'()*)+'
!"#$%#&'()*)+'!"#$%#&'()*)+'
The Global Competitiveness Index 2015–2016 Rankings
Sub-Saharan Africa
© 2015 World Economic Forum

0 5 10 15 20 25 30
0
3,000
6,000
9,000
12,000
15,000
Institutions
Infrastructure
Macroeconomic environment
Health and primary
education
Higher education and training
Goods market efficiency
Labor market efficiency
Financial market development
Technological readiness
Market size
Business sophistication
Innovation
1
2
3
4
5
6
7
Key indicators, 2014
Population (millions) ........................................ 33.2GDP (US$ billions) ........................................ 109.2GDP per capita (US$) ................................... 3,291GDP (PPP) as share (%) of world total ............ 0.23
Global Competitiveness Index
GCI 2015–2016 ...................................................... 72 ..... 4.2GCI 2014–2015 (out of 144) ..................................... 72 ......4.2GCI 2013–2014 (out of 148) ..................................... 77 ......4.1GCI 2012–2013 (out of 144) ..................................... 70 ......4.1
Basic requirements (40.0%) .......................................55 ......4.71st pillar: Institutions ................................................. 47 ......4.22nd pillar: Infrastructure ............................................ 55 ......4.33rd pillar: Macroeconomic environment .................... 58 ......4.84th pillar: Health and primary education ................... 77 ......5.6
Efficiency enhancers (50.0%) .....................................82 ......3.95th pillar: Higher education and training ................. 106 ......3.46th pillar: Goods market efficiency ............................ 64 ......4.37th pillar: Labor market efficiency ........................... 123 ......3.68th pillar: Financial market development ................... 70 ......3.99th pillar: Technological readiness ............................ 78 ......3.610th pillar: Market size.............................................. 53 ......4.3
Innovation and sophistication factors (10.0%) ...........92 ......3.411th pillar: Business sophistication .......................... 82 ......3.812th pillar: Innovation ............................................... 98 ......3.1
The most problematic factors for doing business
Access to financing ...........................................................17.9
Inefficient government bureaucracy ...................................15.6
Corruption .........................................................................12.2
Inadequately educated workforce ......................................11.2
Tax rates ............................................................................10.0
Insufficient capacity to innovate ...........................................7.0
Restrictive labor regulations .................................................5.4
Inadequate supply of infrastructure ......................................4.8
Complexity of tax regulations ...............................................4.7
Poor work ethic in labor force ..............................................4.4
Foreign currency regulations ................................................4.1
Inflation ................................................................................1.0
Poor public health ...............................................................1.0
Crime and theft ...................................................................0.4
Government instability/coups ..............................................0.2
Policy instability ...................................................................0.2
Morocco
Morocco Middle East, North Africa, and Pakistan
GDP (PPP) per capita (int’l $), 1990–2014
Rank Score(out of 140) (1–7)
Score*
2: Country/Economy Profiles
266 | The Global Competitiveness Report 2015–2016
Factordriven
Efficiencydriven
Innovationdriven
1 Transition 1–2 2 Transition
2 –3 3
Stage of development
* From the list of factors, respondents were asked to select the five most problematic for doing business in their country and to rank them between 1 (most problematic) and 5. The score corresponds to the responses weighted according to their rankings.
Morocco Middle East, North Africa, and Pakistan
© 2015 World Economic Forum
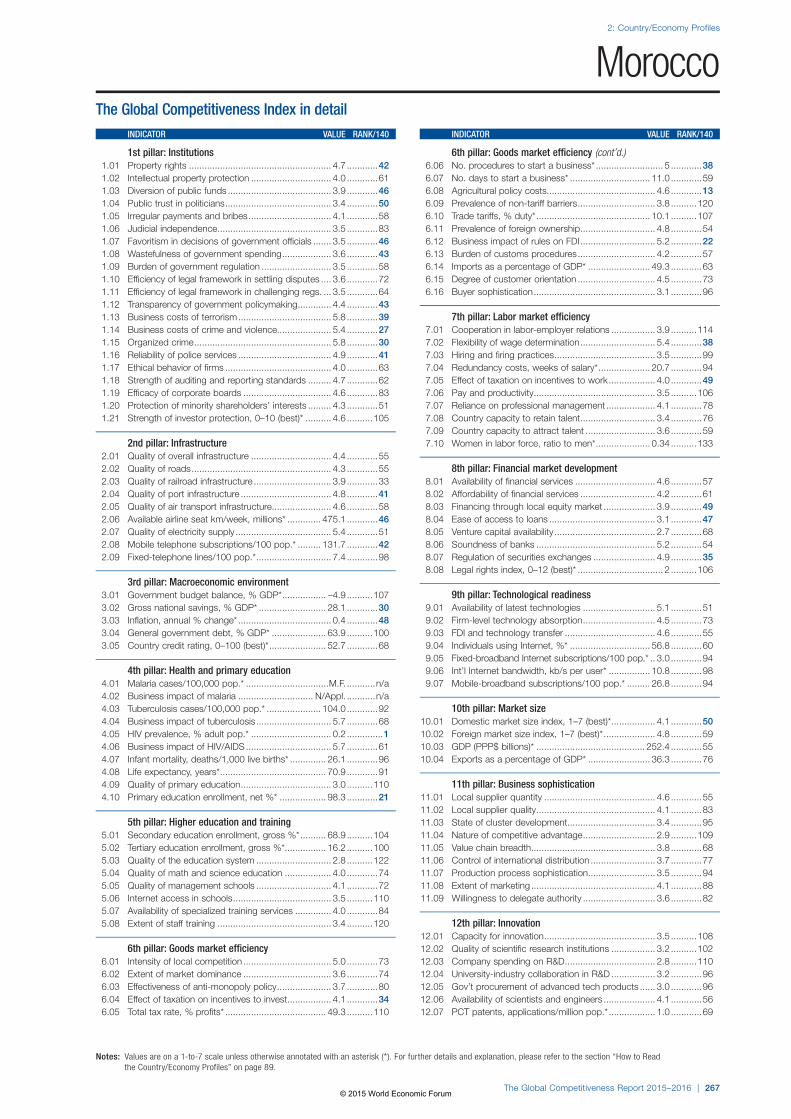
INDICATOR VALUE RANK/140
6th pillar: Goods market efficiency (cont’d.) 6.06 No. procedures to start a business* .......................... 5 ............38 6.07 No. days to start a business* ............................... 11.0 ............59 6.08 Agricultural policy costs.......................................... 4.6 ............13 6.09 Prevalence of non-tariff barriers .............................. 3.8 ..........120 6.10 Trade tariffs, % duty* ............................................ 10.1 ..........107 6.11 Prevalence of foreign ownership ............................. 4.8 ............54 6.12 Business impact of rules on FDI ............................. 5.2 ............22 6.13 Burden of customs procedures .............................. 4.2 ............57 6.14 Imports as a percentage of GDP* ........................ 49.3 ............63 6.15 Degree of customer orientation .............................. 4.5 ............73 6.16 Buyer sophistication ............................................... 3.1 ............96
7th pillar: Labor market efficiency 7.01 Cooperation in labor-employer relations ................. 3.9 ..........114 7.02 Flexibility of wage determination ............................. 5.4 ............38 7.03 Hiring and firing practices ....................................... 3.5 ............99 7.04 Redundancy costs, weeks of salary* .................... 20.7 ............94 7.05 Effect of taxation on incentives to work .................. 4.0 ............49 7.06 Pay and productivity ............................................... 3.5 ..........106 7.07 Reliance on professional management ................... 4.1 ............78 7.08 Country capacity to retain talent ............................. 3.4 ............76 7.09 Country capacity to attract talent ........................... 3.6 ............59 7.10 Women in labor force, ratio to men* ..................... 0.34 ..........133
8th pillar: Financial market development 8.01 Availability of financial services ............................... 4.6 ............57 8.02 Affordability of financial services ............................. 4.2 ............61 8.03 Financing through local equity market .................... 3.9 ............49 8.04 Ease of access to loans ......................................... 3.1 ............47 8.05 Venture capital availability ....................................... 2.7 ............68 8.06 Soundness of banks .............................................. 5.2 ............54 8.07 Regulation of securities exchanges ........................ 4.9 ............35 8.08 Legal rights index, 0–12 (best)* ................................. 2 ..........106
9th pillar: Technological readiness 9.01 Availability of latest technologies ............................ 5.1 ............51 9.02 Firm-level technology absorption ............................ 4.5 ............73 9.03 FDI and technology transfer ................................... 4.6 ............55 9.04 Individuals using Internet, %* ............................... 56.8 ............60 9.05 Fixed-broadband Internet subscriptions/100 pop.* .. 3.0 ............94 9.06 Int’l Internet bandwidth, kb/s per user* ................ 10.8 ............98 9.07 Mobile-broadband subscriptions/100 pop.* ......... 26.8 ............94
10th pillar: Market size 10.01 Domestic market size index, 1–7 (best)* ................. 4.1 ............50 10.02 Foreign market size index, 1–7 (best)* .................... 4.8 ............59 10.03 GDP (PPP$ billions)* .......................................... 252.4 ............55 10.04 Exports as a percentage of GDP* ........................ 36.3 ............76
11th pillar: Business sophistication 11.01 Local supplier quantity ........................................... 4.6 ............55 11.02 Local supplier quality .............................................. 4.1 ............83 11.03 State of cluster development .................................. 3.4 ............95 11.04 Nature of competitive advantage ............................ 2.9 ..........109 11.05 Value chain breadth ................................................ 3.8 ............68 11.06 Control of international distribution ......................... 3.7 ............77 11.07 Production process sophistication .......................... 3.5 ............94 11.08 Extent of marketing ................................................ 4.1 ............88 11.09 Willingness to delegate authority ............................ 3.6 ............82
12th pillar: Innovation 12.01 Capacity for innovation ........................................... 3.5 ..........108 12.02 Quality of scientific research institutions ................. 3.2 ..........102 12.03 Company spending on R&D ................................... 2.8 ..........110 12.04 University-industry collaboration in R&D ................. 3.2 ............96 12.05 Gov’t procurement of advanced tech products ...... 3.0 ............96 12.06 Availability of scientists and engineers .................... 4.1 ............56 12.07 PCT patents, applications/million pop.* .................. 1.0 ............69
INDICATOR VALUE RANK/140
1st pillar: Institutions 1.01 Property rights ....................................................... 4.7 ............42 1.02 Intellectual property protection ............................... 4.0 ............61 1.03 Diversion of public funds ........................................ 3.9 ............46 1.04 Public trust in politicians ......................................... 3.4 ............50 1.05 Irregular payments and bribes ................................ 4.1 ............58 1.06 Judicial independence ............................................ 3.5 ............83 1.07 Favoritism in decisions of government officials ....... 3.5 ............46 1.08 Wastefulness of government spending ................... 3.6 ............43 1.09 Burden of government regulation ........................... 3.5 ............58 1.10 Efficiency of legal framework in settling disputes .... 3.6 ............72 1.11 Efficiency of legal framework in challenging regs. ... 3.5 ............64 1.12 Transparency of government policymaking ............. 4.4 ............43 1.13 Business costs of terrorism .................................... 5.8 ............39 1.14 Business costs of crime and violence..................... 5.4 ............27 1.15 Organized crime ..................................................... 5.8 ............30 1.16 Reliability of police services .................................... 4.9 ............41 1.17 Ethical behavior of firms ......................................... 4.0 ............63 1.18 Strength of auditing and reporting standards ......... 4.7 ............62 1.19 Efficacy of corporate boards .................................. 4.6 ............83 1.20 Protection of minority shareholders’ interests ......... 4.3 ............51 1.21 Strength of investor protection, 0–10 (best)* .......... 4.6 ..........105
2nd pillar: Infrastructure 2.01 Quality of overall infrastructure ............................... 4.4 ............55 2.02 Quality of roads ...................................................... 4.3 ............55 2.03 Quality of railroad infrastructure .............................. 3.9 ............33 2.04 Quality of port infrastructure ................................... 4.8 ............41 2.05 Quality of air transport infrastructure....................... 4.6 ............58 2.06 Available airline seat km/week, millions* ............. 475.1 ............46 2.07 Quality of electricity supply ..................................... 5.4 ............51 2.08 Mobile telephone subscriptions/100 pop.* ......... 131.7 ............42 2.09 Fixed-telephone lines/100 pop.* ............................. 7.4 ............98
3rd pillar: Macroeconomic environment 3.01 Government budget balance, % GDP* ................. –4.9 ..........107 3.02 Gross national savings, % GDP* .......................... 28.1 ............30 3.03 Inflation, annual % change* .................................... 0.4 ............48 3.04 General government debt, % GDP* ..................... 63.9 ..........100 3.05 Country credit rating, 0–100 (best)* ...................... 52.7 ............68
4th pillar: Health and primary education 4.01 Malaria cases/100,000 pop.* ................................M.F. ...........n/a 4.02 Business impact of malaria ............................. N/Appl. ...........n/a 4.03 Tuberculosis cases/100,000 pop.* ..................... 104.0 ............92 4.04 Business impact of tuberculosis ............................. 5.7 ............68 4.05 HIV prevalence, % adult pop.* ............................... 0.2 ..............1 4.06 Business impact of HIV/AIDS ................................. 5.7 ............61 4.07 Infant mortality, deaths/1,000 live births* .............. 26.1 ............96 4.08 Life expectancy, years* ......................................... 70.9 ............91 4.09 Quality of primary education ................................... 3.0 ..........110 4.10 Primary education enrollment, net %* .................. 98.3 ............21
5th pillar: Higher education and training 5.01 Secondary education enrollment, gross %* .......... 68.9 ..........104 5.02 Tertiary education enrollment, gross %*................ 16.2 ..........100 5.03 Quality of the education system ............................. 2.8 ..........122 5.04 Quality of math and science education .................. 4.0 ............74 5.05 Quality of management schools ............................. 4.1 ............72 5.06 Internet access in schools ...................................... 3.5 ..........110 5.07 Availability of specialized training services .............. 4.0 ............84 5.08 Extent of staff training ............................................ 3.4 ..........120
6th pillar: Goods market efficiency 6.01 Intensity of local competition .................................. 5.0 ............73 6.02 Extent of market dominance .................................. 3.6 ............74 6.03 Effectiveness of anti-monopoly policy ..................... 3.7 ............80 6.04 Effect of taxation on incentives to invest ................. 4.1 ............34 6.05 Total tax rate, % profits* ....................................... 49.3 ..........110
Morocco
Notes: Values are on a 1-to-7 scale unless otherwise annotated with an asterisk (*). For further details and explanation, please refer to the section “How to Read the Country/Economy Profiles” on page 89.
The Global Competitiveness Index in detail
The Global Competitiveness Report 2015–2016 | 267
2: Country/Economy Profiles
© 2015 World Economic Forum