Embed Size (px)
Citation preview
Do yield curves normally slope up?The term structure of interest rates, 1862-1982
John H. Wood
The downward-sloping yield curves of recentyears have been called perverse, but an examina-tion of the history of American interest ratesreveals that, at least since the Civil War, fallingyield curves have been nearly as common asthose with upward slopes. This article summar-izes yield curve patterns since 1862 and suggeststhat (1) the traditional expectations theoryremains a viable explanation of observed yieldcurves and (2) yield curves since the abandon-ment of the gold standard in 1971 have much incommon with those of the greenback era of1862-78 but are distinct from those of the goldstandard years of 1879-1970. The slopes of yieldcurves appear to depend upon expectations offuture yields as determined by expectations ofinflation, which, in turn, depend upon the pre-vailing monetary standard.
U.S. yield curves in the 20th century
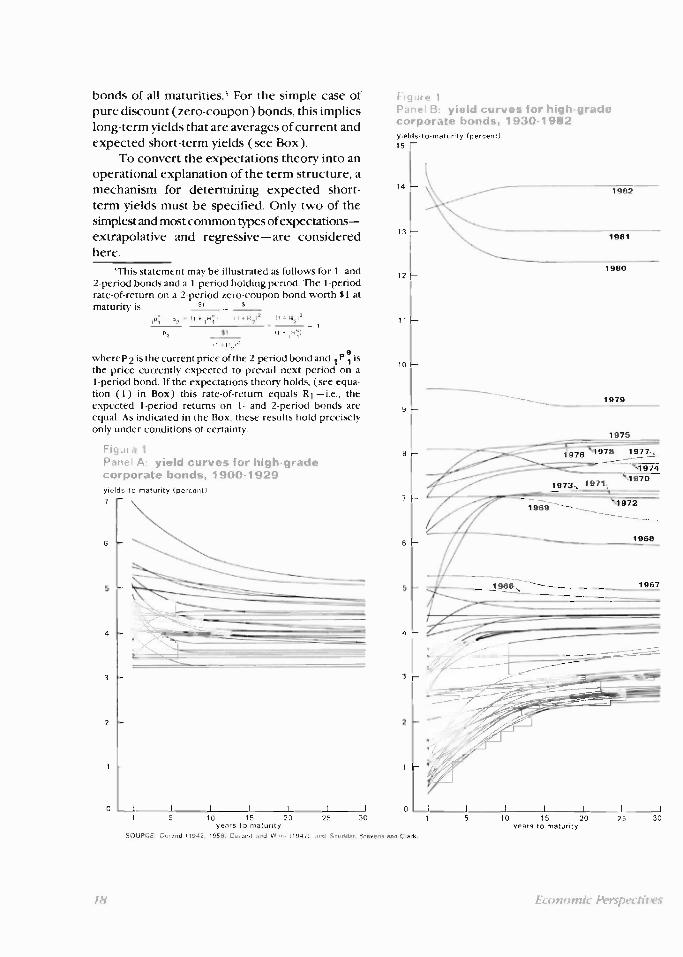
Yield curves for high-grade corporate bondsfrom 1900 to 1982 are shown in the two panelsof Figure 1.' Each curve shows the term struc-ture of yields in a particular year, i.e., the rela-tionship between bond yields and terms tomaturity at a point in time. Panel A shows yieldcurves for the period prior to 1930. Yield curves
John H. Wood is a Professor of Finance at NorthwesternUniversity and is currently on leave at the Federal ReserveBank of Dallas. This paper was written while the author was aconsultant for the Federal Reserve Bank of Chicago and ispart of a larger study being conducted with Scott Ulman.
'Data are David Durand's "basic yields on high-gradecorporate bonds," first published in 1942, updated byDurand and Winn to 1959, and updated since 1959 byScudder, Stevens and Clark. Selected data are available for1900-1970 in the U.S. Department of Commerce, HistoricalStatistics of the United States, Vol. 2, p. 1004, and morerecently in the annual Statistical Abstract of the UnitedStates. Ruth Heisler of Scudder, Stevens and Clark has kindlysupplied data for 1982. A detailed account of the method bywhich the yield curves in Figure 1 were constructed is givenin Durand [1942].
Federal Reserve Bank of Chicago
for 1930 through 1982 are shown in Panel B.Curves since 1966 have been identified by yearof occurrence.
A striking feature of the yield curves in Fig-ure 1 is their tendency to be positively slopedwhen yields are "low" and to be negativelysloped when yields are "high." Suppose, forexample, that between 1900 and 1970 one-yearbond yields above 4.40 percent were consideredhigh and yields below 3.25 percent were thoughtto be low. The upper portion of Table 1 showsthat if "high" and "low" are distinguished in thismanner all yield curves had negative slopeswhen short-term yields were high and all yieldcurves had positive slopes when short-termyields were low.
This observation applies throughout the1900-1970 period, but breaks down after 1970.In order to understand yield patterns since 1970,it is first necessary to examine a popular andpersuasive explanation of the shapes of observedyield curves.
An explanation: the traditionalexpectations theory with regressiveexpectations2
Any theory of equilibrium relations amongbond yields must specify (1) the criteria bywhich investors select bonds given their expec-tations of future yields and (2) how thoseexpectations are formed. With regard to (1), thetraditional expectations theory of the term struc-ture of interest rates asserts that bond-marketequilibrium requires equal expected returns on
2The "traditional" and other expectations theories,most notably the "modern" expectations theory, are com-pared in Cox, Ingersoll, and Ross [1981]. An early statementof the traditional expectations theory with regressive expec-tations was that of Lutz [1937].
17
14
13
12
a—
7 —
6 —
5 --
4 —
3 —
—
1 —
11
10 F-
6
5
4
3
2
0
bonds of all maturities.' For the simple case ofpure discount (zero-coupon) bonds, this implieslong-term yields that are averages of current andexpected short-term yields (see Box).
To convert the expectations theory into anoperational explanation of the term structure, amechanism for determining expected short-term yields must be specified. Only two of thesimplest and most common types of expectations—extrapolative and regressive—are consideredhere.3 This statement may be illustrated as follows for 1- and2-period bonds and a 1-period holding period. The 1-periodrate-of-return on a 2-period zero-coupon bond worth 81 atmaturity is 31 Si
- per 1 1 r ,4171 11 +f4,1 2 11+ 9212
51 I1 s F./1
,•
where p 2 is the current price of the 2-period bond and 1 P e1isthe price currently expected to prevail next period on a1-period bond. If the expectations theory holds, (see equa-tion (1) in Box) this rate-of-return equals R 1 —i.e., theexpected 1-period returns on 1- and 2-period bonds areequal. As indicated in the Box, these results hold preciselyonly under conditions of certainty.
FigurePanel k yield curves for high-gradecorporate bonds, 1900-1929
yields-to-maturity (percent)
Figure 1
Panel B: yield curves for high-gradecorporate bonds, 1930-1982
yields to maturity (percent)
15
1981
1980
1979
9
1981
I I I I 1 I I 0 I I I I I I I II 5 10 15 20 25 30 1 5 10 15 20 25 30
years to maturity years to maturitySOURCE Durand 11942 1958, Durand and Winn ( 947) and Scudder Stevens and Clark,
18 Economic Perspectives
"The traditional expectations theoryof the term structure
The equilibrium term structure is
(1) (1+Fi n ) n = (1+R1)(11-1R7)(1+2R7)
• • (1+n-1 i),
where R 1 and 120 are the yields-to-maturitycurrently prevailing on bonds maturing after oneand n periods, respectively, and
R e are the one-periodRev 2 RI' ' ' ' 'yields currently expected by investors to prevailone, two, . . , and ( n-11 periods in thr future.
A convenient linear approximation of theequilibrium term structure describes long-termyields as arithmetic averages, instead of geometricaverages as in equation ( ), of current and expectedshort-term yields:
R 1 + 1 Re1 2R1 " . 11-1131(2) R =n
This approximation deteriorates as short and long
(
yields diverge. For example, let % be the approxi-mate two-period yield given by equation ( 2 ). Then
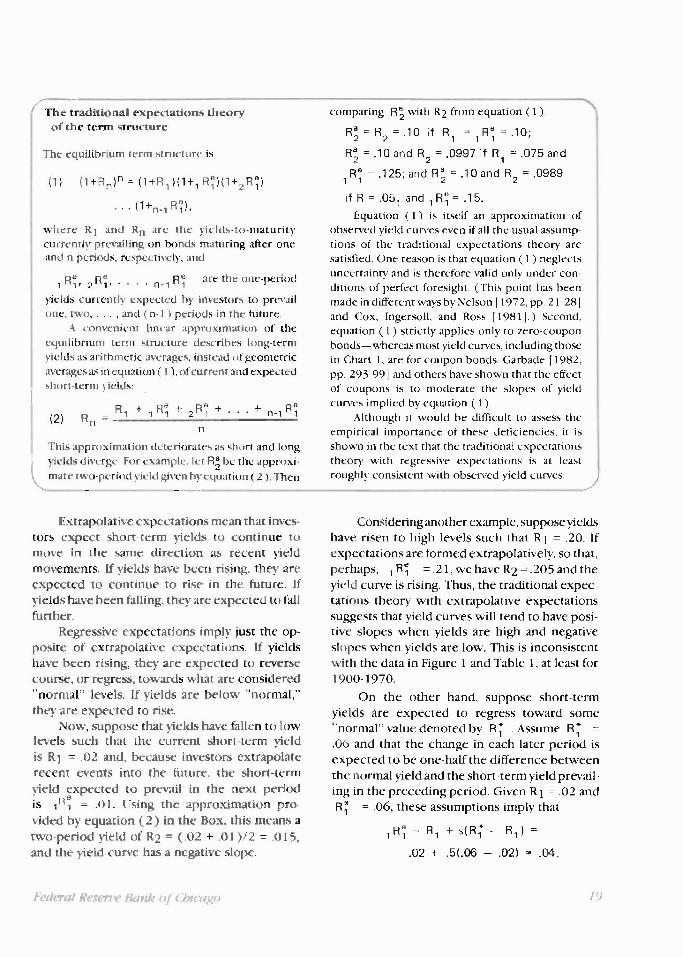
Extrapolative expectations mean that inves-tors expect short-term yields to continue tomove in the same direction as recent yieldmovements. If yields have been rising, they areexpected to continue to rise in the future. Ifyields have been falling, they are expected to fallfurther.
Regressive expectations imply just the op-posite of extrapolative expectations. If yieldshave been rising, they are expected to reversecourse, or regress, towards what are considered"normal" levels. If yields are below "normal,"they are expected to rise.
Now, suppose that yields have fallen to lowlevels such that the current short-term yieldis R1 = .02 and, because investors extrapolaterecent events into the future, the short-termyield expected to prevail in the next periodis / n 1 = .01. Using the approximation pro-vided by equation (2) in the Box, this means atwo-period yield of R2 = (.02 + .01)/2 = .015,and the yield curve has a negative slope.
Federal Reserve Bank of Chicago
comparing R e2 with R2 from equation (I).
R2 = R 2 = .10 if R 1 = 1 R ei = .10;
= .10 and R 2 = .0997 if R i = .075 and
Re = .125; and R a = .10 and R 2 = .09891 2
if R = .05 1 and Fri .15.
Equation (1) is itself an approximation ofobserved yield curves even if all the usual assump-tions of the traditional expectations theory aresatisfied. One reason is that equation (1) neglectsuncertainty and is therefore valid only under con-ditions of perfect foresight. (This point has beenmade in different ways by Nelson [1972, pp. 21-281and Cox, Ingersoll, and Ross [19811.) Second,equation (1) strictly applies only to zero-couponbonds—whereas most yield curves, including thosein Chart 1, are for coupon bonds. Garbade 11982,pp. 293-991 and others have shown that the effectof coupons is to moderate the slopes of yieldcurves implied by equation (I).
Although it would be difficult to assess theempirical importance of these deficiencies, it isshown in the text that the traditional expectationstheory with regressive expectations is at leastroughly consistent with observed yield curves. j
Considering another example, suppose yieldshave risen to high levels such that R 1 = .20. Ifexpectations are formed extrapolatively, so that,perhaps, 1 R i = .21, we have R2 = .205 and theyield curve is rising. Thus, the traditional expec-tations theory with extrapolative expectationssuggests that yield curves will tend to have posi-tive slopes when yields are high and negativeslopes when yields are low. This is inconsistentwith the data in Figure 1 and Table 1, at least for1900-1970.
On the other hand, suppose short-termyields are expected to regress toward some"normal" value denoted by R *, . Assume R .1* =
.06 and that the change in each later period isexpected to be one-half the difference betweenthe normal yield and the short-term yield prevail-ing in the preceding period. Given R 1 = .02 andR.T = .06, these assumptions imply that
= R i s(R ;R 1 ) =
.02 + .5(.06 — .02) = .04,
19
where s = .5 is the expected speed of adjustment.The resulting yield curve has a positive slopebecause R2 = ( .02 + .04 )/2 = .03. Following thesame procedure and letting R1 = .20, we obtain
Re1 =13 and-.
R2 = .165, so that the yield curve has a negativeslope when R 1 = .20. These examples supportthe view that the traditional expectations theorysupplemented by regressive expectations is con-sistent with observed yield curves, at least during1900-1970.4
An upward revision of expectationsin the 1970s?
The upper portion of Table 1 suggests thatyield curves between 1900 and 1970 were con-sistent with the traditionalexpectations theory with re-gressive expectations, if thenormal one-year, high-gradecorporate bond yield wasthought by investors to bebetween 3.25 and 4.40 per-cent. But notice the high andrising yield curves for1978 and 1982 in Figure 1.Either (1) the explanationthat is so effective for 1900-1970 has failed in recentyears because investors nolonger behave according tothe tenets of the traditionalexpectations theory and/orthey no longer form expec-tations regressively, or (2 )they have revised their esti-mates of the normal rate.
The extrapolative expectations version ofthe traditional expectations theory appears
'Both extrapolative and regressive expectations may berational in an economy in which yields fluctuate cyclicallyabout "normal" levels, with short-term expectations beingformed extrapolatively and lung-term expectations beingformed regressively. Possible examples of the interaction ofextrapolative and regressive expectations are the hump-hacked yield curves that are common when yields are high.These humps tend to occur at maturities of 3 to 6 months andthus do not appear in the yield curves of Figure 1, in whichthe shortest maturity is one year.
broadly consistent with the generally risingyields and positively sloped yield curves of 1971-78. But it does not look as promising in light ofthe yield curves of 1979-81, which had negativeslopes during a period of rapidly rising yields. Avariety of other explanations of the events of1971-82 might be worth pursuing, but the analy-sis of this paper will remain with the explanationemphasized thus far—the traditional expecta-tions theory with regressive expectations. Thatis, we will examine the extent to which alterna-tive (2) in the preceding paragraph is capable ofexplaining yield curves since 1971. But thisapproach requires an additional hypothesis, onethat supplies a rule by which investors revisetheir estimates of the normal rate. However,such a rule, whatever it is, cannot be subjected to
Slope of yield curvePositive Flat Negative
1900 - 1970
0 0 20
10 10 5
26 0 0
1971 - 1982
1 0 3
8 a o
any kind of test on the basis of data considered sofar because the only unambiguous 20th centuryrevision or revisions have occurred since about1970. For other possible revisions we must go tothe 19th century.
The 19th and 20th centuries compared
No complete yield curves such as those inFigure 1 are available for the 19th century. How-ever, the slopes of yield curves may be inferred
Table 1
Frequencies of rising, flat, and fallingyield curves. 1900.1992
One-year corporate bond yield(percent per annum)
Above 4.40
3.25 - 4.40
Below 3 25
Above 8.00
Below 8.00
SOURCES: Durand, Durand and Winn, and Scudder, Stevens and Clark.
20 Perspectives

10
9
8
7
6
5
4
3
2
Figure 2Long and short rates, 1862-1929percent
1862 1872 1882 1892 1902 1912 1922 1929SOURCE Macaulay (1938), Table 10
from data on the prime commercial paper rate(the short-term yield ) and Frederick Macaulay'srailroad bond yield index ( the long-term yield ).5Annual averages of commercial paper and rail-road bond yields for 1862-1929 are shown inFigure 2. This figure tells, in a different way,essentially the same stories as Figure 1: first, thatyield curves tended to be positively sloped whenyields were low and negatively sloped whenyields were high and, second, that there wasapparently a revision of the notions of ' 'high"and "low".6 However. instead of an upward revi-
`See Macaulay (1938. Table 10) for data on the unad-justed index of railroad bond yields. "Choice" and "prime"commercialpaper rates, reported on a discount basis. havehen converted to bond equivalent yields. Macaulay tried toconstruct yield curves for railroad bonds like those laterreported by Durand, but he found the correlation betweenyield and maturity too small. However, the use of Macaulay'sdata in Table 2 is consistent with the use of Durand's yieldcurves in Table 1 because Macaulay found that longer-termbonds tended to have higher yields when short-term rates(such as the commercial paper rate) were low and thatshorter-term bonds tended to have higher yields when short-term rates were high (p. HO).
'During 1900-1929, when Figures 1 and 2 overlap, theyield curves implied by the latter figure have the same sign asthose in the former on three-quarters of the occasions onwhich Durand's yield curves are not flat. Furthermore, theslopes implied by Figure 2 tend to be smaller in absolutevalue when Durand's curves are flat than when they havenon-zero slopes.
sion, as in the early 1970s, Figure 2 suggests adownward adjustment of the normal rate in thelate 1870s. Notice, for example, that the sevenshort-term yields between 5.5S percent and 7.55percent during 1866-1875 were all associatedwith rising yield curves, while after those yearsall short-term yields above 5.40 percent wereassociated with falling yield curves.
No precise dating of the normal rate's revi-sion, which may have occurred over severalyears, is immediately obvious from the data.(This is also true of the shift in the 1970s, orperhaps the late 1960s.' But suppose, for sim-plicity of exposition. that most of the adjustmenttook place early in 1879. Using this date to divide1862-1929 into two periods, Table 2 suggeststhat the normal rate may have been in the vicinityof 7.50 percent during 1862-1878 and between4 and 5.50 percent during the 1879-1929period.
What events triggered these upward anddownward revisions in investors' expectationsof normal rates? A look at the histor y of U.S.monetary standards since 1862 may provide ananswer.
Table 2
Frequencies of rising and fallingyield curves, 1862-1929
Commercial paper yield Slope of yield curve(percent per annum) Positive Negative
1862 - 1878
Above 7.57 0 5
Below 7.56 12 0
1879 - 1929
Above 5.40 0 16
4.21 - 5.40 4 17
Below 4.21 14 0
SOURCE. Macaulay, Table 10.
The monetary standard and the yield curve
The American monetary standard has under-gone the following changes since early in the
Federal Reserve Bank of Chic-ago 21

Civil War. The gold standard was abandonedwhen banks suspended specie payments onDecember 30, 1861. 7 In February 1862, Con-gress authorized the first of several issues of legaltender currency (the famous greenbacks). Aftera period of monetary expansion accompanied bydepreciation of the dollar, followed by pro-longed monetary controversy, a bill for theresumption of the gold standard at the prewarexchange rate was passed in January 1875.Resumption was achieved on the target date ofJanuary 1, 1879, although success was notassured until late in 1878.8
The monetary standard remained unchangeduntil banks were legally prohibited from payingout gold in March 1933. The international goldstandard was resumed in January 1934, 9 althoughthe gold value of the dollar was reduced to 59percent of that prevailing between 18'9 and1933. Finally, in August 1971, the United Statessuspended the international convertibility of thedollar and embarked on a paper standard identi-cal in all important respects to the greenback eraof 1862-1878.
The following line of reasoning suggeststhat the monetary standard should be expectedto be an important, perhaps the dominant, influ-ence on the normal rate. First, define the normalrate on securities of a particular risk class as theyield expected by investors to apply to thosesecurities in long-run equilibrium ( Referencesfrom this point are to normal rates instead of toa single normal rate.) Second, the available evi-dence strongly suggests that interest rates are toa considerable extent determined by inflationaryexpectations, which in turn depend on actualinflation.10 Finally, inflation has for centuries
"The official standard was bimetallic, but silver had longceased to circulate because it had been undervalued by theofficial gold-silver exchange rate.
8For example, see Dewey (1936) and Friedman andSchwartz (1963) for histories of American monetary stan-dards.
'The domestic circulation of gold was ended by theGold Reserve Act.
10Most observers, including Fisher (1930) and Fama(1975), would agree with this statement. Sec Wood (1981for a review of empirical work on the connections betweeninterest rates and inflation.
been highly correlated, and generally believedto he highly correlated, with the choice of mone-tary standard.11
These arguments are supported by the datain Charts 1 and 2 and Tables 1 and 2, which arcconsistent with a downward revision in the1870s and an upward revision in the 1970s ofinvestor estimates of normal rates. The rising1982 yield curve suggests that the latter revisionmay not yet be complete. It is not clear from thedata whether another revision occurred in the1930s because the steeply rising yield curves ofthat decade (and of the 1940s and 1950s) were,in view of the record-low yields prevailing at thetime, consistent with normal rates based onexperience of both gold and paper standards."'
The values in Table 2 are not directly com-parable with those in Table 1, because the yieldsin the two tables apply to different securities.Nevertheless, these tables and the figures uponwhich they are based combine to tell a singlestory—that American yield curves since 1862are at least roughly consistent with the tradi-tional expectations theory supplemented byregressive expectations where the normal rate isa function of the monetary standard. That is thehypothesized rule for revising the normal ratethat earlier was declared to be required for acomplete explanation of observed yield curves.
Concluding comment: Inflation and themonetary standard as parts of the samepolitical decision.
The data presented above suggest thatchanges in inflationary expectations arc asso-
"See Attwood ( 1819), Lester ( 1939 ), Dewey ( 1936),Friedman and Schwartz (1963), Barro ( 1980), and Bordo(1981) for discussions of evidence and attitudes regardinginflation under gold and paper standards,
12 In annual averages, American commercial paper yieldshave not, except during 1935-46, been Less than 1 percentand have not, except during 1931-58, been less than 3 per-cent. They were continuously less than 1 percent during1935-46 and continuously less than 3 percent during 1931-55. These statements arc based on data available since 1819in Homer (1977).
22 Economic Perspectives
dated with, and perhaps influenced by, changesin the monetary standard. But it is important tostress that the monetary standard is not imposedupon an economic system from outside. A shiftfrom a fixed-rate to a flexible-rate system, forexample, may be viewed as merely one of severalreflections of a decision by one or more coun-
tries to abandon long-run price stability as a goal.This means that the data contain no implicationsfor monetary policy. The monetary authority isnot free to attempt to influence inflationaryexpectations by manipulating the monetary stan-dard. Both are chosen and imposed upon thecentral bank by the political process.
References
Thomas Attwood, A Second Letter to the kart of Liverpool onthe Bank Reports as Occasioning the National Dangersand Distresses, R. Wrightson, Birmingham, 1819_
Robert J. Barro, "1 .S. Inflation and the Choice of MonetaryStandards," NBER Conference on Inflation, Washing-ton, October 1980.
Michael D. Bordo, "The Classical Gold Standard: Some Les-sons for Today," Federal Reserve Bank of St. LouisReview, May 1981, 2-17.
John C. Cox, Jonathon E. Ingersoll, and Stephen A. Ross, "AReexamination of Traditional Hypotheses About theTerm Structure of Interest Rates,"Journal of Finance,September 1981, 769-99.
Davis R. Dewey, Financial History of the United States, 12thed., Longmans, Green, and Co., New York, 1936.
David Durand, "A Quarterly Series of Corporate Bond Yields,1952-1957, and Some Attendant Reservations," puma/of Finance, September 1958, 348-56.
, Basic Yields of Corporate Winds, 1900-1942,National Bureau of Economic Research, TechnicalPaper 3, 1942.
David Durand and Willis J. Winn, Basic Yields of Bonds,1 927- 1947: Their Measurement and Pattern, NationalBureau of Economic Research, Technical Paper 6,1947.
Eugene F. Fama, "Short-Term Interest Rates as Predictions ofInflation," American Economic Review, June 19'5,269-82.
Irving Fisher, "Appreciation and Interest," Publications ofthe American Economic Association, Vol. II, August1896.
The Theory of Interest, Macmillan, New York,1930.
Milton Friedman and Anna). Schwartz, A Monetary Historyof the United States, 1867-1960, Princeton UniversityPress, Princeton, N.J., 1963.
Kenneth GarbadeSecurities Markets, McGraw-Hill, NewYork, 1982.
Sidney Homer, A History of Interest Rates, 2nd ed., RutgersUniversity Press, New Brunswick, N.J., 1977.
Richard A. Lester, Monetary Experiments, Princeton Univer-sity Press, Princeton, N.J., 1939.
F. A. Lutz "The Structure of Interest Rates," Quarterly Jour-nal of Economics, November 1940. 36-63.
Frederick R. Macaulay, Some Theoretical Problems Sug-gested by the Movements of Interest Rates, Bond Yieldsand Stock Price in the United States Since 1856,National Bureau of Economic Research, New York,1938.
Charles R. Nelson, The Term Structure of Interest Rates,Basic Books, New York, 1972.
lohn H. Wood, "Interest Rates and Inflation," Federal ReserveBank of Chicago Economic Perspectives, May/June1981, 3-12.
Federal Reserve Hank of Chicago 23


![System Design and Locomotion of SUPERball, an Untethered ...best.berkeley.edu/wp-content/uploads/2015/07/ICRA... · of these robots and to validate various aspects of NTRT [7], [5]](https://img.dokumen.tips/doc/110x75/5fbd0547a7cc1c340717804f/system-design-and-locomotion-of-superball-an-untethered-best-of-these-robots.jpg)


