Embed Size (px)
DESCRIPTION
Uploaded from Google Docs
Citation preview

1
A RESEARCH REPORT ON
PROMOTIONAL STRATEGY OF HUL
Research report submitted in the fulfillment of
requirements for the Master of business Administration
(II SEM)
Submitted To:
MISS P.VAKULA
Submitted By:
RAJEEV KUMAR
MBA (II SEM)
DEPARTMENT OF MANAGEMENT STUDIES
CHOUKSEY ENGINEERING COLLEGE,
BILASPUR

2
CERTIFICATE
This is to certify that RAJEEV JHA student of second semester,
Master of Business administration (MBA) has completed the project
report work entitled “PROMOTIONAL STRATEGY OF
HINDUSTAN UNILEVER LTD.” based on syllabus and has
submitted a satisfactory account of his work in this report.
Lecturer
MISS. RUCHI TIWARI
MDITM,INDORE

3
ACKNOWLEDGEMENT
The research on “PROMOTIONAL STRATEGY OF HINDUSTAN
UNILEVER LTD..” has been given to me as part of the curriculum in
the completion of 2-Years Master of business Administration.
I have tried my best to present this information as clearly as possible
using basic terms that I hope will be comprehended by the widest
spectrum of researchers, analysts and students for further studies.
I have completed this project under the able guidance and
supervision of Miss NAMRATA TRIPATHI. I will be failed in my
duty if I do not acknowledge the esteemed scholarly guidance,
assistance and knowledge I have received from them towards fruitful
and timely completion of this work.
We also thanks NIRMA DISTIBUTER & DELER‟S, INDORE who
believed in us and by providing ALL valuable information and data that helped
us in understanding the problem areas of their organization and hence
developing the application as per their requirements.
FROM-
ANSHUL TIWARI

4
INDEX
Sr. No. Contents Page
No.
1. EXECUTIVE SUMMARY
2. INTRODUCTION
3. OBJECTIVE
4. LITERATURE REVIEW (COMPANY
PROFILE)
5. DATA ANALYSIS
6. DATA INTERPRETATION
7. HYPOTHESIS
8. FINDINGS
9. RECOMMENDATIONS
10. CONCLUSION
11. BIBLIOGRAPHY
12. ANNEXURE

5
EXECUTIVE SUMMARY
Hindustan Unilever Limited (HUL) is India's largest fast moving consumer
goods company, with leadership in Home & Personal Care Products and Foods
& Beverages. HUL's brands, spread across 20 distinct consumer categories,
touch the lives of two out of three Indians. They endow the company with a
scale of combined volumes of about 4 million tonnes and sales of nearly
Rs.13,718 crores. The mission that inspires HUL's over 15,000 employees is to
"add vitality to life". With 35 Power Brands, HUL meets everyday needs for
nutrition, hygiene, and personal care with brands that help people feel good,
look good and get more out of life. It is a mission HUL shares with its parent
company, Unilever, which holds 51.55% of the equity. The rest of the
shareholding is distributed among 360,675 individual shareholders and financial
institutions. A Fortune 500 transnational, Unilever sells Foods and Home and
Personal Care brands in about 100 countries worldwide.
HUL is also one of the country's largest exporters; it has been recognised as a
Golden Super Star Trading House by the Government of India.
Over time HUL has developed into a viable & competitive sourcing base for
Unilever world wide in Home and Personal Care & Foods & Beverages
category of products. HUL is also a global marketing arm for select licensed

6
Unilever brands and also works on building categories with core country
advantage such as branded basmati rice.
HUL's brands - like Lifebuoy, Lux, Surf Excel, Rin, Wheel, Fair & Lovely,
Pond's, Sunsilk, Clinic, Pepsodent, Close-up, Lakme, Brooke Bond, Kissan,
Knorr-Annapurna, Kwality Wall's – are household names across the country
and span many categories - soaps, detergents, personal products, tea, coffee,
branded staples, ice cream and culinary products. They are manufactured over
40 factories across India. The operations involve over 2,000 suppliers and
associates. HUL's distribution network, comprising about 4,000 redistribution
stockists, covering 6.3 million retail outlets reaching the entire urban
population, and about 250 million rural consumers.
HUL believes that an organisation's worth is also in the service it renders to the
community. HUL is focusing on health & hygiene education, women
empowerment, and water management. It is also involved in education and
rehabilitation of special or underprivileged children, care for the destitute and
HIV-positive, and rural development. HUL has also responded in case of
national calamities / adversities and contributes through various welfare
measures, most recent being the village built by HUL in earthquake affected
Gujarat, and relief & rehabilitation after the Tsunami caused devastation in
South India.

7
In 2001, the company embarked on an ambitious programme, Shakti. Through
Shakti, HUL is creating micro-enterprise opportunities for rural women, thereby
improving their livelihood and the standard of living in rural communities.
Shakti also includes health and hygiene education through the Shakti Vani
Programme, and creating access to relevant information through the iShakti
community portal. HUL is also running a rural health programme – Lifebuoy
Swasthya Chetana. If Hindustan Unilever straddles the Indian corporate world,
it is because of being single-minded in identifying itself with Indian aspirations
and needs in every walk of life.

8
HISTORY
YEAR MILESTONES
1888 Sunlight soap introduced in India.
1895 Lifebuoy soap launched; Lever Brothers appoints agents in Mumbai,
Chennai, Kolkata, and Karachi.
1902 Pears soap introduced in India.
1903 Brooke Bond Red Label tea launched.
1905 Lux flakes introduced.
1913 Vim scouring powder introduced.
1914 Vinolia soap launched in India.
1918 Vanaspati introduced by Dutch margarine manufacturers like Van den
Berghs, Jurgens, Verschure Creameries, and Hartogs.
1922 Rinso soap powder introduced.
1924 Gibbs dental preparations launched.
1925 Lever Brothers gets full control of North West Soap Company.
1926 Hartogs registers Dalda Trademark.
1930 Unilever is formed on January 1 through merger of Lever Brothers and
Margarine Unie.
1931 Hindustan Vanaspati Manufacturing Company registered on November 27;
Sewri factory site bought.
1932 Vanaspati manufacture starts at Sewri.
1933 Application made for setting up soap factory next to the Vanaspati factory at
Sewri; Lever Brothers India Limited incorporated on October 17.
1934
Soap manufacture begins at Sewri factory in October; North West Soap
Company's Garden Reach Factory, Kolkata rented and expanded to produce
Lever brands.
1935 United Traders incorporated on May 11 to market Personal Products.
1937 Mr. Prakash Tandon, one of the first Indian covenanted managers, joins
HVM.

9
1939 Garden Reach Factory purchased outright; concentration on building up
Dalda Vanaspati as a brand.
1941 Agencies in Mumbai, Chennai, Kolkata and Karachi taken over; company
acquires own sales force.
1942 Unilever takes firm decision to "train Indians to take over junior and senior
management positions instead of Europeans".
1943 Personal Products manufacture begins in India at Garden Reach Factory.
1944 Reorganisation of the three companies with common management but
separate marketing operations.
1947 Pond's Cold Cream launched.
1951 Mr. Prakash Tandon becomes first Indian Director. Shamnagar, Tiruchy, and
Ghaziabad Vanaspati factories bought.
1955 65% of managers are Indians.
1956 Three companies merge to form Hindustan Unilever Limited, with 10%
Indian equity participation.
1957 Unilever Special Committee approves research activity by Hindustan
Unilever.
1958 Research Unit starts functioning at Mumbai Factory.
1959 Surf launched.
1961 Mr. Prakash Tandon takes over as the first Indian Chairman; 191 of the 205
managers are Indians.
1962 Formal Exports Department starts.
1963 Head Office building at Backbay Reclamation, Mumbai, opened.
1964 Etah dairy set up, Anik ghee launched; Animal feeds plant at Ghaziabad;
Sunsilk shampoo launched.
1965 Signal toothpaste launched; Indian shareholding increases to 14%.
1966
Lever's baby food, more new foods introduced; Nickel catalyst production
begins; Indian shareholding increases to 15%. Statutory price control on
Vanaspati; Taj Mahal tea launched.
1967 Hindustan Unilever Research Centre, opens in Mumbai.
1968
Mr. V. G. Rajadhyaksha takes over as Chairman from Mr. Prakash Tandon;
Fine Chemicals Unit commissioned at Andheri; informal price control on
soap begins.

10
1969 Rin bar launched; Fine Chemicals Unit starts production; Bru coffee
launched
1971 Mr. V. G. Rajadhyaksha presents plan for diversification into chemicals to
Unilever Special Committee - plan approved; Clinic shampoo launched.
1973 Mr. T. Thomas takes over as Chairman from Mr. V. G. Rajadhyaksha.
1974 Pilot plant for industrial chemicals at Taloja; informal price control on soaps
withdrawn; Liril marketed.
1975
Ten-year modernisation plan for soaps and detergent plants; Jammu project
work begins; statutory price control on Vanaspati and baby foods
withdrawn; Close-up toothpaste launched.
1976 Construction work of Haldia chemicals complex begins; Taloja chemicals
unit begins functioning.
1977 Jammu synthetic Detergents plant inaugurated; Indian shareholding
increases to 18.57%.
1978 Indian shareholding increases to 34%; Fair & Lovely skin cream launched.
1979 Sodium Tripolyphospate plant at Haldia commissioned.
1980 Dr. A. S. Ganguly takes over as Chairman from Mr. T. Thomas; Unilever
shareholding in the company comes down to 51%.
1982 Government allows 51% Unilever shareholding.
1984 Foods, Animal Feeds businesses transferred to Lipton.
1986
Agri-products unit at Hyderabad starts functioning - first range of hybrid
seeds comes out; Khamgaon Soaps unit and Yavatmal Personal Products
unit start production.
1988 Launch of Lipton Taaza tea.
1990 Mr. S. M. Datta takes over as Chairman from Dr. A. S. Ganguly.
1991 Surf Ultra detergent launched.
1992 HUL recognised by Government of India as Star Trading House in Exports.
1993
HUL's largest competitor, Tata Oil Mills Company (TOMCO), merges with
the company with effect from April 1, 1993, the biggest such in Indian
industry till that time. Merger ultimately accomplished in December 1994;
Launch of Vim bar; Kissan acquired from the UB Group.
1994
HUL forms Unilever Nepal Limited, HUL and US-based Kimberley-Clark
Corporation form 50:50 joint venture - Kimberley-Clark Lever Ltd. - to
market Huggies diapers and Kotex feminine care products. Factory set up at

11
Pune in 1995; HUL acquires Kwality and Milkfood 100% brandnames and
distribution assets. HUL introduces Wall's.
1995
HUL and Indian cosmetics major, Lakme Ltd., form 50:50 joint venture –
Lakme Lever Ltd.; HUL enters branded staples business with salt; HUL
recognised as Super Star Trading House.
1996
Mr. K. B. Dadiseth takes over as Chairman from Mr. S. M. Datta; Merger of
Group company, Brooke Bond Lipton India Limited, with HUL, with effect
from January 1; HUL introduces branded atta; Surf Excel launched.
1997 Unilever sets up International Research Laboratory in Bangalore; new
Regional Innovation Centres also come up.
1998
Group company, Pond's India Ltd., merges with HUL with effect from
January 1, 1998. HUL acquires Lakme brand, factories and Lakme Ltd.'s
50% equity in Lakme Lever Ltd.
2000
Mr. M. S. Banga takes over as Chairman from Mr. K. B. Dadiseth, who joins
the Unilever Board; HUL acquires 74% stake in Modern Food Industries
Ltd., the first public sector company to be disinvested by the Government of
India.
2002 HUL enters Ayurvedic health & beauty centre category with the Ayush
range and Ayush Therapy Centres.
2003 Launch of Hindustan Lever Network; acquisition of the Amalgam Group
2005 Launch of "Pureit" water purifiers
HLL's brands, spread across 20 distinct consumer categories, touch the lives of
two out of three Indians. They endow the company with a scale of combined
volumes of about 4 million tonnes and sales of Rs.10,000 crores. The leading
business magazine, Forbes Global, has rated Hindustan Lever as the best
consumer household products company. Far Eastern Economic Review has
rated HLL as India‟s most respected company. Asiamoney has rated HLL as
one of India‟s best managed companies. Leading national publications, like The
Economic Times, Business World, and Business Today have also rated HLL as
one of India‟s most respected companies and the number one in Market Value
Added and EVA. The vision that inspires HLL's 32,400 employees (40,000
including Group Companies), including about 1,425 managers, is to “meet
everyday needs of people everywhere - to anticipate the aspirations of our
consumers and customers and to respond creatively and competitively with
branded products and services which raise the quality of life.”

12
This objective is achieved through the brands that the company markets. It is an
ethos HLL shares with its parent company, Unilever, which holds 51.55% of the
equity. A Fortune 500 transnational, Unilever sells Foods and Home and
Personal Care brands through 300 subsidiary companies in about 100 countries
worldwide with products on sale in a further 50. Business nature HLL is India's
largest marketer of Soaps, Detergents and Home Care products. It has the
country‟s largest Personal Products business, leading in Shampoos, Skin Care
Products, Colour Cosmetics, and Deodorants. HLL is also the market leader in
Tea, Processed Coffee, branded Wheat Flour, Tomato Products, Ice cream,
Soups, Jams and Squashes. HLL is also one of the country's biggest exporters
and has been recognised as a Golden Super Star Trading House by the
Government of India; it is a net foreign exchange earner. HLL is also driving
exports in chosen areas where India has a competitive advantage – Marine
Products, Basmati Rice, Castor Oil and its Derivatives. It is India's largest
exporter of Marine Products, and one of the largest global players in castor.
Market leading brands HLL‟s brands have become household names. The
company‟s strategy is to concentrate its resources on 30 national power brands,
and 10 other brands which are strong in certain regions. The top five brands
together account for sales of over Rs.3000 crores. Each of these mega brands
has a potential scale of Rs.1000 crores in the foreseeable future. Some of the big
brands in Soaps and Detergents are Lifebuoy, Lux, Liril, Hamam, Breeze,
Dove, (all soaps), Surf Excel, Surf, Rin, Wheel (the number one detergent brand
in India, and HLL's largest), 501, Sunlight (all detergents). HLL also markets
the Vim and Domex range of Home Care Products.
In the Personal Products business, HLL's Hair Care franchises are Clinic,
Sunsilk and Lux shampoos; the company markets Nihar oil. In Oral Care, the
portfolio comprises Close-up and Pepsodent toothpastes and toothbrushes. In
Skin Care, HLL markets Fair & Lovely Skin Cream and Lotion, the largest
selling Skin Care Product in India; a brand developed in India, it is now
exported to over 30 countries. It has been extended as an Ayurvedic cream, an
under-eye cream, a soap and a talc, in line with the strategy to take brands
across relevant categories. The other major Skin Care franchises are Pond‟s,
Vaseline, Lakme and Pears. In Colour Cosmetics, HLL markets the Lakme and
Elle-18 ranges. In Deodorants, the key brands are Rexona, Axe, Denim and
Pond's, while the Talc brands are Pond's, Liril, Fair & Lovely, Vaseline and
Lifebuoy. Axe and Denim are HLL‟s franchises for Men‟s toiletries. HLL has
recently launched Lever Ayush Ayurvedic Health & Personal Care Products.
HLL markets products, which consistently offer value in terms of price and
quality and are safe for their intended use. Its operations are run in an
environmentally sound and sustainable manner, ensuring that the processes and
products conform to standards set by the authorities

13
S.W.O.T ANALYSIS
SWOT Analysis is a strategic planning method used to evaluate the
Strengths, Weaknesses, Opportunities, and Threats involved in a project or in a
business venture. It involves specifying the objective of the business venture or
project and identifying the internal and external factors that are favorable and
unfavorable to achieving that objective. The technique is credited to Albert
Humphrey, who led a research project at Stanford University in the 1960s and
1970s using data from Fortune 500 companies.
Internal
Strengths
Weaknesses
Leadership Position
Global Brand Strength
High Geographical reach
Centralized Control – Low
Flexibility
High Consumer churn rates
External
Opportunities Threats
Expanding marketing boundaries
Strategic Alliances
Increased Competition
Market saturation in Europe
Emergencies of Low cost
Brands

14
DISTRIBUTION NETWORK
Hindustan Unilever's distribution network is recognised as one of its key
strengths. Its focus is not only to enable easy access to their brands, but also to
touch consumers with a three-way convergence of -
product availability,
brand communication,
and higher levels of brand experience.
HUL's products, manufactured across the country, are distributed through a
network of about 7,000 redistribution stockists covering about one million retail
outlets. The distribution network directly covers the entire urban population.
The general trade comprises grocery stores, chemists, wholesale, kiosks and
general stores. Hindustan Unilever services each with a tailor-made mix of
services. The emphasis is equally on using stores for direct contact with
consumers, as much as is possible through in-store facilitators.

15
The distribution network in general trade is as follows:-
The products that are manufactured are first brought to the JIT (Just In Time)
Depot from the factory. Then these products are delivered to the Redistribution
Stockiest according to the order placed by them, this is done through Permanent
Despatch Plan.Then this stock is send to either retailers or wholesalers,
according to the channel followed by them. From there it reaches to the
consumers.
FACTORY
JUST IN TIME DEPOT
REDISTRIBUTION STOCKIST
MARKET ( CHANNEL WISE )
CONSUMER

16
At the supermarkets
Self-service stores and supermarkets are fast emerging in metros and large
towns. To service modern retailing outlets in the metros, HUL has set up a full-
scale sales organisation, exclusively for this channel. The business system
delivers excellent customer service, while driving growth for the company and
the store. At the same time, innovative marketing initiatives are taken to provide
consumers with experience of our brands at the store itself, through product
tests and in-store sampling.
This is termed as Modern Trade. It has got different distribution network and
work differently. It is fast gaining pace as more and more people are turning to
malls for shopping. Today shoppers don‟t just want to buy their daily groceries
but they also want a shopping experience. They want to spend time in air
conditioned store, no more they are ready to sweat for spending money. These
big box retailers provide them a platform where they can roam around, pick,
compare and choose their products. These stores provide them a whole new
experience of shopping without shedding any drop of sweat.

17
DISTIBUTION NETWORK
FACTORY
JUST IN TIME DEPOT
CUSTOMER SERVICE PROVIDER
BIG BOX RETAILER
CONSUMER

18
PRODUCT PROFILE
Hindustan Unilever is biggest company in the FMCG (Fast Moving Consumer
Goods) sector. Its products are divided into various categories. These are given
as follows:
Home and Personal Care: under this it is further divided into two parts:
1. Dets : all the detergents and dishwashers are covered in this. For
example, Vim, Rin, Surf Exel.
2. Personal Products : this comprises of all the products related to
personal care. these are as follows:
- Oral: toothpaste and toothbrush ( Pepsodent, Close Up)
- Skin: soaps, talcum powder, fairness cream, body lotion,
winter cream ( Pears, Vaseline, Fair & Lovely, Ponds‟)
- Hair: Shampoos ( Sunsilk, Clinic All Clear)

19
INTRODUCTION
“Marketing is a social and managerial process by which individuals and groups
obtain what they need and want, through creating, offering and exchanging
products of value with others”.
- Philip Kotler.
Marketing includes all those activities having to do with effecting changes in
the ownership and possession of goods and services. It is that part of economics
which deals with the creation of time, place and possession utilities and that
phase of business activity through which human wants are satisfied, by the
exchange of goods and services for some valuable consideration.
- American Marketing Association.
Marketing is the process of discovering and translating consumer wants into
product and service specifications and then in turn helping to make it possible
for more and more of consumers to enjoy more and more of these products and
services.

20
Marketing consists of analyzing marketing opportunities, researching and
selecting target markets, designing marketing strategies, planning marketing
programs and organizing, implementing and controlling marketing effort.
Companies have to identify long and short term marketing opportunities and
research the selected market by measuring and forecasting attractiveness of the
given market. Having selected the market, the companies need to develop a
differentiating and positioning strategy for the target market. The marketing
strategy must be transformed into marketing programs by deciding on
marketing expenditures and the marketing mix. The final step is organizing the
marketing resources and implementing and controlling the marketing plan.
MARKETING MIX Marketing mix is the set of marketing tools that a firm uses to pursue its
marketing objectives in the target market.
McCarthy has popularized a four factor classification of marketing tools known
as the 4P‟s of the marketing mix. They are:
Product
Price
Place
Promotion
Product :

21
Product stands for the firm‟s tangible offer to the market, including the product
quality, design, features, branding and packing. It deals with new product
development, product life cycle, product mix, product lines, branding and
associated services to a product. From the customer‟s point of view, it helps in
satisfying the customer‟s needs and wants.
Price :
Price is the monetary value of the product. Price deals with selecting the pricing
objectives, setting the price, discounts, allowances, payment policies and credit
terms. It is very important to the customers as it decides the cost the customer
has to pay to gain the product value.
Place :
This marketing tool stands for the various activities the company undertakes to
make the product accessible and available to the customer. It involves market
size, channel selection and management, storage and physical distribution with
the ultimate purpose of efficiently supplying the company‟s offer to the target
market. To the customer, this marketing tool refers to convenience.
Promotion:
Promotion stands for various activities the company undertakes to communicate
and promote its products to the target market. It involves communication

22
programs i.e. direct marketing, advertising, sales promotions, public relations
and motivation of sales force. To the customer this tool provides knowledge and
information.
The Promotion Mix of a company includes the following tools;
Advertising:
It is any paid form of non-personal presentation and promotion of ideas,
goods or services by an identified sponsor.
Direct Marketing:
It refers to the use of mail, telephone and other non-personal contact tools to
communicate with or solicit a response from specific customers and prospects.
Personal Selling:
Face to face interaction with one or more prospective purchasers for the
purpose of making a sale refers to personal selling.
Public Relations and Publicity:
It refers to the variety of programs designed to promote and or protect a
company‟s image or its individual products.
Sales Promotions:

23
The short-term incentive to encourage trial or purchase of a product or
service refers to sales promotion. Whereas advertising offers a reason to buy;
sales promotion offers an incentive to buy.
Sales Promotion
Sales promotion refers to the short-term incentives to encourage sales of a
product or service. It consists of a diverse collection of incentive tools, mostly
short-term, designed to stimulate quicker and greater purchase of products or
services by consumers.
Purpose of Sales Promotion
Sales promotion tools vary in their specific objectives. They may be used to
attract new customers, to reward loyal customers and to increase the repurchase
rates of occasional users. Sales promotion usually targets brand switchers
because non-users and users of other brands do not always notice a promotion.
Sales promotions are thus also seen as a tool for breaking down loyalty to other
products.
Sales promotions also let manufacturers adjust to short term changes in supply
and demand and differences in customer segments. They also let manufacturers
to experiment by varying prices. Sales promotions also lead to greater consumer
awareness of prices.
24
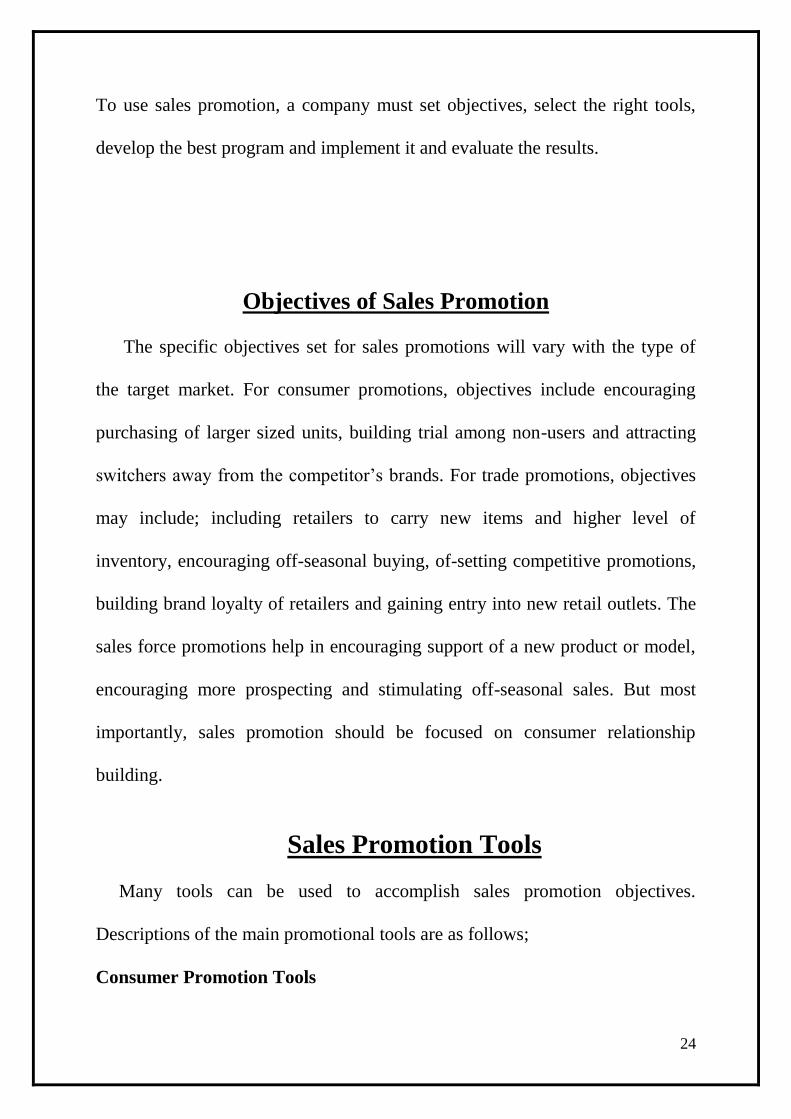
To use sales promotion, a company must set objectives, select the right tools,
develop the best program and implement it and evaluate the results.
Objectives of Sales Promotion
The specific objectives set for sales promotions will vary with the type of
the target market. For consumer promotions, objectives include encouraging
purchasing of larger sized units, building trial among non-users and attracting
switchers away from the competitor‟s brands. For trade promotions, objectives
may include; including retailers to carry new items and higher level of
inventory, encouraging off-seasonal buying, of-setting competitive promotions,
building brand loyalty of retailers and gaining entry into new retail outlets. The
sales force promotions help in encouraging support of a new product or model,
encouraging more prospecting and stimulating off-seasonal sales. But most
importantly, sales promotion should be focused on consumer relationship
building.
Sales Promotion Tools
Many tools can be used to accomplish sales promotion objectives.
Descriptions of the main promotional tools are as follows;
Consumer Promotion Tools

25
The main consumer promotion tools are as follows;
Samples:
They are offers of a trial amount of a product. It consists of inviting
prospective purchasers to try the product without cost or at a lower cost in
the hope that they will buy the product. Samples may be free or
discounted.
Coupons:
Coupons are certificates that give buyers a saving when they purchase a
specified product. Coupons can be mailed, placed in advertisements or
included with other products.
Rebates:
Rebate is also known as cash refund offers. Rebates are offers to refund
part of the purchase price of a product to its customers who send a
proof of purchase to the manufacturer. These are like coupons except
that the price reduction occurs after the purchase and not at the point
of sale.
Price Packs:
Cents-off deals or price packs offer consumers savings by way of
reducing prices that are marked by the producer directly on the
package.

26
Premiums:
These are the goods offered either free or at a low cost as an
incentive to buy a product. Premiums may be in-pack or on-pack (outside
the pack).
Prizes:
They are offers of chance to win something such as cash, trips or goods – by
luck or through extra efforts. Contests of talent and sweepstakes or draws the
most popular prize offering promotions.
Tie-in Promotions:
Tie-in promotions involve two or more brands or companies that team up on
coupons, refunds or contests to increase their pulling powers.
Cross Promotions:
Cross promotions involve using one brand to advertise non-competing brand.
Advertising Specialties:
These are useful articles imprinted with an advertiser‟s name, given as gifts
to consumers.
Patronage Rewards:
They are cash or other awards for the regular use of company‟s products or
services. They are values (in cash otherwise) that are proportional to one‟s

27
patronage of a certain vendor or a group of vendors. They aim at building
brand loyalty.
PoP Promotions:
Point of purchase (PoP) includes displays and demonstrations that take place
at the point of purchase or sale.
Trade Promotion Tools
More money is spent by companies on trade promotion (58%) than on
consumer promotions (42%). The major trade promotion tools are as follows;
Discounts:
It is also known as price-off or off-invoice or off-list. Discounts price cut off
the list price on a particular quantity purchased during a stated time.
Allowances:
They are the amount offered in return for an agreement by the retailer to
feature the manufacturer‟s products in some way; displays, advertising or
otherwise.
Free Goods:

28
Free goods are the extra merchandise offered to middlemen who buy a
specific amount of a product.
Companies also offer push money and specialty advertising items to the
middlemen.
Business Promotion Tools
Companies spend huge amount on promotions focused on industrial
consumers. The major business promotion tools are as follows;
Trade Shows and Conventions.
Sales Contests.
Clearly, sales promotions play an important role in the total promotion mix. To
use it well, the marketer must define the sales promotion objectives, select the
best tools, design the sales promotion program, pretest and implement the
program and evaluate its results.

29
RESEARCH METHODOLOGY
RESEARCH DESIGN
In my project I have used various tools of Exploratory Research. This research
will be done to gain background information of the problem. An initial research
will be conducted to clarify and define the nature of the problem. The various
tools used are experience surveys, in depth interviews, secondary data analysis.
Descriptive research was done where questionnaires were given to the retailers
and the wholesalers to find out the competition in HUL skin category.
QUESTIONNAIRE DESIGN
The questionnaire consists of predominantly closed ended and option based
question in order to provide some ease to the respondents. In order to make the
questionnaire more effective following points are covered:
• Uniformity in questions and ease of tabulation and analysis.
• Reduce subjectivity
• Easier to receive response
• Less time consuming.
The questions tried to cover all aspects required to analyze the skin category of
HUL and other competitive brands. The various variables are analyzed in the
questions.
SAMPLING METHODOLOGY
SAMPLE PLAN
30
The project was conducted for the geographical region of Bilaspur. The sample
consists of both the retailers and wholesalers of the general trade.
DATA COLLECTION
The data collection exercise was carried over a period of 15 days, in the various
markets of the region. Over the period of 15 days the data was collected and
then all the data was very carefully studied and the results were found out.
“Marketing research means the systematic gathering, recording,
analyzing of data about problems relating to the marketing of goods and
services”
Marketing research has proved an essential tool to make all the need of
marketing management. Marketing research therefore is the scientific process of
gathering and analyzing of marketing information to meet the needs of
marketing management. But gathering of observation is must be systematic. The
systematic conduct of research requires:
Orderliness, in which the measurements are accurate.
Impartiality in analysis and interpretation.
All of research can be categorized into basic and applied.
1. BASIC RESEARCH: - Basic Research is that intended to expand the
body of knowledge for the use of others.
2. APPLIED RESEARCH: - Applied Research is one, which is carried out
to find the solution for a particular problem or for guiding a specific
decision. It is usually private in nature.
My research on Vodafone is carried on for guiding specific decisions and
its results are useful only to Vodafone for taking particular decision regarding
product quality, staff and security. Hence the nature of my research study is
“APPLIED RESEARCH “.

31
Research Approach
Data collection methods
a) Secondary Research External secondary data has been generated to obtain volume of sales regarding
beverage markets, fruit drinks, each of the brands and the positioning of each of
the brands.
b) Survey Research
Data was collected from candidates using questionnaire. The
questionnaire was distributed in colleges and people on the street.
I distributed the questionnaires outside the shops to gather data
from people who had come to visit there.
I made an online questionnaire and circulated on the internet and
gathered results from those.
Measurement Instruments:
The measurement instrument in the questionnaire was a five point Likert
scale.
Apart from details regarding their choice of drink for refreshment, their
frequency of visits and the channels they choose, their spending patterns
will also be mapped.
The data was extracted and put in MS Excel. All the further analysis was
then carried out using SPSS.
The measurement was designed to get a fair idea about the various
attributes and conducted factorial analysis of the important attributes.
Samples
The aim was to collect 100 samples for the analysis. The samples should be
such that they are consumers of fruit drinks. I also tried to get an adequate ratio

32
of men and women in the samples. The main demographics targeted were the
younger age group as they are more health conscious and aware of such health
drinks. Also I tried to focus more on the college going crowd and young
professionals as they would be more interested in trying out new products and
were more conscious.
Buyers who have been consuming fruit drinks were better able to answer the
questions regarding the influencing factors and the reasons for their
consumption and purchase. The samples collected from internet have also been
very valuable in the research.
Analysis Techniques
The analysis techniques used have been on SPSS and the tests were
performed to ascertain the factors influencing the consumer decision
while buying fruit drinks.
Factor analysis was conducted to discern out of the 13 factors mainly
which factors influence the buying habits of the consumers. Ultimately I
identified 5 factors which mainly have an influence.
I also conducted correlation tests to find out the various reasons for
purchasing any particular brand of fruit drink.
SOURCES OF DATA
Primary Data Secondary Data
Questionnaire Newsletter
Observation Journals
Interviews Magazines
Visits to other Newspapers
Companies Information Books
Through Departmental heads Websites
33
Limitations:
The main limitation is the sampling conducted. It was done in a random
manner and no particular technique followed. In the first survey a greater
number of college students have been surveyed. The data might not be
representative of the entire population.
Various statistical techniques as learned have been implemented and
conclusions as best possible have been drawn making few assumptions as
and when required.
Since no data was on interval or ratio scale it was not feasible to conduct
Regression and ANOVA.
Limitations of the Study
Every study is bound by limitations and as such this is no exceptions.
1. “Change is Constant” rule of nature. Hence, the study undertaken may
not hold good for longer duration.
2. The study was conducted under the assumption that the information given
by the respondents is authentic.
3. The analysis and suggestion are given only with respect to marketing
aspects as technical suggestion with respect to the product could not be
given.
4. Confidential matters were not disclosed by the company.

34
5. There were time constraints.
SUMMARY OF FINDINGS AND CONCLISION
A Summary of Findings:
The finding can be grouped together into two broad categories such as;
Specific Findings :
This is pertaining to the objectives of the study.
General Findings :
This is with regard to the market dynamics and visits made by the
researcher to companies having almost similar products profile.
Specific Findings:
1. The company adopts a variety of promotional methods such as paper
insertion, telemarketing, display stalls, participating in exhibitions, direct
mail, presentations and showrooms.
2. Every player is vying with each other to capture a larger pie in the
markets.
3. Transparency is maintained at the levels of the organization.

35
4. The activities carried out by each and every department of the
organization is systematic.
General Findings:
1. Foreign companies can invest up to 100% in most of the manufacturing
industries in India, including furniture.
2. With the vast array of modular option available in market, the consumer
isn‟t really strapped for choice.
3. In a nutshell, this means to say that the competition is very intense.
4. Many branded companies outsource the products because of which the
delivery time of the product ordered is stretched.
5. HUL offers a wide range of products. This gives it an edge over the
others.
6. “Quality never comes cheap”. This is true but at the same time, it is also
true that quality can come at a reasonable price. With regard to the
quality, products of HUL are at par with the other players having brand
names and at the same time the products are reasonable priced.
7. Majority of the marketing executives are male.
8. The prices of the products are reasonable though they are competitive.
9. The products are of good quality and are at par with other competitors
having brand names.

36
10. Reasonable pricing, customized products, quality and finishing
contributes in differentiating the products of the organization from that of
the others.

37
Data Analysis

38
Data Analysis
Type of Respondent
Frequency Percent Valid Percent
Cumulative
Percent
Valid 19 19.2 19.2 19.2
Retailer 66 66.7 66.7 85.9
Wholesellr 14 14.1 14.1 100.0
Total 99 100.0 100.0

39
Deals in HUL Products
Frequency Percent Valid Percent
Cumulative
Percent
Valid 19 19.2 19.2 19.2
Yes 80 80.8 80.8 100.0
Total 99 100.0 100.0

40
Personal Care
Frequency Percent Valid Percent
Cumulative
Percent
Valid 19 19.2 19.2 19.2
yes 80 80.8 80.8 100.0
Total 99 100.0 100.0

41
Confectionery
Frequency Percent Valid Percent
Cumulative
Percent
Valid 19 19.2 19.2 19.2
No 14 14.1 14.1 33.3
yes 66 66.7 66.7 100.0
Total 99 100.0 100.0

42
Dental Care
Frequency Percent Valid Percent Cumulative Percent
Valid 19 19.2 19.2 19.2
No 8 8.1 8.1 27.3
yes 72 72.7 72.7 100.0
Total 99 100.0 100.0

43
Detergent and Soaps
Frequency Percent Valid Percent
Cumulative
Percent
Valid 19 19.2 19.2 19.2
No 13 13.1 13.1 32.3
Yes 67 67.7 67.7 100.0
Total 99 100.0 100.0

44
Visits of Agents per week
Frequency Percent Valid Percent
Cumulative
Percent
Valid 1 9 9.1 11.3 11.3
2 34 34.3 42.5 53.8
3 37 37.4 46.3 100.0
Total 80 80.8 100.0
Missing System 19 19.2
Total 99 100.0

45
Orders Placed Per Month
Frequency Percent Valid Percent
Cumulative
Percent
Valid 1 1 1.0 1.3 1.3
2 9 9.1 11.3 12.5
3 20 20.2 25.0 37.5
4 24 24.2 30.0 67.5
5 22 22.2 27.5 95.0
6 3 3.0 3.8 98.8
9 1 1.0 1.3 100.0
Total 80 80.8 100.0
Missing System 19 19.2
Total 99 100.0

46
Quantity in Single Purchase ( '000)
Frequency Percent Valid Percent
Cumulative
Percent
Valid 5 34 34.3 42.5 42.5
6 14 14.1 17.5 60.0
8 18 18.2 22.5 82.5
25 4 4.0 5.0 87.5
30 8 8.1 10.0 97.5
40 1 1.0 1.3 98.8
50 1 1.0 1.3 100.0
Total 80 80.8 100.0
Missing System 19 19.2
Total 99 100.0

47
Most Difficult to Sold
Frequency Percent Valid Percent
Cumulative
Percent
Valid 19 19.2 19.2 19.2
Dental Care 80 80.8 80.8 100.0
Total 99 100.0 100.0

48
Easy to Sold
Frequency Percent Valid Percent
Cumulative
Percent
Valid 19 19.2 19.2 19.2
Personal Care 80 80.8 80.8 100.0
Total 99 100.0 100.0

49
Incentive
Frequency Percent Valid Percent
Cumulative
Percent
Valid 19 19.2 19.2 19.2
Cash Discounts 10 10.1 10.1 29.3
Free Gifts 14 14.1 14.1 43.4
Trade Discounts 56 56.6 56.6 100.0
Total 99 100.0 100.0

50
Attraction to Offers
Frequenc
y Percent
Valid
Percent
Cumulative
Percent
Valid 19 19.2 19.2 19.2
No 13 13.1 13.1 32.3
Yes 67 67.7 67.7 100.0
Total 99 100.0 100.0

51
Customer have knowledge of product
Frequency Percent Valid Percent
Cumulative
Percent
Valid 19 19.2 19.2 19.2
No 33 33.3 33.3 52.5
Yes 47 47.5 47.5 100.0
Total 99 100.0 100.0

52
customer have knowledge of Company
Frequency Percent Valid Percent
Cumulative
Percent
Valid 19 19.2 19.2 19.2
No 50 50.5 50.5 69.7
Yes 30 30.3 30.3 100.0
Total 99 100.0 100.0

53
Customers Attracted by Offers
Frequency Percent Valid Percent
Cumulative
Percent
Valid 19 19.2 19.2 19.2
No 12 12.1 12.1 31.3
Yes 68 68.7 68.7 100.0
Total 99 100.0 100.0

54
P&G
Frequency Percent Valid Percent
Cumulative
Percent
Valid 19 19.2 19.2 19.2
no 50 50.5 50.5 69.7
yes 30 30.3 30.3 100.0
Total 99 100.0 100.0

55
ITC
Frequency Percent Valid Percent
Cumulative
Percent
Valid 19 19.2 19.2 19.2
no 41 41.4 41.4 60.6
yes 39 39.4 39.4 100.0
Total 99 100.0 100.0

56
Others
Frequency Percent Valid Percent
Cumulative
Percent
Valid 19 19.2 19.2 19.2
yes 80 80.8 80.8 100.0
Total 99 100.0 100.0
57
Chi Square
Analysis

58
Visits of Agents per week * Orders Placed Per Month
Analysis Table
Orders Placed Per Month
1 2 3
Visits of Agents per
week
1 Observed 1 0 6
Expected .1 1.0 2.3
% within Orders Placed
Per Month 100.0% .0% 30.0%
2 Observed 0 1 14
Expected .4 3.8 8.5
% within Orders Placed
Per Month .0% 11.1% 70.0%
3 Observed 0 8 0
Expected .5 4.2 9.3
% within Orders Placed
Per Month .0% 88.9% .0%
Total Observed 1 9 20
Expected 1.0 9.0 20.0
% within Orders Placed
Per Month 100.0% 100.0% 100.0%

59
Analysis Table
Orders Placed Per Month
4 5 6
Visits of Agents per
week
1 Observed 1 0 1
Expected 2.7 2.5 .3
% within Orders Placed
Per Month 4.2% .0% 33.3%
2 Observed 15 3 0
Expected 10.2 9.4 1.3
% within Orders Placed
Per Month 62.5% 13.6% .0%
3 Observed 8 19 2
Expected 11.1 10.2 1.4
% within Orders Placed
Per Month 33.3% 86.4% 66.7%
Total Observed 24 22 3
Expected 24.0 22.0 3.0
% within Orders Placed
Per Month 100.0% 100.0% 100.0%

60
Analysis Table
Orders Placed
Per Month
9 Total
Visits of Agents per
week
1 Observed 0 9
Expected .1 9.0
% within Orders Placed
Per Month .0% 11.3%
2 Observed 1 34
Expected .4 34.0
% within Orders Placed
Per Month 100.0% 42.5%
3 Observed 0 37
Expected .5 37.0
% within Orders Placed
Per Month .0% 46.3%
Total Observed 1 80
Expected 1.0 80.0
% within Orders Placed
Per Month 100.0% 100.0%

61
Chi-Square Tests
Value df
Asymp. Sig. (2-
sided)
Pearson Chi-Square 56.420a 12 .000
Likelihood Ratio 64.482 12 .000
Linear-by-Linear Association 4.999 1 .025
N of Valid Cases 80
a. 15 cells (71.4%) have expected count less than 5. The minimum expected
count is .11.
62
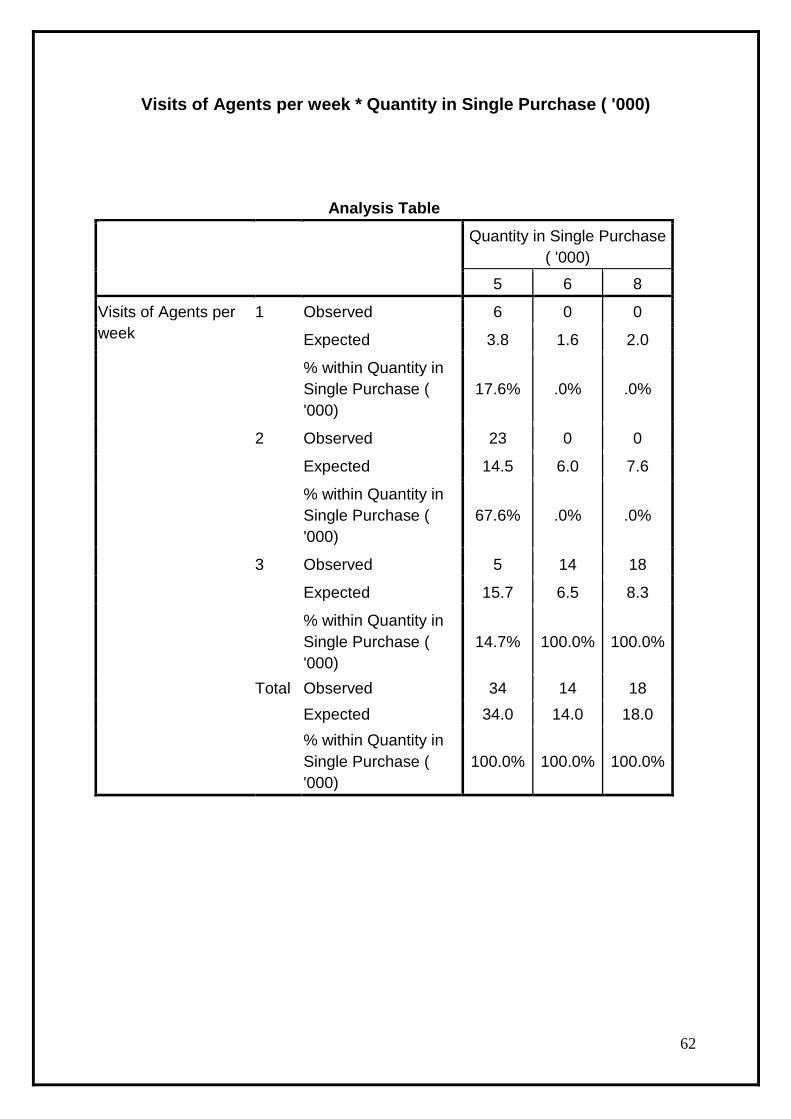
Visits of Agents per week * Quantity in Single Purchase ( '000)
Analysis Table
Quantity in Single Purchase
( '000)
5 6 8
Visits of Agents per
week
1 Observed 6 0 0
Expected 3.8 1.6 2.0
% within Quantity in
Single Purchase (
'000)
17.6% .0% .0%
2 Observed 23 0 0
Expected 14.5 6.0 7.6
% within Quantity in
Single Purchase (
'000)
67.6% .0% .0%
3 Observed 5 14 18
Expected 15.7 6.5 8.3
% within Quantity in
Single Purchase (
'000)
14.7% 100.0% 100.0%
Total Observed 34 14 18
Expected 34.0 14.0 18.0
% within Quantity in
Single Purchase (
'000)
100.0% 100.0% 100.0%

63
Analysis Table
Quantity in Single Purchase (
'000)
25 30 40
Visits of Agents per
week
1 Observed 1 1 0
Expected .5 .9 .1
% within Quantity in
Single Purchase (
'000)
25.0% 12.5% .0%
2 Observed 3 7 1
Expected 1.7 3.4 .4
% within Quantity in
Single Purchase (
'000)
75.0% 87.5% 100.0%
3 Observed 0 0 0
Expected 1.9 3.7 .5
% within Quantity in
Single Purchase (
'000)
.0% .0% .0%
Total Observed 4 8 1
Expected 4.0 8.0 1.0
% within Quantity in
Single Purchase (
'000)
100.0% 100.0% 100.0%

64
Analysis Table
Quantity in
Single
Purchase (
'000)
50 Total
Visits of Agents per
week
1 Observed 1 9
Expected .1 9.0
% within Quantity in
Single Purchase ( '000) 100.0% 11.3%
2 Observed 0 34
Expected .4 34.0
% within Quantity in
Single Purchase ( '000) .0% 42.5%
3 Observed 0 37
Expected .5 37.0
% within Quantity in
Single Purchase ( '000) .0% 46.3%
Total Observed 1 80
Expected 1.0 80.0
% within Quantity in
Single Purchase ( '000) 100.0% 100.0%

65
Chi-Square Tests
Value df
Asymp. Sig. (2-
sided)
Pearson Chi-Square 71.081a 12 .000
Likelihood Ratio 86.082 12 .000
Linear-by-Linear Association 8.850 1 .003
N of Valid Cases 80
a. 15 cells (71.4%) have expected count less than 5. The minimum expected count is
.11.

66
Incentive * Orders Placed Per Month
Analysis Table
Orders Placed Per Month
1 2 3
Incentive Cash Discounts Observed 0 0 8
Expected .1 1.1 2.5
% within Orders Placed
Per Month .0% .0% 40.0%
Free Gifts Observed 0 8 0
Expected .2 1.6 3.5
% within Orders Placed
Per Month .0% 88.9% .0%
Trade Discounts Observed 1 1 12
Expected .7 6.3 14.0
% within Orders Placed
Per Month 100.0% 11.1% 60.0%
Total Observed 1 9 20
Expected 1.0 9.0 20.0
% within Orders Placed
Per Month 100.0% 100.0% 100.0%

67
Analysis Table
Orders Placed Per Month
4 5 6
Incentive Cash Discounts Observed 2 0 0
Expected 3.0 2.8 .4
% within Orders Placed
Per Month 8.3% .0% .0%
Free Gifts Observed 0 4 2
Expected 4.2 3.8 .5
% within Orders Placed
Per Month .0% 18.2% 66.7%
Trade Discounts Observed 22 18 1
Expected 16.8 15.4 2.1
% within Orders Placed
Per Month 91.7% 81.8% 33.3%
Total Observed 24 22 3
Expected 24.0 22.0 3.0
% within Orders Placed
Per Month 100.0% 100.0% 100.0%

68
Analysis Table
Orders Placed
Per Month
9 Total
Incentive Cash Discounts Observed 0 10
Expected .1 10.0
% within Orders Placed
Per Month .0% 12.5%
Free Gifts Observed 0 14
Expected .2 14.0
% within Orders Placed
Per Month .0% 17.5%
Trade Discounts Observed 1 56
Expected .7 56.0
% within Orders Placed
Per Month 100.0% 70.0%
Total Observed 1 80
Expected 1.0 80.0
% within Orders Placed
Per Month 100.0% 100.0%

69
Chi-Square Tests
Value df Asymp. Sig. (2-sided)
Pearson Chi-Square 62.969a 12 .000
Likelihood Ratio 58.691 12 .000
N of Valid Cases 80
a. 17 cells (81.0%) have expected count less than 5. The minimum expected count
is .13.

70
Incentive * Quantity in Single Purchase ( '000)
Analysis Table
Quantity in Single Purchase (
'000)
5 6 8
Incentive Cash Discounts Observed 10 0 0
Expected 4.3 1.8 2.3
% within Quantity in
Single Purchase ( '000) 29.4% .0% .0%
Free Gifts Observed 0 14 0
Expected 5.9 2.4 3.2
% within Quantity in
Single Purchase ( '000) .0% 100.0% .0%
Trade Discounts Observed 24 0 18
Expected 23.8 9.8 12.6
% within Quantity in
Single Purchase ( '000) 70.6% .0% 100.0%
Total Observed 34 14 18
Expected 34.0 14.0 18.0
% within Quantity in
Single Purchase ( '000) 100.0% 100.0% 100.0%

71
Analysis Table
Quantity in Single Purchase (
'000)
25 30 40
Incentive Cash Discounts Observed 0 0 0
Expected .5 1.0 .1
% within Quantity in
Single Purchase ( '000) .0% .0% .0%
Free Gifts Observed 0 0 0
Expected .7 1.4 .2
% within Quantity in
Single Purchase ( '000) .0% .0% .0%
Trade Discounts Observed 4 8 1
Expected 2.8 5.6 .7
% within Quantity in
Single Purchase ( '000) 100.0% 100.0% 100.0%
Total Observed 4 8 1
Expected 4.0 8.0 1.0
% within Quantity in
Single Purchase ( '000) 100.0% 100.0% 100.0%

72
Analysis Table
Quantity in
Single
Purchase (
'000)
50 Total
Incentive Cash Discounts Observed 0 10
Expected .1 10.0
% within Quantity in Single
Purchase ( '000) .0% 12.5%
Free Gifts Observed 0 14
Expected .2 14.0
% within Quantity in Single
Purchase ( '000) .0% 17.5%
Trade Discounts Observed 1 56
Expected .7 56.0
% within Quantity in Single
Purchase ( '000) 100.0% 70.0%
Total Observed 1 80
Expected 1.0 80.0
% within Quantity in Single
Purchase ( '000) 100.0% 100.0%

73
Chi-Square Tests
Value df Asymp. Sig. (2-sided)
Pearson Chi-Square 93.445a 12 .000
Likelihood Ratio 89.145 12 .000
N of Valid Cases 80
a. 16 cells (76.2%) have expected count less than 5. The minimum expected count is
.13.

74
RECOMMENDATIONS AND SUGGESTIONS
This report lists the various recommendations and suggestions with respect
to the findings and in congruence with the objectives of the study.
Recommendations:
1. It‟s overwhelming to find out that the organization works in a systematic
manner. A blend of co-ordination will definitely enhance the performance
of the company.
2. Quality clubbed with reasonable pricing and quick delivery made the
product of the company stand apart. The marketing campaign should
focus on this aspect and made according to its line.
3. The strength of the company is its customized products. This very fact
must be highlighted in the marketing campaign.
4. As the products are reasonably priced, the ambit of the target consumers
should be stretched so that middle class consumers also fit into it.

75
5. The company must stick to a norm while giving discounts on repeat
purchase. This will certainly help in sales promotion in order to create
repeat purchase.
6. In order to have a rapid market access, the company can include dealers,
if not retailers at the moment.
7. The company can introduce some reward schemes so that a person is
benefited after the fulfillment and over achievement of the target. This is
predominantly done to motivate the sales force and enhance their
performance.
8. Other than emphasis on design, craftsmanship and product quality, the
company‟s unique strength also lies in its capability as a fully – integrated
furniture manufacturer. This fact should be highlighted during the
advertisement campaigns.
9. The need of the hour is aggressive marketing.

76
Suggestions:
1. Everyone is aware of the growth in wealth and change in lifestyle among
Bangalore‟s novae riche. So the marketing campaign should be designed
to woo the customers.
2. The company should explore all possible ways in order to aggressively
sell its products.
3. In today‟s crowed market place in order to increase the size of the pie, the
Company can adopt innovative promotional strategies. It will help in
creating and reinforcing the Company‟s identity in the minds of the
consumer.
4. In order to be extra ordinary, the Company has to walk the extra mile. A
method named „Experimental Marketing‟ can be adopted by the
Company wherein the prospective consumers can be invited to visit the
showroom and touch and feel the products.
5. Since the competition is intense, so there should be some value addition
so as to make the Company stand apart in the market. One such way is to
improvise the customer service.

77
6. Consumer is the king in the market. This fact should be deeply rooted in
the minds of the employees. The Company can adopt some ways to listen
to the customer‟s feedback which should be noted in writing so that it
will help in continual improvement and make the company to be in the
right track always. Moreover, a sense of involvement will be felt by the
customers whish can give the company a cutting edge.
BIBLIOGRAPHY
Name Of Book Name Of Author Edition &
year
Marketing Management Paramhans Foundation Fourth
Edition, 1992
Research Methodology C.R.Kothari Second
Edition, 1993
Marketing Management Philip Kotler Twelth
Edition, 1999
Fundamentals of Statistics D.N. Elhance Present
Edition, 1992

78
REFRENCES
1) www.google.com
2) www.hulindia.com
3) www.bing.com
QUESTIONNAIRES
1. Do You Deal in FMCG Products of HUL.
o Yes o No
2. Which Products of HUL Do You Deal In.
o Staple
o Confectionery
o Packed Food
o Biscuits
3. How frequent the agents of HUL Visit You
o More than once a
week
o Once a week
o Once a fortnight
o Once a month
4. How many orders you place a month ?
..............................................................................
5. How much quantity is there in single purchase?
....................................................................................
6. Which Product you find most difficult to sell?
..............................................................................
7. Which Product you find most easily sold?
..............................................................................

79
8. How much margin do you get on the HUL Products?
Snacks ..........................................
Staple ..........................................
Confectionery ..........................................
Packed Food ..........................................
Biscuits ..........................................
9. Is there additional incentive for promotion of HUL product? If Yes
Specify the Type of Incentive
..........................................................................................
10. What is the Selling Technique adopted by the HUL?
........................................................................................
11. What type of promotional offers you get from HUL?
.........................................................................................
12. Do you get attracted by such offers?
..........................................................................................
13. What type of promotional offers is there for the final customers?
..........................................................................................
14. Dose the customer have knowledge of the product?
............................................................................................
15. Dose the customer have knowledge of the Company?
16. Are the customers attracted by the adds.
o Yes o No
17. Which other FMCG Company’s Product You Deal in?
HUL
P &G
Any Other ...................
None

80
18. Which Company’s Products are demanded the most by the customers?
.........................................................................................
19. What is the difference between that company and HUL promotion
techniques.
................................................................................................................................
..................................................................
20. Are you satisfied with the approach of the HUL if Not Give your
Suggestions
...........................................................................................................................
...........................................................................................................................
...........................................................................................................................
...........................................................................................................................
...........................................................................................................................
...........................................................................................................


![5cr+ lcm 5mm 2.5cm 24 2.5cm lcm 26cm 26cm 16cm 3.5cm lcm … · 2019-08-06 · .5cr+ lcm 5mm 2.5cm 24 2.5cm lcm 26cm 26cm 16cm 3.5cm lcm vol. : 10 era 19.5cm 25cm [7] (A4#4ÃL1-E)](https://img.dokumen.tips/doc/110x75/5f56c58c967c2a15a3138f0b/5cr-lcm-5mm-25cm-24-25cm-lcm-26cm-26cm-16cm-35cm-lcm-2019-08-06-5cr-lcm.jpg)