Embed Size (px)
Citation preview
946 LCGC NORTH AMERia VOLUME 26 NUMBEH 9 SEPTEMBER 2008 www. chromstograp hyon line.com
Stability of Formic Acid in MethanolSolutions and the Implications for Usein LC-MS Gradient Elution Analysis
Karel AJ. Snoble, Neal M.Fox, Sandra M. Lorenz,Anthony R. Kemperman, andJ.T. Przybytek
Honeywell Burdick &. JacksonMuskegon, Michigan
Please direct correspondence toKarel Al Snoble atkarel.5noble@honeywell. com
Dilute formic add solutions in methanol were found to decline in acidcontent with time, the extent of the decline depending upon the initialamount of water present in these solutions. The effect of the formicacid concentration change upon the separation of peptides using highperformance liquid chromatography (HPLC) is examined briefly.
Solvent blends modified with smallamounts of additives are exten-sively used for performing gradi-
ent high performance liquid chromatog-raphy (HPLC) analyses ( 1 ). Manysolvent-water-additive combinations areemployed. Acidic modifiers are usedextensively for the analysis of proteins ofvarious molecular vi'eights. In the case ofHPLC coupled with mass spectrometry(MS) detection, acid additives (or modi-fiers) such as trifluoroacetic acid, formicacid, atîd acetic acid often are used (2).
Formic acid as a solvent modifier hasbeen used extensively as an alternative totrifluoroacetic acid. This is due to formicacid's relatively lower ability to suppressfragment ion detection in rime of flight(TOF)-MS analysis using electrosprayionization (ESI) of samples comparedwith trifluoroacetic acid (3). While thereis less signal suppression with formk acidcompared with trifluoroacetic acid, thereis a possible sacrifice of signal resolutionwith a formic acid modifier.
In earlier work, we showed that theconcentration of formic acid in acetoni-trile and water gradient solutions forLC-MS analysis of certain peptides criti-cally affected the success of the analysis
(4). This finding indicated that carefulcontrol of the formic acid content of sol-vent blends used for gradient chromatog-raphy was important for success.
In our work examining the propertiesof formic acid—modified solvent andwater blends, we observed that some ofthese blends were not stable with timewhen stored at ambient temperatures. Inparticular, we noted that 0 .1% (v/v)formic acid blends in methanol signifi-cantly and often rapidly degraded withtime. We detected these changes by titri-metrically monitoring the free acid con-tent over time of freshly prepared sam-ples. This note summarizes our findingsconcerning the stability of formicacid-niethanol blends.
ExperimentalGC-MS data were collected using Shi-madzu GCMS-QP2010 and GC-2010systems (Columbia, Maryland) with aSupeico 105m RTX-1 column (Belle-fonte, Pennsylvania). The column flowwas 2 mL/min, and the split ratio was5:1. The temperature program was 10min at 60 "C, 5 °C/min to 260 "C, hold12 min. The scan range was 15 to 450m/z, and the El voltage was 70 kV.

www.chromatographyonline.corTí SEPTEMBER 2008 LCGC riDRTHAMERICA VOLUME26 NUMBERS 9 4 7
0.10
0.08
1" 0.06
^ 0.04
0.02
0.000 100 200 300
Elapsed400 500 600 700
time (h)
Table I: Estimated first half-lives fromformic acid titration curves
- -%Water (v/v) Est. First tytl- (h)
88
86
121
10
50
100
Figure 1: Acid titer of 0.1% (v/v) formic acid in methanoi with time at roomtemperature.
LC-MS data were collecrcd using anAgilent 1200 Series HPLC sysrem (SantaClara, California) and a Gemini Phe-nomenex C18 column (150 mm X 2.0mm, 3 M-m particles) (Torrance, Califor-nia) with a TOF-MS detector. UVdetection at 245 nm also was employed.Gradient method: At 0 min, 95% A(0.1% formic acid-water); at 50 min,30% B (0.1% formic acid-merhanol); at80 min, 60% B; at 85 min, 5% B holduntil 87 min. The flow rate was 0.20mL/min. The column was thermostatedat 30 °C. MS-TOF conditions: ionpolarity was positive; m/z range was100-2800; die gas temperature was 350"C; the ESI capillary voltage was 3 kV;and the fragmenter voltage was 1 80 V.
Titration data were collected over timeusing a Metrohm 736 GP Titrino autoti-trator (Houston, Texas). A dilution ofthree parts water to one part formic acidblend was used to prepare the titrationsamples. The titrant was a 0.1 N potas-sium hydroxide solution in methanol.
Fluka Chemika formic acid (Buchs,Switzerland) and Honeywell BurdJck &Jackson B&J Brand methanol and water(Muskegon, Michigan) were used to pre-pare the formic acid in methanol and theformic acid in methanoi-water blends.All methanol and water solutions wereprepared by volume. Formic acid wasthen added by volume to prepare the var-ious 0 .1% (v/v) formic acid in
methanol-water blends that were evalu-ated. The solutions were kept in sealedbottles and at ambient temperature,20-22 "C.
A nine-peptide test mixture fromSigma was used for HPLC performanceevaluations (bradykinin, bradykinin frag-
Table II: Estimated second order rateconstant from characteristic kineticcurve regression analysis
%Water (v/v) k (L/mol-sec) R-Sq (adj)
i.nE-4
10
0.9E-4
0.78E-4
993
99.5
99.7
100.0
Turnkey Sample PrepDramatically increase throughput, remove risk, and guarantee your results,with an automated sample preparation solution from Horizon Technology.
Horizon Technology is a leading manufacturer of automated samplB prep sdufionsfor labs that perform EPA methoddogies on drinking water The SPE-DEX® 4790 HAutomated Extraction System utilizing 'Cer^fied for Automation' ^ , BAtiantic EPA Method Specific Disks, coupled with the DryVap™Concentrator System slashes • sample processingtimes and solvent use, providing " , the highest qualityresults at the lowest cost. S A
REMOVE YOUR RISKGUARANTEE YOUR RESULTS
Contact us today to leann more,or visit our web site to downloadour lastest Appiication Notes,developed in conjunction withHorizon Technology customers.
Call: 1.800.997.2997Email: [email protected]
Visit: www.honzontectiinc.com/lcgc
• Horizontechnology
Í NontwaeUm [MvaSMm Nh 09079
f

9 4 8 LCGC NORTH AMERICA VOLUME 26 NUMBER 9 SEPTÍMBER 2008 www.chromatographyonllne.com
s.»
.s.
4.0-
2.ai
0.0.
Methanol
Water
r J
MMhyl loi m a te
1 1 Formic acid
12.0 13.0
Figure 2: GC-MS total ion chromatogram of 0.1% (v/v) formic acid in methanol.
0.030
0.025
¿ 0.020
1i 0.015
\ 0.010
^ 0.005
0.000
*
1
0 100 200
'^'•%
300
Ela
1
400
ised lim
500 600
eih)
- • •
700 800
Melhanol/waiGiratfO (v/vl
• 100/0• 99/1• 95/5* 90/10• 50/50
Figure 3: Plot of formic acid concentration versus time in various methanol-watersolutions.
-.35
-4.0
11 -5.0
-5.5
-6.0
•
0
k
*
II. * *
%
100 200
* • •
300 400
Elapsed time
• » *•
500 600
(h)
t •
700 800
Methanol/waierblend (v/v)
• 100/0• 99/1• 95/5* 90/10» SO/50
Figure 4: Plot of the natural logarithm of formic acid concentration versus time invarious methanol-water solutions.
menr 1-5, substance P, [Arg8] — vaso-pressin, Liiteinizing hormone releasinghormone, bombesin, leucine enkephalin,methionine enkephaÜn, and oxytocin).
Results and DiscussionWhen 0 .1% (v/v) formic acid inmethanol blends were prepared in thelaboratory or on a large scale, we noredthat the acid content of such blendsappeared to change rapidly with time atambient temperature. Figure 1 shows theresults of titrimetrically determined acid-ity of such blends. We can estimate thefirst half-life of this particular blend to beapproximately 88 h.
We subsequently examined the blendusing GC-MS (Figure 2). The peak at10.6 min was identified as methyl for-mate, the esterification reaction productof formic acid and methanol. That thisester formed so rapidly in an anhydroussystem at room temperature was not sur-prising (5,6).
We decided to determine whether ornot this reaction might still occur if waterwas added to the formic acid-methanolblend. It was anticipated that increasingthe amount of water in the originallyanhydrous blend would slow the reactiondown sufficiently to provide a longer firsthalf-life for the blend. To this end several0.1 % (v/v) formic acid inmethanol-water blends were preparedand the acid value monitored with time.The collated data appear in Figure 3.
It is clear from the data that even thewater content of a 50:50 (v/v)methanol-water blend did not slowdown appreciably the initial rapid loss offormic acid. The blend is more stable athigher water contents: after approxi-mately 2400 h, the acid titer for a 95%water blend was 0.09%. The 100% waterblend is stable with time. Table I showsthe first half lives estimated from theplots of Figure 3. Please note that thesamples were kept at ambient tempera-ture, and not in a thermostat at a con-stant temperature.
With our available data, we used themethod of characteristic kinetic plots toattempt to determine the reaction orderof the esterification reaction (7). Figures3-5 show the characteristic plotsobtained. Examination of these plots sug-gest that the solutions of 0.1% (v/v)formic acid in methanol with 0, 1,5, and
www.tLhromatographyonlme.com SEPTEMHER 2008 LCGC NORTH AMERICA VOLUME 26 NUMBER 9 9 4 9
o
la
1E
350
300
250
200
150
100
50 ^
0
0
•
• *
,Jf *y •
• ^ *
100 200 300 400 500 600 700 800Elapied time (h)
MelhanolMaterblend (v/v)
• 100/0• 99/1• 9S/5* 90/10' 50/50
Figure 5: Plot of the inverse of formic acid concentration versus time in variousmethanol-water solutions.
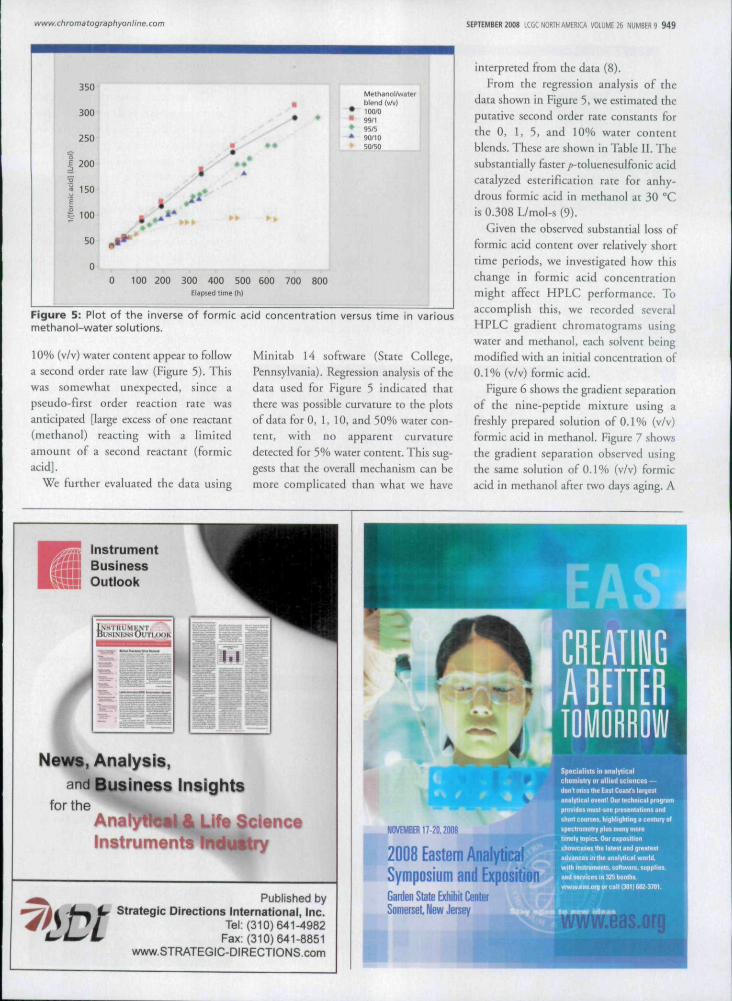
10% (v/v) water content appear co followa second order rate law {Figure 5). Thiswas somewhat unexpected, since apseudo-first order reaction rate wasanticipated [large excess of one reactant(methanol) reacring with a limitedamount of a second reactant (formicacid].
We further evaluated the data using
Minitab 14 software (State College,Pennsylvania). Regression analysis of thedata used for Figure 5 indicated thatthere was possible curvature to the plotsof data for 0, 1, 10, and 50% water con-tent, with no apparent curvaturedetected for 5% water content. This sug-gests that the overall mechanism can bemore complicated than what we have
interpreted from the data (8).From the regression analysis of the
data shown in Figure 5, we estimated theputative second order rate constants forthe 0, I, 5, and 10% water contentblends. These are shown in Table II. Thesubstantially faster ;i-toluenesulfonic acidcatalyzed es te rifï cation rate for anhy-drous formic acid ¡n methanol at 30 °Cis Ü.308 L/mol-s (9).
Given the observed substantial loss offormic acid content over relatively shorttime periods, we investigated how thischange in formic acid concentrationmight affect HPLC performance. Toaccomplish this, we recorded severalHPLC gradient chromatograms usingwater and methanol, each solvent beingmodified with an initial concentration of0.1% (v/v) formic acid.
Figure 6 shows the gradient separationof the nine-peptide mixture using afreshly prepared solution of 0.1% (v/v)formic acid in methanol. Figure 7 showsche gradient separation observed usingthe same solution of 0.1% (v/v) formicacid in methanol after two days aging. A
InstrumentBusinessOutlook
News, Analysis,and Business Insights
for theAnalytical & Life ScienceInstruments
Published byStrategic Directions International, Inc.
Tel: (310)641-4982Fax; (310) 641-8851
www.STRATEGIC-DIRECTIONS.com
NdVEMBB117-20.2IHia
2008 Eastern AnalyticalSymposium and ExpositionGanten State Exhibit CenterSommet New Jersey www.eaS.org
9 5 0 LCGC NORTH AMERICA VOLUME 26 NUMBER 9 SEPTEMBER 2008 wvvw. chromatographyoniine, com
Figure 6; LC-MS-TOF analysis of a nine-peptide mixture using freshly prepared 0.1%(v/v) formic acid in methanol in a gradient with 0.1% (v/v) formic acid in water.
«.a 5.0 6.0Elapsed time (min)
Figure 7: LC-MS-TOF analysis of a nine-peptide mixture using two-day-old 0.1% (v/v)formic acid in methanol in a gradient with 0.1% (v/v) formic acid in water.
«.0 5.0 «.0Elapsed time (min)
Figure 8: LC-MS-TOF analysis of a nine-peptide mixture using methanol in a gradientwith 0.1% (v/v) formic acid in water.
slight shift in retention times hasoccurred, with some change inrésolution.
The apparent small effect of formicacid concentration in methanol uponthe chromatography of the nine-pep-tide solution led us to explore whetheror not formic acid in methanol wasrequired at all for a successful separa-tion of this nine-peptide mixture. Thechromatogram of Figure 8 shows thatsome amount of formic acid inmethanol is required for hasehne stabil-ity and for better chromatography forthis nine-peptide mixture.
ConclusionBlends of formic acid in methanol withand without added water are not stableand can affect adversely some types ofChromatographie applications.
References(1) Snyder and Kirkiand, [ncroduction ro Mod-
ern Liquid Chromatography, Second Edi-
tion (John Wiley & Sons, Inc, New York,
1979).
(2) M.C. Garcia, / Chrom.. B825(2), 111-123
(2005).
(3) e.G. Huberand A. Premsrallcr,/. Chrom.. A
849, 161-173 (1999).
(4) A. Kemperman. P. Scheidle,}. T. Przybytek,
K. A. Snoble. K. D. Ulrich, and C. L.
Scaver, Design of High Purity Blends for
Chromacography Utilizing Six Sigma
Methodology: Part 2 - Commercialization,
Poster #150-1 presented at PITTCON
2006,
(5) R- Boekmeicr, Praxis der Naturwis-
senschaften. Chemieî6{5), 7-10 (1987).
(6) A.E. Sommerfield, School Science Review
54(189), 769-70(1973).
(7) See www.chm.davidson.edu/ChemistryAp-
plets/index.html for a discussion of che
topic. See also M. R. Wtighi, An Introduc-
tion to Chemical Kinetics (John Wiley &
Sons Ltd., West Sussex. UK, 2004).
(8) L.F. Fieser and M. Fieser, Advanced Organic
Chemistry (Reinhold Publishing Corpora-
tion, New York, 1961), pp. 372-373.
(9) K.E. Schulte and J. Kirschner, fetce und
Seifen 53, 267-271 (1951). •
For more information on this topic,please visit
www.chromatographyonline.com/hyphenated


![Review Overview of the applications of liquid ...quimica.udea.edu.co/~carlopez/cromatohplc/review_hplc_ms_foods.pdfgiving positive identification of components of ... [29–31] mass](https://img.dokumen.tips/doc/110x75/5adb8ac87f8b9aee348e2d80/review-overview-of-the-applications-of-liquid-carlopezcromatohplcreviewhplcmsfoodspdfgiving.jpg)


![Review Analytical-scale supercritical fluid extraction: a ...quimica.udea.edu.co/~carlopez/cromatogc/sfe polluntants... · Analytical-scale supercritical fluid extraction ... [lo],](https://img.dokumen.tips/doc/110x75/5ab139fa7f8b9a6b468c4025/review-analytical-scale-supercritical-fluid-extraction-a-carlopezcromatogcsfe.jpg)