Embed Size (px)
Citation preview

SDEWES 2014, Venice - Istanbul, September 20-27, 2014 1
LCA-Based Multiobjective
Synthesis of Sustainable
Systems
Zdravko Kravanja
University of Maribor,
Faculty of Chemistry and Chemical Engineering,
Smetanova 17, 2000 Maribor, Slovenia

2
Slovenia in Pictures Area: 20,273 km2
Population: 2.0 million Capital city: Ljubljana Language: Slovenian; also Italian and Hungarian in nationally mixed areas Currency: EURO, € Member of EU - 1 May 2004
EU Presidency for 2008


SDEWES 2014, Venice - Istanbul, September 20-27, 2014 4
OUTLINE
• Incentives for Sustainable Development
• LCA-based Mathematical Programming for Sustainable
System Synthesis
• Expanding Systems Boundaries
• Tools and Concepts Integration
• New Concept Considering Burdening and Unburdening
Effects on Environment in Multiobjective Optimization:
• Total Footprints,
• Total Sustainability Index, and
• Eco-Profit and Total Profit
• Synthesis Applications of Renewables Integration and
Bioenergy Production
• Conclusion

SDEWES 2014, Venice - Istanbul, September 20-27, 2014
1.1 Exponential Rise of Civilization
After Michio Kaku, Hyperspace, 1994
Classification of future civilizations by
Nikolai Kardashev
• Type I - Controls the energy of entire
planet (weather, earthquakes, mines deep
into the core, harvests the oceans)
• Type II – Control the power of the sun
(mines it and directly consumes its
energy)
• Type II – Controls the power of the whole
galaxy (probably manipulates space-time
continuum)
Scale of power:
1015 W
1020 - 1025W
1025 - 1030 W
For further flourish of our civilization new inventions for mass to energy
transformation (E=m.c2) would be needed!
Incentives

SDEWES 2014, Venice - Istanbul, September 20-27, 2014
Where are We Today?
Word Energy Consumption
6 Incentives
Fig. 1: World delivered end-user energy
consumption
Fig. 2: Shares of world industrial sector
delivered energy consumption, 2010
Source: International Energy Outlook 2013, U.S. Energy Andministration Angency, http://www.eia.gov/forecasts/ieo/industrial.cfm
Quadrillion Btu=1.055 1018 J
Type 0 Civilization - 14 TW

SDEWES 2014, Venice - Istanbul, September 20-27, 2014
Fig.??
After Marquardt Wolfgang, Lars Von Wedel, and Birget Bayer.
AspenWorld 2000, Orlando, FL, 2000
r
Energy, EJ/y
Figure 3: Energy involved in chemical and process industries
• Separation processes alone represent about 15%, or even 25% of
total world energy consumption!
E(exa)=1018
Chemical and Process Industies Energy
Consumption
Koros WJ. <energy.gatech.edu/questions/koros.php>; 2011
TUDelta. <delta.tudelft.nl/article/dow-awards-separation-by-freezing/24054>
Incentives

SDEWES 2014, Venice - Istanbul, September 20-27, 2014
Unsustainable Use of Energy Resources
8 Incentives
Fig. 4: World marketed energy consumption
Fig. 5: Global carbon emissions
from fossil fuel burning
Source: Energy Information Administration (EIA), International
Energy Outlook 2011, World energy consumption by fuel 1990-2035,
www.eia.doe.gov/iea/http://www.eia.gov/forecasts/ieo/highlights.cfm.
Accessed 23.08.2012
Source: Center for climate and energy solutions, Historical
global CO2 emissions, www.c2es.org/facts-
figures/international-emissions/historical. Accessed
23.08.2012

SDEWES 2014, Venice - Istanbul, September 20-27, 2014
1.2 Global Energy System
174 PW
Balance (PW): Accumulation = Inlet - Outlet
From Sun - (Reflected + Radiated)
= 174 - 173.5 = + 0.5 PW d
dt
173.5 PW
ΔP = 0.5 PW
Figure 6: Systems analysis when applied to the global energy system
Climate forcing 0.85 ± 0.15 W/m2, Hansen J, 2005
Around 1 W/m2, Meehl et al., 2011
Imbalance ΔP = 0.5 PW, Kravanja, 2012
9 Incentives
FUSION FISSION

SDEWES 2014, Venice - Istanbul, September 20-27, 2014 10
Global Temperature Rise
Fig. 7: Global land-ocean temperature index (data.giss.nasa.gov/gistemp/graphs_v3)
• The imbalance of the last decade heat has gone into deep oceans
• If climate forcing in 2050 reaches 4.5 W/m2, what consequences
might be expected?
Incentives

SDEWES 2014, Venice - Istanbul, September 20-27, 2014
• Global Social Cost of Carbon (GSCC) is 158 $/tCO2
• Global emission 33 Gt CO2/y
• Global damage:
158$/tCO2 x 33 Gt CO2/y = 5-6 trillion $/y
1/10 of the global GDP (69 trillion $/y)
Global Damage Due to CO2 Emissions
Global damage due to CO2 at least 5-6 trillion $/y!!
Trillion = 1012
11 Incentives

SDEWES 2014, Venice - Istanbul, September 20-27, 2014
• CO2 emission – global warming with unknown consequences
• NOx emission – eutrophication, smog formation, ozone
depletion, also global warming and biodiversity loss
(damage even higher than by CO2)
• Biodiversity loss – irreversible due to the extinction of
species (extinction rate is up to 140,000 species per year)
Global Damage Due to Human
Unsustainable Practice
Conclusion: Global BDP is significantly overestimated!
Stagnation when (ΔGDP – ΔEco-loss)<0
Net GDP (€/y) = GDP – Eco-loss = GDP – GDP/2 = GDP/2
Sustainable development considerably improves global
economics!
12
1/10 GDP
?/10 GDP
>1/10 GDP
Incentives

SDEWES 2014, Venice - Istanbul, September 20-27, 2014
1.3 Sustainable Development and
3x3x3 Matrix of Sustainability
Nature Sustainability
Eco-centric 3
Expanded- 2
anthropozentric
Strategies Narrow 1
anthropozentric 3 Sufficiency
2 Consistency
1 Efficiency
1 2 3
Just Reward for Work
Respect for Private Property
Fair Distribution of Goods
Principle of Justice, Economics, Etics
1
8
27
Figure 8: Diagonal as a measure of sustainability
M. F. Jischa, Chem. Eng. Technol. 21, 1998
13
Source: M. F. Jischa, Chem. Eng. Technol. 21, 1998
Incentives

SDEWES 2014, Venice - Istanbul, September 20-27, 2014
Sustainable Development: Blue Map – New
Scenario for CO2 Emissions
Fig. 9: Blue Map scenario and key technologies for reducing CO2 emissions OECD/IEA. Energy Technology Perspectives 2010, Scenarios & Strategies to 2050, http://www.iea.org/techno/etp/etp10/English.pdf
Note: renewables mostly solar and wind, others hydro, biomass and waste,
geothermal, and oceanic
14 Incentives

SDEWES 2014, Venice - Istanbul, September 20-27, 2014 15
• Incentives for Sustainable Development
• LCA-based Mathematical Programming for Sustainable
System Synthesis
• Expanding Systems Boundaries
• Tools and Concepts Integration
• New Concept Considering Burdening and Unburdening
Effects on Environment in Multiobjective Optimization:
• Total Footprints,
• Total Sustainability Index, and
• Eco-Profit and Total Profit
• Synthesis Applications of Renewables Integration and
Bioenergy Production
• Conclusion

SDEWES 2014, Venice - Istanbul, September 20-27, 2014 16
2. Holistic Design Methodology:
LCA-Based System Synthesis
Synthesis is the automatic generation of design
alternatives and the selection of the better ones
A. W. Westerberg, 1991
1. Holistic systems approach
2. System boundaries expanded to the synthesis of whole supply-
chains and their networks comprising of sustainable alternatives
3. Automatic flowsheet synthesizer, e.g. MIPSYN,
CAPE concepts and tool integration
4. Multiobjective LCA-based system synthesis considering:
• direct (burdening) and
• indirect (unburdening) environmental impacts
LCA-Synthesis

SDEWES 2014, Venice - Istanbul, September 20-27, 2014
SUSTAINABLE SOLUTIONS
Multi-criteria approach (MOO)
Social aspectsEnvironmental
(un)burdens
Economic
efficiency
Global
optimisation
Multi-level
modelling
Widening systems‘
borders
GLOBAL SOLUTIONS
Global approach
SEMPISINTEGRATED SOLUTIONS
Simultaneous approach
Spatial and
temporal integration
Concepts, methods
and CAPE tools,
integration
Process Integration,
synthesis and
intesification
17
2.1 Holistic Systems Approach
HSA
Fig. 10: Elements of the holistic systems approach
LCA-Synthesis

SDEWES 2014, Venice - Istanbul, September 20-27, 2014
But the
creative principle
resides in
mathematics.
In a certain sense,
therefore, I hold true
that pure thought can
grasp reality, as the
ancients dreamed.
Albert Einstein
2.2 Creative Principles in Mathematics
LCA-Synthesis

SDEWES 2014, Venice - Istanbul, September 20-27, 2014 19
Creative Principles of MP
Optimality Competitive advantage
Feasibility Constraints satisfied
Integrality Simultaneous considerations
Creative principles of MP enables:
• Creation of new knowledge and
• New innovative solutions
Study of solutions enables one to get new insights, e.g.
simultaneous Heat Integration and process flowsheet
optimization also reduces raw material usage. (Lang, Biegler, Grossmann, 1988)
LCA-Synthesis

SDEWES 2014, Venice - Istanbul, September 20-27, 2014 20
2.3 Superstructure Approach for Systems
Synthesis
1. Generation of a superstructure composed of different
alternatives:
• Reaction networks
• Separation networks
• Heat exchanger networks
• Process schemes, etc.
2. Formulation of a mixed-integer nonlinear programming
(MINLP) model
3. Solution by a suitable MINLP algorithm (OA/ER, General
Benders Decomposition, Extended Cutting Plane..)
LCA-Synthesis

SDEWES 2014, Venice - Istanbul, September 20-27, 2014
MINLP Model Formulation for Different
Levels of Innovations:
a) max z = cTy + f(x) – e(x)
b) s.t hi(x) = 0
c) gi(x) 0
d) Biy + Cix bi
x X = x Rn: xLO x xUP
y Y = 0,1m
a) Objective function as a real-world economic function (cost benefit
approach):
Max Profit = Production income - Raw material cost - Utility cost
- Investment cost – Environmental loss
b) Equality constraints: mass and energy balances, design equations
c) Inequality constraints: product specifications, operational, environmental
and feasibility constraints
d) Logical disjunctive constraints for selection of sustainable alternatives
i Subsystems }
LCA-Synthesis

SDEWES 2014, Venice - Istanbul, September 20-27, 2014
2.4 Challenges Related to the Manifolds
Nature of the Synthesis Problems
22
Many complex interactions Simultaneous
Discrete and continuous decisions MINLP
Uncertainty Flexible multiperiod
Dynamic systems MIDNLP, multiperiod
Rule-based decisions Logic-based
Multicriterial Multiobjective LCA-
based
Features: Approach:
LCA-Synthesis

SDEWES 2014, Venice - Istanbul, September 20-27, 2014 23
• Incentives for Sustainable Development
• LCA-based Mathematical Programming for Sustainable
System Synthesis
• Expanding Systems Boundaries
• Tools and Concepts Integration
• New Concept Considering Burdening and Unburdening
Effects on Environment in Multiobjective Optimization:
• Total Footprints,
• Total Sustainability Index, and
• Eco-Profit and Total Profit
• Synthesis Applications of Renewables Integration and
Bioenergy Production
• Conclusion

SDEWES 2014, Venice - Istanbul, September 20-27, 2014
3.1 Simultaneous vs. Sequential Strategy
Methanol Example Problem
Process synthesis and:
• sequential HEN synthesis: - 1,192,000 $/yr (loss!)
• simultaneous HI by Duran-Grossmann’s model: - 292,000$ $/yr (loss!)
• simultaneous HEN synthesis by Yee’s model:
• Yee, Grossmann, Kravanja (1990) 1,845,000 $/yr (profit!).
• Kravanja and Grossmann (1994) 2,613,000 $/yr (profit!)
Figure 11: Methanol process
and HEN superstructure
Figure 12: Optimal process
scheme with HI HEN
24 Simultaneous

SDEWES 2014, Venice - Istanbul, September 20-27, 2014 25
3.2 Simultaneous vs. Sequential Strategy
Scope of HI in Total Sites
T
cold stream
hot stream
hot stream
cold stream
Figure 13: HI at process level Figure 14: HI at Total Site level
Process level: heat exchange occurs directly between the hot and cold
streams
Total Site (TS) level: where mostly indirect heat exchange is performed
between hot and cold streams via an intermediate utility
H
Simultaneous

SDEWES 2014, Venice - Istanbul, September 20-27, 2014 26
Total Site
CENTRAL UTILITY SYSTEM
Utility 1
Utility 2
Utility 3
Unit A
Production
Unit B
Service Sector
Unit C
Residental...Unit D
Business
Unit E
Agricultural Sector
Power Station
Figure 15: Scheme of Total Site Extended form Perry et al. (2008)
Figure 16: Extended for renewables Source: Klemeš et al., CERD, 2013
Varbanov, P.S., Klemeš, J.J., 2011
Dhole and Linnhoff, 1993; Raissi, 1994; Klemeš et al., 1997
Perry, Klemeš, Bulatov, 2008 - LIES
Simultaneous

SDEWES 2014, Venice - Istanbul, September 20-27, 2014 27
Simultaneous Strategy
H1P1
H2P1
H1P2
H2P2
C1P1
C2P1
C1P2
C2P2
PROCESS 1
PROCESS 2
PROCESS 1
PROCESS 2
k = 1 k =2 k = 3 k = 4 k = 5stage = 1 stage =2 stage = 3 stage = 4
LPS
MPS
condensate
condensate
Figure 17: General
superstructure -
simultaneous
strategy
Heat exchange matches on process level and Total Site considering
intermediate utility (indirect process-to-process heat exchange) are
included in each stage
Simultaneous

SDEWES 2014, Venice - Istanbul, September 20-27, 2014 28
Issues Matters
STRATEGY: SAVINGS in NPV
• Simultaneous Strategy vs. Sequential Strategy 64 %
• Pressure level optimization 33 %
• Future forecasted utility prices 18 %
Other considerations:
• Pipeline investment ~up to 34.2 % of the total investment.
• Heat losses ~ can be up to 44.8 % at fixed utility pressure levels when no
preheating was considered
• Pressure drops simultaneously with the evaluation of pipe diameters ~ pressure
drops can be quite high ( even 4 bar)
• Preheating of fresh water due to unrecovered condensations it significantly
reduces ENPV by 11.0 %, the hot utility consumption increased by 33.2 %
Nemet, Klemeš, Kravanja, 2014 DOI: 10.1016/j.compchemeng.2014.07.004
Simultaneous

SDEWES 2014, Venice - Istanbul, September 20-27, 2014 29
3.3 Expanding the Synthesis to the Whole
(Bio)-chemical Supply Chain
Fig. 18: Simplified (bio)-chemical supply chain.
Feed 2
Cond.
Reb.
Dist.
prod.
Feed 1
Feed 2
Cond.
Reb.
Dist.
prod.
Feed 1
Feed 2
Cond.
Reb.
Dist.
prod.
Feed 1
Feed 2
Cond.
Reb.
Dist.
prod.
Feed 1
Feed 2
Cond.
Reb.
Dist.
prod.
Feed 1
Cond.
Reb.
Dist.
prod.
Feed 1
Cond.
Reb.
Dist.
prod.
Cond.
Reb.
Dist.
prod.
Cond.
Reb.
Cond.Cond.
Reb.Reb.
Dist.
prod.
Feed 1Feed 1
Industrialization
Innovatio
n
Sustainability
Feed 2
Cond.
Reb.
Dist.
prod.
Feed 1
Feed 2
Cond.
Reb.
Dist.
prod.
Feed 1
Feed 2
Cond.
Reb.
Dist.
prod.
Feed 1
Feed 2
Cond.
Reb.
Dist.
prod.
Feed 1
Feed 2
Cond.
Reb.
Dist.
prod.
Feed 1
Cond.
Reb.
Dist.
prod.
Feed 1
Cond.
Reb.
Dist.
prod.
Cond.
Reb.
Dist.
prod.
Cond.
Reb.
Cond.Cond.
Reb.Reb.
Dist.
prod.
Feed 1Feed 1
Feed 2
Cond.
Reb.
Dist.
prod.
Feed 1
Feed 2
Cond.
Reb.
Dist.
prod.
Feed 1
Feed 2
Cond.
Reb.
Dist.
prod.
Feed 1
Feed 2
Cond.
Reb.
Dist.
prod.
Feed 1
Feed 2
Cond.
Reb.
Dist.
prod.
Feed 1
Cond.
Reb.
Dist.
prod.
Feed 1
Cond.
Reb.
Dist.
prod.
Cond.
Reb.
Dist.
prod.
Cond.
Reb.
Cond.Cond.
Reb.Reb.
Dist.
prod.
Feed 1Feed 1
IndustrializationIndustrialization
Innovatio
n
SustainabilitySustainability
NEW Feedstock:
- Recycled
- Waste
- Renewable
NEW Products:
Environmentaly
benign
Kravanja, CACE 2010
Simultaneous

SDEWES 2014, Venice - Istanbul, September 20-27, 2014 30
Expanding the Synthesis to
Energy Supply Chain
Time
scale
Reactions
Production
Length
scale
fm Gm km m
fs
s
day
year
Transmission
(smart grid) Consumption
Fig. 19: Achieving global solutions through the integrated energy supply chain
Resources:
- Cascaded
- Waste
- Renewable
Energy:
Environmentaly
benign
Kravanja, 2009
Simultaneous

SDEWES 2014, Venice - Istanbul, September 20-27, 2014 31
Expanding the Synthesis to Regional
Supply/Demand Renewable Networks
x x
x x x
x x x
x x
#
# #
# # #
Layer 1: Agricultural supply i = zones
Layer 2: Collection and
pretreatment processes m = intermediate points
Layer 3: Production plants n = plants
Layer 4: Demand/ End users j = demands
FL1L2(i, j, pi)
FL2L3(m ,n, pi)
FL2F4(m ,j, pd)
FL3L4(n ,j, pp)
yL2 (m) = To determine the location of
collection points and also the
pretreatment processes : drying/
compaction/ densification
yL3 (n) = To determine the location of plants
yL3pt (n, pp, t) = for technologies selection
Fig. 20: SDRN superstructure
Čuček, Lam, Klemeš, Varbanov, Kravanja, 2010
Biomass
Green Products
Simultaneous

SDEWES 2014, Venice - Istanbul, September 20-27, 2014 32
• Incentives for Sustainable Development
• LCA-based Mathematical Programming for Sustainable
System Synthesis
• Expanding Systems Boundaries
• Tools and Concepts Integration
• New Concept Considering Burdening and Unburdening
Effects on Environment in Multiobjective Optimization:
• Total Footprints,
• Total Sustainability Index, and
• Eco-Profit and Total Profit
• Synthesis Applications of Renewables Integration and
Bioenergy Production
• Conclusion

SDEWES 2014, Venice - Istanbul, September 20-27, 2014 33
4.1 Tools Integration:
LCA-based Synthesizer
0,70
0,80
0,90
1,00
1,10
1,20
0,60 0,70 0,80 0,90 1,00 1,10 1,20 1,30 1,40 1,50 1,60
GEI
Rel
ativ
e pr
ofit
Graphical output
Ecoinvest
Synthesizer
LCA, Database
Fig. 21: LCA-based synthesizer MIPSYN
MOO MOS
Tools Integration

SDEWES 2014, Venice - Istanbul, September 20-27, 2014
Pinch approach MP approach Combined approach
Guiding principle Physical insights Clear concepts
Numerical Mathematics
Narrowing the searching space
Embedded principles
Consideration of physical laws
Optimality, feasibility, integrality
Both principles are considered
A single criterion Mainly technological criteria
Mainly economical criterion
Appropriate economic trade-offs
Multi-criteria consideration
Difficult to express graphically
MOO performed for several criteria
Multi-criteria can be considered
Degrees of freedom
Difficult to express graphically
Handles a large number of variables
Large problems can be solved
Data collection and verification
The physical inside makes the checking easier
A possibility to apply data reconciliation algorithms
Combination can be very beneficial
Jiří Jaromír Klemeš & Zdravko Kravanja, COCHE, 2013
4.2 Concepts Integration: Combining Pinch
Analysis and Mathematical Programming
Tools Integration

SDEWES 2014, Venice - Istanbul, September 20-27, 2014
Pinch approach MP approach Combined approach
Uncertain data and parameters
Limited number of uncertain parameters and limited flexibility
A reasonable number of parameters, reasonable flexibility
Feasible, realistic and flexible solutions can be obtained
Approach strategy
Can eliminate easily physically non feasible solutions
Simultaneous, fully integrated solutions
By both strategies in a sequence fully integrated solutions
Problem formulation
Graphical and algorithmic and form – easily understandable
Usually Equation-Oriented (EO) mathematical form.
Hybrid model enabling solving larger-scale problems
Easiness of formulation
Straightforward and mostly easy
Could be very complicated
Pinch is beneficial in the first step followed by MP
Easiness of problem reformulation
Very easy when supported by PTA
Many scenarios can be routinely performed
Pinch is again beneficial in the first step followed by MP
Opportunities of Employing a Combined
PA/MP Approach
Tools Integration

SDEWES 2014, Venice - Istanbul, September 20-27, 2014
Pinch approach MP approach Combined approach
Optimality of solutions
Global optimal targets can be indicated based on the thermodynamics
Locally optimal techniques and solutions
Pinch concept can guide MP solutions close to global optima
Comprehension of solution
Straightforward with graphical methods and PTA New insights
Not easy to be interpreted. New insights
Combined graphical interfaces to mimic MP solutions
Knowledge needed
Seems basic engineering, however needs a process expert
Advanced knowledge, both engineering and MP
Experienced Process engineer guaranties realistic solution for both approaches
Robustness Robust, which is important for engineering practice
LPs and MILPs robust, NLPs and MINLPs need good initialization
Overall robustness in solving large-scale problems is improved by the synergy
Current industrial acceptance
High, easily understandable to engineers on the ground
So far lower, boosted by engineering friendly interface
Could foster the acceptance of MP in process and other industries
Opportunities of Employing a Combined
PA/MP Approach
Tools Integration

SDEWES 2014, Venice - Istanbul, September 20-27, 2014
Achieving Energy Savings in Total Sites
37
Two widely used methodologies for energy consumption targeting:
Pinch Analysis and Mathematical Programming
Fig. 22: Total Site Profiles and intermediate
utility, (from Klemeš et al., 2010 )
Fig. 23: Heat integration solutions from
mathematical model
max
,
T
,
,
( ( ))max
s.t. ( , ) 0
( , ) 0 (F-MINLP )
( , ) , ,
( ) R , 0,1
,
x y
i
P i
mLO UP n
l s
f f
i
l s f
P c y f x
h x y
g x y
D
l L
R
s S
f FFP x y i I
x x x X y
1,f fi f
From boiler
Enthalphy [MW]
Tem
pera
ture
[°C
]
50
100
150
200
250
-25 -20 -15 -10 -5 0 5 10 15 20 25
CW4
3
2
1
1
2
3
4VHP
HP
MP
LP
Tools Integration

SDEWES 2014, Venice - Istanbul, September 20-27, 2014 38
Tools Integration for Retrofit of Total Site
I. Process Simulator
Data Acquisition
III. Graphical and
Numerical Output
Fig. 24: Three-level tool integration
Tools Integration
Source: http://www.aspentech.com/products/aspen-hysys.aspx
II. Combined Pinch/MP
Optimization
Efenis-Site
TransGen
GAMS
gdx and
chard files
Aspen, Hysis
Lidija Čuček & Zdravko Kravanja, PRES 2014

SDEWES 2014, Venice - Istanbul, September 20-27, 2014 39
• Incentives for Sustainable Development
• LCA-based Mathematical Programming for Sustainable
System Synthesis
• Expanding Systems Boundaries
• Tools and Concepts Integration
• New Concept Considering Burdening and Unburdening
Effects on Environment in Multiobjective Optimization:
• Total Footprints,
• Total Sustainability Index, and
• Eco-Profit and Total Profit
• Synthesis Applications of Renewables Integration and
Bioenergy Production
• Conclusion

SDEWES 2014, Venice - Istanbul, September 20-27, 2014 40
5. Multiobjective LCA-based System
Synthesis
• Sustainability and especially environmental indicators
defined on the LCA based principles
• Incomplete measurements for sustainability is one of
the major limitations of LCA methodology
• Consequences: poor or even wrong solutions and
decisions!
More advanced concept and measurements are
needed
Besides the direct (burdening), also indirect
(unburdening) effects caused by system‘s substitution
have to be considered
LCA-Synthesis

SDEWES 2014, Venice - Istanbul, September 20-27, 2014 41
LCA-based System Synthesis
New Concept: Direct and Indirect Effects
SYSTEM
Raw materials, which
burden the environment if
they are processed
DIRECT impacts (BURDEN)
Raw materials, which mainly
unburden or benefit the
environment , e.g. utilization of
waste rather than deposit
INDIRECT impacts
(UNBURDEN)
Products, which burden
the environment related to
processing, disposal, and
transportation
DIRECT impacts (BURDEN)
…….Products, which also
unburden or benefit the
environment due to products‘
substitution
INDIRECT impacts
(UNBURDEN)
The DIRECT effects of systems on the
environment represent direct burden of
the systems due to the extraction of
resources, materials production, use,
maintenance, recycling and/or disposal
including all transportation steps.
The INDIRECT effects are those sets of
impacts that indirectly unburden or benefit
the environment when waste is utilized
instead of being deposited or environmentally
benign raw-materials, products or services
are used instead of harmful ones.
TOTAL effects = DIRECT + INDIRECT effects
LCA-Synthesis

SDEWES 2014, Venice - Istanbul, September 20-27, 2014 42
Direct Effects:
1. Footprints
2. Sustainability
Index
3. Eco-cost (Vogtländer et al., 2010)
Total Effects: (Kravanja, COCHE, 2012)
1. Total Footprints (Čuček, Varbanov, Klemeš, Kravanja, Energy, 2012 )
2. Total Sustainability Index (Kravanja, Čuček, APEN, 2013)
3. Eco-profit and Total Profit (Čuček, R. Drobež, B. Pahor, Z. Kravanja, CCE, 2012)
LCA-based Synthesis Approach
Direct vs. Total Environmental Effects
+ Indirect
effects
LCA-Synthesis

SDEWES 2014, Venice - Istanbul, September 20-27, 2014 43
Towards Non-trade-off Solutions
General opinion: There is an opposition between economics
and environmental sustainability
• This is not always true as some alternatives can have
synergistic effects on both the environment and the
economics.
• Non-trade-off solutions can thus be obtained.
Fig.25. Pareto curve
LCA-Synthesis

SDEWES 2014, Venice - Istanbul, September 20-27, 2014 44
• Incentives for Sustainable Development
• LCA-based Mathematical Programming for Sustainable
System Synthesis
• Expanding Systems Boundaries
• Tools and Concepts Integration
• New Concept Considering Burdening and Unburdening
Effects on Environment in Multiobjective Optimization:
• Total Footprints,
• Total Sustainability Index, and
• Eco-Profit and Total Profit
• Synthesis Applications of Renewables Integration and
Bioenergy Production
• Conclusion

SDEWES 2014, Venice - Istanbul, September 20-27, 2014 45
5.1.1 Definition and Normalization of
Footprints
• Footprints cannot be easily compared since they can
have different measures, units, and qualities
• Footprints of studied alternatives are normalized,
e.g. by the values obtained at the maximal profit
or from some base-case design:
d
d0=
FPDRFP
FP
Direct Footprint at the maximal profit
Direct relative footprint Total relative footprint
d d t
d0 d0=
inFP FP FPTRFP
FP FP
Total Footprints

SDEWES 2014, Venice - Istanbul, September 20-27, 2014 46
Footprint-based MINLP Synthesis
Two-step multi-objective superstructural MINLP approach:
MINLP step I:
Economic-based synthesis where different footprints are obtained
by the maximization of profit from a given basic superstructure:
Reference point
MINLP step II:
The superstructure is augmented by sustainable alternatives and the ε-constraint method is applied for each relative footprint f ϵ F:
Multi-objective Pareto solutions
0 d,0and ,fP FP f F
d ind
, ,, and , ,k f k f kP FP FP f F k F
Total Footprints

SDEWES 2014, Venice - Istanbul, September 20-27, 2014 47
max
,
T
,
,
( ( ))max
s.t. ( , ) 0
( , ) 0 (F-MINLP )
( , ) , ,
( ) R , 0,1
,
x y
i
P i
mLO UP n
l s
f f
i
l s f
P c y f x
h x y
g x y
D
l L
R
s S
f FFP x y i I
x x x X y
1,f fi f
d
d,0=
FPRFP
FP
Direct footprint at the
maximal profit
Direct relative footprint
5.1.2 Direct Effects
Footprint–based MINLP
Loop around Solve statement
in GAMS
Small- and medium-sized supply-networks
Footprints: carbon, water, non-renewable energy, emission (water, air,
soil), food vs. fuel
Total Footprints

SDEWES 2014, Venice - Istanbul, September 20-27, 2014 48
0,00 0,20 0,40 0,60 0,80 1,00
Rela
tive p
rofi
t
Direct relative footprint
Fig.26: Profit vs. Direct footprint
Direct effects
Footprint-based Pareto Solutions, MINLP II
Total Footprints

SDEWES 2014, Venice - Istanbul, September 20-27, 2014 49
max
,
T
,
,
( ( ))max
s.t. ( , ) 0
( , ) 0 (F-MINLP )
( , ) ,
( ) R , 0,1
,
x y
l
i
P
s
l
i
mLO
s
f f
U n
if
P
P c y f x
h x y
y x y
TRFP x y i I
x x x
l L s S
f F
X y
1, f fi
5.1.2 Total Effects
Total Footprint–based MINLP II
d d t
d0 d0=
inFP FP FPTRFP
FP FP
Čuček, Varbanov, Klemeš, Kravanja, Energy, 2012
Total Footprints

SDEWES 2014, Venice - Istanbul, September 20-27, 2014 50
0,00 0,20 0,40 0,60 0,80 1,00
Rela
tive
pro
fit
Total relative footprint
Poor solutions
(+)LCA
0.00
Fig. 27: Profit vs. Total footprint
Total Effects: Total Footprint-based
Pareto Solutions, MINLP II
Good solutions
(-)LCA
Total Footprints

SDEWES 2014, Venice - Istanbul, September 20-27, 2014 51
5.1.3 Case Study: Biomass Supply Chain
and Total Footprints
x x
x x x
x x x
x x
#
# #
# # #
Layer 1: Agricultural supply i = zones
Layer 2: Collection and
pretreatment processes m = intermediate points
Layer 3: Production plants n = plants
Layer 4: Demand/ End users j = demands
FL1L2(i, j, pi)
FL2L3(m ,n, pi)
FL2F4(m ,j, pd)
FL3L4(n ,j, pp)
yL2 (m) = To determine the location of
collection points and also the
pretreatment processes : drying/
compaction/ densification
yL3 (n) = To determine the location of plants
yL3pt (n, pp, t) = for technologies selection
Fig. 28: SDRN superstructure
Čuček, Varbanov, Klemeš, Kravanja, Energy, 2012
Biomass
Green Products
Total Footprints
SDEWES 2014, Venice - Istanbul, September 20-27, 2014 52
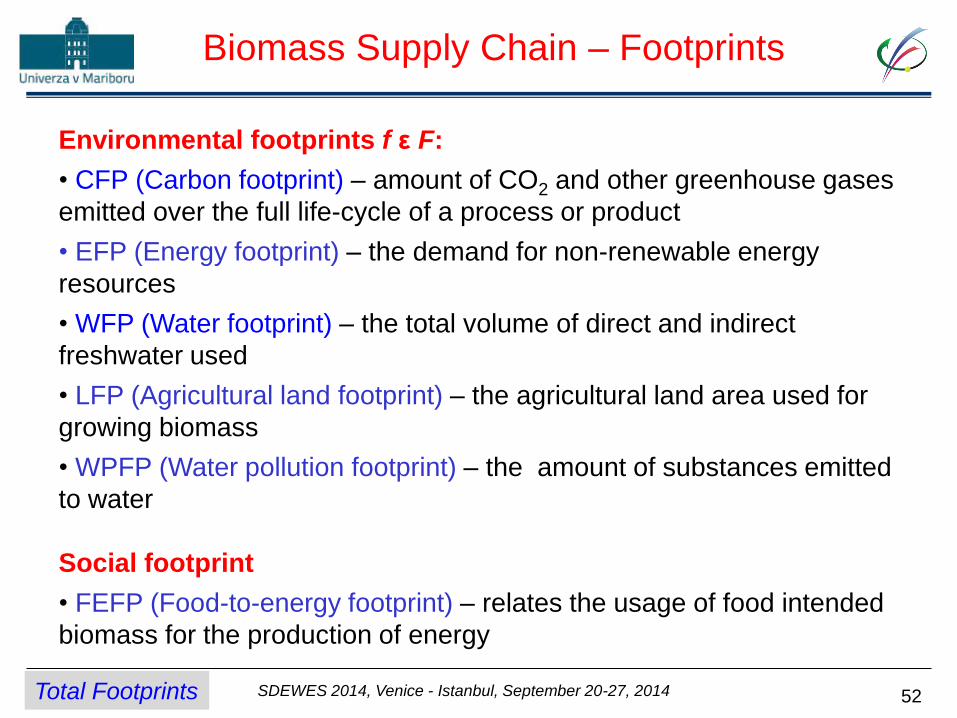
Environmental footprints f ε F:
• CFP (Carbon footprint) – amount of CO2 and other greenhouse gases
emitted over the full life-cycle of a process or product
• EFP (Energy footprint) – the demand for non-renewable energy
resources
• WFP (Water footprint) – the total volume of direct and indirect
freshwater used
• LFP (Agricultural land footprint) – the agricultural land area used for
growing biomass
• WPFP (Water pollution footprint) – the amount of substances emitted
to water
Social footprint
• FEFP (Food-to-energy footprint) – relates the usage of food intended
biomass for the production of energy
Biomass Supply Chain – Footprints
Total Footprints

SDEWES 2014, Venice - Istanbul, September 20-27, 2014 53
Demonstration Case Study
y (km)
x (km)
i1
(xi1, yi1) i2
(xi2, yi2)
i3
(xi3, yi3) i4
(xi4, yi4) i5
(xi5, yi5)
je (xje,yie)
i6
(xi6, yi6)
i7
(xi7, yi7)
i8
(xi8, yi8) i9
(xi9, yi9)
i10
(xi10, yi10)
(xj1, yj1)
▲ j1
(xj2, yj2)
▲j2
Legend: Forestry Area Freshwater lake Highland
n1
(xn1, yn1)
m1 ■
(xm1, ym1)
n2
(xn2, yn2)
n3
(xn3, yn3)
m6 ■
(xm6, ym6)
■m2
(xm2, ym2)
■m3
(xm3, ym3)
■m4
(xm4, ym4)
■m5
(xm5, ym5)
Railway
Fig. 29: The supply-network structure of the demonstrated case study
Total Footprints
Čuček, Lam, Klemeš, Varbanov, Kravanja, CTEP 2010

SDEWES 2014, Venice - Istanbul, September 20-27, 2014 54
Biomass Supply/Demand Renewable
Networks
• Raw materials included on the given area:
corn, corn stover, MSW, wood chips, manure and timber
• Considered technological options:
• The dry-grind process (corn)
• Diluted acid pre-treatment (corn stover)
• Gasification/fermentation (wood chips)
• Anaerobic co-digestion (biomass waste)
• Incineration (MSW and lignocellulosic raw materials)
• Sawing (timber)
• Products:
electricity, heat, bioethanol, boards, digestate, DDGS
Total Footprints

SDEWES 2014, Venice - Istanbul, September 20-27, 2014 55
Footprints Obtained at MINLP-1
Direct footprints Indirect footprints Total footprints
CFP (t/(km2·y)) 117.65 -311.95 -194.3
WFP (t/(km2·y)) 376,500.75 -39,210.75 337,290
EFP (GJ/(km2·y)) 1,440.65 -4,906.72 -3,466.07
WPFP (t/(km2·y)) 12.02 -6.47 5.55
LFP (km2/(km2·y)) 0.32 0 0.32
FEFP (-) 0.38 0 0.38
Table 1: Direct, Indirect and Total footprints for Biomass supply chain
Total Footprints

SDEWES 2014, Venice - Istanbul, September 20-27, 2014 56
MINLP II: 2-D Projections of Direct
Footprints
Fig. 30: Direct footprints for Biomass supply chain
Total Footprints

SDEWES 2014, Venice - Istanbul, September 20-27, 2014 57
2-D Projections of Total/Direct Footprints
Fig. 31: Total/direct footprints for Biomass supply chain
Total Footprints

SDEWES 2014, Venice - Istanbul, September 20-27, 2014 58
Footprint-based Synthesis
PROBLEMS
• Footprints in 2-D projections are underestimated
• Higher-D problems needs large numbers of
iterations, which cannot be applied to large-sized
problems
ADVANTAGES
• For 2-D problems number of iterations increases
linearly with the number of footprints
• 2-D multi-objective optimization for:
• Any number of footprints
• Medium- and larger-sized problems
Total Footprints

SDEWES 2014, Venice - Istanbul, September 20-27, 2014 59
• Incentives for Sustainable Development
• LCA-based Mathematical Programming for Sustainable
System Synthesis
• Expanding Systems Boundaries
• Tools and Concepts Integration
• New Concept Considering Burdening and Unburdening
Effects on Environment in Multiobjective Optimization:
• Total Footprints,
• Total Sustainability Index, and
• Eco-Profit and Total Profit
• Synthesis Applications of Renewables Integration and
Bioenergy Production
• Conclusion

SDEWES 2014, Venice - Istanbul, September 20-27, 2014 60
• Economic, environmental and social indicators
• Yearly profit (P) or the net present worth (NPW)
• Environmental: resource usage and pollution indicators
• Social: assessment is difficult
• Indicators are normalized, e.g. by the values from a given base case and
• Composed into Relative Sustainability Index:
Relative Direct Sustainability Index Relative Total Sustainability Index
RDSI (direct effects) RTSI (direct + indirect effects)
d
d,0
f
f
f F f
IRDSI w
I
d ind t
d,0 d,0
f f f
f f
f F f Ff f
I I IRTSI w w
I I
Since are negative, RTSI < RDSI ind
iI
0
f
f
f F f
IRSI w
I
Conventional New approach
5.2.1 Definition and Normalization of
Sustainability Index
Total SI

SDEWES 2014, Venice - Istanbul, September 20-27, 2014 61
Total SI-based MINLP Synthesis
Two-step multiobjective superstructural MINLP approach:
MINLP Step I: Economic-based synthesis for basic process superstructure that comprises technological end economical alternatives
Base case solution
MINLP step II:
Multiobjective synthesis for superstructure, augmented by sustainable energy, environmental and other alternatives
Sustainable solution
0 0 d,0 ind,0 or , andi iP NPW I I i I
d ind
, , or , and ,k k i k i kP NPW I I i I k K
Reference point
Total SI

SDEWES 2014, Venice - Istanbul, September 20-27, 2014
T 0max ( ( )) /
( , ) 0
s.t. ( , ) 0
( , )
| R ; (RTSI-MINLP)
,
,
l
l
k
n LO
ls
ls
ls
UP
k
l l
l L s S
RT
RP c y f x P
h x y
g x y
x y
x X x x x x x
y l
SI
Y
1 2
1
; ... 0,1
m
L
k k
L Y Y Y Y
62
Total Effects
RTSI in ε-constrained MINLP II
It enables to identify profitable
solutions with the maximal
unburdening of the environment
Kravanja, Čuček, APEN, 2013
Total SI

SDEWES 2014, Venice - Istanbul, September 20-27, 2014 63
Total Effects
RTSI-based Pareto Solutions, MINLP II
R
ela
tive
pro
fit
Base case solution
Fig. 32: RTSI Pareto or even non-trade-off solutions
Relative total sustainability index
Total SI

SDEWES 2014, Venice - Istanbul, September 20-27, 2014 64
5.2.2 Case Study: Bioethanol and RTSI
Main Motivation:
European Union targets are by 2020 to achieve at leastas:
• a 20 % share of energy from renewable sources
• a 20 % improvement in energy efficiency
• reduction in greenhouse gas emissions
• a 10 % share of energy from renewable sources in transport
Main goal to reach or exceed 10 % of the need for
gasoline in one European Country
Simultaneous integration of different technologies for
converting starchy and lignocellulosic raw materials to
bioethanol
Total SI

SDEWES 2014, Venice - Istanbul, September 20-27, 2014 65
Synthesis of Multi-Technologies Process
Variable raw materials input from the area of 50 000 ha and
Variable total production of ethanol
Optimization variables
Footpint-based MINLP synthesis with:
• MINLP-1: Corn based ethanol production 2 kg/s (10 % share
of bioenergy)
• MINLP-2: Energy and different food production
(≤ 50 000 ha )
Total SI

SDEWES 2014, Venice - Istanbul, September 20-27, 2014 66
Bioethanol Process Synthesis
Economic-based MINLP Step I
Fig. 33: Corn-based process superstructure (1st generation)
Solution:
P=22.786 M$/yr
Karrupiah et al., 2008
Kravanja and Čuček, 2010
Total SI

SDEWES 2014, Venice - Istanbul, September 20-27, 2014 67
Fig. 34: Superstructure, enlarged by sustainable alternatives (2nd generation)
Corn
Potato
Sugar beet
Wheat
Corn stover
Wheat straw
Wood chips
Bioethanol Process Network
Multiobjective Sustainable MINLP Step II
Total SI

SDEWES 2014, Venice - Istanbul, September 20-27, 2014 68
Relative direct sustainability index (RDSI):
Economic indicator:
0
0, 22.786 $ /
PRP where P M yr
P
Direct: SI-based Bioethanol Synthesis
Multiobjective Sustainable MINLP Step II
1 1 ,,RDSI
0 03 3, ,
( / )1 1 , , ,, , , , ,( )
0 0 0 0 0 0 0 0 03 9 ( / ), , , , , ,, ,
qq m fem ea
q qm ea m fe
q qA qqq q q q qmm fu m pu m fcm su m wu m eu m es m ewland
q q q q A q q q q qm su m pu m wu m m eu m es m ewm fu land m fc
• ⅓ CO2 emissions to the air
• ⅓ social indicator (food to energy)
• ⅓ all other indicators
Intention is to obtain solutions with smaller CO2 equivalent emissions and to
produce ethanol from raw materials, not part of the food chain. Weights:
Total SI

SDEWES 2014, Venice - Istanbul, September 20-27, 2014 69
Scalar parametric optimization:
Fig. 35: “Pareto curve” for Bioethanol problem obtained by RDSI
Direct: SI-based Solution from
Multiobjective MINLP Step II
Very good solutions !
RDSI
R
ela
tive
pro
fit
1,0
2,0
3,0
4,0
5,0
0,6 0,8 1 1,2 1,4 1,6
Base case
Variable raw materials
input from the area
of 50 000 ha
Variable total production
of ethanol
Total SI

SDEWES 2014, Venice - Istanbul, September 20-27, 2014 70
0
1
2
3
4
5
6
7
8
9
0,65 0,85 1,05 1,25
Inp
ut
/ o
utp
ut
flo
wra
te (
kg
/s)
RSI
Ethanol Corn Wood chips Corn stover Wheat straw
Fig. 36: Raw material and bioethanol production by RSI
2 kg/s
Ethanol production Pro
fit M
$/y
r
100
80
60
120
40
20
0
Direct: SI-based Bioethanol Synthesis
Solution: Energy and Food Production
Total SI

SDEWES 2014, Venice - Istanbul, September 20-27, 2014 71
Relative total sustainability index (RTSI)
Total SI-based Bioethanol Synthesis
Multiobjective Sustainable MINLP Step II
Direct and Indirect CO2 equivalent emissions
Indirect effects due to products‘ substitution (gasoline by bioethanol)
The same weights as before:
• ⅓ CO2 emissions to the air
• ⅓ social indicator (food to energy)
• ⅓ all other indicators
Ethanol
Ethanol,
1 1 ,, , SubRTSI0 0 0Gasoline/Ethanol3 3
, , ,
( / )1 1 , , ,, , , ,(
0 0 0 0 0 0 03 9 ( / ), , , , ,, ,
qq q m fem ea m ea
q q qm ea m ea m fe
q qA qqq q q qmm fu m pu m fcm su m wu m eu m esland
q q q q A q q q qm su m pu m wu m m eu mm fu land m fc
f
,)
0 0,
qm ew
qes m ew
Total SI

SDEWES 2014, Venice - Istanbul, September 20-27, 2014 72
Fig. 37: “Pareto curve” for Bioethanol problem obtained by RTSI
Total SI-based Solution from
Multiobjective MINLP Step II
Very good solutions !
Base case 0
1
2
3
4
5
6
-2,5 -2 -1,5 -1 -0,5 0 0,5 1 1,5
Re
lati
ve
pro
fit
RTSI
Total SI

SDEWES 2014, Venice - Istanbul, September 20-27, 2014 73
Fig 18: Superstructure for selecting the optimal processing system for an industrial case study
5.2.3 Case Study: SI-based MINLP
Synthesis of Biogas Process
73
Fig. 39:
Biogas
from
Organic
and
Animal
Waste
Total SI

SDEWES 2014, Venice - Istanbul, September 20-27, 2014 74
RSI index:
Economic indicator: Annual profit
Case Study: SI-based Synthesis
MINLP Step II
Weights:
• ½ CO2 emissions to the air
• ½ all other indicators
Intention to obtain solutions with smaller CO2 equivalent emissions
rϵR={carbon footprint (CF), agricultural land footprint (ALF),
water consumption (WS), nitrogen footprint (NF)}
CF0, ALF0, WS0, NF0 taken from MINLP-I solution
0 0 0 0
1 CF 1 1 ALF WS NF( + )
2 CF 2 3 ALF WS NFRSI
LCA software package GaBi® (PE, LBP, 2011)
Ecoinvent database (Frischknecht et al., 2007).
Total SI

SDEWES 2014, Venice - Istanbul, September 20-27, 2014 75
Case Study: RSI-based Solution from
Multiobjective MINLP Step II
0
1
2
3
4
-4 -3 -2 -1 0 1
Pro
fit
(P, M
€/y
)
Relative sustainability index (RSI)RDSI RTSI
Fig. 40: A Pareto curve for RDSI and a set of non-trade-off solutions for RTSI
Total SI

SDEWES 2014, Venice - Istanbul, September 20-27, 2014 76
SI-based Synthesis
ADVANTAGES
• SI-based optimization suitable for:
• Any number of footprints
• Medium- and larger-sized problems
Drawbacks of RDSI:
• Wrong solutions - unsustainable
Drawbacks of RTSI:
• Cannot predict true trade-off solutions
• Subjective definition of weights
DRAWBACKS
Total SI

SDEWES 2014, Venice - Istanbul, September 20-27, 2014 77
• Incentives for Sustainable Development
• LCA-based Mathematical Programming for Sustainable
System Synthesis
• Expanding Systems Boundaries
• Tools and Concepts Integration
• New Concept Considering Burdening and Unburdening
Effects on Environment in Multiobjective Optimization:
• Total Footprints,
• Total Sustainability Index, and
• Eco-Profit and Total Profit
• Synthesis Applications of Renewables Integration and
Bioenergy Production
• Conclusion

SDEWES 2014, Venice - Istanbul, September 20-27, 2014 78
5.3.1 Direct Effects in Composite-Criterion:
Net Profit
SYSTEM
R – raw materials, which
directly burden the
environment due to:
• Extraction of resources,
• Recycling and
• Transportation
P – set of products, which
directly burden the
environment due to:
• Processing,
• Transportation,
• Use and
• Disposal
i km i m ki R k P
EC q c q c
R d,R P d,P
Eco-cost (€/yr) :
Net profit (€/yr) = Economic profit - Eco-cost
( )NP R E D EC
Eco-cost coefficients: Delft University of Technology, <www.ecocostsvalue.com>
Total Profit

SDEWES 2014, Venice - Istanbul, September 20-27, 2014 79
5.3.2 Total Effects in Composite-Criterion:
Total Profit
SYSTEM
RB – raw materials, which
only burden the
environment if they are
processed (direct effects)
RUNB – raw materials, which
mainly unburden or
benefit the environment
when they are used , e.g.
utilization of waste
(direct +indirect effects)
PB – set of products, which
only burden the environment
related to processing,
disposal, and transportation
(direct effects)
PUNB – set of products which
alco unburden or benefit the
environment
(direct +indirect effects)
,
i j
UNB UNB
m i m j ji R j P
EB q c q f c
UNB UNB UNB UNBR R ,t P S/P S tEco-benefit (€/yr):
Eco-cost (€/yr) :
Total profit (€/yr) = Economic profit + Eco-profit
( ) ( )TP R E D EB EC Čuček, Drobež, Pahor, Kravanja, 2012
Eco-profit(€/yr) = Eco-benefit - Eco-cost
i j k lm i m j m k m li R j P k R l P
EC q c q c q c q c
UNB UNB UNB UNBB B B B
B B UNB UNB
R d,R P d,PR d,R P d,P
Total Profit

SDEWES 2014, Venice - Istanbul, September 20-27, 2014 80
Total Effects
Total Profit-based Synthesis
1 2
max ( , ) ( , )
( , ) 0 s.t.
( , ) 0
| R ; (TP-MINLP)
, ; ...
,l
l
n LO UP
ls
ls
l l L
TP P y x EcoP y x
h x y
g x y
x X x x x x x
y Y l L Y Y Y
l L s S
0,1m
Y
Multi-objective problem converted into
sinle-objective
Čuček, R. Drobež, B. Pahor, Z. Kravanja, CCE, 2012
Total Profit

SDEWES 2014, Venice - Istanbul, September 20-27, 2014 81
Fig 18: Superstructure for selecting the optimal processing system for an industrial case study
5.3.3 Biogas Process Case Study
Reconsidered: Total Profit-based MINLP
Synthesis
81
Fig. 41:
Biogas
from
Organic
and
Animal
Waste
Total Profit

SDEWES 2014, Venice - Istanbul, September 20-27, 2014 82
Direct Effects: Economical and Net Profit
Optimization
Maximized
Economic profit
(P)
Maximized
Net profit
(NP)
Economic profit (M€/y) 3.308 0
Eco-cost (M€/y) 5.301 0
Net profit (M€/y) -1.992 0
Income (M€/y) 7.546 0
Depreciation (M€/y) 2.943 0
Investment (M€) 20.727 0
Operating costs (M€/y) 4.238 0
Biogas production (m3/d) 43,281 0
The amount of used
wastes (t/y) 122,861 0
Table 2: Different optimization schemes with Eco-cost for Biogas problem
Total Profit

SDEWES 2014, Venice - Istanbul, September 20-27, 2014 83
Kravanja, Čuček, APEN, 2013 Čuček, Drobež, Pahor, Kravanja, CCE, 2012
Maximization of the economic profit
Economic profit:
3.668 M€/y
Eco-cost:
5.306 M€/y
.
Net profit:
-1.638 M€/y
Fig. 42: Optimal Biogas production flowsheet
Total Profit
Direct Effects: Economical and Net Profit
Optimization

SDEWES 2014, Venice - Istanbul, September 20-27, 2014 84
Maximized
Economic
profit (P)
Maximized
Total profit
(TP)
Difference
TP-P
Economic profit (M€/y) 3.668 3.591 -0.077
Eco-profit (M€/y) 2.661 2.917 +0.256
Total profit (M€/y) 6.329 6.508 +0.179
Income (M€/y) 7.354 7.249
Depreciation (M€/y) 2.943 2.925
Investment (M€) 20.727 20.600
Operating costs (M€/y) 3.686 3.658
Biogas production (m3/d) 43,281 42,623
The amount of used
wastes (t/y) 122,861 121,180
Table 3: Different optimization schemes with Economic and Total profit optimization
Total Profit
Total Effects: Total Profit Optimization

SDEWES 2014, Venice - Istanbul, September 20-27, 2014 85
Maximization of the total profit
Economic profit:
3.591 M€/y
Eco-profit:
2.917 M€/y
Total profit:
6.508 M€/y
Fig. 43: Optimal Biogas production flowsheet
Total Profit
Total Effects: Eco-profit and Total Profit
Optimization

SDEWES 2014, Venice - Istanbul, September 20-27, 2014 86
Total Profit-based Synthesis
ADVANTAGES
• Direct solution procedure with composite objective
• Very large-sized problems can be solved
Total Profit

SDEWES 2014, Venice - Istanbul, September 20-27, 2014 87
5.3.4 Continental Example – EU Supply
Network for the Production of Biofuels
Fig. 45: Regional plan with 136 zones
GAMS 23.6, GUROBI 4.0
Server with 244 GB of RAM
Čuček, Martin, Grossmann, Kravanja, ICOSSE 2013,
ESCAPE 24, 2014
Area for food and biofuels: ≤10 % area,
Demand: ≥ 100 % food, ≥ 10 % biofuels
Raw materials: 1st, 2nd, and 3rd generation
Technologies:
Biochemical conversion
Gasification and syngas fermentation
and catalytic synthesis
FT diesel and green gasoline
Biodiesel from oils with methanol...
Products: Ethanol, Biodiesel, Hydrogen,
Green gasoline, FT-diesel...
1,150,000 single equations
24,220,000 single variables
27,900 discrete variables
Total Profit

SDEWES 2014, Venice - Istanbul, September 20-27, 2014 88
Redistribution of Gasoline production:
Profit vs. CO2-based Total Profit
Fig. 46: Profit 134,457 M$/y,
67.8 % substitution
Fig. 47: Total Profit 155,655 M$/y,
63.9 % substitution
0.135 EUR/kg CO2 eq, www.ecocostvalue.com
Total Profit

SDEWES 2014, Venice - Istanbul, September 20-27, 2014 89
Conclusion
• The role of holistic approach was highlighted for sustainable
systems synthesis.
• When considering only direct (burdening) effects on environment,
incomplete and even wrong solutions can be obtained.
• Indirect (unburdening) effects caused by products‘ substitution
should also be considered in MOO.
• New perception:
• Better searching solutions by maximizing the difference
between unburdening and burdening effects than just
minimizing burdening effects.
• Unburdening alternatives will thus have higher priority than
those having just smaller burdening effects.

SDEWES 2014, Venice - Istanbul, September 20-27, 2014 90
Acknowledgements
Dr. Lidija Čuček
Prof. Jiří Klemeš, Prof. Petar Varbanov
Prof. Lam Hon Loong
Prof. Ignacio E. Grossmann, Dr. Mariano Martin
Prof. Zorka Novak Pintarič, Dr. Bojan Pahor
Dr. Rozi Drobež
Andreja Nemet

SDEWES 2014, Venice - Istanbul, September 20-27, 2014
INTERNATIONAL SCIENTIFIC COMMITTEE Presidents
J.J. Klemeš, University of Pannonia, HU
H.L. Lam, The Uni. Nottingham Malaysia Campus, MY S.R. Wan Alwi, Universiti Technologi Malaysia, MY Vice-Presidents J. Drahoš, Czech Academy of Sciences, CZ F. Friedler, University of Pannonia, HU S. Pierucci, Politecnico di Milano, IT
P. Stehlík, Brno Univ. of Technology VUT Brno, CZ
P. Seferlis, Aristotle Univ./CPERI, Thessaloniki, GR Members M. Atkins, The Univ. of Waikato, NZ S. Bandyopadhyay, Indian Institute of Technology, N
M. Bakošová, Slovak Technical University, SK T. Bertsson, Chalmers Univ of Technology, SE J. Bonet Ruiz, Univ of Barcelona, ES
C. Bouallou, MINES Paris Tech, Paris, FR I. Bulatov, The University of Manchester, UK C-L. Chen, National Taiwan University, TW
N. Duić, University of Zagreb, HR M. Emtir, Academy of Graduate Studies, LY D.C.Y. Foo, The University of Nottingham, MY A. Friedl, Vienna Univ. Technology, Wien, AT
T. Gundersen, Norwegian Univ. Sci. Technol. NO M. Gough, Cal Gavin Ltd, Alcester, UK
S. Harvey, Chalmers Univ of Technology, SK K. Hirata, Process Integration Ltd, JP D. Huisingh, Editor in Chief, Journal of Cleaner
Production, Univ. of Tennessee, Knoxville, US A.-M. Josceanu, Univ. POLITEHNICA, Bucharest, RO
V. Kafarov, University of Santander, CO M. Kamal, Univ. Teknologi Malaysia, MY
P. Kapustenko, Kharkov Nat. Politech. Univ., UA E. Kenig, University of Paderborn DE J-K.. Kim, Hanyang University, KR Z. Kravanja, University of Maribor, SI D. Kukulka, Buffalo State University, US J. Labidi, University of the Basque, ES
V. Lavric, Univ. POLITEHNICA, Bucharest, RO C. T. Lee, Universiti Technologi Malaysia, MY S-Y. Li, Tianjin University, CN Z-Y. Liu, Hebei Uni. Of Tech., CN H. Lund, Editor in Chief, Energy, Aalborg Univ., DK Z. Manan, Universiti Technologi Malaysia, MY F. Maneneti, Politecnico di Milano, IT
F. Marechal, Ecole Polytechnique Féd de Lausanne, CH K. Matsuda, Chiyoda Corporation, JP
A. Mészáros, Slovak Technical University, SK M. Narodoslawsky, University of Graz, AT
E. Nagy, University of Pannonia, HU
Z. Novak Pintarič, University of Maribor, SI P. Oosthuizen, Queen's Uni., Kingston, On., CA N. Ozalp, Katholieke Universiteit, BE S. Perry, The University of Manchester, UK M. Picón-Núñez., Univ. Guanajuato, MX S. Pistikopoulos, Imperial College, London, UK
A. Pleşu Bonet-Ruiz, Univ. POLITEHNICA, RO
L. Puigjaner, UPC, Barcelona, ES D. Reay, Editor in Chief, Applied Thermal Eng, UK L. Savulescu, Natural Resources Canada, CA P. Stuart, Polytechnique Montréal, CA S. K. Sikdar, Editor in Chief, Clean Technologies &
Environ Policy, US-EPA, US R. Smith, The University of Manchester, UK R.G.R. Tan, De La Salle University PH
C. Theodoropoulos, The Univ. of Manchester, UK K. Urbaniec, WUT Warsaw, Plock Campus, PL P. Varbanov, University of Pannonia, HU
S. Voutetakis, CPERI.CERTH, GR M. Walmsley, The University of Waikato, NZ Q. Wang, Xi'an Jiaotong University, CN S.Yan, Editor in Chief, Applied Energy, KTH Royal
Inst. Tech and Mälardalen Uni, SE
Supported by:
www.PRESconference.com
23- 27 August 2015 Kuching, Sarawak,
MALAYSIA
绿色亚洲,牵动世界
Sarawak, Malaysia
23- 27 August, 2015
18th Conference Process Integration, Modelling and
Optimisation for Energy Saving and Pollution
Reduction
PRES 2015, Borneo, Malaysia

SDEWES 2014, Venice - Istanbul, September 20-27, 2014
12th PSE and 25th
ESCAPE
Joint Event
Copenhagen, Denmark, 31 May - 4 June 2015
PSE/ESCAPE 2015, Copenhagen,
Denmark

SDEWES 2014, Venice - Istanbul, September 20-27, 2014
ESCAPE, PRES
ESCAPE 2016, Portorož, Slovenia

SDEWES 2014, Venice - Istanbul, September 20-27, 2014
Thank you