Embed Size (px)
Citation preview

“Layered Materials as High Temperature Membranes in Hydrogen Production”
FINAL TECHNICAL REPORT
Project Start Date: August 17, 2005 Project End Date: August 16, 2006
Principal Authors: Muhammad Sahimi and Theodore T. Tsotsis
Date of Report: November 26, 2006
DOE Award No. DE-FG26-05NT42541
University of Southern California
Mork Family Department of Chemical Engineering and Materials Science
925 Bloom Walk, HED-216
Los Angeles, CA 90089-1211
1
brought to you by COREView metadata, citation and similar papers at core.ac.uk
provided by UNT Digital Library

DISCLAIMER
This report was prepared as an account of work sponsored by an agency of the United States Government. Neither the United States Government nor any agency thereof , nor any of their employees, makes any warranty, express or implied, or assumes any legal liability or responsibility for the accuracy, completeness, or usefulness of any information, apparatus, product, or process disclosed, or represents that its use would not infringe privately owned rights. Reference herein to any specific commercial product, process, or service by trade name, trademark, manufacturer, or otherwise does not necessarily constitute or imply its endorsement, recommendation, or favoring by the United States Government or any agency thereof. The views and opinions of authors expressed herein do not necessarily state or reflect those of the United States Government or any agency thereof.
2

ABSTRACT
The objective of this project is the development of a new high temperature, affinity-type CO2-selective membrane. This membrane has the potential to find use in novel reactive applications of relevance to IGCC plants. In this project we have utilized a variety of methods to prepare affinity-type CO2-selective membranes. We have used a number of hydrotalcite (HT) sources and supports. We have also prepared two types of membranes, large area membrane disks and tubes, and micromembranes prepared on stainless steel foils and silicon wafers. Quality nanoporous membranes have been prepared, which show significantly higher permeation rates for gases with smaller kinetic diameters like He (used here as a safe surrogate gas for hydrogen) as compared to gases with larger kinetic diameters like Ar. Some of these membranes are selective towards CO2. The effect of preparation conditions on the membrane transport characteristics have also been studied and are reported here.
3

TABLE OF CONTENTS
Abstract 3
Executive Summary 5
Results of Work 6
Conclusions 34
Milestones 35
Cost and Schedule Status 35
Summary of Significant Accomplishments 36
Actual or Anticipated Problems or Delays 36
Technology Transfer Activities Accomplished 36
References 37
4
1. Executive Summary
1.1 Objectives IGCC plants show promise for environmentally-benign power generation. In these
plants coal is gasified to synthesis gas, which is then processed in a water gas-shift reactor (WGSR) to produce H2 for clean-power generation. WGSR is a dual-reactor system, the first reactor (HTS) operating at high temperatures, to attain high reaction rates, followed by a second lower-temperature reactor (LTS), which benefits from increased equilibrium conversions at low temperatures. The WGSR exit stream contains H2, CO2, H2O and other minor species (e.g., CO). For use in fuel cells (and potentially for CO2 capture/sequestration), CO2 is separated using amine absorption or PSA. Both processes are, however, energy- and capital-intensive, and so is the WGSR. In their place our team proposes, instead, a novel membrane reactor (WGSMR), which integrates the WGS and CO2 separation steps in a single unit through the use of high temperature, CO2-selective membranes. The WGSMR has many advantages over the conventional technology. Key to the success of the WGSMR is developing CO2-selective membranes, capable of operating in the WGS environment, since commercial membranes are not functional in this environment. The objective of this project is, therefore, the development of a new high temperature, affinity-type CO2-selective membrane.
1.2 Accomplishments to Date
We have utilized a variety of methods to prepare affinity-type CO2-selective membranes. We have used a number of hydrotalcite (HT) sources and supports. We have also prepared two types of membranes, large area membrane disks and tubes, and micromembranes prepared on stainless steel foils and silicon wafers. The micromembranes show good potential for application in micro-fuel cells. The membranes have been tested for their transport characteristics using both single gases and mixtures of gases, as well as by a variety of other characterization techniques including SEM and TEM, DRIFTS, EDX, and DTA/TGA. Quality nanoporous membranes have been prepared, which show significantly higher permeation rates for gases with smaller kinetic diameters like He (used here as a safe surrogate gas for hydrogen) as compared to gases with larger kinetic diameters like Ar. Some of these membranes are selective towards CO2. The effect of preparation conditions on the membrane transport characteristics have also been studied and are reported here. Coating the membranes with a silicone layer, which helps to plug the pore space within the HT structure, creates a membrane which is highly selective towards CO2.
5
2. Results of Work
2.1.Project Approach
The objective of the project was to utilize variety of methods to prepare affinity-type
CO2-selective membranes. The plan was to utilize a number of hydrotalcite (HT) sources
and membrane supports, and to test the membranes for their transport characteristics using
both single gases and mixtures of gases, as well as by a variety of other characterization
techniques, including SEM and TEM, DRIFTS, EDX, and DTA/TGA. The plan was also to
prepare two different types of membranes, namely large-area membrane disks and tubes,
and micromembranes prepared on stainless steel foils and silicon wafers. The
micromembranes show good potential for application in micro-fuel cells.
2.1.1 Large Area Membrane Preparation
To prepare the HT membranes, we have utilized a variety of HT sources including
commercial hydrotalcite powders from Sasol and Aldrich; we have also synthesized a
number of such materials ourselves by the co-precipitation method[1], as follows: An
aqueous solution (45 ml) containing 0.058 mol of Mg(NO3)2·6H2O and 0.02 mol of
Al(NO3)3·9H2O (ACS reagent grade, purchased from Aldrich) is prepared (Mg/Al molar
ratio of 2.9:1).. This solution is added all at once to a second solution (70 ml) containing
NaOH (0.35 mol) and Na2CO3 (0.09 mol) at 333K. The resulting mixture is kept at this
temperature for 24 h under vigorous stirring, after which the white precipitate that was
formed was filtered off and washed with distilled water several times. The hydrotalcite was
dried for 24 h at 393 K. Using ICP-MS analysis, the synthetic hydrotalcite was shown to
have a Mg/Al ratio of 2.89:1 (this HT is labeled as HT1; another HT with a different Mg/Al
ratio was also prepared, labeled as HT2). The commercial hydrotalcites were also analyzed
by ICP-MS. Table 1 shows the various HT we utilized with their corresponding Mg/Al
molar ratios.
The powders, thus prepared, were also used to prepare macroporous HT disks as
supports in membrane preparation. These membrane supports were prepared by pressing 3
g of HT with 1000 kgf/cm2 of pressure for 10 min. We have also utilized α- alumina tubes
6

(I.D 7 mm, O.D. 11mm, 0.5~1.0 µm pore radius, ~40% porosity) from the Dalian Institute
in China, α-alumina discs prepared in our laboratories (using alumina powders from the
Coors-Tek company), as well as γ-alumina tubes prepared by us by sol-gel techniques. In
order to prepare microporous HT membranes, various methods were utilized including
dip-coating, and electrophoretic deposition, as described below:
Dip-coating. For dip-coating, HT slurries were prepared by two different methods. The
first method involved the HT2 solution (Table 1). After 2 h of reaction under vigorous
stirring at a temperature of 60 oC, distilled water was added to the reaction mixture, which
was then centrifuged for 10 min at 2500 rpm in a sealed container. At the end of
centrifugation, the supernatant solution was removed (this is defined as the mother
solution); distilled water was again added to the thick slurry at the bottom of the container,
which was then centrifuged again, the supernatant solution removed, etc. The procedure is
repeated until the pH of the slurry becomes ~ 8.[2] The supernatant solution was then again
removed, distilled water was added to the remaining residue and shaken vigorously. The
resulting suspension was then allowed to stand for one day. The resulting mixture was
separated in three layers, i.e. a dark bottom layer, a translucent middle layer, and a
transparent top layer. The translucent layer was then recovered and utilized to prepare the
HT membrane on α-alumina and γ-alumina supports. The mother solution was also used in
the hydrothermal treatment at 80 oC, 100 oC, and 120 oC. Another method involved
dispersing the Sasol Mg70D powder in distilled water (this material is easily dispersible
because it contains lactate acid, which acts as a dispersion agent). After the suspension was
prepared, membrane support tubes were dipped in the suspension for 10 s at a time for each
coating. The membranes were then dried overnight in air, and then at 150 oC for 12 h.
Using Sulfate as a Binder. Some of the HT membranes were prepared using sulfate as a
binder. 99% sulfuric acid (ACS reagent grade from VWR) was used as the sulfate source. [3]
The Sasol Mg70D and Mg50 powders were utilized for the preparation. A 2 M H2SO4
solution was added drop-wise to the HT suspension (prepared by ultrasonic treatment for
15 min to assure that the HT disperses well). 1 g of Mg70D or 1 g of Mg50 were dispersed
7
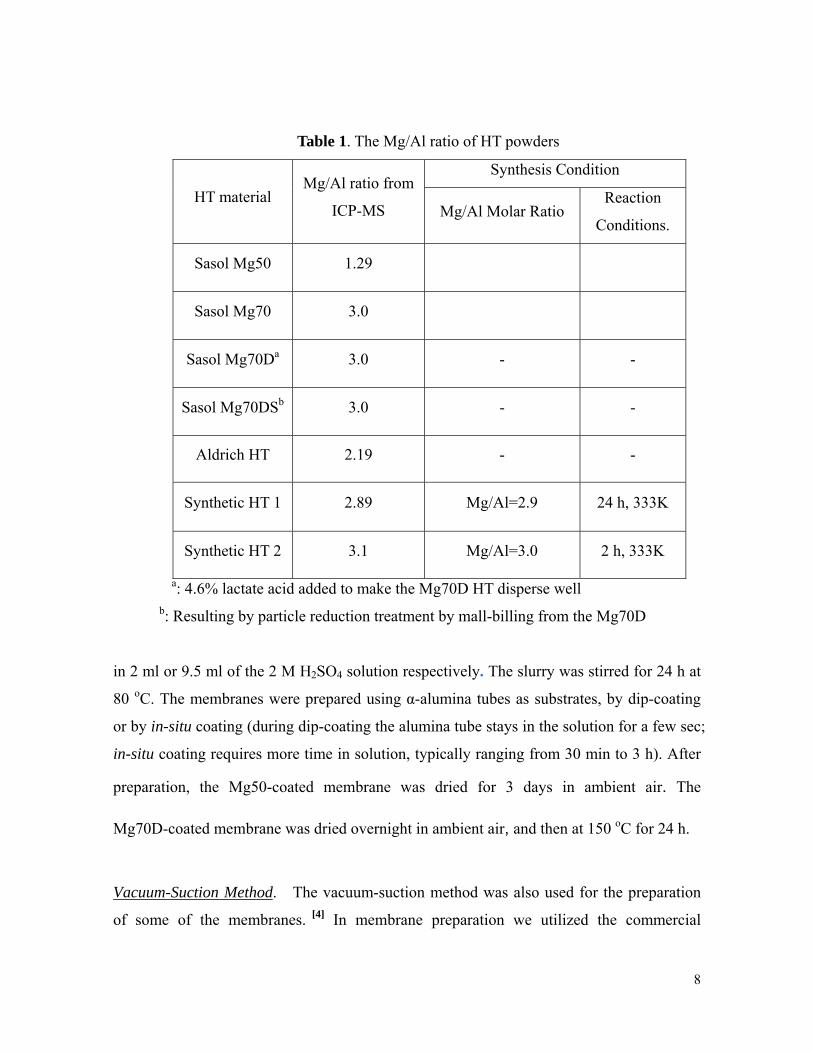
Table 1. The Mg/Al ratio of HT powders
Synthesis Condition
HT material Mg/Al ratio from
ICP-MS Mg/Al Molar Ratio Reaction
Conditions.
Sasol Mg50 1.29
Sasol Mg70 3.0
Sasol Mg70Da 3.0 - -
Sasol Mg70DSb 3.0 - -
Aldrich HT 2.19 - -
Synthetic HT 1 2.89 Mg/Al=2.9 24 h, 333K
Synthetic HT 2 3.1 Mg/Al=3.0 2 h, 333K
a: 4.6% lactate acid added to make the Mg70D HT disperse well b: Resulting by particle reduction treatment by mall-billing from the Mg70D
in 2 ml or 9.5 ml of the 2 M H2SO4 solution respectively. The slurry was stirred for 24 h at
80 oC. The membranes were prepared using α-alumina tubes as substrates, by dip-coating
or by in-situ coating (during dip-coating the alumina tube stays in the solution for a few sec;
in-situ coating requires more time in solution, typically ranging from 30 min to 3 h). After
preparation, the Mg50-coated membrane was dried for 3 days in ambient air. The
Mg70D-coated membrane was dried overnight in ambient air, and then at 150 oC for 24 h.
Vacuum-Suction Method. The vacuum-suction method was also used for the preparation
of some of the membranes. [4] In membrane preparation we utilized the commercial
8
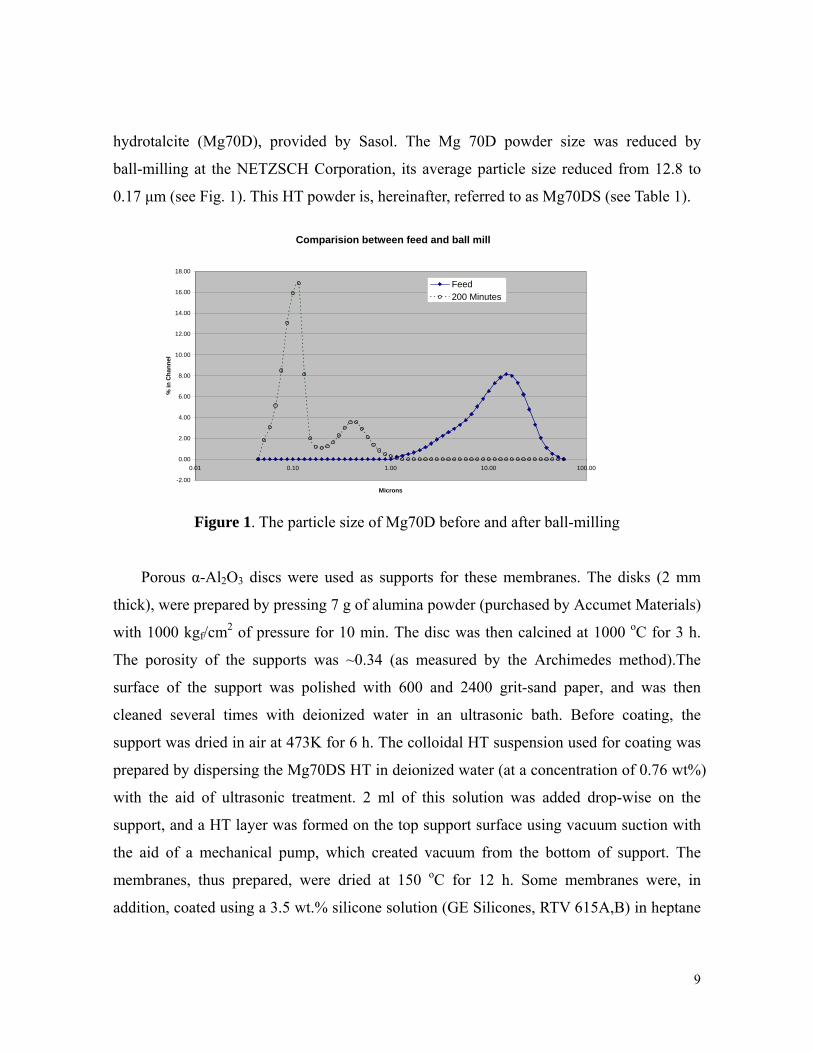
hydrotalcite (Mg70D), provided by Sasol. The Mg 70D powder size was reduced by
ball-milling at the NETZSCH Corporation, its average particle size reduced from 12.8 to
0.17 μm (see Fig. 1). This HT powder is, hereinafter, referred to as Mg70DS (see Table 1).
Comparision between feed and ball mill
-2.00
0.00
2.00
4.00
6.00
8.00
10.00
12.00
14.00
16.00
18.00
0.01 0.10 1.00 10.00 100.00
Microns
% in
Cha
nnel
Feed200 Minutes
Figure 1. The particle size of Mg70D before and after ball-milling
Porous α-Al2O3 discs were used as supports for these membranes. The disks (2 mm
thick), were prepared by pressing 7 g of alumina powder (purchased by Accumet Materials)
with 1000 kgf/cm2 of pressure for 10 min. The disc was then calcined at 1000 oC for 3 h.
The porosity of the supports was ~0.34 (as measured by the Archimedes method).The
surface of the support was polished with 600 and 2400 grit-sand paper, and was then
cleaned several times with deionized water in an ultrasonic bath. Before coating, the
support was dried in air at 473K for 6 h. The colloidal HT suspension used for coating was
prepared by dispersing the Mg70DS HT in deionized water (at a concentration of 0.76 wt%)
with the aid of ultrasonic treatment. 2 ml of this solution was added drop-wise on the
support, and a HT layer was formed on the top support surface using vacuum suction with
the aid of a mechanical pump, which created vacuum from the bottom of support. The
membranes, thus prepared, were dried at 150 oC for 12 h. Some membranes were, in
addition, coated using a 3.5 wt.% silicone solution (GE Silicones, RTV 615A,B) in heptane
9

(from Aldrich), in order to improve their performance, also by using the vacuum-suction
method. This treatment plugs the inter-crystallite space, and potentially the pinholes and
cracks.
Electrophoretic Deposition. A number of membranes were also prepared by electrophoretic
deposition (EPD), which involves the migration and coagulation of ceramic particles on an
electrode surface aided by an electric field. [5,6] The advantages of EPD are the uniformity
of the deposition process, even for complex and large forms, and good control of the
thickness of the deposit. [7]During EPD, the mass of deposit is described by the following
equation:
∫=t
o
EdtaAcM μ (1)
where M is the of the mass of the deposit (kg), t the deposition time (s), α a coefficient
related to the friction characteristics of the particles near the electrode that are being
deposited, A the electrode surface area (m2), C the particle concentration in the suspension
(kg/m3), µ the electrophoretic mobility (m2/Vs), and E the electric field (V/m). The
electrophoretic mobility (m2/Vs) is given by the following equation
ηπμ
LZEV4
= (2)
where Z is the zeta potential, V the applied voltage, E the dielectric constant of the medium
in which the particles are suspended, η the viscosity of the suspension, and L the electrode
separation distance. As Equation (2) indicates, electromobility depends on the zeta
potential.[8,9,10] The zeta potential, is an intrinsic property of each slurry system, and is the
potential between the Stern layer and the Diffuse layer (as defined in the double-layer
colloidal model); its value determines which electrode is the target for deposition during
EPD. In our study, the zeta potential was measured by a Zeta Meter 3.0 (Zeta-Meter Inc.).
10

Figure 2. EPD membrane preparation apparatus.
For EPD, the Sasol Mg70DS powder was used to prepare a suspension in distilled water.
Porous α- alumina tubes or discs were used as the supports. The EPD unit is illustrated
Power supply
(-) Cathode
α-alumina tube
(+) anode
Stainless steel vessel
Stainless steel rod
11

schematically in Fig. 2.[7,11] For deposition on the tubular membranes, a stainless steel rod
was inserted inside the support tube to be used as the cathode. The stainless steel vessel
itself was used as the anode (the choice in electrodes varies, depending on the zeta
potential). A DC power supply was used to generate the potential difference between the
two electrodes. The electrical potential varied from 1 to 20 V, while the HT weight fraction
in the colloidal suspension varied between 0.38 ~ 1.25 wt %. The solution’s pH was
adjusted by using 0.9 M H2SO4 and 0.9 M NaOH solutions. The membranes, after coating,
were dried overnight in ambient air, and at 150 oC for 12 h.
2.1.2 Micro-Membrane Preparation
In this study, we have also investigated the fabrication of HT micromembranes using
silicon wafers and stainless steel foils as templates. Using (100) p-type silicon wafers we
have created a microchannel pattern as shown in Fig. 3. It consists of two different channel
types, with a width of 500 and 1000 µm correspondingly, which were fabricated using a
standard photolithographic technique[12,13]
Figure 3. The silicon microchannels
12

The channels were etched using a 44 wt% KOH solution at 359 K. The anisotropic
wet-etching rates along the silicon <111> and <100> directions result in a trapezoidal
channel cross-section with an angle of 54.7°, as shown in Fig. 3. After the microchannel
was prepared, it was coated with HT using various coating methods, with or without an
intermediate support layer. (see Table 2). After the HT coating process finishes,
self-standing HT micromembranes are prepared by wet-etching of the silicon layer at the
bottom of the HT layer using a 44 wt% KOH solution at 359 K.
We have also prepared micromembranes on stainless steel supports. These membranes
are, potentially, more useful than the Si-wafer-based membranes, due to their better
mechanical properties. A simple design (see Fig. 4), consisting of a square pattern of small
circular holes (microholes), each with a diameter of 800 µm, is typically fabricated by
conventional drilling. The micromembrane is prepared by coating these microholes with a
solution containing 20 wt% Mg70DS, and drying at 150 oC for 24 h.
Table 2. Various coating methods used for the preparation of Si-based HT
micromembranes
No Intermediate
layer Coating method Conditions
1 Colloidal HT coating
drop-wise by a micropipette Dry at 110℃ for 12 h
2
None Seed deposition followed by
hydrothermal aging
Dry at 110℃ for 12 h (after seed
deposition)
160 oC for 24 h (hydrothermal
aging)
3 γ-alumina Colloidal HT coating
drop-wise by a micropipette Dry at 110℃ for 12 h
13

Figure 4. The microhole pattern on stainless steel disks
2.1.3 Membrane Characterization
FT-IR was used to characterize the various HT materials generated. The FT-IR spectra
were recorded using a Genesis II (Mattson, FT-IR) instrument; the instrument operating
conditions were a scan-range from 4000 cm-1 to 500 cm-1, scan numbers 16, and a scan
resolution of 2 cm-1. We also utilized XRD to characterize the HT materials, using a Rigaku
X-ray diffractometer, with the CuKα line for the X-ray source with a monochromator
positioned in front of the detector. Scans were performed over a 2θ range from 5o to 75o.
Thermogravimetric (TG) curves were generated using a Cahn TGA 121 instrument. The
sample (~100 mg) was heated in UHP dry argon (at a flow rate of 30 ml/min) with a
heating rate of 5 oC/min, till 700 oC. A Micrometrics ASAP 2010 BET instrument was used
for measuring the surface area by the BET method at liquid nitrogen temperature (77 K);
the micropore size and pore size distribution (PSD) of HT samples was also determined by
the same instrument using the Horvath-Kawazoe (H-K) equation. The isotherms were
measured using samples that had been preheated in vacuum at various temperatures
overnight. The morphology and thickness of the synthesized membrane were investigated
by scanning electron microscopy (SEM). The SEM photographs and the EDX (Energy
Dispersive X-ray spectrometer) analysis were obtained using a Cambridge 360 scanning
electron microscope, and a Philips/FEI XL-30 Field Emission Scanning Electron
Microscope.
The HT membranes were also characterized by permeation measurements. The
permeation apparatus used in this study consists of a permeation cell, He, Ar, N2, H2, CO,
14

and CO2 gas cylinders, pressure gauges, a gas chromatograph, a mass-spectrometer, a
syringe-pump (for delivering water to create synthetic WGS feeds), and a
temperature–controlled oven. The membrane areas were 6.51 and 0.865 cm2 for the tubular
and disc membranes correspondingly. Water vapor in the permeation and feed-side exit
streams was collected with moisture traps. The membrane permeances were measured
using a bubble-flow meter for single gases, and a gas chromatograph or mass spectrometer
for mixtures of gases. For the silicone-coated HT membranes, the constant volume,
diffusion time-lag method was used. To measure the gas permeance, the permeate side
pressure was kept around 1×10⁻² Torr, while the feed-side was maintained at a
predetermined fixed pressure. Gas permeance is calculated from the change in pressure on
the permeate side.
15

2.2 Results and Discussion
2.2.1 Characterization Results
2.2.1.1 HT Powders
The FTIR spectra of one of the HT synthesized in our labs (HT1) and of the Sasol
Mg70D HT are shown in Fig. 5.
(a) (b)
C3 bonding
CO32-
H2O Bending CO3-H2O
Mg-O
Transmittance
OH-
Figure 5. FT-IR spectra (a) of synthetic HT (b) Sasol Mg70D.
The spectra appear to be similar, with the exception of a band at 1593.2 cm-1 in the
Mg70D spectrum, which results from the lactate acid (CH3-HCOH-COOH), which is
added to the Sasol Mg70D powder to improve its dispersion characteristics. Typical XRD
patterns for the synthetic and commercial HT are shown in Fig. 6.
(a) (b)
0 10 20 30 40 50 60 70 80
0
200
400
600
800
1000
1200
1400
1600
Inte
nsity
2θ
10 20 30 40 50 60 70
-500
0
500
1000
1500
2000
2500
3000
3500
4000 7.8 Å
(003) 7.7 Å
MG70Dcoat Mg70Dparticle
α−alumina
HT peak
2θ
Figure 6. HT XRD patterns (a) own HT powder (b) Mg70D powder and membrane.

The basal spacing for the synthetic HT (calculated according to Bragg’s equation) is 7.7
Å. The XRD patterns for the Sasol Mg70D HT indicate that the basal spacing is 7.8 Å.
These results are similar to those reported in the literature, indicating a typical basal
spacing of ~ 7.8 Å (for HT with a Mg/Al=3). [14] The XRD spectrum of the surface of one
of the HT membranes prepared by the vacuum-suction method is shown in Fig. 6b, and
combines the spectral peaks for both alumina and the overlaying HT film.
Synthesis HT
50
60
70
80
90
100
110
0 100 200 300 400 500 600 700Temperature
Wei
ght l
oss
(%)
Figure 7. TGA thermograms of the synthetic HT (top) and the Sasol Mg70D (bottom)
Figure 7 shows the thermograms for both the synthetic (HT1) and the Sasol Mg70D
HT. They appear to be typical HT thermograms. There are some differences between the
two samples, however, which may be due to the different heat treatment conditions, and
17

the presence of the dispersion agent in the Sasol Mg 70D. Figure 7 (bottom) also shows
the DSC spectrum of the Mg70D HT. Endothermic peaks are observed due to desorption
of water, and lactate acid, and to the loss of OH- groups present in the interlayer region.
CO32- anion elimination is an exothermic reaction manifested by an intense exothermic
peak at 452.6 oC.
The pore structure was evaluated by analysis of BET data. The microporosity was
evaluated using the H-K equation with a slit-type pore model, while mesoporosity was
evaluated using the BJH model. Analysis results are shown in Table 3.
Table 3. Surface area and pore size of HT powder
Pretreatment
temp. (oC)
Surface area
(m2/g)
BJH adsorption,
average pore size
H-K median
pore size
150 1.5 18.0 nm 10.7 Å Sasol Mg70D
(uncalcined) 300 23.8 12.3 nm 8 Å
Sasol Mg70D
(calcined@550 oC) 150 219.9 3.1 nm 8.4 Å
Synthetic HT
(uncalcined) 120 26.1 33.9 nm 9.2 Å
The surface area of the samples is low, and increases with increasing calcination
temperature. High temperature treatment decreases the pore size. The observed isotherms
are of Type II
Figure 8 shows the top surface of a membrane (at two different magnifications)
prepared by the vacuum-suction method. The membrane has a smooth top surface,
probably due to the very small size of the Mg70DS powder used to prepare the
membrane. Figure 9a shows the cross-section of one of these membranes. The film
18
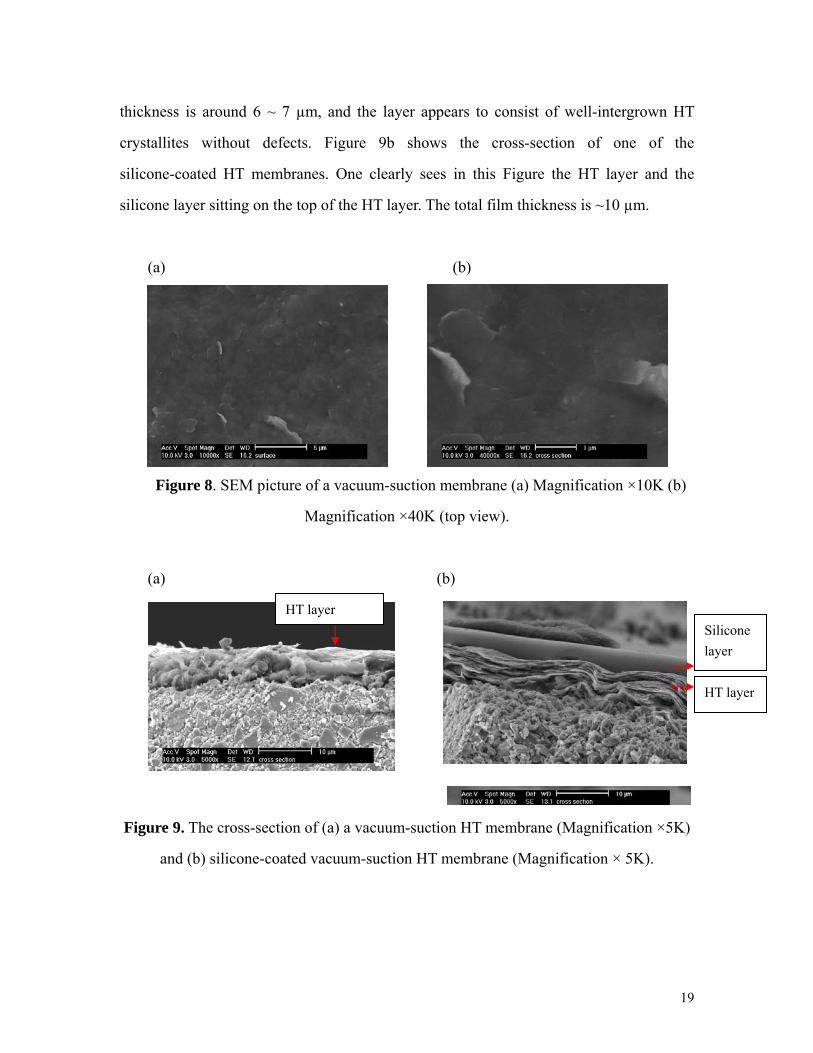
thickness is around 6 ~ 7 µm, and the layer appears to consist of well-intergrown HT
crystallites without defects. Figure 9b shows the cross-section of one of the
silicone-coated HT membranes. One clearly sees in this Figure the HT layer and the
silicone layer sitting on the top of the HT layer. The total film thickness is ~10 µm.
(a) (b)
Figure 8. SEM picture of a vacuum-suction membrane (a) Magnification ×10K (b)
Magnification ×40K (top view).
(a) (b)
HT layer
HT layer
Silicone layer
Figure 9. The cross-section of (a) a vacuum-suction HT membrane (Magnification ×5K)
and (b) silicone-coated vacuum-suction HT membrane (Magnification × 5K).
19

2.2.1.2 Micromembranes
SEM pictures of the microchannel etched on silicon wafers and used for the
preparation of micromembranes are presented in Fig. 10.
Figure 10. SEM picture of Si microchannel (left) top view (right) cross-sectional view
As noted in Table 2, two preparation methods were chosen. SEM observations of the
films prepared by seed deposition and hydrothermal aging indicate that they are partially
detached layers.
Figure 11. SEM pictures of a membrane deposited on a silicon microchannel by coating
with a HT colloidal solution. (left) top surface, (right) cross-sectional view
On the other hand, films prepared by direct coating of colloidal HT solutions appear
to be well-adhering with a crystallite size in the submicron range. No major defects or
20

cracks were observed in these films, though some intercrystalline voids exist, as can be
seen in the top view and cross-sections of the membrane shown in Fig. 11. To avoid the
formation of these voids, a γ-alumina layer was deposited as an intermediate layer on the
microchannel prior to HT deposition using a Boehmite sol, and drying the film at 600 oC
for 2 h.
HT + γ-Alumina Coating
Figure 12. HT and alumina layers on the left, and the top HT layer on the right.
Figure 13. SEM picture (top view).of the stainless steel membrane (left) Magnification
×100; (right) Magnification ×20K
Figure 12 shows a cross-sectional view of the γ-alumina intermediate layer and the HT
layer deposited on it. The films appear to be well-adhering, the total thickness being ~5
µm, with the thickness of the alumina layer ~1.5 µm. The hydrotalcite crystals in Fig. 12
are similar in appearance to those in Fig. 11, uniform and with dimensions in the
21

submicron range, albeit much smaller than those in Fig. 11. After the HT coating is
prepared on the alumina layer in the microchannel, KOH is used to etch the silicon layer,
while leaving the alumina and HT films intact, since alumina has good resistance to the
strong base. The resulting HT membranes are then used for permeation tests. These
membranes are not very strong mechanically, however, rupturing at pressure gradients
larger than 10 psi.
Figure 13 shows the morphology of a membrane prepared on the stainless steel
supports (the microhole size in the Figure is ~800 µm). In Fig. 13, the HT membrane
surface appears to be smoother than the surface of the membranes on the Si wafers. This
is probably because in the preparation of these membranes we have used a different
precursor, namely Mg70DS, which has much better dispersion characteristics.
2.2.2 Transport Studies
2.2.2.1 Large Area Membranes
Dip-coating. The permeation characteristics of membranes (in terms of the ideal
separation factor, defined as the ratio of permeances of single gases) prepared using the
HT2 hydrotalcite and the procedure described in 2.1.1 are shown in Fig. 14. These
membranes were prepared using α-, or γ-alumina tubes. Hydrothermal aging was carried
out in an autoclave at various temperatures and times. The permeances measured were
typically of the order of 10 -6 [mol/m2 s Pa]. Figure 14 shows the effect of the time of
hydrothermal aging (at 80 oC) for two different pressure drops. These membranes are
slightly permselective towards CO2 (based on Knudsen transport alone, the membrane
should favor the permeation of N2, with the N2/CO2 separation ratio being ~ 1.25).
Increasing the temperature of hydrothermal aging slightly improves the permselectivity
towards CO2. SEM observation of the top surface of these membranes indicate the
presence of visible cracks and defects, however.
22

-2 0 2 4 6 8 1 0 1 2 1 4 1 6 1 8 2 00 .8 8
0 .9 0
0 .9 2
0 .9 4
0 .9 6
0 .9 8
1 .0 0
1 .0 2
1 .0 4
1 .0 6
1 .0 8
1 .1 0 α -a lu m in a 4 0 p s i α -a lu m in a 3 0 p s i γ- a lu m in a 4 0 p s i γ- a lu m in a 3 0 p s i
N2/C
O2
A g in g tim e, h r
Figure 14. The effect of aging time at 80 oC on the N2/CO2 separation factor
(Permeation Temp. 25 oC).
The permeation characteristics of membranes using the Sasol Mg70D HT according to
the procedure described in 5.1.1 are shown in Fig. 15. Two different colloidal dispersions
were utilized for dip-coating on α-alumina tubes, one containing 5 wt% of HT (S-5), and
the other 1.25 wt% of HT in solution (S-1.25). The effect of the number of coatings
utilized to prepare the films is also shown in Fig. 15. Increasing the number of coatings
increases the N2/CO2 separation factor, which levels-off at 1.3 ~ 1.4 (slightly above the
Knudsen value ~1.25), which is expected on the basis that increasing the number of
coatings, decreases the number of pinholes and cracks, and improves the quality of the
resulting membranes. XRD analysis of the membrane surface indicates that is pure
hydrotalcite, while SEM indicates a smooth surface with no visible defects and the
thickness of the films to be ~5 µm.
Using Sulfate as a Binder. As discussed in 2.1.1, a number of membranes were prepared
using sulfuric acid as a binder. Table 4 shows the N2 and CO2 permeances and the
corresponding N2/CO2 separation factors (at two different pressure drops of 30 and 40 psi,
23

and at room temperature) for a number of membranes prepared by this technique.
Dip-coating and in-situ coating were utilized for membrane preparation from Mg50 and
Mg70D HT. The in-situ coating method used Mg50 as the HT source, and yielded
membranes which were more permselective towards CO2 than the membranes prepared
by the dip-coating technique. Membranes prepared by dip-coating were not permselective
towards CO2, showing instead a N2/CO2 separation factor in the range 1.1 - 1.27. The
membranes prepared with Mg50 using the sulfate binder were not stable, however, when
the temperature was raised above 80 oC.
1st 2nd 3rd 4th
0.0
2.0x10⁻⁷
4.0x10⁻⁷
6.0x10⁻⁷
8.0x10⁻⁷
1.0x10⁻⁶
1.2x10⁻⁶
7.5 E-8
30 psi N2
40 psi N2
Coating times
N 2
Perm
eanc
e(m
ol/m
2 s P
a)
30 psi
40psi
S-1.25
9.6 E-8
0.0
0.5
1.0
1.5
2.0
2.5
N2 /C
O2
1st 2nd 3rd
2.0x10⁻⁸
4.0x10⁻⁸
6.0x10⁻⁸
8.0x10⁻⁸
1.0x10⁻⁷
30 psi
30 psi N2
40 psi N2
Coating times
N2 P
erm
eanc
e (m
ol/m
2 s P
a)
40 psi
S-5
0.0
0.5
1.0
1.5
2.0
2.5
N2 /C
O2
Figure 15. The effect of the number of coatings (Permeation Temp. 25 oC).
Vacuum-Suction Method. Preparing membranes using vacuum suction may potentially
enhance the adhesion of the deposited HT films on the underlying support. A number of
membranes using the vacuum-suction method have been prepared, as described in 2.1.1,
using the Mg70DS HT, which is prepared by the Mg70D HT powder, by ball-milling at
the NETZSCH Corporation.
Table 5 shows the permeance and ideal permselectivity for single gases such as He (a
safe surrogate gas for H2), N2 (a safe surrogate gas for CO), Ar and CO2 measured at two
different transmembrane pressure drops of 30 or 40 psi and at room temperature, for two
24

different HT membranes prepared by the vacuum-suction technique. By comparison, the
permeance of the underlying alumina support is 2 orders of magnitude higher than that
measured with the HT membrane and the separation factors are lower than the Knudsen
values, and do not improve significantly as the temperature is raised (from 298 to 503 K),
signifying a mostly macroporous structure. The HT membranes are microporous with the
most permeable gas being He, followed by N2, Ar, and CO2, with permeances for He in
the 10-8 ~ 10-9 mol/m2 s Pa range. Table 6 shows the permeabilities for the HT layer,
calculated after one accounts for the permeability of the support layer and the thickness
of the HT layer.
Table 4. The permeance and the N2/CO2 separation factor of HT membranes
prepared using a sulfate binder (25oC)
HT
source
Coating
conditions
Pressure
drop (psi) CO2 N2 N2/CO2
30 2.65E-08 3.37E-08 1.27 Dip-coating,
3 layers 40 3.11E-08 3.38E-08 1.09
30 1.60E-07 1.46E-07 0.91 In-situ
30min 40 1.82E-07 1.65E-07 0.90
30 3.43E-07 3.07E-07 0.90
Mg50
In-situ
3 h 40 3.96E-07 3.56E-07 0.90
Dip-coating,
1 layer 30 1.54E-06 1.72E-06 1.12
Mg70D Dip-coating,
3 layers 30 5.63E-07 6.93E-07 1.23
25

Table 5. The permeation characteristics of two HT membranes prepared by the vacuum-
suction method (Temp. 25 oC)
Permselectivity Permeance ×
10-8 (mol/m2 s Pa) He/gas N2/gas
PΔ Experimental
Result
Experimental
Result
Memb Gas
(MW))
30 psi 40 psi
Ideal
Knudsen
value 30 psi 40 psi
Ideal
Knudsen
value 30 psi 40 psi
He (4) 5.292 4.93 1.0 1.0 1.0 0.38 0.22 0.25
N2 (28) 1.18 1.24 2.65 4.52 3.96 1.0 1.0 1.0
Ar (40) 0.873 0.883 3.16 6.08 5.60 1.20 1.35 1.42 su#1
CO2 (44) 0.611 0.604 3.32 8.72 8.15 1.25 1.93 2.06
He (4) 2.02 1.90 1.0 1.0 1.0 0.38 0.43 0.46
N2 (28) 0.869 0.881 2.65 2.32 2.16 1.0 1.0 1.0 su#23
CO2 (44) 0.261 0.278 3.32 7.76 6.84 1.25 3.34 3.17
Table 6.The permeability and ideal selectivity ratio for the HT membrane layers.
Permeability (Barrer) Permselectivity
Memb.
PΔ
(psi) He N2 Ar CO2 N2/CO2 He/CO2 He/N2 He/Ar
su#1 30 1115.9 247.7 183.2 128.0 1.9 8.7 4.5 6.1
Su#23 30 423.8 182.2 - 54.6 3.3 7.8 2.3 - b Barrer : 10 -10 cm3(STP) ·cm/cm2·s·cmHg =3.35 × 10⁻¹⁶ mol·m /m2 ·s· Pa
The effect of temperature on permeation for the HT membranes is shown in Table 7.
The permeance for all gases decreases as the temperature increases (from 298 to 503 K),
with the exception of CO2, which first increases as the temperature increases from 298 to
373, and then subsequently decreases. Table 8 shows the effect of temperature on the HT
26

layer permeance, showing similar trends.
Notice that the ideal separation factors first decrease with temperature and then
increases again. These results can be explained by the surface area and average pore size
measurements made with HT powders, shown in Table 3.
Table 7. The temperature effect of the HT Su#11 membrane ( PΔ : 20 psi)
Permeance × 10-8 (mol/m2 s Pa) Permselectivity Temp.
(K) He N2 Ar CO2 N2/CO2 He/CO2 He/N2 He/Ar
298 2.04 0.543 0.420 0.336 1.62 6.06 3.75 4.85
373 1.51 0.455 0.315 0.341 1.33 4.42 3.32 4.79
423 1.10 0.319 0.241 0.232 1.37 4.73 3.44 4.55
473 0.745 0.204 0.130 0.138 1.47 5.38 3.66 5.72
503 0.701 0.192 0.134 0.111 1.72 6.31 3.66 5.23
Table 8. The permeance of the HT layer for the Su#11 membrane. ( : 20 psi) PΔ
Permeance × 10-8 (mol/m2 s Pa) Permselectivity Temp
(K) He N2 Ar CO2 N2/CO2 He/CO2 He/N2 He/Ar
298 2.047 0.544 0.421 0.336 1.62 6.08 3.76 4.86
373 1.515 0.456 0.316 0.342 1.33 4.44 3.32 4.80
423 1.103 0.320 0.241 0.232 1.38 4.75 3.45 4.57
473 0.747 0.204 0.130 0.138 1.48 5.41 3.66 5.74
503 0.703 0.192 0.134 0.111 1.73 6.32 3.65 5.24
Note that as the temperature, in which the HT is heat-treated, increases both the mesopore
and micropore average pore sizes decrease, consistent with the decrease in the permeance
of the various gases.
Table 9 shows the effect of pressure drop on the single gas permeance and the ideal
separation factor for three different membrane samples. For He and N2, as the pressure
27
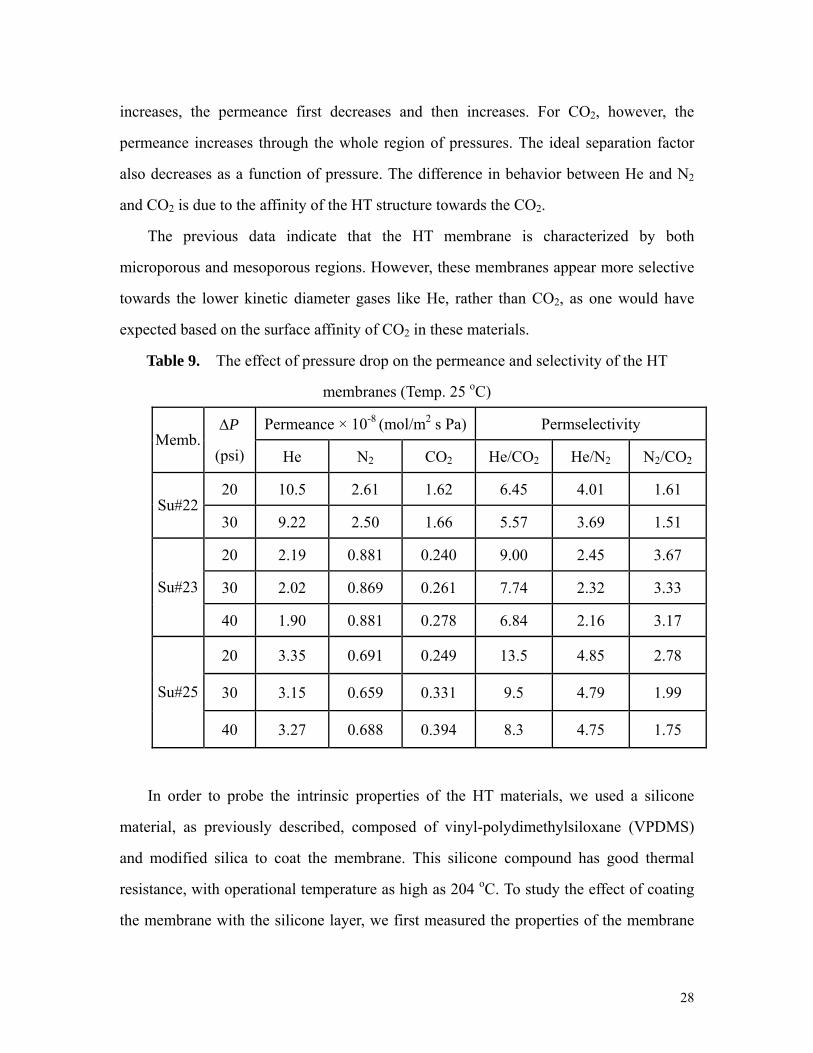
increases, the permeance first decreases and then increases. For CO2, however, the
permeance increases through the whole region of pressures. The ideal separation factor
also decreases as a function of pressure. The difference in behavior between He and N2
and CO2 is due to the affinity of the HT structure towards the CO2.
The previous data indicate that the HT membrane is characterized by both
microporous and mesoporous regions. However, these membranes appear more selective
towards the lower kinetic diameter gases like He, rather than CO2, as one would have
expected based on the surface affinity of CO2 in these materials.
Table 9. The effect of pressure drop on the permeance and selectivity of the HT
membranes (Temp. 25 oC)
Permeance × 10-8 (mol/m2 s Pa) Permselectivity Memb.
PΔ
(psi) He N2 CO2 He/CO2 He/N2 N2/CO2
20 10.5 2.61 1.62 6.45 4.01 1.61 Su#22
30 9.22 2.50 1.66 5.57 3.69 1.51
20 2.19 0.881 0.240 9.00 2.45 3.67
30 2.02 0.869 0.261 7.74 2.32 3.33 Su#23
40 1.90 0.881 0.278 6.84 2.16 3.17
20 3.35 0.691 0.249 13.5 4.85 2.78
30 3.15 0.659 0.331 9.5 4.79 1.99 Su#25
40 3.27 0.688 0.394 8.3 4.75 1.75
In order to probe the intrinsic properties of the HT materials, we used a silicone
material, as previously described, composed of vinyl-polydimethylsiloxane (VPDMS)
and modified silica to coat the membrane. This silicone compound has good thermal
resistance, with operational temperature as high as 204 oC. To study the effect of coating
the membrane with the silicone layer, we first measured the properties of the membrane
28

without the coating, and then after the membrane was coated we measured its transport
properties again. After silicone coating, the HT membrane permeance significantly
decreases, as shown in Table 10. The same Table shows the permeances and separation
factors of silicone membrane coated on an alumina disk. Assuming a resistance in series
model for the silicone on alumina membrane itself, we have calculated the permeability
and ideal separation factors for the silicone layer (based on its thickness measured from
the SEM pictures). The values are shown in Table 11, where they are compared with
corresponding values of PDMS from the literature. Using this permeability value and the
measured thickness of the silicone layer on the HT membrane, we calculate the
permeances and ideal selectivities of the HT membrane itself (HT layer + alumina
support). The calculated and experimental values are compared in Table 12.
Table 10. Permeation properties before and after silicone-coating. Permeance units: ×10-9
(mol/m2 s Pa), 25 oC
Before coating After coating Silicone-coated
alumina membrane PΔ
(psi) Gas
Permeance CO2/
N2
Permeance CO2/
N2
Permeance CO2/
N2
N2 26.5 0.0159±0.0014 0.204 30
CO2 18.1 0.68
0.494±0.002
31.1±
2.5 1.97 9.6
N2 24.9 0.0165±0.0013 0.204 40
CO2 17.5 0.70
0.450±0.008
27.3±
1.8 2.04 10.0
The experimental values are significantly higher than the calculated ones, which
signifies that the silicone layer penetrates into the underlying support structure. It is likely
that the calculated ideal separation factors reflect the affinity of the CO2 molecules for the
intercrystalline space of the hydrotalcite material itself. Table 13 shows the permeation
characteristics of a different membrane, including the permeances of smaller molecules
29

like He and H2. Again the silicone-coated membranes show enhanced CO2 permeation.
The reported ideal separation factors of the silicone-coated membrane significantly
exceed those of the silicone membrane itself, pointing out that the separation
characteristics of the silicone-coated HT membrane reflect the intrinsic properties of the
HT material.
Table 11. The permeabilities and ideal selectivities of the silicone coating
(Temp. 25 oC)
Permeability (Barrer) Ideal S.F. for CO2/N2
Experiment Reference (PDMS) PΔ
(psi) CO2 N2 CO2 N2
Experiment Reference Refs.
15 2645 251.9 10.5 15
30 19.44 2.01 1300 299 9.61 4.35 16
40 20.13 2.01 - - 9.95 -
Table 12. The comparison between calculated and experimental values for the HT
membrane (Temp. 25 oC)
Permeance ×10-9 (mol/m2 s Pa) Permselectivity CO2/N2
Calculated Experimental PΔ
(psi) CO2 N2 CO2 N2
Calc. Exp.
30 0.659 0.0172 18.1 26.5 38.23 0.68
40 0.577 0.0180 17.5 24.9 32.15 0.70
Electrophoretic Deposition. Table 14 shows the permeance and permselectivity of a
number of EPD membranes prepared under various preparation conditions. Most
HT-EPD membranes exhibit Knudsen flow, with the exception of membranes E6, E7, and
E8. E6 was also used for mixed gas mixture permeation tests (see discussion below). The
morphology of these membranes has been studied by SEM. Using Mg70DS results is
30

smooth HT layers, while, on the other hand, the surface of the membranes prepared by
the synthetic HT appears rougher. For most of the membranes in Table 14 the thickness
was ~ 15 µm.
Table 13. The permeation characteristics of a silicone-HT membrane and silicone
membrane
Permeance × 10-9 (mol/m2·sec·Pa]) Permselectivity Memb.
PΔ
(psi) CO2 N2 He H2 CO2/N2 CO2/H2 CO2/He
30 0.546±
0.003
0.0159±
0.0014
0.0440±
0.0005
0.108±
0.001 34.4±3.1 5.0±0.1 12.4±0.1
Silicone
HT 40
0.489±
0.009
0.0165±
0.0013
0.0504±
0.0016
0.102±
0.001 29.7±1.8 4.8±0.1 9.70±0.2
30 1.97 0.204 0.291 0.504 9.6 3.9 6.8 Silicone
40 2.04 0.204 0.296 0.516 10.0 3.9 6.9
2.2.2.2 Micromembranes
Single gas permeation tests (for He, Ar, CO2, N2, at ΔP=30 psi, and at room
temperature) were also conducted with the micromembranes prepared on the stainless
steel supports. Figure 16 shows the measured permeances and the ideal permselectivities
for various gas pairs. The order of permeance was He>CO2>Ar, according to their kinetic
diameters. For N2, however, the permeance is smaller than that of CO2 but larger than that
of Ar. Based on the measured He/Ar permselectivity, the membrane is microporous. The
measured permeances for the micromembranes are smaller than those of the other
31

Table 14. The permeance and permselectivity of EPD membranes
EPD conditions N2 Permeance
(mol/m2sPa) N2/CO2
ΔP ΔP Na
me Support voltage
/coating
times
Time pH Solution 30 psi 40 psi 30 psi 40 psi
E1 α-Al2O3
Tube 1V/1 24 h 12 Synth. HT 1.5×10⁻⁷ 1.6×10⁻⁷ 1.16 1.05
E2 γ-Al2O3
Tube 2V/4 24h 12 Synth. HT 2.7×10⁻⁷ 2.9×10⁻⁷ 1.13 1.17
E3 α-Al2O3
disc 2V/3 24h 12 Synth. HT 2.6×10⁻⁷ 3.0×10⁻⁷ 1.13 1.03
E4 S-5a 1V/1 1 h 7 Mg70DSb 2.1×10⁻⁷ - 1.28 -
E5 HT disc 1V/1 3h 7 Mg70DS 6.6×10⁻⁷ 7.0×10⁻⁷ 1.33 1.29
E6 α-Al2O3
Tube 1V/1 1.5h 7 Mg70DS 5.4×10⁻⁷ - 0.83 -
E7 S-5c 20V/3 1h 7 Mg70DS 2.7×10⁻⁷ 3.8×10⁻⁷ 0.75 0.88
E8 S-5c 20V/2 1h 7 Mg70DS 2.0×10⁻⁷ - 0.86 -
Temperature of Permeation: 25 oC: a HT dip coating on the inside by S-5(5wt%
Mg70D); b: 0.76wt% Mg70DS;c: HT dip coating on outside by S-5(5wt% Mg70D)
membrane discussed, so far, potentially due to the larger thickness of these membranes
(the permeance for CO2 was 2×10⁻⁹ [mol/m2 s Pa], as an example, which is 4 times
smaller than that of the vacuum suction HT membranes, for which the average permeance
32

was 8.8×10⁻⁹ [mol/m2 s Pa]).
Permenace
1.0E-11
2.0E-09
4.0E-09
6.0E-09
8.0E-09
2 2.5 3 3.5 4d k(kinetic diameter, Ǻ)
Perm
eanc
e(m
ol/m
2 se
c Pa
)
He
Ar CO2 N2
Separation Factor
18.6
3.76.5
1.70.0
5.0
10.0
15.0
20.0
He/Ar He/CO2 He/N2 CO2/N2
S.F.
Figure 16. The permeance (a) and permselectivity (b) of micromembrane prepared
on stainless steel supports.
2.2.2.3. Transport Studies with Gas Mixtures
Several membranes were also tested for the permeation of gas mixtures. Table 15
shows the results for the N2/CO2 gas pair (N2 is used here as a safe surrogate gas for CO).
The mixed gas separation factor for the various membranes were generally very similar
to the separation factor based on single gas permeances. Table 16 shows effect of
temperature on the permeance and separation factor of the CO2/N2 gas mixture using the
E6 membrane. The CO2 permeance and the separation factor for membrane E6 increase
as temperature increases. On the other hand, the N2 permeance decreases as temperature
33
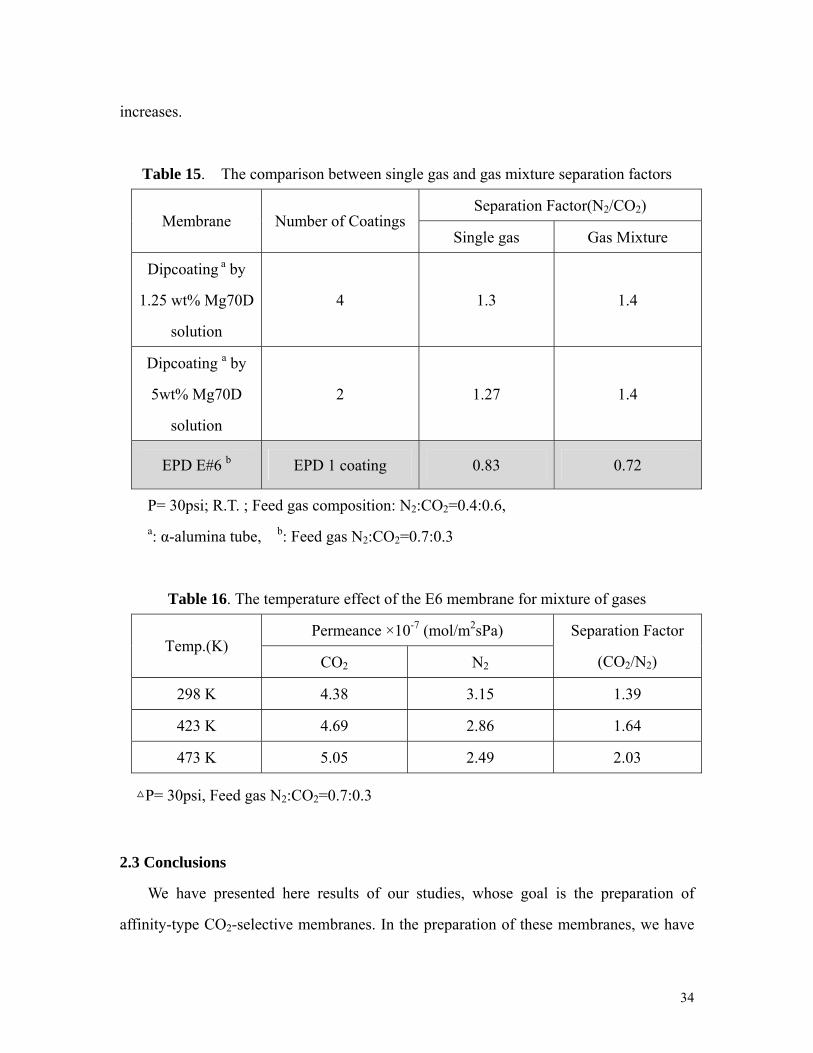
increases.
Table 15. The comparison between single gas and gas mixture separation factors
Separation Factor(N2/CO2) Membrane Number of Coatings
Single gas Gas Mixture
Dipcoating a by
1.25 wt% Mg70D
solution
4 1.3 1.4
Dipcoating a by
5wt% Mg70D
solution
2 1.27 1.4
EPD E#6 b EPD 1 coating 0.83 0.72
P= 30psi; R.T. ; Feed gas composition: N2:CO2=0.4:0.6, a: α-alumina tube, b: Feed gas N2:CO2=0.7:0.3
Table 16. The temperature effect of the E6 membrane for mixture of gases
Permeance ×10-7 (mol/m2sPa) Temp.(K)
CO2 N2
Separation Factor
(CO2/N2)
298 K 4.38 3.15 1.39
423 K 4.69 2.86 1.64
473 K 5.05 2.49 2.03
△P= 30psi, Feed gas N2:CO2=0.7:0.3
2.3 Conclusions
We have presented here results of our studies, whose goal is the preparation of
affinity-type CO2-selective membranes. In the preparation of these membranes, we have
34

used a number of hydrotalcite (HT) sources, prepared in our laboratories and also
available commercially; we have also used a variety of mesoporous and macroporous
supports, including HT porous disks prepared in our laboratories, and alumina tubes and
disks. We have also prepared two types of membranes, large area membrane disks and
tubes, and micromembranes prepared on stainless steel foils and silicon wafers. The
micromembranes show good potential for application in micro-fuel cells. The membranes
have been tested for their transport characteristics using both single gases and mixtures of
gases, as well as by a variety of other characterization techniques including SEM and
TEM, DRIFTS, EDX, and DTA/TGA. Quality nanoporous membranes have been
prepared which show significantly higher permeation rates for gases with smaller kinetic
diameters like He (used here as a safe surrogate gas for hydrogen) as compared to gases
with larger kinetic diameters like Ar. Some of these membranes are selective towards
CO2. The effect of preparation conditions on the membrane transport characteristics have
also been studied and are reported here. Coating these membranes with a silicone layer
improves their separation characteristics making them significantly more permeable
towards CO2, as one would have expected based on the strong affinity of these materials
towards CO2.
3. Milestones
All important milestones set for this project have been accomplished.
4. Cost and Schedule Status
Initial Project Budget: $ 50,000
Costs Incurred During the Project: $ 50,000.00
Funds Remaining: $ 0.
35

5. Summary of Significant Accomplishments
The following are some of the key accomplishments:
• We have developed and studied a number of techniques for the preparation of HT
membranes.
• Different membranes have been developed, characterized and tested for their
permeation characteristics towards single gases and mixtures of gases.
• A number of these membranes were shown to be nanoporous, and some of them
show good permselectivity towards CO2.
6. Actual or Anticipated Problems or Delays
The project was on schedule and no delays occurred.
7. Technology Transfer Activities Accomplished
A paper is in preparation, and will be submitted to Industrial Engineering Chemistry
Research. Results of this research were presented at the 2006 AIChE Annual Meeting in
San Francisco.
36

8. References
1. Roelofs, C. A. A.; Bokhoven, J. A.; Dillen, A. J.; Geus, J. W.; Jong, K. P., “The
thermal decomposition of Mg-Al hydrotalcites: Effects of interlayer anions and
characteristics of the final structure”, Chem. Eur. J., 2002, 8, N0.24.
2. Gardner, E.; Huntoon, K. M.; Pinnavaia, T. J., “Direct synthesis of alkoxide intercalate
derivatives of hydrotalcite-like layered double hydroxides: Precursors for the
formation of colloidal layered double hydroxide suspensions and transparent thin
films”, Adv. Mater., 2001, 13, 1263.
3. Arai, T., “Proton conductive membrane and production method thereof”, U. S. Patent
Application Publication, 2004, US20040081823A1.
4. Huang, A.; Lin, Y. S.; Yang, W., “Synthesis and properties of A-type zeolite
membranes by secondary growth method with vacuum seeding”, Journal of
Membrane Science, 245, 2004, 41-51.
5. Cortez, G.., “Separation, real-time migration monitoring and selective zone retrieval
using a computer controlled system for automated analysis”, Appl. Theor.
Electrophoresis, 1995, 4, 197-209.
6. Delgado, A. V., “Interfacial electrokinetics and electrophoresis”, Marcel Deker, Inc.,
2002.
7. Seike, T.; Matsuda M.; Miyake, M., “Fabrication of Y-type zeolite films by
electrophoretic deposition” Solid State Ionics, 151, 2002, 123– 127.
8. Datta, S., “Application of design of experiment on electrophoretic deposition of
glass-ceramic coating materials from an aqueous bath”, Bull. Mater. Sci., Vol. 23, No.
2, April 2000, 125–129.
9. “Electrophoresis – Electrophoretic Deposition as Coating Technique”, www.
AZoM.com
10. Chen, C. Y.; Chen, S. Y.; Liu, D. M., “Electrophoretic deposition forming of porous
alumina membranes”, Acta Mater., Vol. 47, No. 9, 1999, 2717-2726.
37

11. Oonkhanond, B.; Mullins, M. E., “The preparation and analysis of zeolite ZSM-5
membrane on porous alumina supports”, Journal of Membrane Science, 194, 2001,
3-13.
12. Madou, M. J., “Fundamentals of microfabrication” 2nd, CRC Press, 2002.
13. Wan, Y. S. S.; Chau, J. L. H,; Gavriilidis, A.; Yeung, K. L., “Design and fabrication
of zeolite-based microreactors and membrane microseparators”, Microporous and
Mesoporous Materials, 32, 2001, 157-175
14. Reichle, W.T., “Synthesis of anionic clay minerals (mixed metal hydroxides,
Hydrotalcite)”, Solid State Ionics, 22, 1986, 135.
15. Pravven Jha, Larry W. Mason, J. Douglas Way, Journal of Membrane Science 272,
125-136, 2006.
16. Christopher J. Orme, Mark L. Stone, Michael T. Benson, and Eric S. Peterson
Separation Science and Technology 38 (12, 13), 3225–3238, 2003.
38