Embed Size (px)
Citation preview

Met Office College – Course Notes
Crown Copyright. Permission to quote from this document must be obtained from The Principal, Met
Office College.
Page 1 of 25
Last saved date: 21 October 2012
File: MS-TRAIN-COLLEGE-WORK-c:\documents and settings\eric.zappe\desktop\layer_cloud_forecasting.doc
Layer Cloud Forecasting Contents
1 Introduction
2 Mass Ascent
2.1 Frontal Cloud
2.2 Cloud Formed in Precipitation
2.3 Non-frontal Medium and High Cloud
3 Orographic Uplift
3.1 Upslope Stratus
3.2 Orographic Cloud
4 Turbulent Mixing
4.1 General Principles
4.2 Air Mass Stratus
4.3 Forecasting Techniques
4.4 Non-frontal Stratocumulus
5 Suggestions for Further Reading

Met Office College
Page 2 of 25
Last Saved Date : 21 October 2012
File: MS-TRAIN-COLLEGE-WORK-c:\documents and settings\eric.zappe\desktop\layer_cloud_forecasting.doc
1 Introduction Cloud is formed when air is cooled below its dew point, and if the
air is stable the cloud will be stratiform (i.e. layered). The
cooling is usually brought about by uplift – rising air expands as
the pressure decreases, and adiabatic expansion lowers the
temperature. In the case of layer cloud, there are three main ways
in which air may be lifted to form cloud:
Mass ascent
Orographic uplift
Turbulent mixing
The most significant layer clouds are those which form in the
boundary layer – stratus and stratocumulus. These often form
quickly with full coverage of the sky and a very low cloud base, and
thus their accurate forecasting is of great importance, especially
to aviation.
Also to be considered are the medium and high layer clouds –
altocumulus, altostratus, nimbostratus, cirrus, cirrocumulus and
cirrostratus.
Reference is made in these notes to two condensation levels;
1. The lifting condensation level
2. The mixing condensation level
It is important to understand the definition of these two features
and the constructions on the tephigram required to determine them.
Lifting condensation level
The lifting condensation level for a
sample of air at any height is the
level at which it reaches saturation
when lifted adiabatically
On a tephigram it is the level at which
the dry adiabat through the temperature
of the sample intersects the constant
HMR line through the dew point of the
sample.
Mixing condensation level
The mixing condensation level is the
lowest level at which condensation occurs
(if at all) as a result of vertical mixing
through a given layer. Such mixing
produces a constant potential temperature
and a constant HMR throughout the layer.
The MCL is then the level at which the dry
adiabat and the constant HMR line
appropriate to the layer meet. This is
found using an equal area construction on
the dry bulb and dew point curves as shown
below.
10o
p3
p2
p1
Td
LCL atp
3
LCL atp
2
LCL atp
1
T

Layer Cloud Forecasting
Page 3 of 25
Last Saved Date : 21 October 2012
File: MS-TRAIN-COLLEGE-WORK-c:\documents and settings\eric.zappe\desktop\layer_cloud_forecasting.doc
See the box below.
2 Mass Ascent
2.1 Frontal Cloud
Fronts and depressions give rise to gentle ascent over
large areas, often producing layer clods throughout an
extensive depth of the troposphere. The cloud system may
not be continuous in the vertical, buy may consist of
layers separated by one or more layers of clear air. The
main features of such ascent are its prolonged nature and
small vertical velocities – of the order of a few
centimetres per second.
2.1.1 Forecasting Technique The forecasting of frontal layer cloud involves the
following three principal considerations:-
ANALYSIS
ADVECTION
Frontal cloud structure from a
tephigram
The following guidelines should give a reasonable
assessment of the likely frontal cloud structure from
dew point depressions on a representative tephigram:-
Dry bulb 0o C
(T-Td) 1o C 8/8 layer OVC
(T-Td) 1 to 5o C Thin layers SCT-BKN
(T-Td ) 5o C No cloud NIL or FEW
Dry bulb < 0o C
(T-Td) 3o C 8/8 layer OVC
(T-Td) 3 to 5o C Thick layers BKN
(T-Td) 6 to 10o C Thin layers FEW-SCT
(T-Td) 10o C No cloud
If the cloud layer is:-
0 - 1500 ft probably stratus
1500 - 8000 ft probably stratocumulus
8000 - 20 000 ft probably altostratus
2000 - 30000 ft thick layers nimbostratus
20 000 ft probably cirrus or
cirrostratus

Met Office College
Page 4 of 25
Last Saved Date : 21 October 2012
File: MS-TRAIN-COLLEGE-WORK-c:\documents and settings\eric.zappe\desktop\layer_cloud_forecasting.doc
DEVELOPMENT
Looking at the forecasting task in more detail, both in the
short term and the longer term, these three considerations
may be applied as follows:-
Short-term forecasting (up to about 12 hours)
ANALYSIS of the current situation in detail:
Surface observations (upper cloud may be obscured)
Upper air observations and ascents (see box)
Satellite imagery (high cloud may obscure low)
ADVECTION of the current state with wind field:
Component of gradient wind normal to front
Actual or forecast winds at cloud level
DEVELOPMENT of the current state with time:
Pressure tendencies
Wave development on front?
Development areas on upper air charts?
Model output verify early frames against observations
Local effects coastal, orgoraphic etc.
Longer term forecasting (beyond 12 hours)
The above guidelines continue to apply, but become less
reliable with time. In addition:-
Use model output to position fronts/lows/rain-bands and
assess the likely activity of the system.
Apply classical frontal theory (bearing in mind its
shortcomings) and local knowledge to produce a best
estimate of the likely cloud structure.
2.2 Cloud Formed in Precipitation
When precipitation falls from cloud into a cloud-free
layer, evaporation takes place. This cools the air and
increases its dew point, and may give rise to condensation
and cloud.
2.2.1 In Rain Stratus pannus forms beneath thick rain cloud during
prolonged rain. It is ragged in appearance and generally
patchy – seldom approaching 8/8 and needing very prolonged
rain to do so. A rough guide to forecasting the base of
stratus pannus is:-
Layer Cloud Forecasting
Page 5 of 25
Last Saved Date : 21 October 2012
File: MS-TRAIN-COLLEGE-WORK-c:\documents and settings\eric.zappe\desktop\layer_cloud_forecasting.doc
2 hrs continuous mod/hvy rain – stratus base 800 ft
3 hrs continuous mod/hvy rain – stratus base 400 ft
but note that this does not allow for upslope or advective
effects. Upwind observation may also be helpful in
assessing the likelihood and height of stratus pannus at
your station.
2.2.2 In Snow If precipitation is falling from sub-freezing cloud in the
form of snow into cloud-free air with a temperature above
freezing, it will begin to melt. The melting of snow
requires latent heat, and this has the effect of cooling
the air to produce an isothermal layer. It has been
calculated that:-
1 hour of snow will produce an isothermal layer 600 ft
deep, increasing to a maximum of 1200 ft deep after 4 hours
The extension downwards of the 0 C isothermal layer into
the underlying warmer air causes a DALR to form between the
cooled and the unmodified ambient air. If saturation is
reached, instability causes a layer of ragged fractocumulus
a few hundred feet thick to form near the 0 C isotherm and
below the precipitating cloud base. Figure 1 illustrates
Isothermal layer
(melting snow)
SALR
(fractocumulus)
DALR
Original
temperaturecurve
Td T
0oC
Met Office College
Page 6 of 25
Last Saved Date : 21 October 2012
File: MS-TRAIN-COLLEGE-WORK-c:\documents and settings\eric.zappe\desktop\layer_cloud_forecasting.doc
the modified temperature profile produced.
Figure 1. Schematic temperature profile produced by melting
snow

Layer Cloud Forecasting
Page 7 of 25
Last Saved Date : 21 October 2012
File: MS-TRAIN-COLLEGE-WORK-c:\documents and settings\eric.zappe\desktop\layer_cloud_forecasting.doc
If there is sufficient cooling for the snow to reach the
ground without melting, an isothermal layer with
temperature near 0 C is usually established near the ground
with stratus pannus formatting at, or very near, the
surface.
2.3 Non-frontal Medium and High Cloud
Most medium and high cloud occurs in association with mass
ascent and can be forecast using the techniques described
in section 2.1. Non-frontal cloud is harder to predict,
particularly when it occurs in thin layers difficult to
discern on upper air sounding and not significant enough to
be represented in numerical model products. Such cloud is
often associated with areas of medium or upper-level
instability, or with wind shear, and the following may be
helpful in forecasting its occurrence.
i) Use satellite imagery – especially infrared
ii) Use actual or forecast ascents:
(T-Td) < 10 C
strong vertical wind shear (wind increasing with
height)
conditional or potential instability at medium/height
levels
iii) Use model cloud or relative humidity fields
iv) Areas favourable for medium and high cloud are:
Cold pools or sharp thickness troughs
On warm side of jet (within 300 miles of jet axis)
On, or just to rear of , a sharp 300mb ridge
v) Relate cirrus tops to the tropopause:
Low trop (below 30000ft) – cirrus often extends to
trop
High trop (above 35000ft) – tops a few thousand feet
below
The Handbook of Weather Forecasting includes a detailed
discussion of cirrus forecasting techniques. For further
information see chapter 19, pp. 78-83.

Met Office College
Page 8 of 25
Last Saved Date : 21 October 2012
File: MS-TRAIN-COLLEGE-WORK-c:\documents and settings\eric.zappe\desktop\layer_cloud_forecasting.doc
3 Orographic Uplift
3.1 Upslope Stratus
When stable air is forced by high ground to ascend above
its lifting condensation level (LCL) , stratus cloud forms.
If the air is very moist, the LCL will be low and fog may
form even on quite small hills.
The formation of upslope stratus is depended upon suitable,
sloping topography, and the precise wind direction may be
crucial in determining whether or not it will form over a
particular station. Hence a detailed knowledge of the
characteristics of the local area is vital if its formation
is to be successfully forecast. Table 1 summarises the
factors which are generally favourable for the formation of
upslope stratus.
Stable atmosphere
Air near to saturation at
lowest levels
Sloping terrain
Suitable (upslope) wind
direction
Moderate breeze
Table 1. Factors favourable for the development of upslope
stratus.
Note that in synoptic situation where turbulent mixing
maintains extensive low stratus over low-lying terrain (its
base given the by the mixing condensation level, or MCL),
the base of the stratus cloud on windward slopes of hills
(LCL) is usually lower. Also if precipitation occurs, a
Fohn effect may give a higher base, or smaller cloud
Layer Cloud Forecasting
Page 9 of 25
Last Saved Date : 21 October 2012
File: MS-TRAIN-COLLEGE-WORK-c:\documents and settings\eric.zappe\desktop\layer_cloud_forecasting.doc
amounts on the lee side of the high ground, see figure 2.
Figure 2. The variation of stratus base in response to
upslope motion and the Fohn effect.
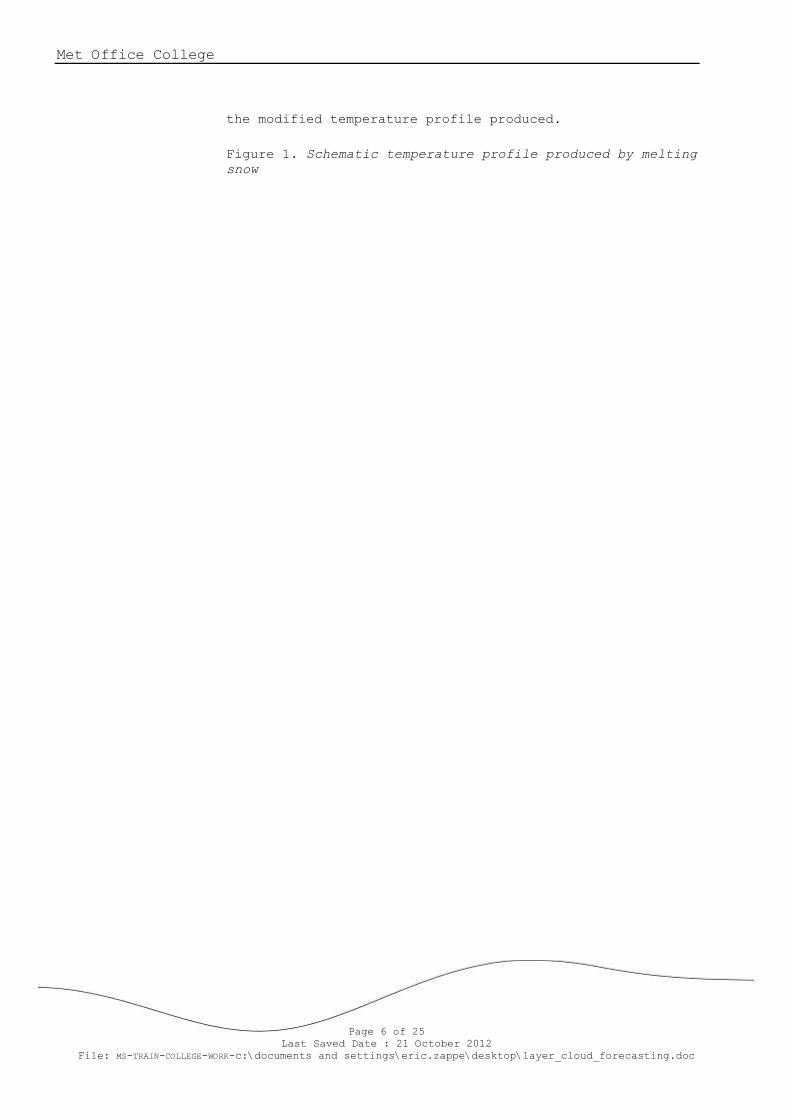
To determine the stratus base (see figure 3):-
i) Select a suitable representative upper air sounding
ii) Modify the temperature and moisture profiles near the
ground to fit the local temperature and dew point.
iii) Find the LCL from a series of levels near the
surface.
iv) Upslope stratus base is given by the lowest LCL (this
will normally be the LCL from the surface, unless the
air has a marked negative hydrolapse).
Figure 3. Determining the base of upslope stratus (given by
the lowest LCL in the lifted layer).
3.2 Orographic Cloud
The vertical motions induced in an air stream crossing high
ground often give rise to orographic clouds with
distinctive features. The actual cloud formation will
depend on the wind and temperature profile and the nature
of the topography, and a detailed discussion of orographic
cloud is beyond the scope of these notes, but some of the
Met Office College
Page 10 of 25
Last Saved Date : 21 October 2012
File: MS-TRAIN-COLLEGE-WORK-c:\documents and settings\eric.zappe\desktop\layer_cloud_forecasting.doc
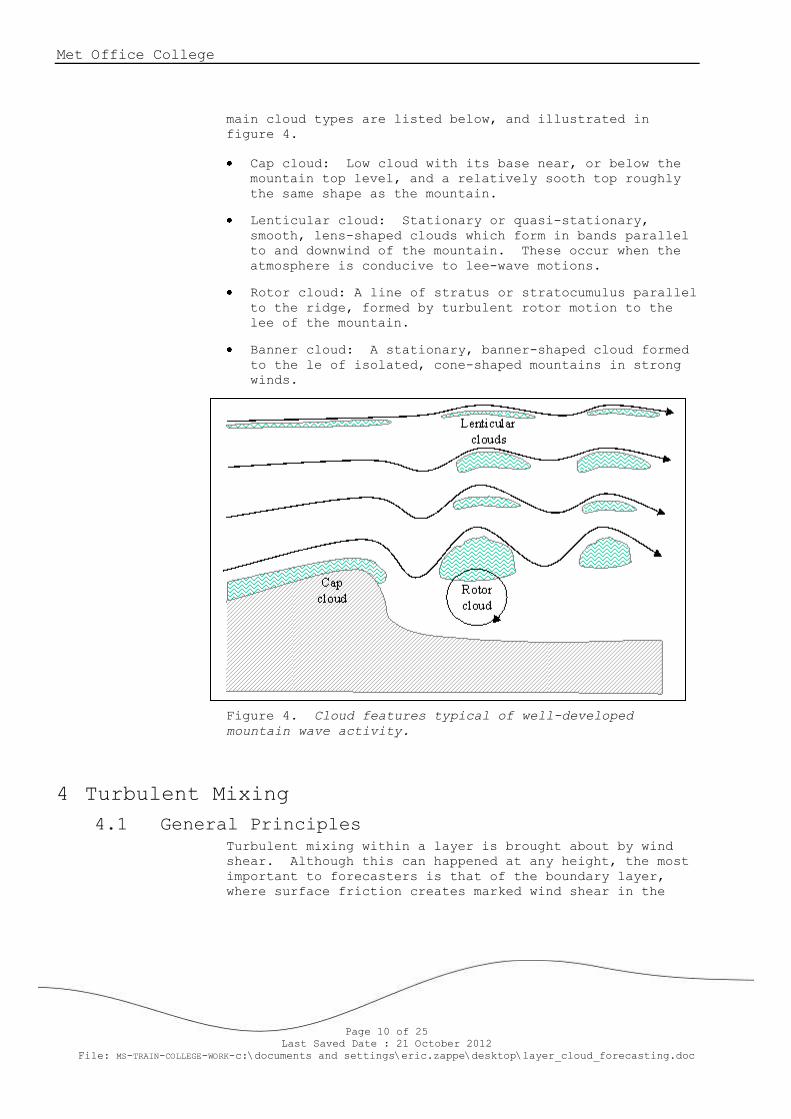
main cloud types are listed below, and illustrated in
figure 4.
Cap cloud: Low cloud with its base near, or below the
mountain top level, and a relatively sooth top roughly
the same shape as the mountain.
Lenticular cloud: Stationary or quasi-stationary,
smooth, lens-shaped clouds which form in bands parallel
to and downwind of the mountain. These occur when the
atmosphere is conducive to lee-wave motions.
Rotor cloud: A line of stratus or stratocumulus parallel
to the ridge, formed by turbulent rotor motion to the
lee of the mountain.
Banner cloud: A stationary, banner-shaped cloud formed
to the le of isolated, cone-shaped mountains in strong
winds.
Figure 4. Cloud features typical of well-developed
mountain wave activity.
4 Turbulent Mixing
4.1 General Principles
Turbulent mixing within a layer is brought about by wind
shear. Although this can happened at any height, the most
important to forecasters is that of the boundary layer,
where surface friction creates marked wind shear in the

Layer Cloud Forecasting
Page 11 of 25
Last Saved Date : 21 October 2012
File: MS-TRAIN-COLLEGE-WORK-c:\documents and settings\eric.zappe\desktop\layer_cloud_forecasting.doc
lowest few thousand feet of the earth’s atmosphere. This
section concentrates on turbulent cloud in the boundary
layer (or mixing layer). See section 2.3 for guidelines on
forecasting non-frontal medium and high cloud.
Turbulence tends to establish a DALR temperature profile in
the mixing layer, with the humidity profile developing a
constant HMR value. Consequently the relative humidity
increase with height and, if saturation is reached, cloud
forms the base given by the mixing condensation level (MCL)
of the layer. Turbulence clouds are often surmounted by
an inversion, with a sharp increase in temperature and
decrease in dew point above the cloud top, while the
temperature profile within the cloud layer approaches an
SALR (see figure 5).

Met Office College
Page 12 of 25
Last Saved Date : 21 October 2012
File: MS-TRAIN-COLLEGE-WORK-c:\documents and settings\eric.zappe\desktop\layer_cloud_forecasting.doc
Figure 5. Schematic temperature and dew point profiles
throughout a well-mixed boundary layer, depth d.
Use of the MCL to determine the cloud base requires a
knowledge of the depth of the mixing layer, d. This is
easy to assess if the top is marked by a sharp temperature
inversion, but if this is not the case an estimate must be
made using one of several empirical techniques available.
For example:-
For surface winds ≤ 16 kts:
d ≈ 200Vs
(were Vs is the surface wind speed in kts)
For surface winds > 16 kts:
d ≈ 3300 to 3600 ft during the night
d ≈ 4000 ft during the day
The difficulty in obtaining an accurate estimate of d
limits the usefulness of the MCL construction, and locally
derived empirical methods for forecasting the cloud base
often give more reliable results.
Layer Cloud Forecasting
Page 13 of 25
Last Saved Date : 21 October 2012
File: MS-TRAIN-COLLEGE-WORK-c:\documents and settings\eric.zappe\desktop\layer_cloud_forecasting.doc
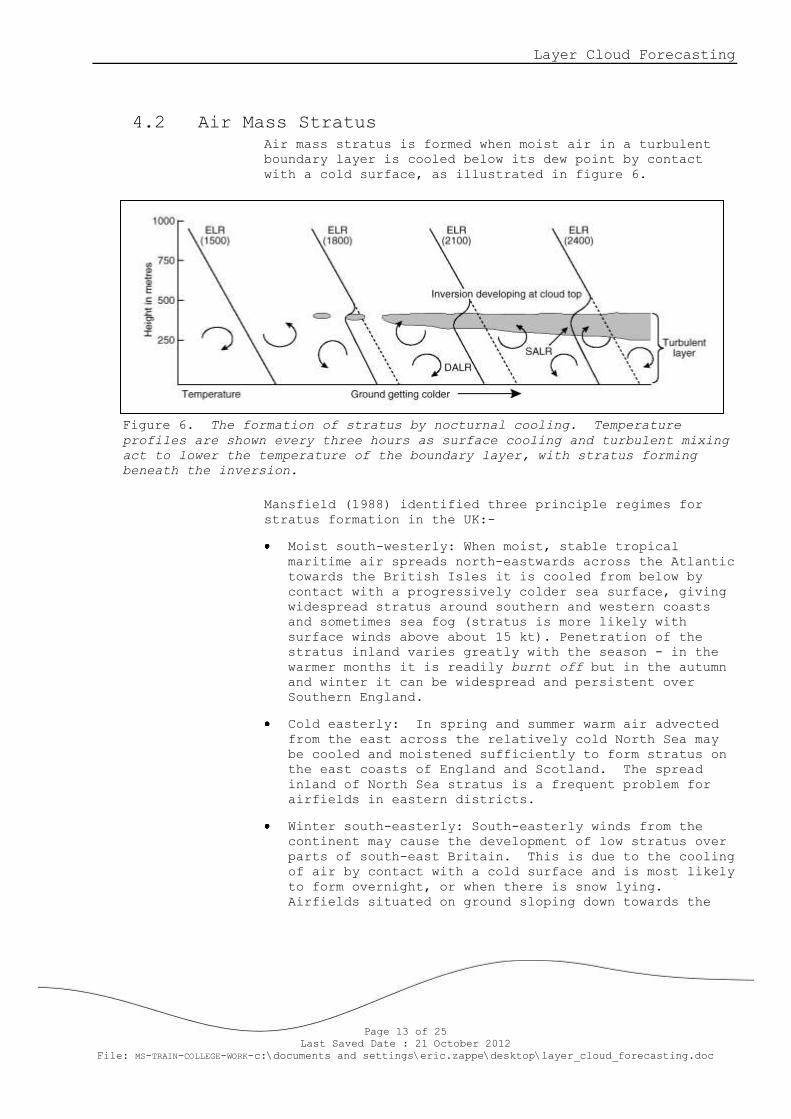
4.2 Air Mass Stratus
Air mass stratus is formed when moist air in a turbulent
boundary layer is cooled below its dew point by contact
with a cold surface, as illustrated in figure 6.
Figure 6. The formation of stratus by nocturnal cooling. Temperature
profiles are shown every three hours as surface cooling and turbulent mixing
act to lower the temperature of the boundary layer, with stratus forming
beneath the inversion.
Mansfield (1988) identified three principle regimes for
stratus formation in the UK:-
Moist south-westerly: When moist, stable tropical
maritime air spreads north-eastwards across the Atlantic
towards the British Isles it is cooled from below by
contact with a progressively colder sea surface, giving
widespread stratus around southern and western coasts
and sometimes sea fog (stratus is more likely with
surface winds above about 15 kt). Penetration of the
stratus inland varies greatly with the season - in the
warmer months it is readily burnt off but in the autumn
and winter it can be widespread and persistent over
Southern England.
Cold easterly: In spring and summer warm air advected
from the east across the relatively cold North Sea may
be cooled and moistened sufficiently to form stratus on
the east coasts of England and Scotland. The spread
inland of North Sea stratus is a frequent problem for
airfields in eastern districts.
Winter south-easterly: South-easterly winds from the
continent may cause the development of low stratus over
parts of south-east Britain. This is due to the cooling
of air by contact with a cold surface and is most likely
to form overnight, or when there is snow lying.
Airfields situated on ground sloping down towards the

Met Office College
Page 14 of 25
Last Saved Date : 21 October 2012
File: MS-TRAIN-COLLEGE-WORK-c:\documents and settings\eric.zappe\desktop\layer_cloud_forecasting.doc
south-east are particularly prone to stratus in these
situations (see section 3.1 for more information on
upslope stratus).
Figure 7 shows the areas most prone to stratus in each of
these
three regimes.
Figure 7. Areas of the British Isles prone to stratus (shaded) in the three
principal regimes: a) moist south-westerly, b) cold easterly, c) winter south-
easterly.
Another common scenario, not shown above, occurs when
tropical air is drawn around an anticyclone centred to the
west of the UK. This can often lead to stratus affecting
northeastern facing coasts, particularly in spring when sea
surface temperatures are at their coldest. Such stratus is
commonly referred as North Sea stratus, “Haar” or “Sea
Fret”. (See also course notes on Fog, section 3.)
The extent to which marine stratus will both move inland,
or indeed recede back to the coast, depends on the degree
of differential heating between land and sea and the
strength of the onshore wind. The edge of the stratus
sheet denotes the equilibrium point between two opposing
processes; net condensation caused by cooling over the sea
and net evaporation caused by heating (and the presence of
drier air) over the land. Daytime heating leads to an
increase in evaporation rates which during the summer is
usually enough to offset the onshore feed of stratus and
“burn” the stratus back to the coast. However, an increase
in onshore wind, caused by a sea breeze for example, can
bring the cloud edge back on to the coast. During the
evening, the cloud edge moves inland as land temperatures,
and hence evaporation rates, fall. This diurnal cycle will
persist for as long as the synoptic situation remains
unchanged, but subtle variations in humidity and wind speed
make accurate prediction a forecasting challenge.
Many coastal sites have developed their own local
techniques for forecasting the advection of coastal stratus
a
)
b
)
c
)

Layer Cloud Forecasting
Page 15 of 25
Last Saved Date : 21 October 2012
File: MS-TRAIN-COLLEGE-WORK-c:\documents and settings\eric.zappe\desktop\layer_cloud_forecasting.doc
and these should be studied closely on arrival at a new
station. As a general guide coastal stratus will start to
spread inland when the temperature on the coast has fallen
a degree or two below the morning stratus clearance
temperature. (If the coastal temperature is not known, use
the sea temperature).
Met Office College
Page 16 of 25
Last Saved Date : 21 October 2012
File: MS-TRAIN-COLLEGE-WORK-c:\documents and settings\eric.zappe\desktop\layer_cloud_forecasting.doc
4.3 Forecasting Techniques
If stratus is expected to form, the following will have to
be predicted:-
Stratus base
Stratus tops
Temperature of formation and clearance
Time of formation and clearance
Numerous different formulae, theoretical and empirical,
have been developed to aid in the prediction of stratus
formation. Success with these is, however, dependent upon
location and they will not be discussed here. There is no
substitute for experience and local knowledge. Find out
which methods work best in your area and look at local
studies and airfield weather diagrams.
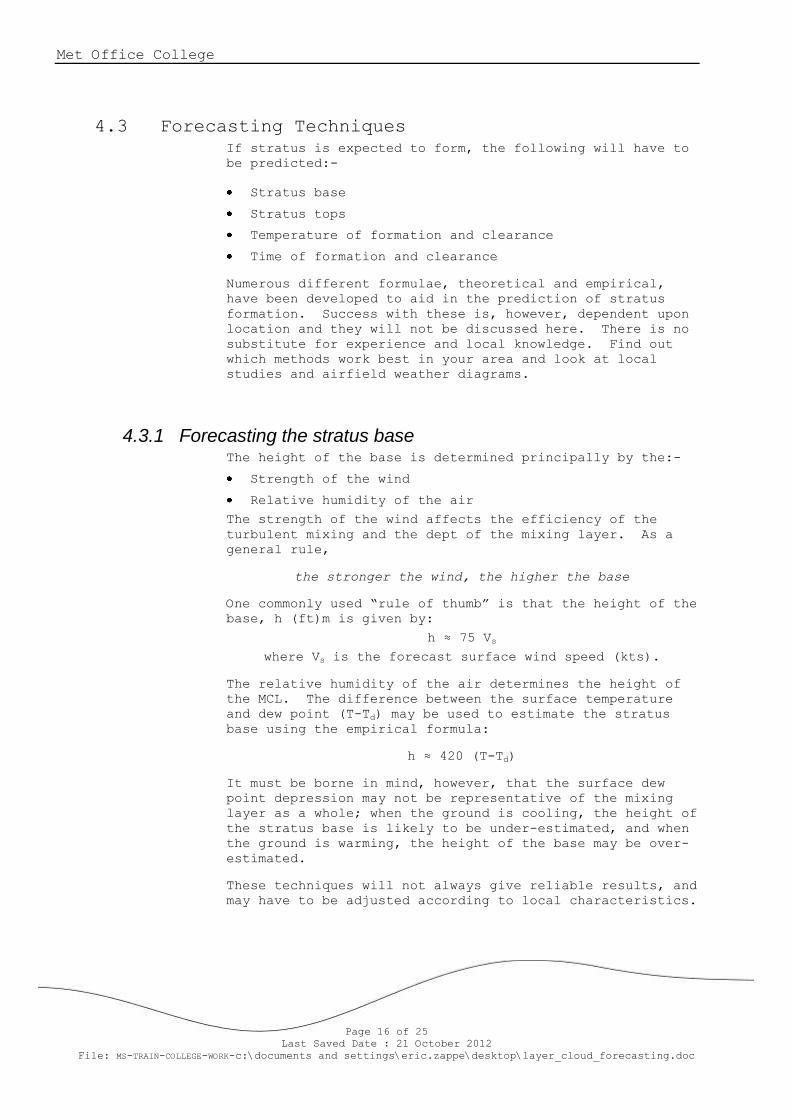
4.3.1 Forecasting the stratus base The height of the base is determined principally by the:-
Strength of the wind
Relative humidity of the air
The strength of the wind affects the efficiency of the
turbulent mixing and the dept of the mixing layer. As a
general rule,
the stronger the wind, the higher the base
One commonly used “rule of thumb” is that the height of the
base, h (ft)m is given by:
h ≈ 75 Vs
where Vs is the forecast surface wind speed (kts).
The relative humidity of the air determines the height of
the MCL. The difference between the surface temperature
and dew point (T-Td) may be used to estimate the stratus
base using the empirical formula:
h ≈ 420 (T-Td)
It must be borne in mind, however, that the surface dew
point depression may not be representative of the mixing
layer as a whole; when the ground is cooling, the height of
the stratus base is likely to be under-estimated, and when
the ground is warming, the height of the base may be over-
estimated.
These techniques will not always give reliable results, and
may have to be adjusted according to local characteristics.
Layer Cloud Forecasting
Page 17 of 25
Last Saved Date : 21 October 2012
File: MS-TRAIN-COLLEGE-WORK-c:\documents and settings\eric.zappe\desktop\layer_cloud_forecasting.doc
If stratus has already formed upwind, the observed base may
be a more useful guide, though this may need to be adjusted
to allow for cooling and local effects.
4.3.2 Forecasting the stratus top The stratus top will occur at the top of the mixing layer
(see section 4.1). In cases where the depth of the mixing
layer is uncertain, remember that in most situations
stratus is likely to be no more than a few hundred feet
thick.
4.3.3 Forecasting the temperature of stratus formation The stratus formation temperature, Tst, may be found from a
number of sources, the choice of which to use depending on
the location and synoptic situation.
Stratus may form at:-
The temperature which stratus is already present on the
chart.
The stratus clearance temperature earlier in the day
(minus 1 or 2 C).
The sea temperature if stratus is expected to be
advected in from the sea
The stratus formation temperature determined from a
representative ascent (see figure 8).

Met Office College
Page 18 of 25
Last Saved Date : 21 October 2012
File: MS-TRAIN-COLLEGE-WORK-c:\documents and settings\eric.zappe\desktop\layer_cloud_forecasting.doc
Figure 8. Determination of the stratus formation
temperature (Tst) from a representative ascent:
i) Use Saunders technique to find the fog point, Tf
ii) From Tf draw a constant HMR line to the pressure level at which you expect the stratus to form (point A).
iii) From A, follow a dry adiabat to the surface pressure
(QFE). The temperature at this point is Tst.
4.3.4 Forecasting the time of stratus formation The usual method is to construct a cooling curve assuming
clear sky conditions. The time at which the temperature
falls to Tst is the time at which stratus may be expected
to form.
4.3.5 Forecasting the clearance of stratus There are three main mechanisms by which stratus may be
cleared:-
Insolation
Increased wind
Layer Cloud Forecasting
Page 19 of 25
Last Saved Date : 21 October 2012
File: MS-TRAIN-COLLEGE-WORK-c:\documents and settings\eric.zappe\desktop\layer_cloud_forecasting.doc
Advection of drier air
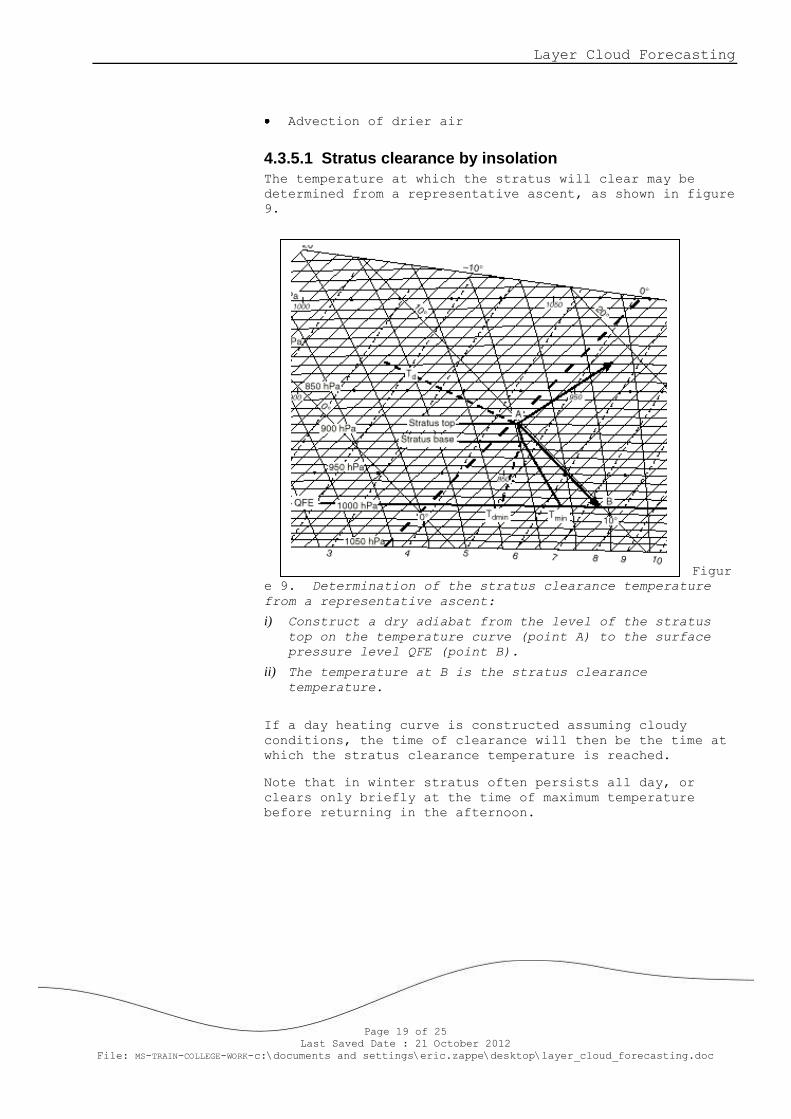
4.3.5.1 Stratus clearance by insolation
The temperature at which the stratus will clear may be
determined from a representative ascent, as shown in figure
9.
Figur
e 9. Determination of the stratus clearance temperature
from a representative ascent:
i) Construct a dry adiabat from the level of the stratus
top on the temperature curve (point A) to the surface
pressure level QFE (point B).
ii) The temperature at B is the stratus clearance
temperature.
If a day heating curve is constructed assuming cloudy
conditions, the time of clearance will then be the time at
which the stratus clearance temperature is reached.
Note that in winter stratus often persists all day, or
clears only briefly at the time of maximum temperature
before returning in the afternoon.
Met Office College
Page 20 of 25
Last Saved Date : 21 October 2012
File: MS-TRAIN-COLLEGE-WORK-c:\documents and settings\eric.zappe\desktop\layer_cloud_forecasting.doc
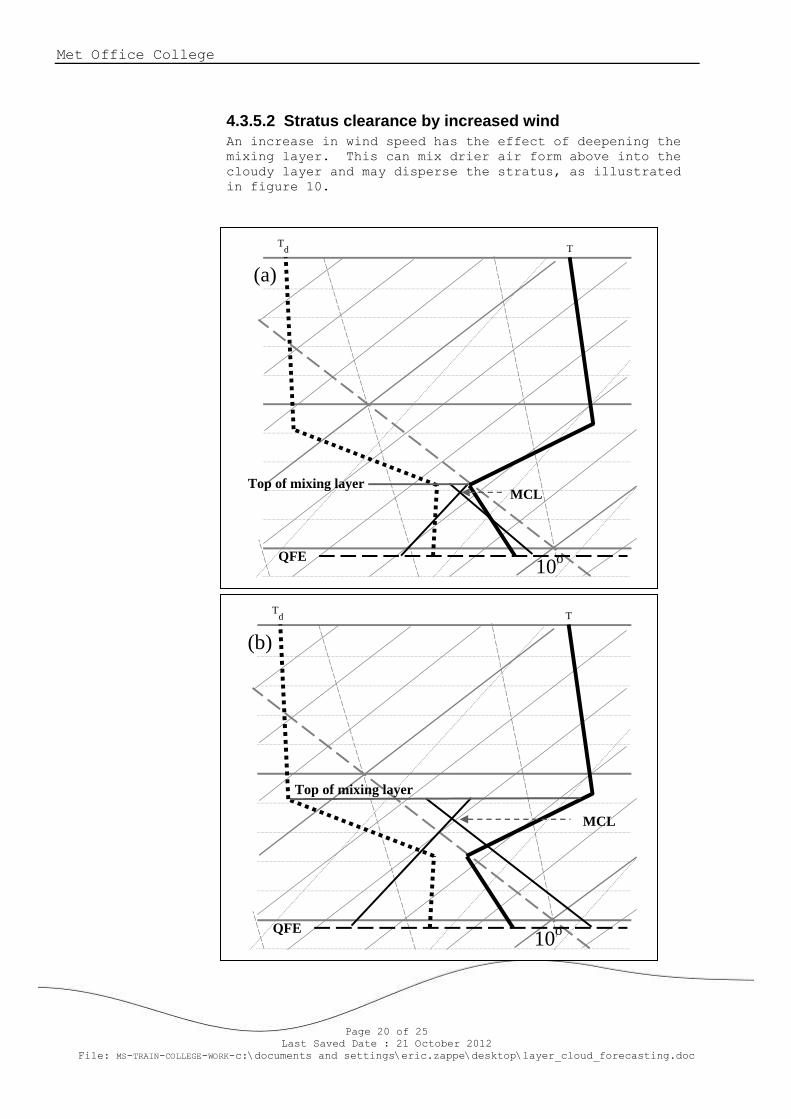
4.3.5.2 Stratus clearance by increased wind
An increase in wind speed has the effect of deepening the
mixing layer. This can mix drier air form above into the
cloudy layer and may disperse the stratus, as illustrated
in figure 10.
10o
Td T
Top of mixing layerMCL
QFE
(a)
10o
Td T
Top of mixing layer
MCL
QFE
(b)
Layer Cloud Forecasting
Page 21 of 25
Last Saved Date : 21 October 2012
File: MS-TRAIN-COLLEGE-WORK-c:\documents and settings\eric.zappe\desktop\layer_cloud_forecasting.doc
Figure 10. Stratus clearance by increased wind: a)
stratus with shallow mixing layer (light winds), b) cloud-
free, deeper mixing layer (stronger winds).
4.3.5.3 Stratus clearance by advection of drier air
The advection of drier air, perhaps from a somewhat
different track, may result in the clearance of stratus.
In such cases the rear edge may be followed on satellite
pictures and/or synoptic charts.
One example commonly seen is the clearance of North Sea
stratus by the backing of the wind to give a shorter sea
track from the continent.
4.4 Non-frontal Stratocumulus
For stratus formation, the turbulence is generally purely
mechanical – caused by friction at the earth’s surface. In
the case of stratocumulus, however, convection often plays
some part, as evidenced by the cellular nature of the cloud
on many occasions.
Stratocumulus may be very persistent and cover large areas,
and the prediction of its formation and dispersal remain
difficult problems for the forecaster. These notes are
restricted to a brief discussion of the forecasting of non-
frontal stratocumulus. For more detail on the physics and
dynamics see Bennetts, et al (1986).
It is helpful to identify two main categories:-
Stratocumulus formed by the spreading out of cumulus
Anticyclonic stratocumulus
4.4.1 Stratocumulus formed by the spreading out of cumulus When cumulus reaches a stable layer, vertical growth is
inhibited and tops spread out as stratocumulus, some times
becoming an almost unbroken sheet for the rest of the day
(see figure 11).
This is a common occurrence in subsiding polar maritime air
masses, particularly on the eastern side of anticyclones.
Table 2 lists the main criteria for the development and
dispersal of stratocumulus formed by the spreading out of
cumulus.

Met Office College
Page 22 of 25
Last Saved Date : 21 October 2012
File: MS-TRAIN-COLLEGE-WORK-c:\documents and settings\eric.zappe\desktop\layer_cloud_forecasting.doc
F
igure 11. Formation of stratocumulus from the
spreading out of cumulus beneath a stable layer.
Development
1. An inversion or well-marked stable layer strong enough to
halt all convective
upcurrents even at the time
of maximum insolation
2. A lapse rate close to the DALR up to the base of the
inversion when convection
starts
3. A LCL at least 2000 ft below the level of the inversion,
4. A dew point depression between the LCL and the base
Dispersal
1. A decrease in dew point such that the LCL rises to within 30 hPa of the
inversion.
2. An increase in surface temperature such that the LCL rises to within 30
hPa of the inversion
3. Continued subsidence such that the inversion lowers to within 30mb of the
LCL
4. A weakening of the inversion sufficient to allow cumulus tops to
break through to higher levels and
initiate entrainment of dry air into
Layer Cloud Forecasting
Page 23 of 25
Last Saved Date : 21 October 2012
File: MS-TRAIN-COLLEGE-WORK-c:\documents and settings\eric.zappe\desktop\layer_cloud_forecasting.doc
of the inversion of 5C or
less.
the cloud layers
5. A cessation of convection due. to nocturnal cooling (does not apply over
the sea).
Table 2. The main criteria for the development and dispersal of
stratocumulus formed by the spreading out of cumulus.
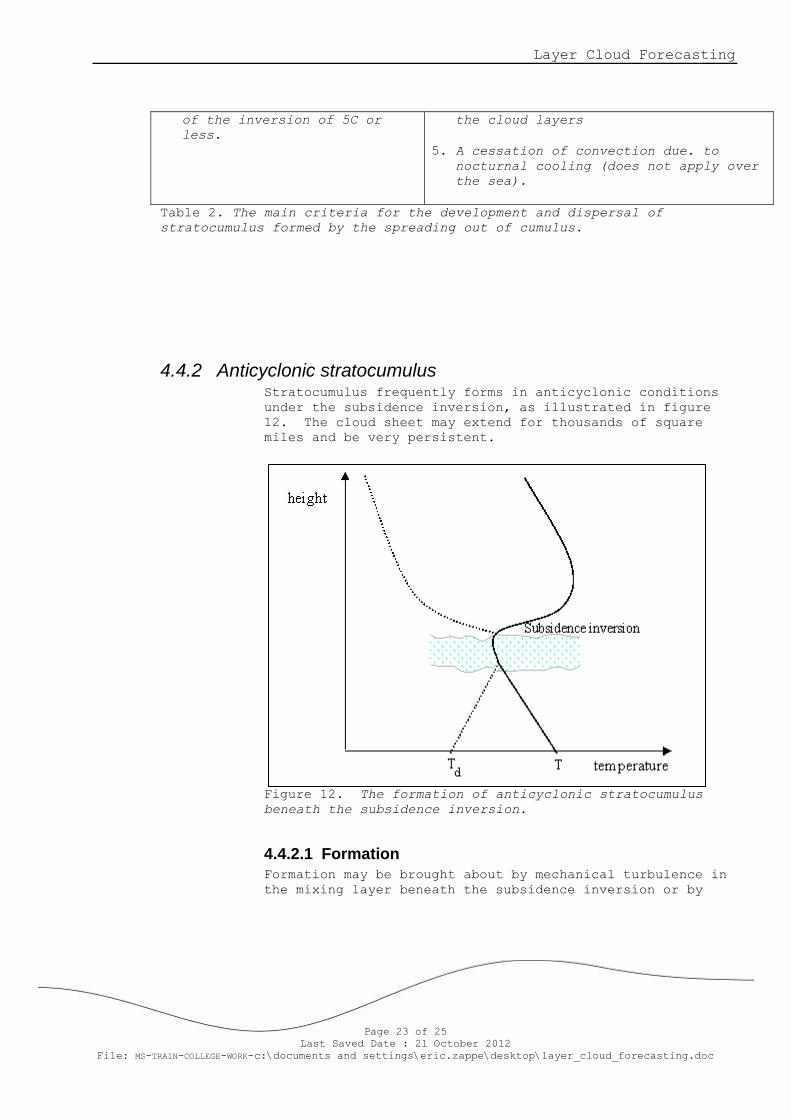
4.4.2 Anticyclonic stratocumulus Stratocumulus frequently forms in anticyclonic conditions
under the subsidence inversion, as illustrated in figure
12. The cloud sheet may extend for thousands of square
miles and be very persistent.
Figure 12. The formation of anticyclonic stratocumulus
beneath the subsidence inversion.
4.4.2.1 Formation
Formation may be brought about by mechanical turbulence in
the mixing layer beneath the subsidence inversion or by
Met Office College
Page 24 of 25
Last Saved Date : 21 October 2012
File: MS-TRAIN-COLLEGE-WORK-c:\documents and settings\eric.zappe\desktop\layer_cloud_forecasting.doc
convection due to surface heating or a combination of the
two. Convection is particularly important when cold air
moves over a warmer sea – the inversion limits the depth of
convection and a sheet of stratocumulus quickly develops.
Forecasting notes:
i) Advect the cloud edge with the wind at cloud level
ii) Use satellite imagery (especially the visible waveband)
iii) It is usually best to forecast NIL or 8/8
iv) The cloud sheet reduces insolation and inhibits night cooling
v) Anticyclonic stratocumulus may be very persistent,
especially in winter
4.4.2.2 Dispersal
It is very difficult to predict the dispersal of
anticyclonic stratocumulus, especially in winter, but the
following notes may help:-
i) Look for a rear edge to the cloud sheet and advect it
with the wind at cloud level, or by continuity (using
satellite imagery or upwind observations).
ii) If the surface temperature rises sufficiently to give a
DALR profile up to the cloud top, the cloud may start to
break up, but re-form when the temperature drops
(dispersal by this mechanism is unlikely in winter).
iii) Continued subsidence may lower the inversion sufficiently to bring drier air down and disperse the
cloud. This is, however, unusual.
iv) Two objective techniques are described in the Forecasters Reference Book: James’ rule and Kraus’
rule. However, neither of these is a particularly
reliable tool for forecasting.
5 Suggestions for Further Reading 1. The Forecasters Reference Book contains a section on the
forecasting of layer cloud, including some useful hints
and tips. See Chapter 5.
2. For a more thorough discussion of layer cloud forecasting the best reference is the Handbook of

Layer Cloud Forecasting
Page 25 of 25
Last Saved Date : 21 October 2012
File: MS-TRAIN-COLLEGE-WORK-c:\documents and settings\eric.zappe\desktop\layer_cloud_forecasting.doc
Weather Forecasting (Met. O 875). Chapter 19 is devoted
to the forecasting of clouds and precipitation.
3. Two Meteorological Magazine articles are recommended for further detail on specific topics:-
Bennets, D.A., McCallum, E. And Nicholls, S.
Stratocumulus: An Introductory Account, March 1986,
pp. 65-76
Mansfield, D.A.
An investigation into stratus distribution over the
United Kingdom, August 1988, pp. 236-245.