Embed Size (px)
Citation preview
1
Lawyers Road Diet Survey
Results Report
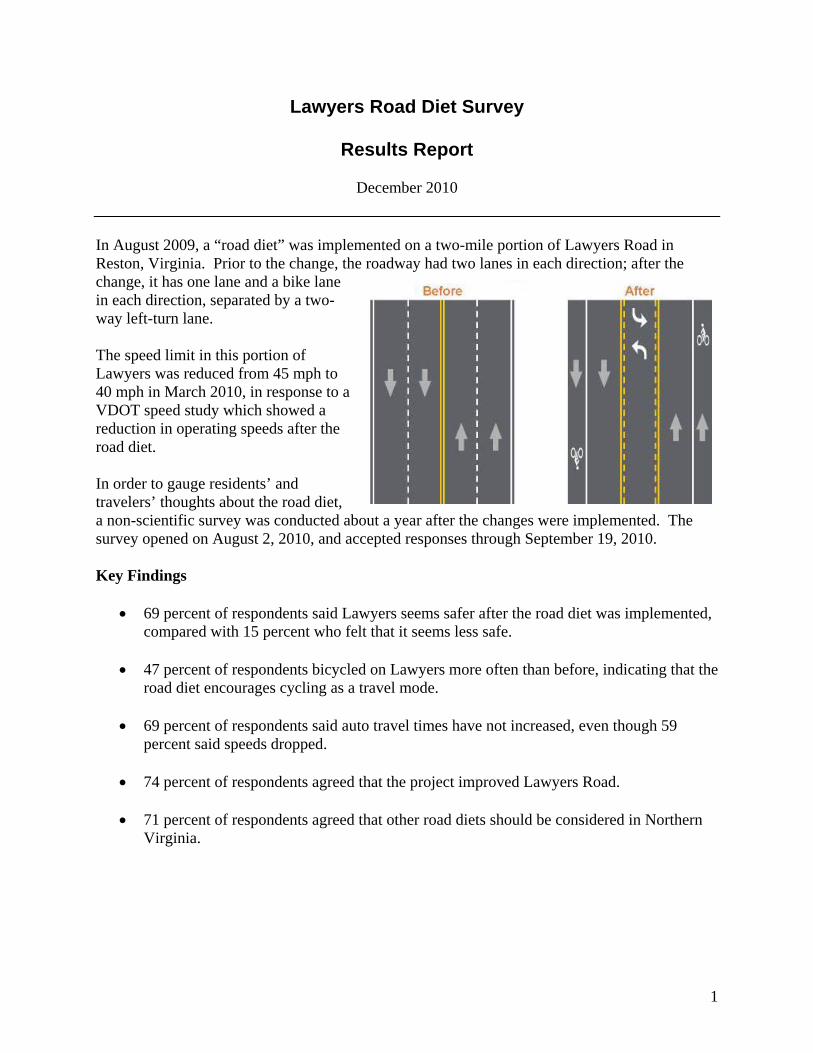
December 2010 In August 2009, a “road diet” was implemented on a two-mile portion of Lawyers Road in Reston, Virginia. Prior to the change, the roadway had two lanes in each direction; after the change, it has one lane and a bike lane in each direction, separated by a two-way left-turn lane. The speed limit in this portion of Lawyers was reduced from 45 mph to 40 mph in March 2010, in response to a VDOT speed study which showed a reduction in operating speeds after the road diet. In order to gauge residents’ and travelers’ thoughts about the road diet, a non-scientific survey was conducted about a year after the changes were implemented. The survey opened on August 2, 2010, and accepted responses through September 19, 2010. Key Findings
69 percent of respondents said Lawyers seems safer after the road diet was implemented, compared with 15 percent who felt that it seems less safe.
47 percent of respondents bicycled on Lawyers more often than before, indicating that the
road diet encourages cycling as a travel mode.
69 percent of respondents said auto travel times have not increased, even though 59 percent said speeds dropped.
74 percent of respondents agreed that the project improved Lawyers Road.
71 percent of respondents agreed that other road diets should be considered in Northern
Virginia.

2
Publicity VDOT publicized the survey in a news release dated August 5 and followed up with announcements on social media, including Facebook and Twitter. VDOT also conducted targeted outreach to alert key stakeholders to the survey. The following publicity was observed during the survey period:
8/5/2010 VDOT news release issued 8/5/2010 Post on Hunter Mill District website 8/6/2010 Post on FABB blog 8/6/2010 Post on fairfaxcycling Yahoogroup 8/9/2010 Post on reston.org
8/10/2010 Post on Restonian blog 8/11/2010 Post on allfairfax.com 8/12/2010 Post on Reston Patch 8/13/2010 Post on goreston.com 8/18/2010 Fairfax Times news brief 8/22/2010 Note in St. John Neumann bulletin 8/23/2010 Sull-e newsletter distributed 8/25/2010 Post on Greater Greater Washington 8/26/2010 Post on Reston Bike Club website 8/27/2010 Post on Team FeXY Forums 8/27/2010 Post on MABRA-USCF Google group 9/3/2010 Post on Gamjams.net 9/3/2010 Post in FABB newsletter 9/3/2010 Second post on goreston.com ~9/7/10 Note in Hunter Mill District Newsletter
9/11/2010 Post on Fox Mill Estates website 9/17/2010 Second post on Reston Patch
Response A total of 851 responses to the survey were collected. Of these responses, 67 included only answers to the first two demographic questions; these responses were discarded, leaving 784 valid responses. A goal of the survey was to pay particular attention to the responses from nearby residents. About 30 percent of the total responses, 238, were collected from residents who live within two blocks of Lawyers Road and have lived in their current ZIP Code for more than two years. This subset is referred to as “local long-term respondents” in this document. Respondents were required to answer the first two survey questions in order to proceed to the rest of the survey, but they were free to skip other questions.
3
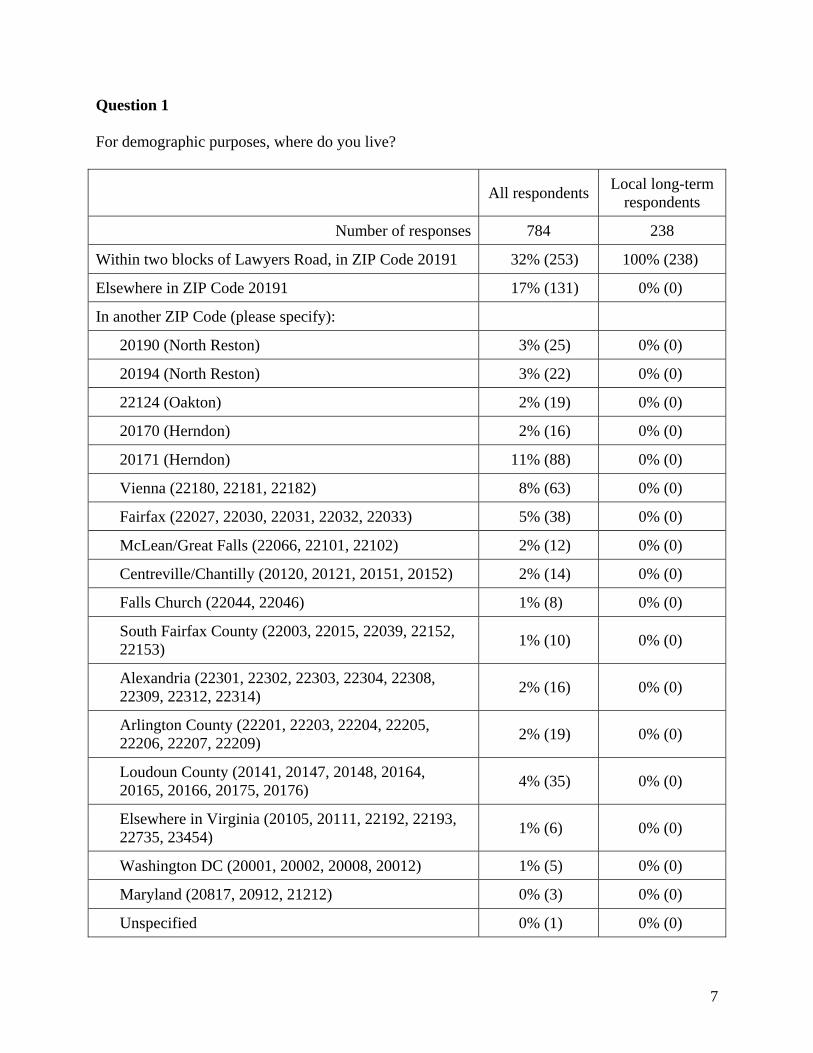
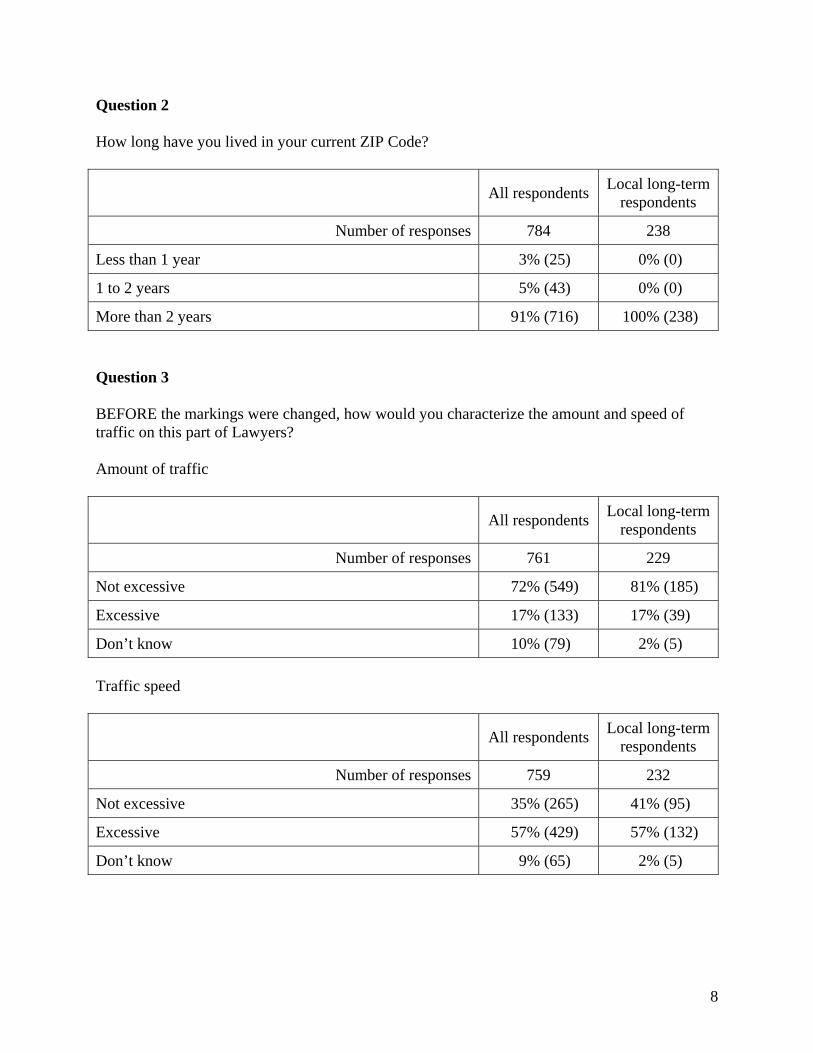
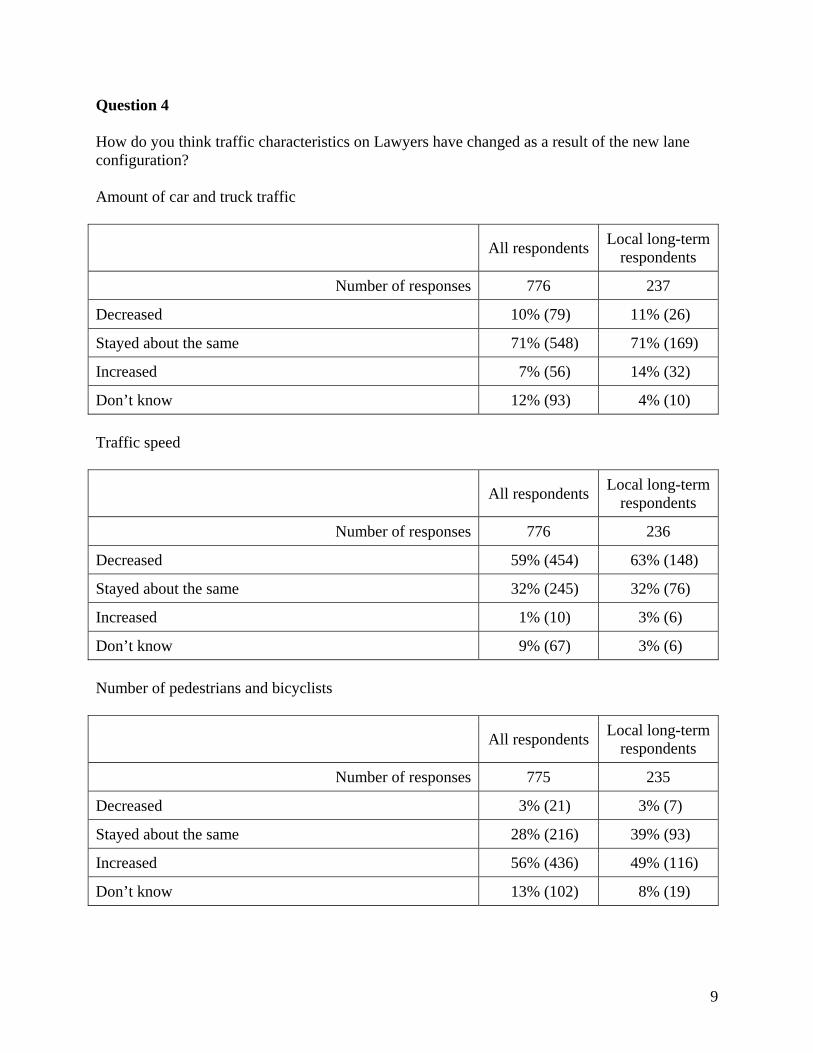
Results of Multiple-Choice Questions The complete text of the survey questions and the results by question are presented in Appendix A. Responses to the demographic questions suggest that the survey targeted the correct group of residents. About 49 percent of respondents live in ZIP Code 20191, where the road diet is located, and an additional 22 percent live elsewhere in Reston or in an immediately adjacent ZIP Code 20170, 20171, or 22124. Most respondents, 91 percent, have lived in their current ZIP Code for at least two years. A majority of 72 percent of all respondents and 81 percent of local long-term respondents agreed that the amount of traffic on Lawyers was not excessive prior to the road diet. However, 57 percent of both groups of respondents felt that speeds were excessive. Likewise, 71 percent of both groups felt that the the amount of traffic stayed about the same after the road diet was implemented. Traffic counts taken before and after the road diet were implemented confirmed that traffic volume did not change significantly. Counts showed that traffic volumes on Lawyers declined by 1.6 percent, a decrease similar in magnitude to other roadways in the area that did not have pavement marking changes. A smaller margin of 59 percent felt that traffic speeds had decreased; this margin increased to 63 percent among local long-term respondents. VDOT studies support the majority view, noting that average speeds declined by about 1 mph after the road diet was implemented, but also that the fastest speeders, those traveling at 50 mph or above, dropped from 13 percent of the motorists to only 1 percent. (These studies were conducted prior to the reduction in speed limit, so the speed limit change did not influence the results.) About half of respondents said the number of pedestrians and bicyclists had increased; only 3 percent claimed to have seen a reduction. In response to question 5, 69 percent of respondents said Lawyers seems safer after the road diet was implemented, compared with 15 percent who felt that it seems less safe. However, among local long-term respondents, the picture changes slightly, with 55 percent claiming that the road seems safer and 26 percent less safe. The ratio of those who believe the roadway is safer to those who believe it is less safe is about 4.6 among all respondents and drops to 2.1 among local long-term respondents. This variation could indicate that those who use the road frequently are more likely to encounter behaviors they consider unsafe. However, although the margin of support is lower, the safety preference for the road diet is clear. Actual crash results were not shared with survey respondents. However, early crash records validate the majority view that the road feels safer. In the four years prior to the road diet, this
4
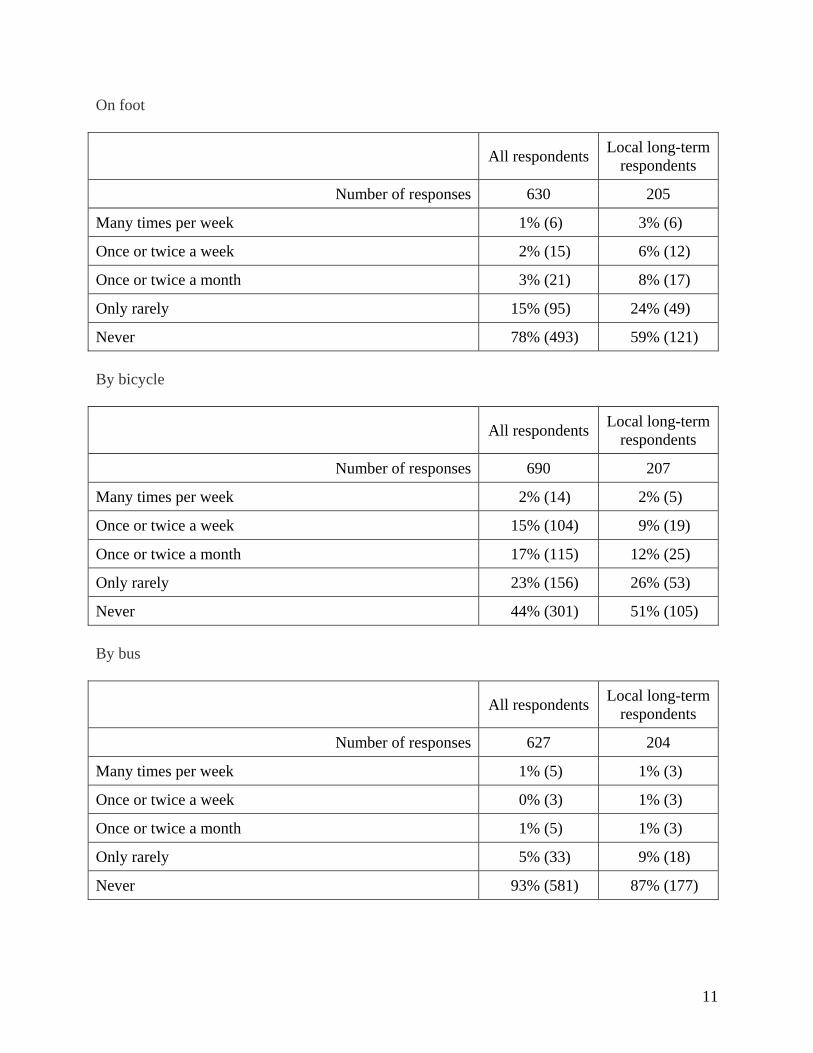
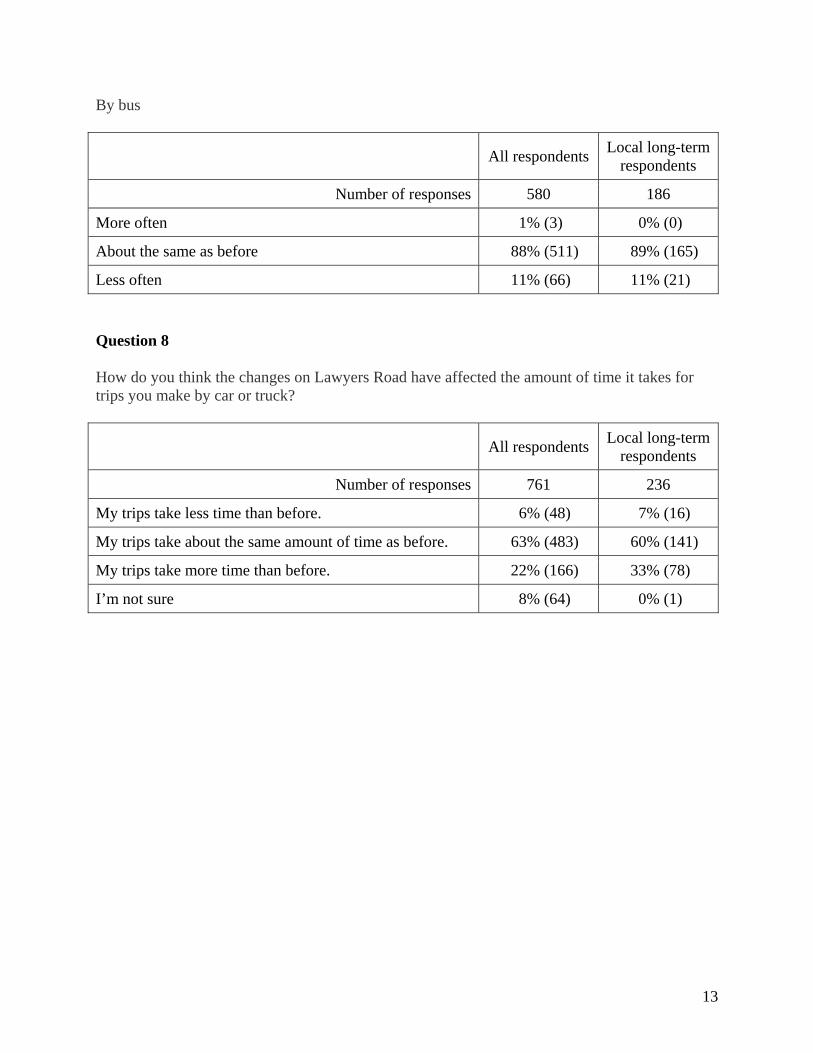
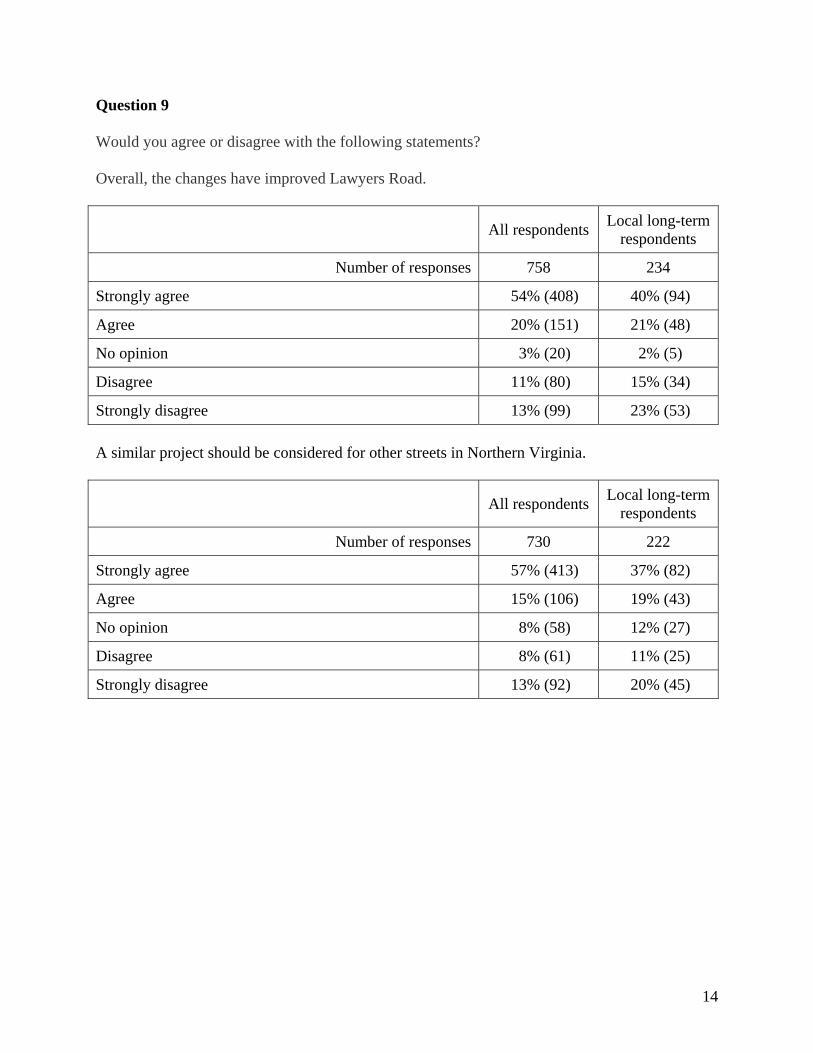
segment of Lawyers experienced about 15 crashes per year. In the first year after the change, there were 3 crashes, a drop of 80 percent. Prior to the road diet, respondents were collectively biased heavily toward personal autos as a travel mode on Lawyers. About 69 percent of respondents traveled on Lawyers by car or truck at least once a week, but only 3 percent walked, 17 percent bicycled, and 1 percent rode a bus on Lawyers at least once a week. Certainly, the mode choice prior to the road diet was influenced heavily by the roadway’s unfriendliness to non-motorized travel modes and slim bus service. After the road diet, over 80 percent of respondents generally continued to drive, walk, and ride the bus about the same amount as before. However, 47 percent of respondents bicycled on Lawyers more often than before, indicating that the road diet encourages cycling as a travel mode. The mode choice for local long-term respondents followed a similar pattern, but the effect was smaller in magnitude. Prior to the road diet, 97 percent of this group traveled on Lawyers by car or truck, 9 percent walked, 11 percent bicycled, and 2 percent rode a bus at least once a week. After the road diet, about 90 percent of local long-term respondents continue to drive and ride the bus with the same frequency as before. Of this group, 27 percent indicated a propensity to cycle more often, and 14 percent walked more frequently on Lawyers. The road diet did not provide exclusive facilities for pedestrians, but the bike lane does offers better pedestrian accommodations than the prior roadway configuration. A majority of respondents, 63 percent, indicated that auto trips take about the same amount of time after the road diet as before. About 22 percent noted that trips take more time, compared with 6 percent who believe that trips take less time. A majority of local long-term respondents, 60 percent, agreed with the larger group that trips were not significantly lengthened. However, a larger minority of the local long-term group, 33 percent, said trips take longer, compared with 7 percent who said they take less time. About 74 percent of respondents agreed that the project improved Lawyers Road, compared to about 24 percent who disagreed, a ratio of about 3 to 1 in agreement. Among these who agreed, more than two-thirds strongly agreed, while among those who disagreed, about half felt strongly. Most local long-term respondents also agreed that the changes improved Lawyers, but with a smaller margin. In this group, 61 percent agreed and 37 percent disagreed, a ratio of about 1.6 to 1 in agreement. About two thirds of both groups felt strongly about their belief. Results were very similar when respondents were asked whether other road diets should be considered in Northern Virginia. In this case, 71 percent agreed and 21 percent disagreed among all respondents, for a ratio of about 3.4 to 1 in agreement. Among local long-term respondents, 56 percent agreed and 32 percent disagreed, a ratio of about 1.8 to 1 in agreement.

5
Text comments The survey also offered respondents the opportunity to comment in a text box. Some comments recurred frequently from many respondents. Following are the most frequently recurring comments that were not previously addressed by a multiple-choice survey question:
Safety for cyclists has improved. Over 40 respondents specifically noted an improvement in safety for cyclists; only 4 respondents offered the contrary view that the changes negatively affected cyclist safety.
Cars sometimes use the center turn lane to pass. This behavior, potentially a cause of
head-on crashes, was cited by 47 respondents. Two respondents claimed not to have observed this problem.
It is difficult to pass slower-moving cars. The difficulty, or legal prohibition, in passing
was mentioned by 38 respondents. Certainly, this concern may contribute to motorists’ use of the turn lane for passing.
Excessive speeds have declined. A key finding is that the changes reduced the highest
speeds, a feature that was mentioned by 30 respondents. In the prior layout, the most excessive speeders often passed other vehicles, so the concern about difficulty passing is a disadvantage tied closely to the advantage of the reduction of the highest speeds. No respondents claimed that speeds increased after the changes, but 3 respondents said excessive speeds still exist.
The bike lanes do not connect to other bicycle-friendly facilities, particularly at the
termini. The bike lanes on Lawyers may be an ingredient in a future cycling network, but the lanes in their current state offer limited connectivity, as noted by 62 respondents. The termini of the bike lanes, particularly on the east end, pose challenges for users who continue on Lawyers. Two respondents said the lanes do connect to other facilities. Many of the respondents who expressed this concern were not cyclists, but were concerned about the impact of cyclists on the traffic stream.
The bike lanes need to be kept free of debris. The only maintenance concern cited
frequently, by 26 respondents, is the need for the bike lanes to be swept periodically. No respondents offered a contrary view.
Some cyclists ride outside the bike lanes. Most of the 32 respondents who expressed this
frustration were local long-term respondents. Many of the respondents mentioned large groups of cyclists that frequent Lawyers on weekday evenings. Others noted that cyclists are sometimes unable to ride within the bike lanes because of debris, as noted above.
Other road diets and more bicycling accommodations are needed. Over 50 respondents
advocated for road diets elsewhere, most frequently mentioning Soapstone Drive in Reston as a candidate. More than 50 respondents also suggested expanding the bicycling infrastructure in Northern Virginia.

6
Appendix A
Question-by-question survey results In the following tables, “local long-term respondents” are those who have lived within two blocks of Lawyers Road for more than two years. Percentages in tables may not sum to 100 percent because of rounding. Introductory Remarks Presented to Respondents In conjunction with a paving project in August 2009, the Virginia Department of Transportation changed the lane configuration on Lawyers Road in Reston, between Reston Parkway and Myrtle Lane. The road used to have two lanes in each direction; it was reconfigured with one lane and a bike lane in each direction, separated by a two-way left-turn lane. This treatment is sometimes called a "road diet". VDOT would like your opinion about the changes. Thank you for taking a few moments to complete this brief, anonymous 9-question survey.
7
Question 1 For demographic purposes, where do you live?
All respondents Local long-term
respondents
Number of responses 784 238
Within two blocks of Lawyers Road, in ZIP Code 20191 32% (253) 100% (238)
Elsewhere in ZIP Code 20191 17% (131) 0% (0)
In another ZIP Code (please specify):
20190 (North Reston) 3% (25) 0% (0)
20194 (North Reston) 3% (22) 0% (0)
22124 (Oakton) 2% (19) 0% (0)
20170 (Herndon) 2% (16) 0% (0)
20171 (Herndon) 11% (88) 0% (0)
Vienna (22180, 22181, 22182) 8% (63) 0% (0)
Fairfax (22027, 22030, 22031, 22032, 22033) 5% (38) 0% (0)
McLean/Great Falls (22066, 22101, 22102) 2% (12) 0% (0)
Centreville/Chantilly (20120, 20121, 20151, 20152) 2% (14) 0% (0)
Falls Church (22044, 22046) 1% (8) 0% (0)
South Fairfax County (22003, 22015, 22039, 22152, 22153)
1% (10) 0% (0)
Alexandria (22301, 22302, 22303, 22304, 22308, 22309, 22312, 22314)
2% (16) 0% (0)
Arlington County (22201, 22203, 22204, 22205, 22206, 22207, 22209)
2% (19) 0% (0)
Loudoun County (20141, 20147, 20148, 20164, 20165, 20166, 20175, 20176)
4% (35) 0% (0)
Elsewhere in Virginia (20105, 20111, 22192, 22193, 22735, 23454)
1% (6) 0% (0)
Washington DC (20001, 20002, 20008, 20012) 1% (5) 0% (0)
Maryland (20817, 20912, 21212) 0% (3) 0% (0)
Unspecified 0% (1) 0% (0)
8
Question 2 How long have you lived in your current ZIP Code?
All respondents Local long-term
respondents
Number of responses 784 238
Less than 1 year 3% (25) 0% (0)
1 to 2 years 5% (43) 0% (0)
More than 2 years 91% (716) 100% (238)
Question 3 BEFORE the markings were changed, how would you characterize the amount and speed of traffic on this part of Lawyers? Amount of traffic
All respondents Local long-term
respondents
Number of responses 761 229
Not excessive 72% (549) 81% (185)
Excessive 17% (133) 17% (39)
Don’t know 10% (79) 2% (5)
Traffic speed
All respondents Local long-term
respondents
Number of responses 759 232
Not excessive 35% (265) 41% (95)
Excessive 57% (429) 57% (132)
Don’t know 9% (65) 2% (5)
9
Question 4 How do you think traffic characteristics on Lawyers have changed as a result of the new lane configuration? Amount of car and truck traffic
All respondents Local long-term
respondents
Number of responses 776 237
Decreased 10% (79) 11% (26)
Stayed about the same 71% (548) 71% (169)
Increased 7% (56) 14% (32)
Don’t know 12% (93) 4% (10)
Traffic speed
All respondents Local long-term
respondents
Number of responses 776 236
Decreased 59% (454) 63% (148)
Stayed about the same 32% (245) 32% (76)
Increased 1% (10) 3% (6)
Don’t know 9% (67) 3% (6)
Number of pedestrians and bicyclists
All respondents Local long-term
respondents
Number of responses 775 235
Decreased 3% (21) 3% (7)
Stayed about the same 28% (216) 39% (93)
Increased 56% (436) 49% (116)
Don’t know 13% (102) 8% (19)

10
Question 5 How do you think safety was affected by the changes to the markings?
All respondents Local long-term
respondents
Number of responses 782 238
This part of Lawyers seems safer. 69% (539) 55% (130)
Safety on this part of Lawyers seems about the same. 12% (91) 18% (42)
This part of Lawyers seems less safe. 15% (116) 26% (62)
I’m not sure. 5% (36) 2% (4)
Question 6 Before the markings were changed, how often did you usually travel on this part of Lawyers Road? By car or truck
All respondents Local long-term
respondents
Number of responses 749 237
Many times per week 45% (335) 86% (204)
Once or twice a week 24% (180) 11% (25)
Once or twice a month 19% (140) 3% (7)
Only rarely 9% (69) 0% (1)
Never 3% (25) 0% (0)
11
On foot
All respondents Local long-term
respondents
Number of responses 630 205
Many times per week 1% (6) 3% (6)
Once or twice a week 2% (15) 6% (12)
Once or twice a month 3% (21) 8% (17)
Only rarely 15% (95) 24% (49)
Never 78% (493) 59% (121)
By bicycle
All respondents Local long-term
respondents
Number of responses 690 207
Many times per week 2% (14) 2% (5)
Once or twice a week 15% (104) 9% (19)
Once or twice a month 17% (115) 12% (25)
Only rarely 23% (156) 26% (53)
Never 44% (301) 51% (105)
By bus
All respondents Local long-term
respondents
Number of responses 627 204
Many times per week 1% (5) 1% (3)
Once or twice a week 0% (3) 1% (3)
Once or twice a month 1% (5) 1% (3)
Only rarely 5% (33) 9% (18)
Never 93% (581) 87% (177)

12
Question 7 Now that the markings have been changed, do you use Lawyers Road more or less often than before? By car or truck
All respondents Local long-term
respondents
Number of responses 746 237
More often 5% (37) 4% (9)
About the same as before 88% (656) 90% (214)
Less often 7% (53) 6% (14)
On foot
All respondents Local long-term
respondents
Number of responses 603 199
More often 9% (54) 14% (28)
About the same as before 83% (501) 77% (153)
Less often 8% (48) 9% (18)
By bicycle
All respondents Local long-term
respondents
Number of responses 673 200
More often 47% (318) 27% (54)
About the same as before 48% (321) 64% (128)
Less often 5% (34) 9% (18)
13
By bus
All respondents Local long-term
respondents
Number of responses 580 186
More often 1% (3) 0% (0)
About the same as before 88% (511) 89% (165)
Less often 11% (66) 11% (21)
Question 8 How do you think the changes on Lawyers Road have affected the amount of time it takes for trips you make by car or truck?
All respondents Local long-term
respondents
Number of responses 761 236
My trips take less time than before. 6% (48) 7% (16)
My trips take about the same amount of time as before. 63% (483) 60% (141)
My trips take more time than before. 22% (166) 33% (78)
I’m not sure 8% (64) 0% (1)
14
Question 9 Would you agree or disagree with the following statements? Overall, the changes have improved Lawyers Road.
All respondents Local long-term
respondents
Number of responses 758 234
Strongly agree 54% (408) 40% (94)
Agree 20% (151) 21% (48)
No opinion 3% (20) 2% (5)
Disagree 11% (80) 15% (34)
Strongly disagree 13% (99) 23% (53)
A similar project should be considered for other streets in Northern Virginia.
All respondents Local long-term
respondents
Number of responses 730 222
Strongly agree 57% (413) 37% (82)
Agree 15% (106) 19% (43)
No opinion 8% (58) 12% (27)
Disagree 8% (61) 11% (25)
Strongly disagree 13% (92) 20% (45)
15
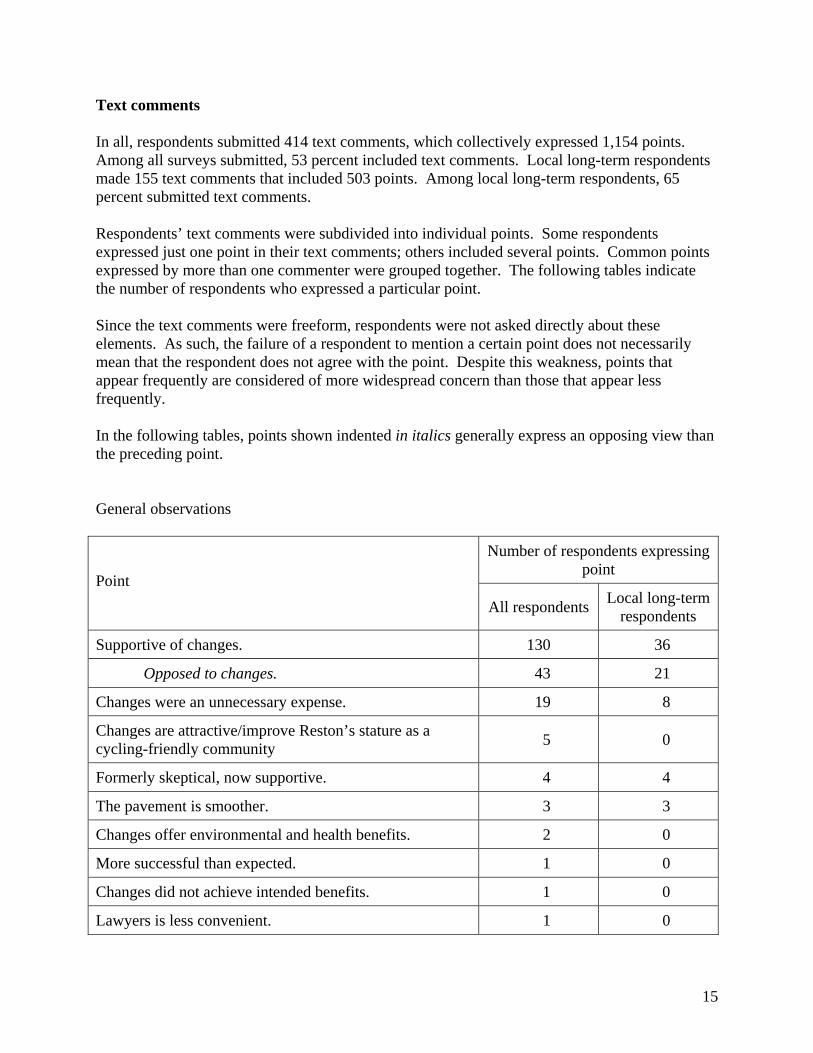
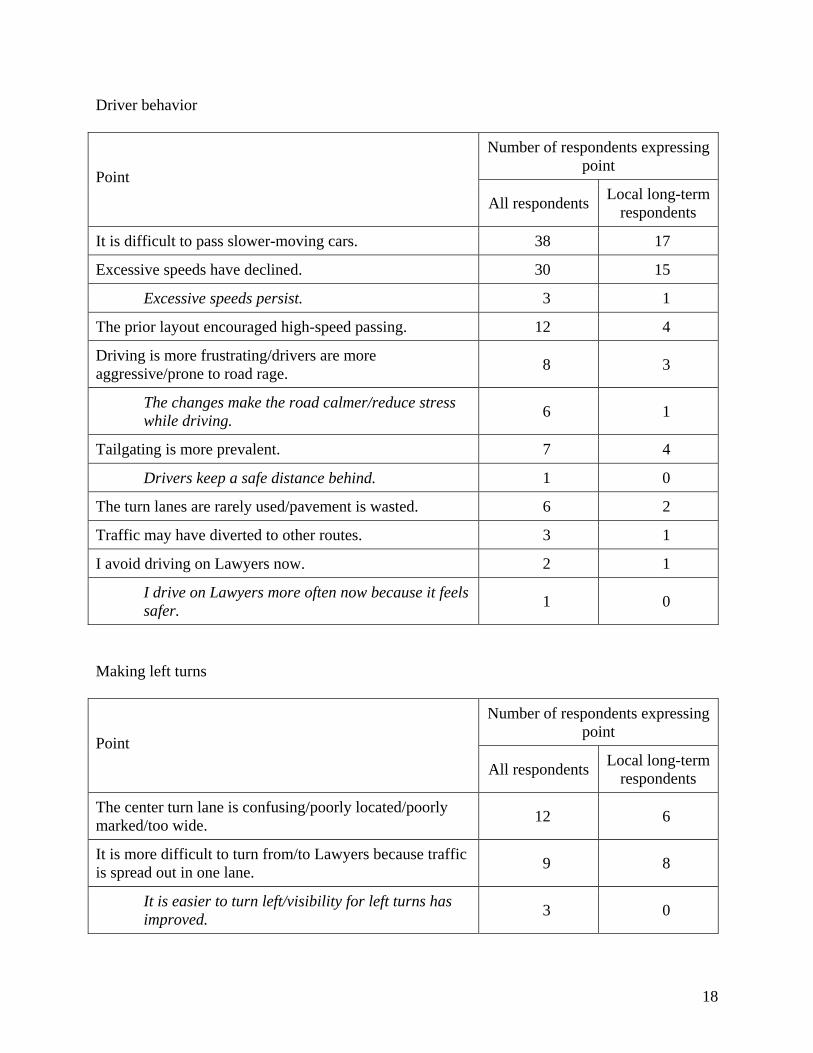
Text comments In all, respondents submitted 414 text comments, which collectively expressed 1,154 points. Among all surveys submitted, 53 percent included text comments. Local long-term respondents made 155 text comments that included 503 points. Among local long-term respondents, 65 percent submitted text comments. Respondents’ text comments were subdivided into individual points. Some respondents expressed just one point in their text comments; others included several points. Common points expressed by more than one commenter were grouped together. The following tables indicate the number of respondents who expressed a particular point. Since the text comments were freeform, respondents were not asked directly about these elements. As such, the failure of a respondent to mention a certain point does not necessarily mean that the respondent does not agree with the point. Despite this weakness, points that appear frequently are considered of more widespread concern than those that appear less frequently. In the following tables, points shown indented in italics generally express an opposing view than the preceding point. General observations
Number of respondents expressing point
Point
All respondents Local long-term
respondents
Supportive of changes. 130 36
Opposed to changes. 43 21
Changes were an unnecessary expense. 19 8
Changes are attractive/improve Reston’s stature as a cycling-friendly community
5 0
Formerly skeptical, now supportive. 4 4
The pavement is smoother. 3 3
Changes offer environmental and health benefits. 2 0
More successful than expected. 1 0
Changes did not achieve intended benefits. 1 0
Lawyers is less convenient. 1 0

16
Safety
Number of respondents expressing point
Point
All respondents Local long-term
respondents
The layout seems safer. 42 18
The new layout seems less safe. 25 15
The layout seems safer for bicyclists. 41 11
The layout seems less safe for bicyclists. 4 3
The turn lane seems safer. 11 10
The turn lane seems dangerous. 10 7
Encouraging cycling on Lawyers decreases safety. 6 4
The project reduced the chances of head-on crashes. 2 2
Removing the passing lane decreased safety. 1 1
Near-miss collisions have been observed. 1 0
Crashes were caused by impaired or inexperienced drivers, who won’t abide by the markings anyway.
1 0
Bunching up drivers tends to degrade safety. 1 0
The prior layout increased conflict between modes. 1 0
[Other safety observations] 3 2
Traffic conditions
Number of respondents expressing point
Point
All respondents Local long-term
respondents
Cars sometimes use the center turn lane to pass. 47 36
I have not seen cars passing in the center turn lane despite frequent use of Lawyers.
2 2
Travel times are longer. 12 3
17
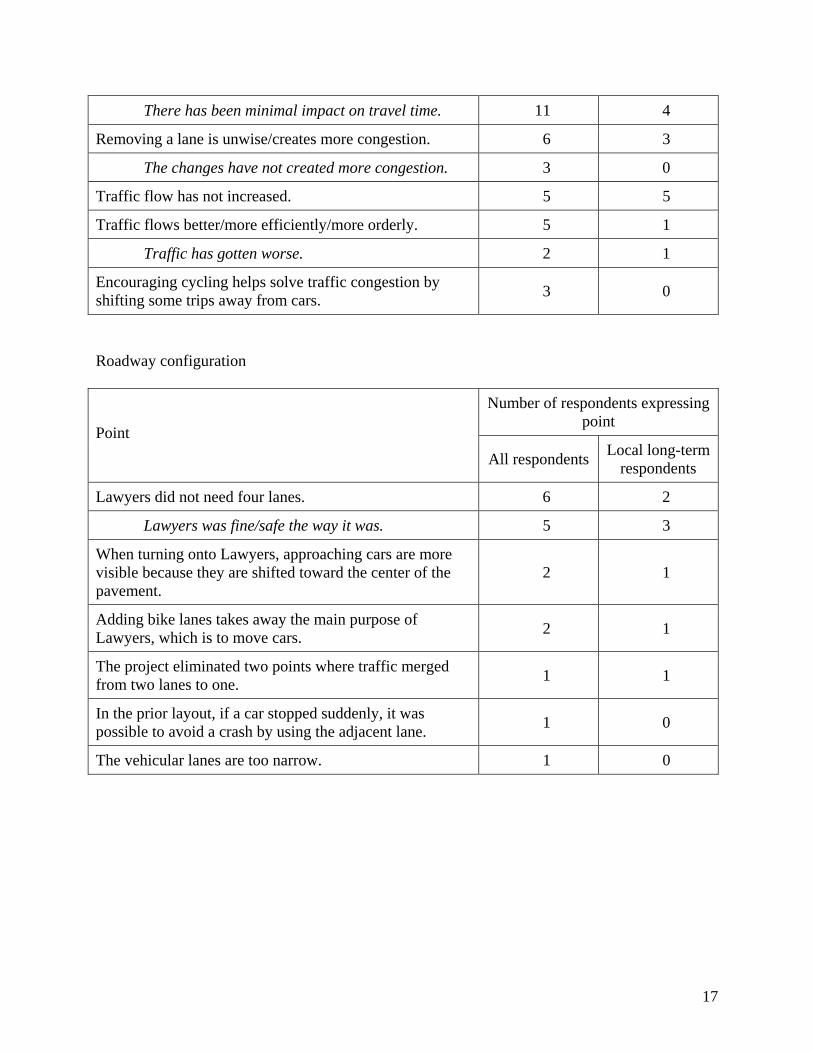
There has been minimal impact on travel time. 11 4
Removing a lane is unwise/creates more congestion. 6 3
The changes have not created more congestion. 3 0
Traffic flow has not increased. 5 5
Traffic flows better/more efficiently/more orderly. 5 1
Traffic has gotten worse. 2 1
Encouraging cycling helps solve traffic congestion by shifting some trips away from cars.
3 0
Roadway configuration
Number of respondents expressing point
Point
All respondents Local long-term
respondents
Lawyers did not need four lanes. 6 2
Lawyers was fine/safe the way it was. 5 3
When turning onto Lawyers, approaching cars are more visible because they are shifted toward the center of the pavement.
2 1
Adding bike lanes takes away the main purpose of Lawyers, which is to move cars.
2 1
The project eliminated two points where traffic merged from two lanes to one.
1 1
In the prior layout, if a car stopped suddenly, it was possible to avoid a crash by using the adjacent lane.
1 0
The vehicular lanes are too narrow. 1 0
18
Driver behavior
Number of respondents expressing point
Point
All respondents Local long-term
respondents
It is difficult to pass slower-moving cars. 38 17
Excessive speeds have declined. 30 15
Excessive speeds persist. 3 1
The prior layout encouraged high-speed passing. 12 4
Driving is more frustrating/drivers are more aggressive/prone to road rage.
8 3
The changes make the road calmer/reduce stress while driving.
6 1
Tailgating is more prevalent. 7 4
Drivers keep a safe distance behind. 1 0
The turn lanes are rarely used/pavement is wasted. 6 2
Traffic may have diverted to other routes. 3 1
I avoid driving on Lawyers now. 2 1
I drive on Lawyers more often now because it feels safer.
1 0
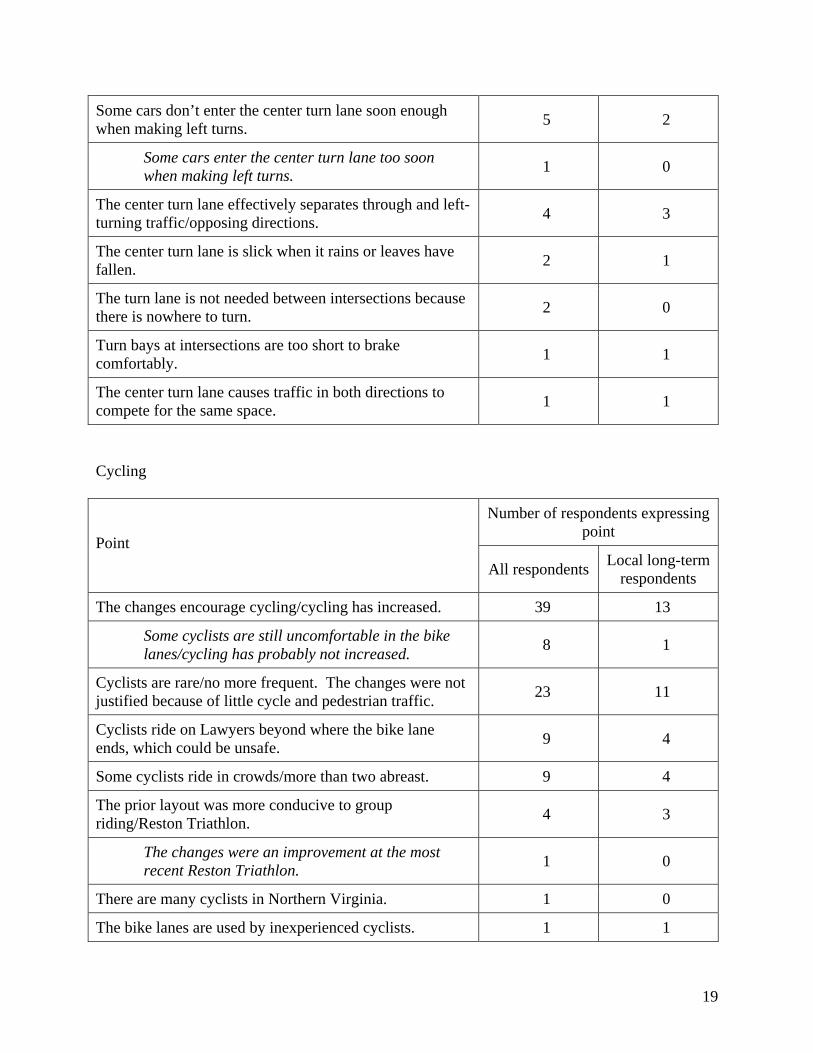
Making left turns
Number of respondents expressing point
Point
All respondents Local long-term
respondents
The center turn lane is confusing/poorly located/poorly marked/too wide.
12 6
It is more difficult to turn from/to Lawyers because traffic is spread out in one lane.
9 8
It is easier to turn left/visibility for left turns has improved.
3 0
19
Some cars don’t enter the center turn lane soon enough when making left turns.
5 2
Some cars enter the center turn lane too soon when making left turns.
1 0
The center turn lane effectively separates through and left-turning traffic/opposing directions.
4 3
The center turn lane is slick when it rains or leaves have fallen.
2 1
The turn lane is not needed between intersections because there is nowhere to turn.
2 0
Turn bays at intersections are too short to brake comfortably.
1 1
The center turn lane causes traffic in both directions to compete for the same space.
1 1
Cycling
Number of respondents expressing point
Point
All respondents Local long-term
respondents
The changes encourage cycling/cycling has increased. 39 13
Some cyclists are still uncomfortable in the bike lanes/cycling has probably not increased.
8 1
Cyclists are rare/no more frequent. The changes were not justified because of little cycle and pedestrian traffic.
23 11
Cyclists ride on Lawyers beyond where the bike lane ends, which could be unsafe.
9 4
Some cyclists ride in crowds/more than two abreast. 9 4
The prior layout was more conducive to group riding/Reston Triathlon.
4 3
The changes were an improvement at the most recent Reston Triathlon.
1 0
There are many cyclists in Northern Virginia. 1 0
The bike lanes are used by inexperienced cyclists. 1 1

20
Only bike enthusiasts/racers use the bike lanes. 2 2
Bike lanes
Number of respondents expressing point
Point
All respondents Local long-term
respondents
The bike lanes do not connect to other facilities/the termini of the bike lanes are difficult to negotiate.
62 16
The bike lanes connect to other cycling facilities. 2 0
The bike lanes need to be kept free of debris. 26 12
Bike lanes are not wide enough/not as wide as taking the lane in the prior layout.
9 6
The bike lane gives cyclists more room/drivers no longer have to weave around cyclists.
4 1
Bike lane pavement symbols need to be maintained. 1 0
Bike lanes are too short to be justified. 1 0
The project gives bike lanes a bad name because it was conceived to interfere with commuters.
1 0
Sharing the road
Number of respondents expressing point
Point
All respondents Local long-term
respondents
Some cyclists ride outside the bike lanes/too close to the travel lanes and they are difficult to pass.
32 24
Cars sometimes encroach into the bike lanes/fail to give enough room when passing.
2 0
Bike lanes were needed. 17 8
Bicycle traffic should not use Lawyers because it is unsafe/unfriendly.
6 3

21
Some cyclists fail to observe traffic laws/are not considerate of car traffic.
7 6
Cyclists already had enough bicycle facilities. 3 1
Bike lanes make cyclists more visible to drivers. 3 0
Bicycles calm traffic/reduce traffic disruption. 2 0
Most drivers are more considerate of cyclists. 2 0
Drivers are more hostile toward cyclists. 1 0
The bike lane creates a concern about collisions with cyclists when cars are turning right.
2 1
Some motorists are unsure of laws that pertain to cyclists. 1 1
Bike lanes make turns more difficult/dangerous. 1 0
Roadway curvature and trees limit visibility of cyclists. 1 0
Most roads can accommodate both bikes and cars. 1 0
Cyclists and pedestrians should use the paved path adjacent to Lawyers.
1 0
Buses
Number of respondents expressing point
Point
All respondents Local long-term
respondents
It is difficult to pass school/transit buses. 6 4
The bike lane is a helpful buffer between traffic and children waiting for the school bus.
2 2
In the prior layout, some cars would not stop for buses. 2 2
The changes seem safer for school buses. 1 1
The changes seem less safe for school buses. 1 0
The changes provide room for transit bus stops. 1 0
22
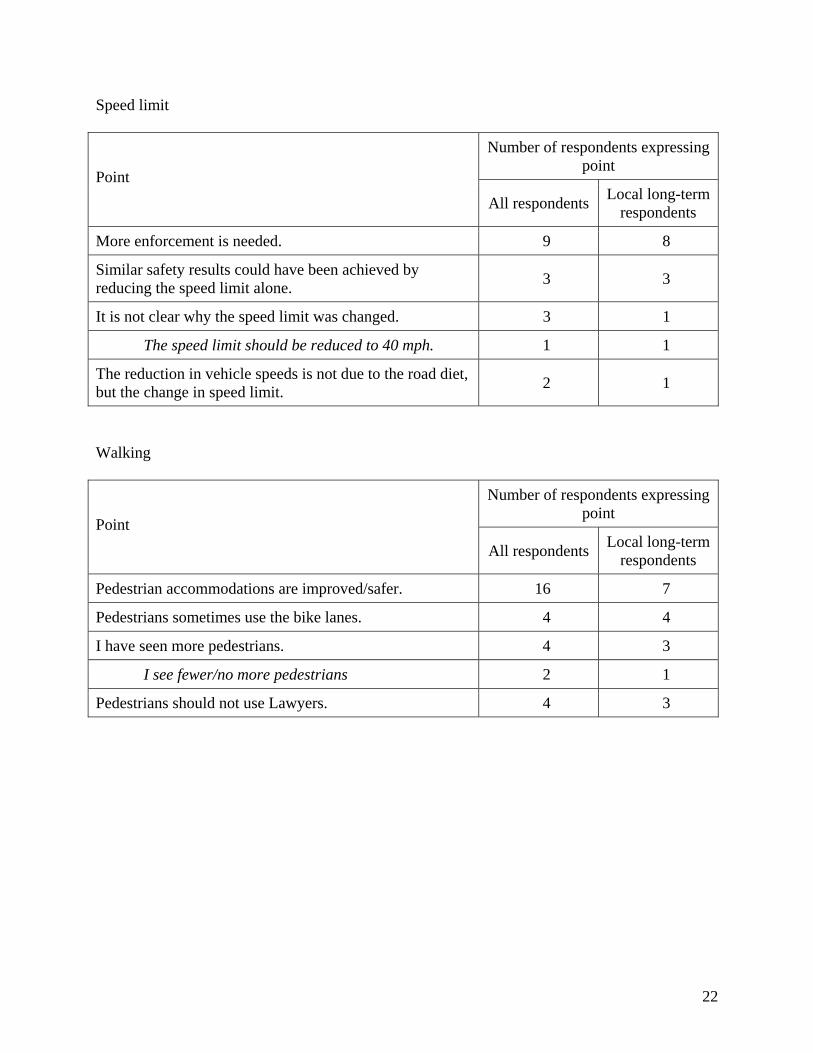
Speed limit
Number of respondents expressing point
Point
All respondents Local long-term
respondents
More enforcement is needed. 9 8
Similar safety results could have been achieved by reducing the speed limit alone.
3 3
It is not clear why the speed limit was changed. 3 1
The speed limit should be reduced to 40 mph. 1 1
The reduction in vehicle speeds is not due to the road diet, but the change in speed limit.
2 1
Walking
Number of respondents expressing point
Point
All respondents Local long-term
respondents
Pedestrian accommodations are improved/safer. 16 7
Pedestrians sometimes use the bike lanes. 4 4
I have seen more pedestrians. 4 3
I see fewer/no more pedestrians 2 1
Pedestrians should not use Lawyers. 4 3
23
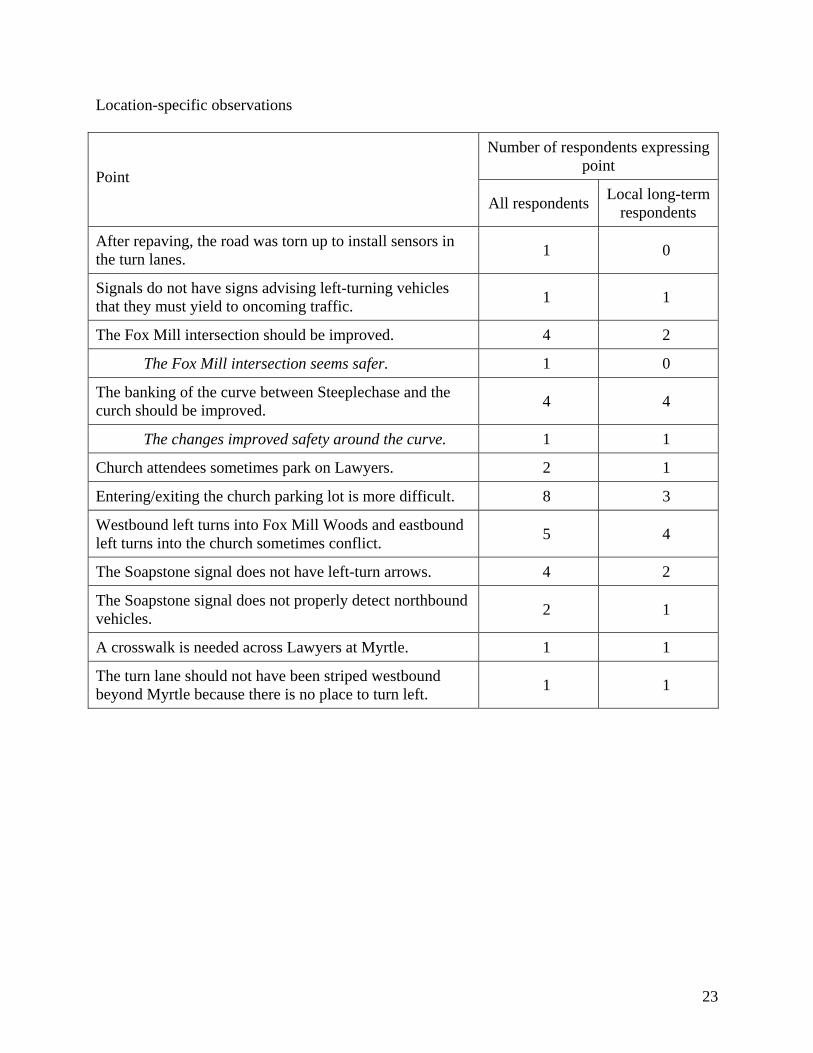
Location-specific observations
Number of respondents expressing point
Point
All respondents Local long-term
respondents
After repaving, the road was torn up to install sensors in the turn lanes.
1 0
Signals do not have signs advising left-turning vehicles that they must yield to oncoming traffic.
1 1
The Fox Mill intersection should be improved. 4 2
The Fox Mill intersection seems safer. 1 0
The banking of the curve between Steeplechase and the curch should be improved.
4 4
The changes improved safety around the curve. 1 1
Church attendees sometimes park on Lawyers. 2 1
Entering/exiting the church parking lot is more difficult. 8 3
Westbound left turns into Fox Mill Woods and eastbound left turns into the church sometimes conflict.
5 4
The Soapstone signal does not have left-turn arrows. 4 2
The Soapstone signal does not properly detect northbound vehicles.
2 1
A crosswalk is needed across Lawyers at Myrtle. 1 1
The turn lane should not have been striped westbound beyond Myrtle because there is no place to turn left.
1 1
24
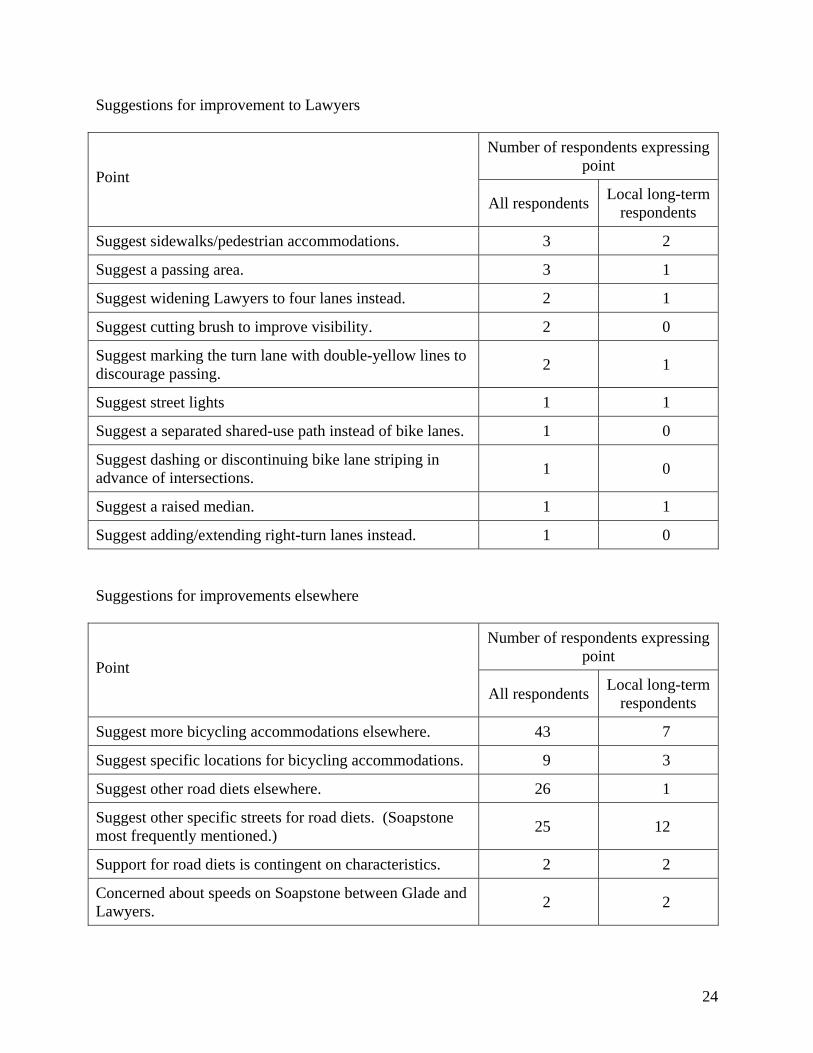
Suggestions for improvement to Lawyers
Number of respondents expressing point
Point
All respondents Local long-term
respondents
Suggest sidewalks/pedestrian accommodations. 3 2
Suggest a passing area. 3 1
Suggest widening Lawyers to four lanes instead. 2 1
Suggest cutting brush to improve visibility. 2 0
Suggest marking the turn lane with double-yellow lines to discourage passing.
2 1
Suggest street lights 1 1
Suggest a separated shared-use path instead of bike lanes. 1 0
Suggest dashing or discontinuing bike lane striping in advance of intersections.
1 0
Suggest a raised median. 1 1
Suggest adding/extending right-turn lanes instead. 1 0
Suggestions for improvements elsewhere
Number of respondents expressing point
Point
All respondents Local long-term
respondents
Suggest more bicycling accommodations elsewhere. 43 7
Suggest specific locations for bicycling accommodations. 9 3
Suggest other road diets elsewhere. 26 1
Suggest other specific streets for road diets. (Soapstone most frequently mentioned.)
25 12
Support for road diets is contingent on characteristics. 2 2
Concerned about speeds on Soapstone between Glade and Lawyers.
2 2

25
Other comments
Number of respondents expressing point
Point
All respondents Local long-term
respondents
Public outreach prior to the change did not reach me. 3 2
The survey was biased/should have asked other questions. 3 3
Comments about traffic control at other locations. 3 1
Speeds on Lawyers east of the road diet are too high. 2 2
More roadway capacity will be needed when the Metrorail station opens.
2 2
Unsure of the objective of the change. 1 0
[Other comments] 6 0