Embed Size (px)
Citation preview
Law EnforcementStops & SafetySubcommittee
Law EnforcementStops & SafetySubcommittee
2006 Staff Report2006 Staff Report

The opinions, findings, and conclusions expressed in this publication are those of the Law Enforcement Stops and Safety Subcommittee members and not necessarily those of their employing agencies, the International Association of Chiefs of Police, or the National Highway Traffic Safety Administration.
The work of the Law Enforcement Stops and Safety Subcommittee was made possible through the volunteer efforts of committee members and their staffs and through the financial support of the National Highway Traffic Safety Administration and the International Association of Chiefs of Police.
The LESS Subcommittee would like to recognize the special efforts of the Ohio State Highway Patrol’s Office of Strategic Services for editing and designing the Staff Report, and to acknowledge the contributions of the New York State Police, the Alabama Department of Public Safety, the Florida Highway Patrol, and the Ohio State Highway Patrol to the 2006 Staff Report.
AC K N OW L E D G E M E N TS

Introduction ........................................................................ 25
Results ................................................................................... 26
Conclusion ........................................................................... 30
Recommendations ............................................................ 30
O F F I C E R V I S I B I L I T Y
Introduction ........................................................................ 37
Methods ................................................................................ 37
Results ................................................................................... 39
Conclusion ........................................................................... 46
Recommendations ............................................................ 46
V E H I C L E P O S I T I O N I N G A N D O F F I C E R A P P ROAC H
Appendix A .......................................................................... 52
Appendix B .......................................................................... 55
Appendix C .......................................................................... 60
Appendix D .......................................................................... 61
A P P E N D I C E S
Introduction ........................................................................ 33
Methods and Results ........................................................ 34
Conclusion and Recommendations ........................... 35
V E H I C L E E M E RG E N C Y WA R N I N G S YS T E M S
Introduction ...........................................................................6
State Move-Over Laws ........................................................6
Move-Over Related Crashes .............................................9
Judicial Outcomes ............................................................. 14
Move-Over Observation Study .................................... 18
Conclusion and Recommendations ........................... 22
M OV E - OV E R L AWS
Table of Contents .................................................................2
Subcommittee Members ...................................................3
Foreword .................................................................................4
Afterword ............................................................................. 49
TABLE OF CONTENTS
2

L AW E N F O R C E M E N T S TO P S A N D S A F E T Y S U B CO M M I T T E E M E M B E R S
Chair, Highway Safety Committee Assistant Commissioner Earl M. Sweeney New Hampshire Department of Safety
Major Charles E. Andrews Alabama Department of Public Safety Chair, Highway Design/ Environment Group
Mr. Richard J. Ashton Highway Safety Committee Liaison International Association of Chiefs of Police
Captain Brigette E. Charles Strategic Services Executive Officer Ohio State Highway Patrol Major John F. Duignan Director, Bureau of Patrol Pennsylvania State Police
Deputy Commissioner Joseph A. Farrow California Highway Patrol Vice Chair, LESS Subcommittee Chair, Policies/Procedures Group Captain Raymond Fisher Colorado State Patrol
Mr. Brian Geraghty Director, Design Analysis Office Ford Motor Company
Mr. Erik S. Jorgensen Engineering, General Motors Police Vehicles Kerr Industries Limited Captain Gregory D. Kindle Assistant Commander, Field Operations Missouri State Highway Patrol Mr. William Santana Li Chairman and Chief Executive Officer Carbon Motors Corporation
Chair, LESS Subcommittee Colonel Paul D. McClellan Superintendent, Ohio State Highway Patrol
Mr. Charles E. Miller, III LEOKA Program Coordinator Federal Bureau of Investigation
Mr. Garrett Morford Chief, Enforcement and Justice Services National Highway Traffic Safety Administration
Mr. Keith Nelson Vice President, Government Sales Whelen Engineering Company, Inc.
Lieutenant Colonel M. Anthony Padilla Region Commander, Colorado State Patrol Chair, Research Group
Captain David Salmon Traffic Services New York State Police
Colonel Roger D. Stottlemyre Superintendent Missouri State Highway Patrol
Colonel Bryan Tuma Superintendent Nebraska State Patrol
Assistant Chief Brian A. Ursino Washington State Patrol
Lieutenant James D. Wells, Jr. Florida Highway Patrol Chair, Vehicle Group
Keith D. WilliamsHighway Safety SpecialistNational Highway Traffic Safety Administration
3

4
F O R E W O R D
The traffic stop continues to be at the forefront of law enforcement safety concerns. According to the Federal Bureau of Investigation, over the last 10 years, 120 officers have been accidentally struck and killed in the line of duty while investigating crashes, assisting motorists, directing traffic, and enforcing the nation’s laws. In 2004, the Law Enforcement Stops and Safety Subcommittee (LESSS) released a comprehensive report on the current state of knowledge regarding officer traffic stop safety issues. The 2004 LESSS Staff Study included a series of recommendations to advance a national agenda related to promoting officer safety. As a continuation of this effort, the 2006 Staff Report addresses in greater detail some of the issues identified in the group’s earlier work and again provides recommendations.
The 2006 Staff Report contains four chapters of original evaluation research by LESSS members: (1) move-over laws, (2) officer visibility, (3) vehicle emergency warning systems, and (4) vehicle positioning and officer approach. Subcommittee members note that the lack of research in these areas is alarming, as the frequency of close calls, near misses, and officer traffic stop deaths continue to make headlines nationwide. Moreover, while the number of measures being introduced to protect law enforcement officers continues to rise, there is little empirical evidence that the laws, policies, and technologies that are being initiated are having any impact on reducing crashes during traffic stops and other roadside contacts. The goal of the 2006 Staff Report is to begin building the body of evidence that is necessary to assure that the strategies being developed are having the desired outcome.
LESSS members chose the case study approach in this report as the primary means to address each traffic safety issue. The exploratory nature of the case study allows researchers to use multiple sources of information to provide a well-rounded understanding of the issues under examination. While the case study approach does not supply definitive answers, it does provide the necessary framework for others to begin rigorously examining officer safety issues within their own organizations. It is our desire that this report will encourage agencies to expand data collection efforts and increase research capabilities in order to shape public policy related to protecting officers in the line of duty.
The completion of the 2006 LESSS Staff Report coincides with the 2006 Drive Safely Campaign developed by the National Law Enforcement Officers Memorial Fund to decrease law enforcement fatalities on the road. It is our sincere belief that the work of LESSS will assist in this effort. The primary goal of this subcommittee is to assure that officer safety remains a national priority.

Chapter One:Move Over Laws
Ohio StateHighway Patrol

6
M O V E - O V E R L AW S
Par t 1 of 4: STATE MOVE - OVE R L AWS
BACKG ROU N D
A growing number of states are recognizing the need to enact laws that enforce safe driving behavior while passing stopped emergency vehicles. One in three states that currently has a move-over law in effect enacted it since 2005. These laws have often – and unfortunately – taken shape only following tragic incidences involving police, firefighters, and other emergency personnel conducting roadside activities.
The national “move over, slow down” movement, a relatively recent response to the risks associated with conducting traffic stops, gained critical momentum six years ago, led partly by the wife of a North Carolina state trooper whose partner
was killed in a roadside crash. “Families for Roadside Safety,” an advocacy group promoting stricter move-over legislation, reports that public education about the laws is scarce and that few states with laws actively advertise the statute or promote the associated fines or penalties.
Chapte r I NTRO DUC TIO N
No statistics are necessary to understand the senselessness and tragedy of officer deaths caused by passing motorists during traffic stops. States are increasingly turning to legislation as a fiscally responsible means to ensure the safety of law enforcement officers and other public safety personnel. Forty-one states and the Province of Ontario, Canada have enacted laws that require motorists to move over or slow down as they approach a stationary police vehicle with flashing lights. These laws vary in terms of their provisions and penalties but their underlying objective is the same, to protect lives. There is scant information on the effectiveness of move-over laws in preventing crashes. Likewise, little information is available on the effectiveness of media and other public relations campaigns necessary to promote public awareness and sensibility regarding the application of the laws in real-life driving and emergency situations. Additionally, more empirical data is needed on judicial outcomes as they relate to the efficacy of move-over laws.
The move-over chapter of the 2006 LESSS Staff Report explores four aspects of move-over laws: 1) similarities and differences among state laws; 2) characteristics of and conditions surrounding officer-involved traffic stop crashes; 3) judicial outcomes associated with the enforcement of move-over laws; and 4) the frequency of move-over violations and violator awareness of the law. The chapter concludes with a series of recommendations to assist the law enforcement community in improving officer safety during traffic stops.
Figure 1. Move-Over Sign in Florida.

7
Some law enforcement officials also doubt the laws’ effectiveness. Enforcement of move-over laws is often not practical without assigning officers in pairs so that one officer can monitor traffic while the other attends to the traffic stop. Anecdotal information from special enforcement campaigns would suggest that many non-fatal violations go unreported. State law enforcement agencies, such as Tennessee, Florida, and Ohio have employed special enforcement campaigns to promote public awareness of the law. While states’ move-over laws are uniform in their ultimate objective – to protect the safety of roadside emergency personnel – the means employed for achieving that objective vary widely by state.
This part of the move-over chapter provides information on move-over laws that have been enacted in the United States and the Province of Ontario, Canada. It attempts to identify some of the most critical components of these laws and to examine the varying approaches among states. Appendix A summarizes the most current information available on move-over laws by state.
Since move-over laws are relatively new, there is little research documenting the impact of such laws. The effort to compile state-level information into a single document in this chapter is an important step in creating a framework conducive to broader, national discussions regarding the role of move-over laws in officer safety.
M ETHO DS
State-level data on move-over laws was compiled primarily from online sources. Websites providing access to statutes for each state were used in combination with the results of a brief email survey among members of the State and Provincial Police Planning Officers Section of the International Association of Chiefs of Police. The survey asked members to verify detailed information on move-over laws in their respective states including: the date the law was enacted or became effective; fines and court costs; multipliers; driver license points; and types of vehicles covered by the law.
Figure 2. Move-Over Laws by State.

8
R ESULTS
States with Laws: To date, 41 states and the Province of Ontario have enacted move-over laws (see Appendix A). Fourteen states that currently have move-over laws in effect have enacted them since 2005. The states shaded in red on the map in Figure 2 have enacted move-over laws. Nine states currently do not have laws: Connecticut, Hawaii, Maryland, Massachusetts, Mississippi, Nebraska, New Jersey, New York, and Rhode Island. Only California has required a one-year impact assessment to prevent the law from being automatically repealed.
Vehicle Types Included in the Law: Only 10 states cover emergency, maintenance, and recovery vehicles in their move-over laws. Five states cover emergency and recovery vehicles, and one state covers emergency and maintenance vehicles. Laws in the remaining 25 states and the Province of Ontario cover emergency vehicles only. Emergency vehicles generally include police, fire, and ambulance.
Fines: All states with move-over laws have minimum fines established in statute ranging from $5 in Oklahoma to $500 in West Virginia and Washington. Maximum fines stipulated in law range from $50 in California and Iowa to $10,000 in Illinois and Indiana (see Appendix A). In some states, court costs associated with the citation are equal to or greater than the minimum fine. Fines are paid to the Attorney General’s Crimes Compensation Fund in Florida. In Minnesota, $10 is earmarked for the state law library. Michigan fines violators an additional $40 “Justice Assessment” fee. Maine requires a mandatory court appearance in addition to a fine, and Alaska requires a court appearance in cases of personal injury.
Jail Time and Community Service: Move-over laws in 13 of the 41 states (32 percent of the states with a move-over law) and the Province of Ontario carry the possibility of jail time for violators,
ranging from 10 days (Alabama and Colorado) to two years (Michigan). Jail time increases in some states when violations result in injury or death. Arkansas’s move-over law allows courts to require community service up to seven days.
Points: In 18 states (44 percent of states with a move-over law), points are assigned to motorists charged with a move-over violation. Tennessee assigns motorists six points for move-over violations, the most of any state (license suspended for 12 points in 24 months). Vermont assigns five points (license suspended for 10 points in 24 months). North Dakota assigns points only when a violation results in a crash. See Appendix A.
Multipliers: In 13 states (41 percent of states with a move-over law) and the Province of Ontario, move-over laws specifically address “multipliers.” Multipliers are additional penalties ( i.e., fines, jail time, license suspensions) for specific circumstances and are most commonly associated with move-over violations involving crashes that cause property damage, injuries, or fatalities. Some states increase penalties for multiple violations of the move-over law (Montana, Oklahoma), if alcohol is a factor (Pennsylvania, Illinois), or if the move-over violation occurs in a special traffic zone (Oregon, Florida). North Carolina’s law provides for court discretion in class one misdemeanor and felony move-over cases. Figure 3 lists the types of multipliers in move-over laws.
Move-Over Violations# of
States*
Causes Fatality 10
Causes Injury 13
Causes Non-injury Crash 9
Multiple/Subsequent Violations 5
Alcohol-Involved 2
Work or Special Traffic zone 3*Includes the Province of Ontario, Canada
Figure 3. Multipliers for Move-Over Violations.

9
Speed Requirements: Legislation in 32 states (78 percent of those with move-over laws) and the Province of Ontario requires motorists to “slow down,” in general terms, to a safe or reasonable speed. Arkansas and Minnesota have laws with no specific provisions for speed. The remaining seven states’ laws include specific speed provisions, such as slowing to less than 50 mph (Alabama); slowing to 25 mph (Louisiana and West Virginia); or slowing to 20 mph less than the posted speed limit (South Dakota, Texas, and Wyoming).
D ISCUSSIO N
To date, 41 states and the Province of Ontario have enacted move-over laws. Fines, jail time, and license suspensions are common penalties imposed by the laws. Although the number of states with move-over laws continues to grow, simply enacting the law may not be sufficient to positively affect safe driving behavior while passing stopped emergency vehicles. The following measures are recommended to improve awareness and increase compliance with move-over laws.
• Create, implement, and evaluate the impact of media campaigns and public outreach programs designed to inform the public
regarding the existence of and reasoning behind the state’s move-over law.
• Convene public task forces to review respective state laws with the intent of improving their effectiveness and positively influencing the long-term impact of move-over laws on the safety of officers and emergency personnel engaged in roadside activities.
• Continue to track the enactment of move-over laws on a state-by-state basis, including the collection of information on the fines and other penalties associated with a violation.
• Increase signage on busy roads informing motorists of the law and the penalties for noncompliance.
• Conduct periodic special enforcement campaigns aimed at both educating motorists and affecting subsequent driving behavior through punitive measures. These operations may provide a practical means to enforce the move-over law, considering the infrequency of opportunities to pursue violators while already engaged in traffic stops and other roadside activities.
Par t 2 of 4: MOVE - OVE R R E L ATE D CR ASH ES
BACKG ROU N D
There currently is no systematic collection of data related to move-over crashes in the state of Ohio or nationally. While some of the information on traffic-stop crashes in Ohio can be taken from the state-mandated uniform traffic crash report (OH-1) database, there is no straightforward way to accurately identify which crashes involve
violations of the state’s move-over law. Moreover, much of the information that would be needed to do a comprehensive analysis of officer-involved traffic stop crashes (including those associated with the state’s move-over law) is not included on the state’s crash form. To fully understand the conditions surrounding these crashes, a more robust, targeted data collection system is needed.
In early 2006, as part of a broader strategy to address several risk management issues confronting the Ohio State Highway Patrol

10
(OSHP), the agency created a patrol car crash database to consolidate historical and current financial, contextual, and environmental information on officer-involved traffic crashes from a variety of sources into a single database. There are currently 120 crash-related fields contained in the database, including information on the officers involved (age, sex, and years of service), as well as the circumstances surrounding the crashes (time of day, day of week, road conditions, and lighting conditions). While the patrol car crash database includes many of the items that are routinely collected on OH-1 crash reports, additional data that allow researchers to evaluate specific crash-causing circumstances are also included.
This part of the move-over chapter provides the results of an exploratory analysis of move-over related crashes detailed in the OSHP patrol car crash database. The purpose of collecting and analyzing the crash data is to form broad, state-level conclusions and recommendations regarding the circumstances surrounding officer-involved, move-over crashes. Variables included in the analysis were crash severity; crash date and time; lighting; road and weather conditions; alcohol-involvement; and officer demographics.
M ETHO DS
From January 1, 2001 to December 31, 2005, OSHP officers were involved in 1,924 traffic crashes. This includes three fatal, 242 injury, and 1,679 property-damage-only crashes. OSHP research staff applied a number of conditions to ensure only move-over crashes were included in the analysis. First, the officer had to be in the process of conducting a traffic stop when the patrol vehicle was struck (1,690 crashes eliminated). Second, patrol cars had to be parked with overhead lights activated at the time they were struck (93 crashes eliminated). Third, the
manner of collision had to be non-backing (36 crashes eliminated). Fourth, additional crashes were eliminated if the officer was at-fault, the crash was not between two vehicles, or the striking vehicle was an emergency, maintenance, or recovery vehicle (23 crashes eliminated). These conditions produced a final list of 82 move-over related traffic crashes over the five-year time period (see Figure 4).
It is important to note that move-over related crashes that did not result in damage to the patrol car, for example an officer was directly struck, are not included in the analysis. Further, weather and road conditions were not considered in compiling the final list of crashes, although both may play an important role in determining whether or not crashes are related to the state’s move-over law. Since the overall goal of LESSS is to increase officer roadside safety, researchers did not exclude crashes based solely on environmental conditions. However, any significant differences in the dataset based on weather and road conditions are noted.
R ESULTS
The following findings are based on an analysis of 82 move-over related OSHP patrol car crashes that occurred from 2001 to 2005 (see Appendix B). On average, OSHP experiences 16 move-over related patrol car crashes each year (see Figure 5).
Crash SeverityAll Patrol Car
CrashesMove-Over
Crashes# % # %
Fatal 3 <1% 2 2%Injury 242 13% 43 52%Property Damage Only 1,679 87% 37 45%
Total 1,924 100% 82 100%Source: OSHP Patrol Car Crash Database. Percentages are rounded.
Figure 4. Severity of All and Move-Over Related Patrol Car Crashes, 2001-2005.

11
Crash Severity: Of the 82 move-over related patrol car crashes, two were fatal (two percent), 43 were injury-related (52 percent) and 37 were property-damage-only (45 percent). While move-over crashes represent only four percent of all patrol car crashes, 52 percent of move-over related crashes involved an injury (compared to 13 percent of the total 1,924 patrol car crashes).
Crash Location: Forty-six percent of move-over-related patrol car crashes occurred in just 10 Ohio counties. Delaware, Ohio’s second fastest growing county in terms of vehicle miles traveled, accounted for six of the 82 crashes. Overall, about half of Ohio’s 88 counties experienced at least one move-over related patrol car crash during the last five years (41 counties). See Figure 6.
Almost two-thirds of move-over related patrol car crashes occurred on interstate routes (49 crashes), with the remaining crashes distributed across United States routes, State routes, and all other roadways (12, 11, and 10 crashes respectively). To examine the relationship between move-over related patrol car crashes and vehicle stop locations, OSHP research staff compared citation and crash locations by roadway type. The analysis found that only 28 percent of OSHP citations occurred on high-speed, high-volume interstate routes, yet 60 percent of move-over related patrol car crashes occurred on this type of road. It appears that officers are twice as likely to be involved in move-over related traffic crashes on interstate routes as would be expected based on their reported enforcement activity (see Figure 7).
Moreover, crashes that occurred on interstate routes were more severe than crashes on other road types (60 percent on interstates involved injury or death versus 41 percent on other road types).
In particular, Interstate 75 – the main north-south highway in the western portion of the state connecting the cities of Cincinnati, Dayton and Toledo – appears to be overrepresented in move-over related patrol car crashes. The route
Figure 7. OSHP Move-Over Citation and Crash Locations by Average Type.
LocationAverage
Citations**Move-Over
Crashes# % # %
Interstate Routes 133,597 28% 49 60%
United States Routes 112,565 23% 12 15%
Ohio State Routes 125,467 26% 11 13%
Other* 112,163 23% 10 12%
Total 483,792 100% 82 100%* Includes county, township and city roads.**OSHP HP-7 citation database, 2004-2005.
Figure 6. Move-Over Related Patrol Car Crashes by County, 2001-2005.
16 15 16
22
13
0
5
10
15
20
25
Num
ber o
f Cra
shes
2001 2002 2003 2004 2005
Figure 5. Number of Move-Over Related Patrol Car Crashes by Year, 2001-2005.

12
accounted for one in four move-over related patrol car crashes that occurred on interstates. Crashes on that route tended to be more severe than crashes on all other interstate routes (67 percent versus 58 percent respectively).
Month, Day, and Time of Crash: The majority of patrol car crashes occurred during the winter and spring months (46 percent and 26 percent respectively). Overall, one in five move-over related crashes occurred on a Monday (18 crashes), while Tuesday was the safest day of the week for officers (seven crashes).
One in three move-over related crashes occurred between 8:00 p.m. and 1:00 a.m. (28 crashes), making it the most dangerous time period for officers to conduct traffic stops. In fact, there were 55 percent more crashes during these evening hours than during similar daytime hours (8:00 a.m.-1:00 p.m.). For officers conducting traffic stops during peak travel times, the morning rush hour (6:00 a.m.-9:00 a.m.) appears to be slightly more dangerous than the evening rush hour (4:00 p.m.-7:00 p.m.). See Figure 8.
Primary Road Conditions: Of the 82 patrol car crashes, 27 were on dry roads (33 percent), 15 were on wet roads (18 percent), 21 occurred on
snow covered roads (26 percent) and 19 were on icy roads (23 percent). Overall, there was little difference in the severity of crashes based on road conditions, although the frequency of crashes on snow and ice covered roads is higher. Of the 45 move-over related crashes that involved injury or death, 23 occurred on dry/wet roads and 22 occurred on snow/ice covered roads.
Alcohol-Involvement: Alcohol was a factor in 19 of the 82 move-over crashes (23 percent). Only five percent of crashes that occurred on snow or ice covered roads involved alcohol versus 40 percent of crashes on dry or wet roads. Overall, 17 of the 19 alcohol-involved crashes were on dry or wet roads.
Move-over related patrol car crashes that involved alcohol (see Figure 9) were more severe (i.e., caused injury or death) than non-alcohol related crashes (68 percent and 51 percent respectively). As expected, the majority of alcohol-involved, move-over crashes occurred during nighttime hours (84 percent occurred from 8:00 p.m.-3:00 a.m.). Alcohol involvement was more prevalent in crashes on interstate routes than crashes on all other roadway types (27 percent versus 18 percent).
Lighting Conditions: Roughly half of all move-over related crashes (40 crashes) occurred on dark roadways. Of these crashes, over 70 percent occurred on unlit roads (29 crashes), including both fatal crashes.
10
3
1214
8 810
17
0
4
8
12
16
20
Num
ber o
f Cra
shes
12:00
-2:59
am
3:00-5
:59am
6:00-8
:59am
9:00-1
1:59am
12:00
-2:59
pm
3:00-5
:59pm
6:00-8
:59pm
9:00-1
1:59pm
Figure 8. Move-Over Related Patrol Car Crashes by Time of Day, 2001-2005.
Source: OSHP Patrol Car Crash Database.
Figure 9. Alcohol-Involvement in Move-Over Related Patrol Car Crashes, 2001-2005.
Crash Severity Alcohol No Alcohol# % # %
Fatal 1 5% 1 2%Injury 12 63% 31 49%PDO 6 32% 31 49%Total 19 100% 63 100%

13
Road Contour: Three in four move-over related crashes occurred on straight roads (65 crashes), with the majority of these occurring on level roads (45 crashes). Furthermore, nearly 90 percent of move-over related crashes involving alcohol occurred on straight roads.
Weather played a role in move-over crashes based on the contour of the road. Of the 17 move-over related crashes that occurred on curved roads (graded and non-graded), 65 percent were related to severe road conditions (snow or ice covered roads).
Location of Impact: Nearly half of all officer vehicles were struck in the rear (39 crashes). Twenty-three percent of move-over crashes were sideswipe (same direction) and 22 percent were angle. Five of the six crashes that were classified as “head-on” or “sideswipe, opposite direction” involved severe weather conditions.
Primary Offense: The primary offenses listed on move-over related crash reports were Failure-to-Control and Assured-Clear-Distance (38 and 23 crashes respectively). Move-over violations were rarely the primary violation cited, perhaps because move-over violations often occur in conjunction with more familiar violations that carry stricter penalties in Ohio.
Officer Demographics: The average age of officers involved in move-over related crashes was 31, and ranged from 21 to 51. Officers averaged nearly seven years of service; although a quarter of move-over related crashes involved officers with fewer than two years of service. As Figure 10 shows, officers with fewer than two years of experience were involved in 33 percent more move-over related traffic crashes than officers with two to four years of experience, and accounted for at least twice as many crashes as any other two-year age group. It is important to note that 70 percent of crashes involving the
least experienced officers (less than two years of service) occurred on severe road conditions (snow or ice covered roads).
D ISCUSSIO N
The analysis of move-over related traffic crashes involving OSHP officers provides important information that can help guide future research and provides valuable insight into law enforcement practices related to traffic stops and other roadside contacts. The methodology used in this analysis provides useable data on a broad range of crash characteristics. Similar studies conducted by additional law enforcement agencies would provide a larger body of crash data and more definitive conclusions.
While only a small percentage of officer-involved crashes are move-over related, they constitute a disproportionate number of serious traffic crashes. In fact, 55 percent of officer-involved, move-over related crashes were considered serious (injury or fatal). This is four times the rate for all OSHP patrol car crashes. The severity of crashes highlights the importance of move-over laws for law enforcement.
Nearly half of all OSHP move-over related crashes
20
15
10 107 8
12
0
4
8
12
16
20
Num
ber o
f Cra
shes
Lessthan 2
2 to 4 4 to 6 6 to 8 8 to10
10 to12
12 ormore
Year of Service
Figure 10. Move-Over Related Patrol Car Crashes by Officer Years of Service, 2001-2005.

14
occurred in just 10 Ohio counties. Over 60 percent occurred on high-speed, high-volume interstates. This is nearly twice the rate as would be expected based on officer enforcement activity. Moreover, crashes on interstates tended to be more severe and were more likely to involve alcohol than crashes on all other road types.
Although this analysis of patrol car crashes included only OSHP data, the findings may help other agencies identify possible training and policy issues. Specifically, additional training is indicated for officers with less than two years of service. These officers were involved in a larger number of move-over crashes, especially during severe weather conditions.
Findings also show that one in four move-over related crashes involved impaired drivers. These alcohol-involved traffic crashes tended to be more severe than non-alcohol related crashes. In particular, officers need to be mindful of impaired drivers when conducting late night traffic stops on high speed interstates. Over 50 percent of all move-over related crashes involving alcohol occurred on interstate routes between 8:00 p.m.
and 3:00 a.m.
In summary, limited research on the risks associated with conducting traffic stops impedes the ability of agencies to adequately protect the nation’s law enforcement officers. Recommendations regarding future research on move-over related traffic crashes include:
• Develop a national research agenda to assess the impact of move-laws on officer-involved crashes.
• Create a nationwide database to track officer-involved traffic stop crashes. Additional data would better inform policy and legislation and help to manage risks related to officer safety.
• The nationwide traffic stop crash database should include a data field that specifically identifies move-over related crashes and tracks cases through the court system to final disposition.
Par t 3 of 4: J U D ICIAL OUTCOM ES
BACKG ROU N D
Ohio’s move-over law was passed in 1999, and the failure to “move over” for public safety vehicles with overhead lights activated became a minor misdemeanor. From 2000 to 2005, the Ohio State Highway Patrol (OSHP) issued 9,148 citations for move-over violations. On average, OSHP officers issue 20 move-over citations per year in each of Ohio’s 88 counties – approximately two per county per month. The number of OSHP citations by county varies dramatically, from zero in Morgan County to 564 in Greene County.
Aside from basic OSHP citation information, little is known about move-over violations across the state. There are no statewide data available on the number of citations written by police agencies other than OSHP. Additionally, no information has been collected on a statewide basis regarding how move-over cases have been adjudicated.
This part of the move-over chapter presents the findings of an exploratory study conducted by OSHP research staff of 1,561 cases in 39 municipal courts in Ohio. Variables included in the analysis were the enforcing police agency; the defendants’ pleas; additional violations; court rulings; fines and costs to defendants; and demographic characteristics of move-over violators.
15
M ETHO DS
The process for collecting case and outcome data involved first identifying all municipal courts across Ohio (approximately 118 courts). Municipal courts are trial courts with limited jurisdiction over criminal misdemeanor offenses, traffic violations, municipal code ordinance infractions and civil ordinance actions. Only municipal courts with the ability to query an on-line case management system were included in the study (45 courts). The final sample of 45 municipal courts was distributed across the state, and included a diverse selection of small, rural to large, urban areas.
Following the court selection process, research staff contacted each of the 45 courts and requested all case numbers for 2004, 2005, and 2006 that included an infraction against Ohio Revised Code 4511.213, or an equivalent municipal code indicating a move-over violation. Because many of the courts do not retain full-time employees capable of querying the local data in the necessary manner, obtaining case numbers proved to be an unusual and somewhat challenging request. Case numbers, provided by courts, were then used by OSHP to collect key data using the courts’ online docket search function.
Despite the challenges, most of the courts were able to complete the request; 39 of the 45 courts contacted provided the requested information (87 percent response rate). A total of 1,561 case records were collected for the study. The number of move-over cases per court varied widely, from one record in Coshocton County to 219 records in Clermont County. Locations for the 39
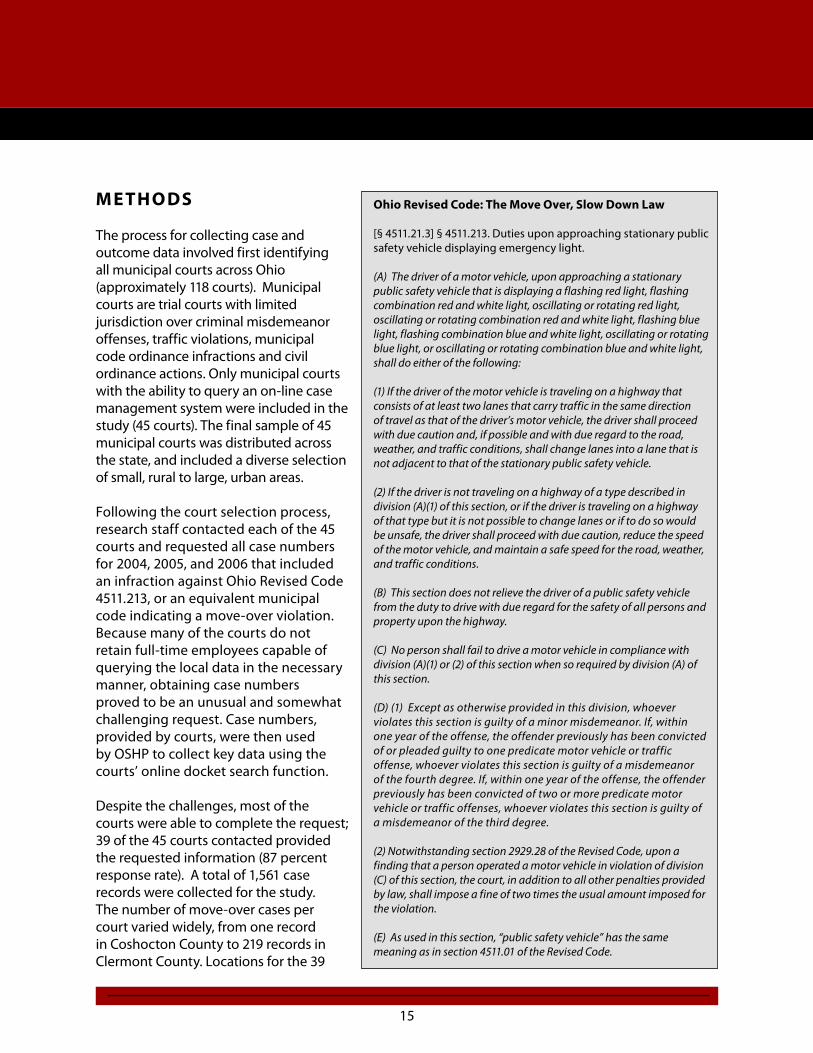
Ohio Revised Code: The Move Over, Slow Down Law
[§ 4511.21.3] § 4511.213. Duties upon approaching stationary public safety vehicle displaying emergency light.
(A) The driver of a motor vehicle, upon approaching a stationary public safety vehicle that is displaying a flashing red light, flashing combination red and white light, oscillating or rotating red light, oscillating or rotating combination red and white light, flashing blue light, flashing combination blue and white light, oscillating or rotating blue light, or oscillating or rotating combination blue and white light, shall do either of the following: (1) If the driver of the motor vehicle is traveling on a highway that consists of at least two lanes that carry traffic in the same direction of travel as that of the driver’s motor vehicle, the driver shall proceed with due caution and, if possible and with due regard to the road, weather, and traffic conditions, shall change lanes into a lane that is not adjacent to that of the stationary public safety vehicle. (2) If the driver is not traveling on a highway of a type described in division (A)(1) of this section, or if the driver is traveling on a highway of that type but it is not possible to change lanes or if to do so would be unsafe, the driver shall proceed with due caution, reduce the speed of the motor vehicle, and maintain a safe speed for the road, weather, and traffic conditions. (B) This section does not relieve the driver of a public safety vehicle from the duty to drive with due regard for the safety of all persons and property upon the highway. (C) No person shall fail to drive a motor vehicle in compliance with division (A)(1) or (2) of this section when so required by division (A) of this section. (D) (1) Except as otherwise provided in this division, whoever violates this section is guilty of a minor misdemeanor. If, within one year of the offense, the offender previously has been convicted of or pleaded guilty to one predicate motor vehicle or traffic offense, whoever violates this section is guilty of a misdemeanor of the fourth degree. If, within one year of the offense, the offender previously has been convicted of two or more predicate motor vehicle or traffic offenses, whoever violates this section is guilty of a misdemeanor of the third degree. (2) Notwithstanding section 2929.28 of the Revised Code, upon a finding that a person operated a motor vehicle in violation of division (C) of this section, the court, in addition to all other penalties provided by law, shall impose a fine of two times the usual amount imposed for the violation. (E) As used in this section, “public safety vehicle” has the same meaning as in section 4511.01 of the Revised Code.

16
municipal courts that provided case numbers are shown in Figure 11.
R ESULTS
The following findings are based on an analysis of 1,561 municipal court cases involving a move-over violation in 2004, 2005, and 2006 (through April). A table summarizing results is included in Appendix C.
Enforcing Agency: A total of 576 move-over cases were processed in 2004, 648 cases in 2005, and 337 cases through April, 2006. OSHP was the enforcing agency in three-quarters (75 percent)
of move-over citations, followed by sheriff departments (11 percent), city police departments (11 percent), and township police departments (3 percent). See Figure 12.
Gender: Males were nearly twice as likely as females to be cited for move-over violations (65 percent compared to 35 percent).
Age: Thirty-eight percent of offenders were between the ages of 21 and 35; an additional 30 percent were between the ages of 36 and 50. Figure 13 shows the distribution of offenders by age group.
Race: Race was not indicated in 50 percent of the court cases. Eighty-six percent of move-over violators for whom race was indicated were Caucasian. Twelve percent were African-American, and the remaining two percent were either Hispanic or Asian.
State of Residence: Most of the citations (87 percent) were issued to Ohio residents. The remaining 13 percent were issued to residents of other states or Canadian provinces.
Additional Violations: The majority of motorists who were cited for move-over violations received no additional citations (85 percent). Figure 14 shows the frequency of additional violations by type. Alcohol-related charges represent the most frequent type of additional violation.
Figure 11. Locations of Municipal Courts that Provided Move-Over Case Information.
Figure 12. Enforcing Agency.
11%
11%
3%
75%
OSHP
Sheriff
City PD
Twp. PD
Figure 13. Number of Move-Over Violators by Age.
100
590
466
306
990
100
200
300
400
500
600
16-20 21-35 36-50 51-65 >65

17
Thirty-nine percent of drivers who were cited for an additional violation were cited for impaired driving (OVI). Nearly two-thirds (63 percent) of the OVI citations that accompanied move-over violations were among 21- to 35-year-olds. Safety belt violations (35 percent) and driving under suspension (DUS) or without a valid operator license (34 percent) were also frequently cited. Less frequent additional violations included plates or registration violations (12 percent), speeding (12 percent), reckless operation (Rkls Op) or failure-to-control (10 percent), and vehicle-related violations (5 percent). Over half (54 percent) of motorists who were charged with an additional infraction were 30 years of age or younger.
Pleas and Rulings: Most move-over citations were not contested (86 percent). Of the 219 (14 percent) who contested the charge (i.e., entered an original plea of “not guilty”), only 15 percent were found “not guilty” or had the charges dismissed. An additional nine percent of move-over charges were dismissed, primarily because more serious charges were prosecuted, such as OVI. Only one percent of all 1,561 cases resulted in a “not guilty” ruling.
Fines and Court Costs: Both the fines and court costs for move-over infractions varied widely by municipal court, and occasionally even among cases within the same court. Fines ranged from
$10 to $350. Court costs ranged from $10 up to $250. In Ohio, the average overall combined fine and court cost was $113 (median cost $104).For non-contested move-over citations, the average “waiver” was $50 for the fine (median cost $28) and $62 in court costs (median cost $65). Figure 15 provides information on the range of costs (fines plus court costs) related to move-over cases (i.e., waiver cases with no additional citations). About a half of the non-contested citations cost violators between $76 and $125 in fines and court costs; about one-third paid over $125; and 13 percent paid under $75.
D ISCUSSIO N
The exploratory nature of the analysis of Ohio judicial outcomes provides a number of findings that may help to guide future research and law enforcement activities related to move-over violations in Ohio as well as across the United States and Canada. The most notable findings are:
• A substantial increase in move-over enforcement in 2006, as compared to 2004 and 2005
• 75 percent of citations were issued by OSHP officers
• 39 percent of move-over violators who had additional violations were also cited for OVI
Figure 15. Distribution of Move-Over Penalties, in Dollars.
7%6%
5%
18%
8%
21%
35%
$10-50
$51-75
$76-100
$101-125
$126-150
$151-175
>$175
Figure 14. Additional Violations by Type.
35%
39%
4%
5%
10%
12%
12%
34%
0 10 20 30 40
Other
Vehicle
Rkls Op
Speed
Plates
DUS
Belt
DUIOVI
Belt
DUS
Plates
Speed
RKls Op
Vehicle
Other
18
• 38 percent of move-over violators were between the ages of 21-35 and 65 percent were male
• 86 percent of citations were not contested, and one percent of all cases resulted in a “not guilty” finding
• The average fine, including court costs, was $113 (median cost $104).
The data obtained from the limited sample of 1,561 move-over court cases provides a useful framework for beginning to understand how Ohio’s law is being enforced, although the outcomes of a substantial number of municipal courts remain unknown. The 39 courts in the study may differ in their processes and decisions from those courts that do not have online docket search capabilities. Moreover, we currently have no knowledge regarding whether move-over violations have been processed through any of Ohio’s approximately 333 mayors’ courts.
Based on the findings of this analysis, several important recommendations regarding move-over laws are provided as part of a comprehensive
effort to improve officer safety during traffic stops and other roadside contacts:
• Expand the scope of the current study to include the remaining municipal courts as well as mayor’s courts across Ohio. Additionally, future research should include a more detailed examination of the relationships between move-over violations and other types of violations.
• Conduct similar analyses of move-over laws in other states in order to facilitate comparisons of court decisions and penalties.
• Develop a cooperative, statewide electronic traffic citation system among law enforcement agencies and courts in order to significantly enhance the ability to conduct research and to inform policy regarding move-over and other traffic-related violations. More complete, accurate, and available citation information and court records would facilitate more comprehensive statewide analyses.
Par t 4 of 4: MOVE - OVE R O BSE RVATIO N STU DY
BACKG ROU N D
Driving behaviors that present a significant threat on Ohio roadways are frequently targeted through special enforcement campaigns by the Ohio State Highway Patrol (OSHP). Problem Behavior Identification (PBI) programs are used to increase the public’s awareness of illegal or unsafe driving behaviors in order to reduce traffic crashes. OSHP research staff observed one such campaign during a PBI conducted in Stark County aimed at promoting awareness of the state’s move-over law.
Observation data were collected by research staff during OSHP traffic stops on a 7.22-mile segment
of U.S. Route 30 running East-West between State Route 21 and Interstate 77 (see Figure 16). U.S. Route 30 serves as an expressway between the cities of Massillon and Canton and supports a high volume of traffic. Therefore, the PBI was conducted on a weekday from 10:00 a.m. to 1:30 p.m., when traffic was light to moderate. While traffic flow during the PBI remained steady, it was light enough to provide motorists ample opportunity to move over upon recognizing stopped emergency vehicles with flashing lights.
The segment of U.S. Route 30 utilized for the PBI is a four-lane divided highway, with a grass median. The travel lanes and outside shoulders are all 12 feet wide, and the posted speed limit for the roadway is 65 mph for passenger cars and 55 mph for commercial vehicles. Data collection points were located where oncoming traffic could

19
be monitored from a distance of at least one-half mile. Therefore, straight portions of roadway were used and curved- or graded- contour road segments were avoided. There were no adverse weather conditions during the observation period; visibility was clear and the road pavement was dry.
Part four of the move-over chapter presents findings from the observation of move-over violations during the three and one-half hour special enforcement campaign. Data were collected to determine:
• The frequency and severity with which Ohio’s move-over law is violated
• The demographic characteristics of move-over violators (based on violator information collected during traffic stops)
• The violators’ awareness of Ohio’s move-over law.
M ETHO DS
Only the most blatant move-over violations observed were included in the analysis. Either of the following two scenarios was viewed as constituting a move-over violation:
1. The driver clearly had sufficient opportunity to move over. The adjacent lane was free of other vehicles, but the driver did not move over or slow down to a safe speed upon approaching the stopped police vehicle displaying flashing emergency lights.
2. The driver did not have the opportunity to move over because of traffic in the adjacent lane, but clearly failed to slow down to a safe speed.
During routine motor carrier traffic stops and inspections, troopers participating in the PBI situated their patrol cars behind the Motor Carrier Enforcement (MCE) vehicles. Both vehicles’ lights were activated. Troopers identified drivers who failed to move over (when possible) or slow down to a safe speed when passing the patrol car and MCE vehicles. The offending vehicle was stopped and troopers issued a citation or warning to the driver. A total of three Motor Carrier Enforcement inspectors (each with a vehicle) and three troopers and one sergeant (each with a vehicle) contributed enforcement activity to the PBI.
Four OSHP researchers were positioned in the
Figure 16. US Route 30 Between St Rte 21 and I-77.
Massi l lon Canton

20
MCE and patrol vehicles to collect data during the observation period. Their primary functions were to measure the frequency and severity of move-over violations while the motor carrier inspection was in progress. This was accomplished through the following means:
a. The total number of passing vehicles (traffic volume), as well as the total number of blatant violators observed, were recorded using hand-held counting devices
b. The duration of each motor carrier inspection stop was recorded
c. Oncoming traffic was videotaped through the rear window of an MCE vehicle.
As each motor carrier inspection was concluded, another was initiated at a new location within the 7.22-mile segment of U.S. Route 30. Traffic volume and number of observed violators were recorded only while MCE and police vehicle lights were activated, that is, while a commercial motor vehicle inspection was in progress.
To gauge violators’ awareness of Ohio’s move-over law, troopers asked violators two questions during the traffic stops. The questions were intended to provide members of law enforcement a better understanding of violators’ reasons for failing to obey the move-over law.
1. “Do you know why I pulled you over?”a) Following a “no” response officers asked,
“Were you aware that you are required to slow down and move over for any public safety vehicle, such as a police vehicle or ambulance that is pulled over to the side of the road with its lights activated?”
b) Following a “yes” response officers asked, “Why do you think I pulled you over?”
2. “Why didn’t you move over?”
Copies of citations and warnings issued during the PBI were used to obtain the demographic
characteristics of violators, including age, sex, and race. Traffic stops and enforcement actions were recorded with in-car video cameras according to standard OSHP operating procedures. Video footage was analyzed by OSHP research staff for other potentially relevant information, such as the total number of passengers in the vehicle and drivers’ reactions to the traffic stop and/or warning or citation.
R ESULTS
Analysis of the observation data collected during the move-over PBI produced the following results:
Frequency and severity of violations
• Researchers counted 1,737 passing vehicles during a total of 120 minutes of active data collection time; that is, the time elapsed during motor carrier inspections while lights were activated. An average of 15 vehicles per minute passed observation points.
• Of the 1,737 passing vehicles, 102 were observed to be in blatant violation of the move-over law, failing to move over (despite reasonable opportunity to do so) and/or failing to slow down when traffic prevented them from moving to an adjacent lane. The 102 observed violations represent six percent of the total number of passing vehicles.
• Nearly 13 violations were observed for every 15 minutes of active data collection time, or 51 move-over violations per hour.
• Troopers made a total of 26 traffic stops for move-over violations, during which 11 citations and 15 warnings were issued.
Demographic characteristics of violators

21
• Over two-thirds (69 percent) of violators were male.
• Nearly all (92 percent) of the motorists stopped for failing to move over were Caucasian.
• The age of move-over violators ranged widely. The average age of violators was 48. Fifty percent of violators were between 36 and 55 years old, 31 percent were 56 and older, and 19 percent were between 16 and 35.
• The majority of violators were drivers of passenger vehicles such as cars, SUVs, vans, and pickups. Drivers of large commercial trucks rarely violated the law during the observation period.
Violators’ awareness of law
• 100 percent of violators reported that they did not know why they were pulled over by the trooper.
• 85 percent of violators reported they were not aware of the law.
• 15 percent of violators reported that they were aware of the law, but indicated they forgot about the law, misunderstood the law and thought they were only required to slow down and not move over, or offered no reason for non-compliance.
D ISCUSSIO N
During the observation study, when given the opportunity to move over and slow down prior to passing the stopped emergency vehicle with lights activated, most motorists did so. However, a substantial number of drivers failed to comply
with the law, creating a potentially hazardous situation for law enforcement and inspection officials conducting business at the roadside. Fifty-one move-over violations were recorded per hour of observation.It is unclear whether the motorists who did comply with Ohio’s move-over law were aware of the law’s existence or whether their decision to move over was based on driver courtesy, an appreciation of the potential danger, or that they simply followed other cars in moving to the adjacent lane of traffic. Commercial truck drivers were observed to move over with greater frequency than drivers of passenger vehicles. Drivers of passenger vehicles comprised the overwhelming majority of move-over violators.
The majority of move-over violators stopped during the campaign were Caucasian and male. No particular age group was observed to commit significantly more move-over violations than other age groups. While younger drivers (16-35 years old) committed the fewest move-over violations, the violations were distributed widely across age groups.
These findings illustrate an ongoing challenge for law enforcement. Despite the fact that Ohio’s move-over law has been in effect since 1999, many drivers are still unaware of the law’s existence or they fail to take it seriously. Eighty-five percent of violators reported they were not aware of the law. To improve officer roadside safety through increased compliance with move-over laws, the following measures are recommended:
• Increase driver awareness of move-over laws. Drivers must be made aware 1) that the law is in effect; 2) that the law requires them to move to an adjacent lane, away from emergency vehicles conducting roadside activities if they have the opportunity to do

22
so (i.e., just slowing down is not sufficiently complying with the law); 3) officers across the state are enforcing the law; and 4) serious penalties (e.g., fines and driver license points) may result from failing to obey the law. Public awareness may be increased through a variety of modern and traditional means, including public service announcements on television, in print, and on websites. Increased signage on major roadways informing drivers of move-over laws could also be an effective method for increasing awareness. Public and private entities could partner on public campaigns to improve compliance.
• Increase move-over enforcement. Enforcement can also be an effective strategy for increasing awareness of move-over laws, in addition to being a punitive measure. However, there
are some unique challenges to enforcing the move-over law. Because officers are most often in the process of conducting a traffic stop or assisting a motorist when a move-over violation occurs, they rarely have the opportunity to pursue even the most blatant of violators. Therefore, opportunities to either penalize or educate violators are infrequent. As a result, the illegal behavior goes unchecked, and the violator may be likely to commit the same offense in the future. One solution for increasing enforcement may be to conduct special enforcement campaigns similar to the one observed for this study. Occasional, focused operations in which officers are available for pursuing violators have the potential to educate the public and encourage compliance with the law.
Chapte r CO NCLUSIO N
This case study contributes to a growing body of knowledge regarding officer roadside safety by addressing a general lack of information on the effectiveness of move-over laws. The report compares key elements of state move-over laws across the country; identifies important characteristics of move-over related crashes; measures the frequency with which move-over violations may typically occur; gauges public awareness and understanding of the law; analyzes move-over cases in Ohio courts; and assesses, qualitatively and quantitatively, a variety of additional factors, including violator demographics and roadway environment. Based on the findings of this case study, several actions are recommended to further develop and reinforce move-over laws as normative driving behavior.
R ECOM M E N DATIO NS
• State law enforcement agencies should create, implement, and evaluate the impact of media campaigns and public outreach programs designed to inform the public regarding the existence of and reasoning behind the state’s move-over law.
• Convene public task forces to review respective state laws with the intent of improving the effectiveness of laws and positively influencing the long-term impact of move-over laws on the safety of officers and emergency personnel engaged in roadside activities.
• Continue to track the enactment of move-over laws on a state-by-state basis, including the

23
collection of information on the fines and other penalties associated with a violation.
• Conduct analyses similar to those contained within this case study in order to facilitate state-by-state comparisons of court decisions and penalties in move-over cases. Additionally, future research should explore the relationships between move-over violations and other types of violations, such as impaired driving.
• Conduct periodic special enforcement campaigns aimed at both educating motorists and affecting subsequent driving behavior through punitive measures. These operations may provide a practical means to enforce the move-over law, considering the infrequent opportunity to pursue violators while already engaged in traffic stops or other roadside contacts.
• Develop cooperative statewide electronic reporting systems among law enforcement agencies, courts, and other relevant entities that accurately capture and track move-over violations and move-over related crashes. Statewide and national databases can inform policy and officer training regarding move-over and other traffic-related violations.

Chapter Two:Officer Visibility
AlabamaDepartment of Public Safety
25
I NTRO DUC TIO N
Committed to serve and protect, law enforcement officers do not always work in environments conducive to personal safety. They, along with other first responders, often must perform their duties in situations and environments where their safety is reliant upon their personal visibility. This chapter addresses the issue of personal visibility and conspicuity for the law enforcement officer as an ever-growing safety concern.
Law enforcement officers in general respond to situations which require their physical presence, many times exposing them to danger from vehicular traffic, heavy equipment or other such hazards. Traffic officers are especially vulnerable. They perform a variety of duties related to traffic control, enforcement, and crash investigations that expose them to the potential danger of being struck by a vehicle. Sources of information, such as the FBI’s “Law Enforcement Officers Killed and Assaulted 2004,” suggest that officers accidentally struck and killed by motor vehicles is a major cause of law enforcement deaths. An average of 12 law enforcement officers were killed annually in the line of duty as pedestrians in traffic crashes from 1995-2004.1 It is important to note that these statistics do not include “near misses” or “brush backs.” Because of these occurrences, the issue of visibility for law enforcement officers must be addressed.
Conspicuity
Handling traffic crashes and assisting motorists make officers pedestrians, who may be exposed to high volumes of traffic. These situations require the officer to be visible or conspicuous. The concept of conspicuity is defined by the American National Standards Institute (ANSI) as the characteristics of an object influencing the probability that it will come to the attention of
an observer, especially in a complex environment that has competing objects. Factors that affect conspicuity are contrast, motion, form, size and brightness. Conspicuity is often referred to in discussions, but may be a misunderstood concept. Studies reveal that pedestrians overestimate their conspicuity and really are not seen by the observer when they think that they are. Drivers, too, overestimate their visual and perceptual ability.2
Many assume that the visibility issue is of concern only in low light conditions. On the contrary, visibility can also be an issue during daylight hours. The safety of the officer competes with other demands for the driver’s attention such as surrounding traffic, internal/external distractions, fatigue and the condition of their vision. Adding to the problem is the fact that most uniforms worn by law enforcement are dark in color. The color of the uniform can contribute to the inability to distinguish the law enforcement officer from the surrounding environment. The question becomes, how does the recognition of the law enforcement officer compete with the other demands for the driver’s attention?
Tactical Considerations
Compounding the problems of enhanced visibility is the fact that today’s officers are trained to conduct traffic stops in a manner that increases their chances of survival from a tactical perspective; limiting their exposure to threats involving possible physical harm from the violator. The possibility of tactical dangers occurring during traffic stops over time has resulted in officers’ efforts to limit their visibility during these encounters. Many agencies provide direction to officers either through training or policy to utilize high visibility equipment such as vests, raingear, gloves, and traffic wands, in
O F F I C E R V I S I B I L I T Y

26
situations that involve prolonged exposure to traffic. However, during routine traffic stops, the practice may be discouraged for tactical reasons.
Industry Standards and Legislation
The first ANSI high-visibility standard, ANSI 107, was developed by the International Safety Equipment Association (ISEA) and published by ANSI in June 1999. The ANSI 107-2004 standard is the accepted standard for the design and performance of high visibility safety apparel.3 In 2006, ISEA created a new standard, the ANSI 207-2006, specifically for vests to be worn by public safety personnel, including fire services, emergency medical services, and law enforcement. Based on the unique duties and work environments for public safety personnel, it was determined that there was a need to develop a separate standard for vests only. All other garments worn by public safety personnel should meet the ANSI 107-2004 standard.
Both standards are based on many years of testing and evaluation of both retro-reflective and fluorescent materials to determine what characteristics will provide the greatest visibility of the wearers and also will make them more conspicuous. The standards require BOTH fluorescent material and retro-reflective material. Reflective materials only work at night or under other low-light conditions. The fluorescent material provides visibility during daylight conditions. The standards also have very stringent requirements for durability and long-term effectiveness, as well as requiring a minimum number of square inches of visibility components.
Many state and federal regulatory bodies have adopted the ANSI 107-2004 standard. Most recently the Federal Highway Administration has published a proposed rule that would require all workers on federal-aid highways to wear high-visibility apparel that meets ANSI/ISEA 107-2004 or ANSI 207-2006.4
This would include construction and maintenance crews; surveyors and utility crews; incident responders, including law enforcement personnel; and anyone else whose duties put them on the federal highway right of way.
Comments on the proposed rule from law enforcement agencies, such as the California Highway Patrol, New York State Police, Alabama Department of Public Safety, and the IACP Highway Safety Committee have been submitted. These comments focused on how the diverse responsibilities of law enforcement officers separate them from others who work on Federal-aid highways; how their safety is better assured in some situations, such as high-risk felony stops and checks of suspicious vehicles, by furtiveness as opposed to conspicuousness. Requirements to wear high-visibility safety apparel should only be required when officers are engaged in traffic incident management and work zone assignments. This proposed rule has not been finalized as of this publication.
R ESULTS
Survey of States’ Policies
A survey was conducted of 51 state and provincial police agencies. Responses were received from 31 agencies, and no responses were received from 20 agencies. Twenty-four of the responding agencies indicated that policies were in place on the use of reflective vests and garments. Seven agencies indicated they did not have policies in place.5
Most policies indicate that personnel should use the vests and garments as soon as possible after responding to a crash scene, assisting motorists, or any other emergency roadside situations. Results of the survey show that policies require the use of reflective vests or garments in the following instances:

27
• Traffic control • Crash scenes • Sobriety checkpoints • During inclement weather • Periods of low visibility.
Most policies did not address the timely replacement of safety garments.6 Considering that the life expectancy of high-visibility garments is six months to three years, depending on use, policies should address this issue.7 Some policies refer to the reflective vest/garment as being ANSI compliant. The requirement that the garment be ANSI-compliant will enhance the safety and visibility of the officer and is a desirable component of the policy.
ANSI Compliant Garments
There are many considerations in choosing the proper ANSI 107-2004- or ANSI 207-2006-compliant garments. The design and features will vary within the law enforcement profession. Agencies should consider the following before making a garment selection.
Color: There are three colors currently authorized for use in an ANSI high-visibility garment: Orange; Yellow, also known as lime yellow or lime green (more suitable for darker backgrounds); and Red (more suitable for lighter backgrounds). Only fabrics that have been dyed properly with fluorescent dye will meet the standard. Although all three colors are allowed, the fabric must still meet the minimum levels of performance for brightness, color fastness, and be within a specific range of color. The brightest fluorescent fabrics are those dyed in fluorescent yellow. Fluorescent red is the least bright.
Brightness is not the only consideration, however. According to the University of Michigan Transportation Institute, officers should wear multiple colors of compliant background fabric to maximize visibility in dual-lighting conditions and to provide contrast.8 See Figure 1.
Definitions: The following are terms related to high-visibility referenced in ANSI standards.
Accredited laboratory: A laboratory having a certificate of accreditation meeting the requirements of ISO/IEC Guide 17025: 1999 (or other equivalent standard) for the collection and analysis of data within the parameters of this standard.
Background material: Colored fluorescent material intended to be highly conspicuous, but not intended to comply with the requirements of this standard for retro-reflective material.
Certify (background and retro-reflective material): To obtain compliance certification documents based on testing from an independent, third-party accreditation laboratory to verify performance requirements as specified in this standard.
Certify (finished item): To provide documentation from either an independent, third-party laboratory or to self-certify through the use of the apparel and headwear compliance certification.
Combined-performance material: A retro-reflective material that is also a fluorescent material. Combined performance materials can be counted toward the minimum area requirements for background material specified in Table I of the ANSI 107-2004 or ANSI 207-2006 standards.
Conspicuity: The characteristics of an object influencing the probability that it will come to the attention of the observer, especially in a complex environment that has competing objects.
Fluorescent material: Material that instantaneously emits optical radiation within the visible range at wavelengths longer than absorbed and for which emission ceases upon removal of the source of irradiation. These materials enhance day-time visibility, especially during dawn and dusk.
High-visibility headwear: Personal protective item that is worn on the head and intended to provide conspicuity when worn both day time and night time.
High visibility safety apparel: Personal protective safety clothing intended to provide conspicuity during both day-time and night-time usage.
Photometric performance level: The effectiveness of retro-reflective material in returning light to its source and measured in terms of coefficient of retro-reflection.
PPE: Personal protective equipment.
Retro-reflective material: Material that is a retro-reflector and is either 1) not intended to comply with the requirements of this standard for background material, or 2) is a combined-performance, retro-reflective material.
Self-certify: To verify apparel design requirements within this standard without the use of an independent, accredited laboratory or other third party.

28
For example, a yellow high visibility garment worn in front of a yellow vehicle or overhead light systems does a poor job of providing the wearer more conspicuity. Conspicuity is distinguishing the wearer from the environment, including background color, to give drivers an accurate visual perception.
Reflectivity: There are many different types of retro-reflective fabrics available. Currently there are two basic types of retro-reflective material that will pass the ANSI high-visibility standards. The most common type is the silver tape that uses glass bead technology; the other uses micro-prismatic cells. Effective micro-prismatic products are sealed in a vinyl outer layer and have a plastic-type look. There are products using both technologies that pass the ANSI high-visibility standard, as well.
Other design considerations: There are many functional aspects of design that should be considered for law enforcement garments. Care should be taken to make sure none of the features will affect the garment’s compliance to the ANSI standards.
Comfort Proper fit Interference with equipment Professional appearance Ease of care Versatility of use Identification.
Timely replacement: High-visibility garments have a limited effective life because the visibility characteristics of both the retro-reflective and fluorescent fabrics deteriorate over time. There are many variables that can have a major impact on the useful life of an ANSI-compliant, high-visibility garment, including the amount of exposure to sun, laundering methods, stains, abrasion, and other factors. It is important that law enforcement agencies examine their garments on a regular basis to evaluate the level of deterioration that has occurred. A simple visual examination of a used garment, side-by-side with a new garment, is one way to evaluate the deterioration.
Garments Classes: The ANSI 107-2004 standard has three different classes of garments. Every class has the identical requirements for brightness, reflectivity, durability, etc. The only difference between each class is the minimum number of square inches of fluorescent background material and the minimum number of square inches of retro-reflective material required. In addition to the square-inch requirements, the Class 3 garments also must have sleeves. There is no such thing as a Class 3 vest. The ANSI 207-2006 public safety vest standard is essentially the same as a Class 2 ANSI 107-2004 vest, except the minimum square inches of fluorescent background material is reduced.
Minimum areas of visible material required by class:
ANSI 107-2004 Class 1 Fluorescent Background Material 217 sq. inchesRetro-reflective Material 155 sq. inches
ANSI 107-2004 Class 2Fluorescent Background Material 775 sq. inchesRetro-reflective Material 201 sq. inches
ANSI 107-2004 Class 3Fluorescent Background Material 1,240 sq. inchesRetro-reflective Material 310 sq. inches
ANSI 207-2006 Public Safety VestFluorescent Background Material 450 sq. inchesRetro-reflective Material 201 sq. inches
Figure 1. Garment Conspicuity

29
Automotive Considerations: Automotive headlight designs of the future should be considered in the design and testing of high-visibility garments. Officer visibility, even with high-visibility, retro-reflective garments, can be affected by the design of future automotive headlights. The process of standardizing headlight design and composite materials centers around visual optical aim-able (VOA) materials. VOA headlights provide a flatter-beam spread that focuses more on the roadway. The VOA lighting will produce a different pattern, which will affect the ability of the driver to see pedestrians wearing retro-reflective garments. The possible results may cause less light to be reflected from the retro-reflective garment above the focus of the light pattern, making the pedestrian less visible.
Purchasing and Garment Specifications
Agencies responsible for procurement of garments are not necessarily familiar with the factors that should be considered when formulating purchasing specifications and often lack the information and/or policy to address the issue of conspicuity and utilizing high-visibility garments.
To purchase garments that are compliant with the ANSI 107-2004 or ANSI 207-2006 high-visibility garment standards, it is important to have written specifications. Most manufacturers have written technical garment specifications. The written specifications should include detailed descriptions of the fabrics and components, the basic design and construction of the garment, and any other specific features. In addition, it is vital that the specifications provide proper documentation that verifies the garments are actually compliant with the applicable ANSI high-visibility standard. Although the ANSI high-visibility standard does not require third-party testing, consideration should be given to the following recommendations:
• Third-party, independent ANSI certification on the finished garment should be provided with the bid and dated prior to the bid release date. Testing documents should be provided with test results listed on the testing labs official documents and should show tests for compliance with the Garment Requirements Section 6.1; Apparel Design Section 6.2; Ergonomics Section 6.3; Care and Labeling Section 10; Marking, General Section 11.1; Marking, Specific 11.2; and Instructions for Use Section 12 of the ANSI 107-2004 or ANSI 207-2006 standard.
• Third-party, independent ANSI certification of the background fabric and retro-reflective tape should be provided at the time of bid opening and on the appropriate ANSI 2004 form. The background fabric and reflective material should be compliant with ANSI 107-2004 or the bidder should be rejected.
• Bidders should include with their bid, in writing on company letterhead, the warranty and guarantee provision from the manufacturer for the garment bid.
• An apparel and headwear compliance certificate that is signed by an official of the company should be included with the bid.
• Prospective bidders and manufacturers should provide references.
Law enforcement agencies, especially agencies with separate purchasing departments should, in addition to having written specifications submitted with a bid request, ensure their purchasing agents and buyers understand the key issues in buying garments compliant with the ANSI high-visibility standards. Considering that traffic stops are the number one threat to officer safety, buyers must be aware that safety garments are not uniform garments, and that the type of documentation described above cannot be optional.9

30
The Internet link to the publisher of ANSI high-visibility standards, ISEA, should be provided to agency purchasing agents and buyers to access information as needed: http://www.safetyequipment.org/hivisstd.htm The following are key issues important for purchasing agents and buyers:
• Every manufacturer has the ability to find information on the ANSI high-visibility standards on their own. This is in no way excluding any legitimate manufacturer from competitive bidding.
• Testing and certification by an independent accredited third-party laboratory are the only reasonable way to ensure the garments submitted for bid are actually compliant.
• Manufacturers who ask what ANSI is should be referred to the ISEA/ANSI Web site, where that manufacturer may access information directly, as opposed to the purchasing agent educating the manufacturers.
• Agencies should provide a copy of the standard or ask purchasing to buy a copy of the current edition of the standard to have on file.
• It is important to remember that the ANSI high-visibility standards allow the finished garments to be self-certified. Self-certification means that any manufacturer can make any claim and agencies take their word for it, UNLESS they require third-party testing.
CO NCLUSIO N
The visibility of officers conducting traffic duties is essential to reducing the incidence of death and injury. Understanding conspicuity, ANSI standards, retro-reflectivity and fluorescence and their application to police work is not always
easy. However, understanding these terms and their application is crucial to providing the best protection available to officers.
R ECOM M E N DATIO NS
• Agencies should develop policies consistent with federal rule-making requiring officers to wear high-visibility, retro-reflective vests/garments whenever their duties involve prolonged exposure to traffic.
• Training should incorporate into officer survival tactics the appropriate time at which officers should apply the use of high-visibility, retro-reflective vests/garments.
• Agencies should specify in policy and training that only ANSI 107-2004-and ANSI 207-2006-compliant garments are to be worn. Law enforcement organizations/officials should actively participate in the rule-making process involving issues related to officer safety.
• Agencies should become actively involved in the purchasing process for high-visibility, retro-reflective vests/garments and require certification by an independent, accredited third-party laboratory that the items meet the ANSI public safety standard as part of the purchasing specifications.
References
1Federal Bureau of Investigation. (2004). Law enforcement officers killed and assaulted, 2004. Washington, D.C.
2American National Standards Institute. (2004). American national standard for high-visibility safety apparel and headwear. (ANSI/ISEA 107-2004). Washington, D.C.
3American National Standards Institute.

31
4Federal Register: April 24, 2006 (Volume 71, Number 78). Washington, D.C.
5Alabama Department of Public Safety, (2006). Survey results: state policies regarding the use of reflective garments. Montgomery, Alabama.
6Alabama Department of Public Safety.
7Federal Register.
8University of Michigan Transportation Research Institute. (2000). The effect of color contrast on daytime and nighttime conspicuity of roadworker vests. Ann Arbor, Michigan.
9Federal Bureau of Investigation.
Chapter Three:Vehicle Emergency Warning Systems
FloridaHighway Patrol

33
I NTRO DUC TIO N
In the 2004 LESSS Staff Study, the emergency warning system research that began with the Arizona-Ford Blue Ribbon Panel and continued with the Florida Highway Patrol (FHP) was summarized. A detailed presentation of the information was published as the “Florida Highway Patrol Emergency Lighting Research and Prototype Evaluation, March 2004.” This research led the FHP to purchase a state-of-the-art Light Emitting Diode (LED) emergency lighting system to replace the current all-blue halogen rotating lamps. Implementation of the new system began in August 2005 with installation on vehicles that were being replaced through normal trade-in procedures. This chapter analyzes FHP patrol car crashes from August 2005 through May 2006 (see Appendix D). Crash rates were compared between the existing bar light and slicktop patrol vehicles (with solid blue rotating lamps on marked Ford Crown Victoria Police Interceptors (CVPI) and blue-strobe/amber LED lightbars on marked Chevrolet Camaros) and Ford CVPI patrol cars with new emergency warning systems installed.
Key elements of the new emergency warning system include:
A. The rooftop lightbar is composed of two levels of high intensity LED lamps. The segments alternate red and blue completely around the lightbar. This allows any combination of vehicle emergency lighting including: (1) solid red, (2) solid blue, (3) combination blue and red, and (4) white (created by mixing blue and red lights).
B. The amber traffic direction system was placed into the rear window to separate it from the rooftop lightbar. This light dims when the rooftop lightbar turns blue to reduce the possibility of causing nightblindness in
approaching drivers.
C. Distinct lighting patterns that change with vehicle motion.
1. When moving, the rooftop lightbar produces a rapidly flashing pattern that shows bursts of red, blue and white.
2. When the patrol vehicle is placed into park or neutral, the pattern alternates the front and rear segments with the sides. In addition, the rooftop lightbar flashes only a single color.
D. When the vehicle is in park or neutral, the color emitted by the rooftop lightbar is chosen based on a reading from a photocell of the intensity of the surrounding ambient light. For daytime/bright ambient light, the bar will flash solid red and at night/low level ambient light, the bar will flash blue.
E. Improved takedown lights using the ability of red and blue to make a shade of white light. During takedown operations, all forward facing red and blue LED’s are switched to “constant on” to create a wide, bright, shadowless light that improves officer visibility, reduces suspects’ ability to target the officer and improves nighttime illumination for video recording.
F. A larger and brighter interior forward-facing LED light module (for slicktop vehicles).
G. A combination blue and red LED bar across the top of the back window and an amber LED traffic direction bar at the bottom of the rear window (for slicktop vehicles).
H. A supplemental siren that operates at a lower frequency to travel further and better penetrate passenger cabins.
VEHICLE EMERGENCY WARNING SYSTEMS

34
M ETHO DS / R ESULTS
Beginning with the implementation of the new FHP emergency warning system in August 2005, copies of all long-form traffic crash reports involving marked patrol vehicles were obtained (see Appendix D). These reports were analyzed and the results sorted to compare the crash rates of vehicles with the new equipment to the crash rates of traditionally equipped vehicles. The reports were further sorted to examine the crash rates of vehicles during routine operations (no lights or siren activated) and during emergency operations (see Figure 1). Emergency operations include, but are not limited to, all activities during which the lights and/or siren are activated: (1) responding to calls, (2) overtaking and/or stopping violators, and (3) stopping in or near the roadway for traffic crashes, traffic stops, and other roadway activities or hazards.
New emergency warning systems were installed and used as a complete package. During the first months of installation of the new equipment, the number of vehicles in the study was small. As a result, the first 10 months of implementation referred to in this report are considered preliminary and not enough data are available to attempt to determine which features of the systems account for changes in the crash rates. A follow- up study is planned in 2007 when more data are available for comparing the two groups.
In order to compare the old and newly equipped vehicles, crash rates based on exposure (time in service) were calculated. First, the average number of newly equipped vehicles placed into service each month was determined from FHP central installation records. The number of newly equipped vehicles was subtracted from the total number of marked units in the fleet to obtain the average number of traditionally equipped units for the same time period. The number of marked units in the fleet was held constant during the study at 1,706 units. The total number of vehicles
in service each month during the study was determined by the total number of “unit months of exposure” by group. Dividing the number of crashes in each group by their respective “unit months of exposure” produces an associated crash rate (see Figure 2).
The data in Figure 1 show that the overall number of crashes of newly equipped vehicles was slightly higher than their percentage of total months of vehicle exposure (13.3 percent compared to 12.6 percent). The crash rate of newly equipped vehicles during emergency operations (light activated) was lower than their representation in the fleet (11 percent compared to 12.6 percent) This reduction is even more significant considering the apparent inequality in the months of exposure of old and new vehicles. That is, while older cars require more maintenance, limiting their degree of exposure, new cars are rarely placed out of service. Thus, older car exposure may be over-represented if counted as being in-service for the entire 10-month duration of the study.
The data in Figure 2 show a 14 percent reduction in the crash rate during emergency operations for the newly equipped vehicles compared to the traditionally equipped vehicles.

35
Old EWS in service
(total months
exposure)
Old EWScrashes
Crashes with
old EWS activated
New EWS in service
(total months
exposure)
New EWScrashes
Crashes with
new EWS activated
Fleet with new EWS in service
Crashes with new
EWS
Crashes with
new EWS activated
Aug 2005 1,667 28 10 39 1 0 2% 3% 0%
Sep 2005 1,616 42 13 90 1 1 5% 2% 7%
Oct 2005 1,565 42 14 141 3 1 8% 7% 7%
Nov 2005 1,539 35 5 167 6 0 10% 15% 0%
Dec 2005 1,510 25 9 196 11 3 11% 31% 25%
Jan 2006 1,478 30 7 228 2 0 13% 6% 0%
Feb 2006 1,430 32 7 276 8 1 16% 20% 12%
Mar 2006 1,409 41 14 297 7 1 17% 13% 7%
Apr 2006 1,370 25 7 336 6 2 20% 20% 22%
May 2006 1,327 25 11 379 5 3 22% 18% 21%
Total 14,911 325 97 2,149 50 12 12.6% 13.3% 11%
Figure 1. Crash Rates of FHP Patrol Vehicles with Old Emergency Warning System (EWS) and New Emergency Warning System (EWS).
Crashes with EWS Activated
Months of Exposure
EWS Crash Rate
(per thousand)
Old EWS 97 14,911 6.505
New EWS 12 2,149 5.584
% Difference 14%
Figure 2. Comparison of Emergency Operation Crashes: Old Emergency Warning System (EWS) and New Emergency Warning System (EWS).
CO NCLUSIO N /R ECOM M E N DATIO NS
This results of this study show that the new emergency warning systems are related to a reduced crash rate. However, the findings are based on a small number of vehicles equipped with the new emergency warning systems.
Additional studies by law enforcement fleets are needed to determine which components of the emergency warning system are responsible for the reduction in crashes. Additional studies may also indicate which types of crashes are most influenced by specific system components, enabling further optimization of the emergency warning system.

Chapter Four:Vehicle Positioning
and Officer Approach
New YorkState Police

37
I NTRO DUC TIO N
Due to an increase in the number of officers struck as pedestrians while enforcing traffic laws, the Blue Ribbon Panel examined ‘best practices’ for the positioning of officers and their vehicles during traffic stops and other roadside contacts.1 The Blue Ribbon Panel recommended traffic stops occur as far away from traffic as possible, utilizing driveways, parking lots, rest stops, or offsets beyond the right shoulder when they are available in order to reduce the risks associated with being struck as a pedestrian.
In addition to the recommendations made by the Blue Ribbon Panel, the International Association of Chiefs of Police, Law Enforcement Stops and Safety Subcommittee published the 2004 Staff Study which reported the results of computer simulations conducted by Ford Motor Company and the New York State Police.2 The intent of this chapter is to further examine these models and compare them to an actual collision reconstruction in order to begin the process of verifying and/or refuting predictions based on the computer simulations. Training implications based on the results of the simulations are also explored.
M ETHO DS
The positioning of patrol vehicles as it relates to pedestrian officer safety while conducting enforcement activities, as well as the manner in which the officer approaches a stopped vehicle are important factors related to officer survival and crash outcomes. A review of the literature revealed only one published paper on the effectiveness of patrol vehicle positioning3 relative to pedestrian officer safety. The simulations reported in this study were based on dry roadways with no adjacent barriers, such as guardrails. A decision was made to use these findings as a starting point for continued research. The simulations reported in this chapter extend the analysis to include crashes during inclement weather and crashes where barriers are adjacent to the shoulder.
The two vehicle positions that are evaluated with the simulations are the in-line position (Configuration #1) and the angled position (Configuration #2). These are the two most commonly employed vehicle configurations noted when officers conduct traffic stops and/or have other roadside contacts. In addition, left-
In-Line Position (Configuration #1)
Patrol Vehicle Angle = 0 DegreesPatrol Vehicle Steering = -25 DegreesPatrol Vehicle Offset = 50%Patrol Vehicle Distance = 15 ft. Fog Line
Edge of Pavement
VEHICLE POSITIONING AND OFFICER APPROACH
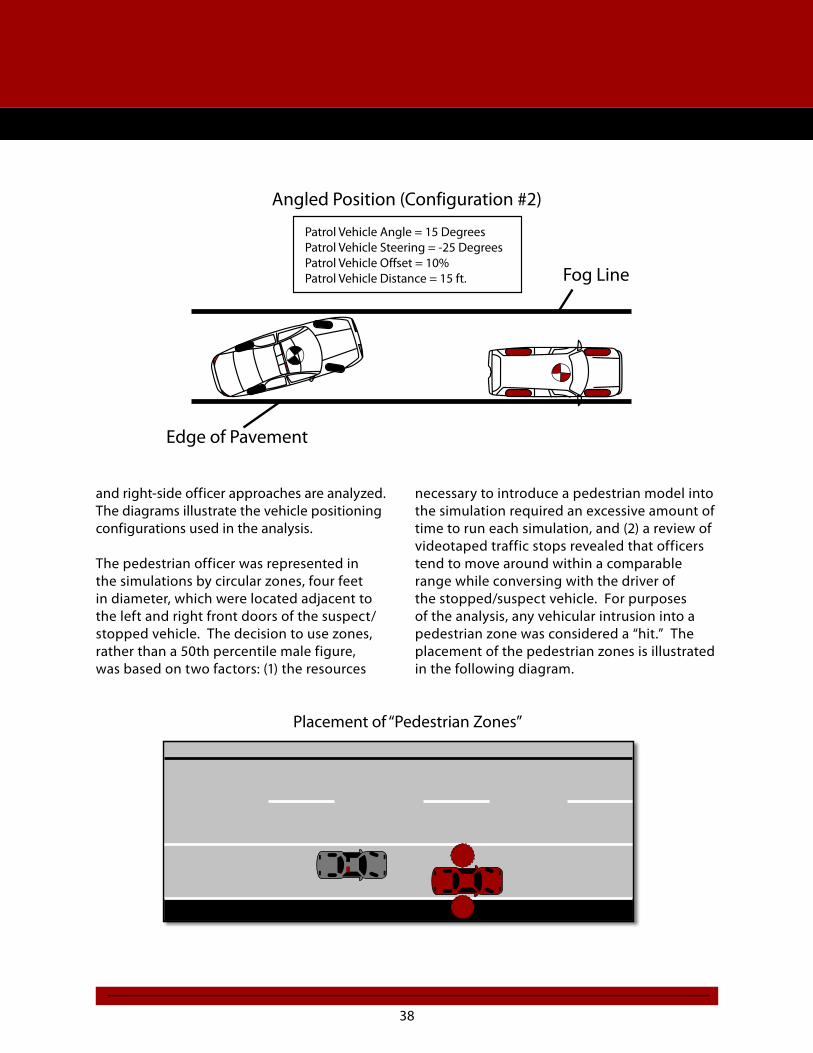
38
and right-side officer approaches are analyzed. The diagrams illustrate the vehicle positioning configurations used in the analysis.
The pedestrian officer was represented in the simulations by circular zones, four feet in diameter, which were located adjacent to the left and right front doors of the suspect/stopped vehicle. The decision to use zones, rather than a 50th percentile male figure, was based on two factors: (1) the resources
necessary to introduce a pedestrian model into the simulation required an excessive amount of time to run each simulation, and (2) a review of videotaped traffic stops revealed that officers tend to move around within a comparable range while conversing with the driver of the stopped/suspect vehicle. For purposes of the analysis, any vehicular intrusion into a pedestrian zone was considered a “hit.” The placement of the pedestrian zones is illustrated in the following diagram.
Placement of “Pedestrian Zones”
Angled Position (Configuration #2)
Patrol Vehicle Angle = 15 DegreesPatrol Vehicle Steering = -25 DegreesPatrol Vehicle Offset = 10%Patrol Vehicle Distance = 15 ft. Fog Line
Edge of Pavement

39
R ESULTS
Computer Simulations
Scenario #1: In-Line Vehicle Positioning and Left-Side Approach. The first scenario examined was an in-line left-side approach, which did not involve an adjacent barrier or inclement weather. The vehicle and pedestrian configuration resulted in approximately 52% misses, 5% near misses, and 43% hits. On those occasions when the pedestrian officer was struck, the average impact speed ranged from 7 to 31 mph and the projected mortality ranged from 0 to 36.4 percent. The following graph illustrates the relative effectiveness of the configuration.
When a non-deformable barrier was placed adjacent to the shoulder, the overall effectiveness of the in-line configuration appeared to improve slightly. The configuration resulted in approximately 63% misses, 7% near misses, and 30% hits. On those occasions when the pedestrian officer was struck, the average impact speed ranged from 15 to 30 mph and the projected mortality ranged from 2.8 to 31.2 percent. The following graph illustrates the relative effectiveness of the configuration.
When the condition of the roadway was modified to represent slippery/snow-covered pavement, the in-line configuration without a barrier resulted in approximately 36% misses, 6% near misses, and 58% hits. On those occasions when the pedestrian officer was struck, the average impact speed ranged from 12 to 31 mph and the projected mortality ranged from 4.8 to 30.4 percent. The following graph illustrates the relative effectiveness of the configuration.
Effectiveness of LSA - Configuration #1 (No Barriers & Dry Weather)
7272
62
33
10
91
0 03.3
6.2
11.5
26.2
36.4
0
10
20
30
40
50
60
70
80
90
100
45 50 55 60 65 70 75
Impact Speed of Bullet Vehicle in MPH
Per
cent
age
Pedestrian HitsProjected Mortality Rate
Effectiveness of LSA - Configuration #1 (Adjacent Barrier & Dry Weather)
78
61
50
44
2831.2
18.315.0
4.42.800
0
10
20
30
40
50
60
70
80
90
45 50 55 60 65 70 75
Impact Speed of Bullet Vehicle in MPH
Pe
rce
nta
ge
Pedestrian HitsProjected Mortality Rate
Effectiveness of LSA - Configuration #1 (No Barriers & Inclement Weather)
76
57
6767
76
57
48
30.4
17.120.1
13.415.2
5.74.8
0
10
20
30
40
50
60
70
80
45 50 55 60 65 70 75
Impact Speed of Bullet Vehicle in MPH
Per
cent
age
Pedestrian HitsProjected Mortality Rate

40
When the same inclement weather conditions were introduced to the in-line configuration with an adjacent barrier, the result was approximately 43% misses, 13% near misses, and 44% hits. On those occasions when the pedestrian officer was struck, the average impact speed ranged from 11 to 29 mph and the projected mortality ranged from 3.3 to 21.6 percent. The following graph illustrates the relative effectiveness of the configuration.
Computer simulation analysis revealed that the introduction of an adjacent barrier resulted in a decrease in the total number of pedestrian officer hits and a corresponding increase in the overall effectiveness of the in-line left-side approach (Scenario #1). A similar decrease was also seen in the configuration’s projected mortality rate. The overall effectiveness of the configuration decreased with the introduction of inclement weather and the total number of hits increased, especially at the lower end of the striking vehicle velocity (SVV) range. However, the increase in projected mortality at the lower end of the SVV range appeared to be offset by a decrease in the number of hits at the higher end of the SVV
range, along with a corresponding reduction in projected mortality.
In an attempt to improve the effectiveness of the configuration in inclement weather, the patrol vehicle distance was increased from 15 feet to 30 feet and a series of screening runs were conducted. The results of the screening runs indicated that the increase in patrol vehicle distance caused a decrease in the number of hits at the lower end of the SVV range and an offsetting increase in the number of hits at the higher end of the SVV range. Since the average speed on most interstate highways tends to be closer to the higher end of the SVV range, an increase in the patrol vehicle distance during inclement weather was determined to be detrimental to the configuration’s overall effectiveness.
An examination of the vehicles that entered the pedestrian zone revealed that the officer was struck primarily by the patrol vehicle. When the pedestrian officer was struck by the patrol vehicle the average impact speed was approximately 18 mph. When the officer was struck by the bullet/striking vehicle the average impact speed was approximately 31 mph and, on five occasions, the bullet vehicle rolled over on the pedestrian officer. The following chart illustrates the percentage of pedestrian hits by each vehicle.
Effectiveness of LSA - Configuration #1 (Adjacent Barrier & Inclement Weather)
72
61
6767
56
44
33
21.618.3
20.1
13.4
8.4
4.43.3
0
10
20
30
40
50
60
70
80
45 50 55 60 65 70 75
Impact Speed of Bullet Vehicle in MPH
Perc
en
tag
e
Pedestrian HitsProjected Mortality Rate
LSA - Configuration #1 (No Barriers & Dry Weather) Percentage of Pedestrian Hits By Vehicle
32%
67%
1%
Hit By Bullet VehicleHit By Patrol VehicleHit By Stopped Vehicle

41
Scenario #2: In-Line Vehicle Positioning and Right-Side Approach. When the same in-line configuration was evaluated for a right-side approach, the initial analysis revealed an extremely high incidence of hits, but a relatively low projected mortality rate. The configuration resulted in approximately 11% misses, 16% near misses, and 73% hits. On those occasions when the pedestrian officer was struck, the average impact speed ranged from 7 to 14 mph and the projected mortality ranged from 0 to 9.5 percent. The actual mortality rate may prove to be even lower than projected, due to the probability that a struck officer would most likely be thrown back toward a grassy shoulder and away from adjacent traffic, rather than toward the paved roadway, as would be the case with an in-line left-side approach. However, the increased percentage of hits could also translate into an increased number of serious non-fatal injuries. The effectiveness of the in-line right-side approach (Scenario #2) is illustrated in the following graph.
An examination of the vehicles that entered the pedestrian zone revealed that the officer was struck most often by the stopped vehicle.
When the pedestrian officer was struck by the stopped vehicle the average impact speed was 9 mph. When the officer was struck by the patrol vehicle the average impact speed was about 15 mph. And, when the officer was struck by the bullet vehicle the average impact speed was approximately 12 mph. On 16 occasions the bullet vehicle rolled over on the pedestrian officer. If the assumption is made that the bullet vehicle rollovers would result in a mortality rate of approximately 75%, then the projected mortality rate for the in-line right-side approach (Scenario #2) would almost equal the projected mortality rate for the in-line left-side approach (Scenario #1). The following chart illustrates the percentage of pedestrian hits by each vehicle.
Scenario #3: Angled Vehicle Positioning and Right-Side Approach. The third scenario examined involved an angled patrol vehicle (Configuration #2) and a right-side approach with no adjacent barriers or inclement weather. The configuration resulted in approximately 67% misses, 9% near misses, and 24% hits. On those occasions when the pedestrian officer was struck, the average impact speed ranged from 5 to 14 mph and the projected mortality ranged from 0 to 6.2 percent. The following graph illustrates the relative effectiveness of the angled configuration.
Effectiveness of RSA - Configuration #1 (No Barriers & Dry Weather)
81
90 90 9095
86 90
0 04.5
9.0 9.5 8.6 9.0
0
10
20
30
40
50
60
70
80
90
100
45 50 55 60 65 70 75
Impact Speed of Bullet Vehicle in MPH
Pe
rce
nta
ge Pedestrian Hits
Projected Mortality Rate
RSA - Configuration #1 (No Barriers & Dry Weather)Percentage of Pedestrian Hits By Vehicle
18%
17%
65%
Hit By Bullet VehicleHit By Patrol VehicleHit By Stopped Vehicle

42
When the condition of the roadway was modified to represent slippery/snow-covered pavement, the angled configuration resulted in approximately 40% misses, 5% near misses, and 55% hits. On those occasions when the pedestrian officer was struck, the average impact speed ranged from 9 to 19 mph and the projected mortality ranged from 1.9 to 7.2 percent. The following graph illustrates the relative effectiveness of the angled configuration.
An examination of the vehicles that entered the pedestrian zone revealed that the officer was struck most often by the patrol vehicle. When the pedestrian officer was struck by the patrol vehicle the average impact speed was approximately 12 mph. When the officer was struck by the suspect/stopped vehicle the average impact speed was about 6 mph. Additionally, when the officer was struck by the bullet/striking vehicle the average impact speed was approximately 12 mph. The angled position of the patrol vehicle (Configuration #2) resulted in only one incident where the bullet vehicle rolled over on the pedestrian officer. Accordingly, the angled right-side approach (Scenario #3) did not require a significant upward adjustment of the projected mortality rate to account for bullet vehicle rollovers. As previously mentioned, the actual mortality rate for a right-side approach may prove to be even lower than projected, due to the probability that a struck officer would most likely be thrown back toward a grassy shoulder and away from adjacent traffic rather than toward the paved roadway, as would be the case with an in-line left-side approach.
When the two patrol vehicle configurations examined in this analysis were compared for their ability to prevent pedestrian officer fatalities, the angled right-side approach (Scenario #3) was found to be the most effective at accomplishing that task
Effectiveness of RSA - Configuration #2 (No Barriers & Inclement Weather)
72
676772
57
48
38
7.26.76.77.25.74.8
1.9
0
10
20
30
40
50
60
70
80
45 50 55 60 65 70 75
Impact Speed of Bullet Vehicle in MPH
Perc
en
tag
e
Pedestrian HitsProjected Mortality Rate
Effectiveness of RSA - Configuration #2 (No Barriers & Dry Weather)
3838
1919
24
38
52
0 0 01.3
3.8 3.86.2
0
10
20
30
40
50
60
45 50 55 60 65 70 75
Impact Speed of Bullet Vehicle in MPH
Per
cent
age
Pedestrian HitsProjected Mortality Rate
RSA - Configuration #2 (No Barriers & Dry Weather)Percentage of Pedestrian Hits By Vehicle
15%
54%
31%
Hit By Bullet VehicleHit By Patrol VehicleHit By Stopped Vehicle
RSA - Configuration #2 (No Barriers & Dry Weather)Percentage of Pedestrian Hits By Vehicle
15%
54%
31%
Hit By Bullet VehicleHit By Patrol VehicleHit By Stopped Vehicle
RSA - Configuration #2 (No Barriers & Dry Weather)Percentage of Pedestrian Hits By Vehicle
15%
54%
31%
Hit By Bullet VehicleHit By Patrol VehicleHit By Stopped Vehicle

43
in both dry and inclement weather. It resulted in less pedestrian hits by the bullet/striking vehicle, lower average impact speeds for the pedestrian officer, fewer bullet vehicle rollovers, and a lower projected mortality rate, especially at the higher end of the SVV range. The most significant disadvantage to the right-side approach, for either configuration, was its inability to be used when a fixed barrier was adjacent to the paved shoulder of the highway. Another drawback was snow removal efforts that could result in the formation of temporary obstacles, such as snow banks, along the shoulders of the highway, thereby preventing a right-side approach.
When the same two configurations were evaluated for their effectiveness in reducing collision severity for officers sitting inside the patrol vehicle, “in-line” positioning (Configuration #1) was found to be more advantageous. Angling the patrol vehicle to the left tends to increase the likelihood that the patrol vehicle will be struck on its left side, thus exposing the officer/driver to more severe injury than might result from a rear impact. According to the National Highway Traffic Safety Administration, a side-impact collision is 4.7 times as likely to involve a fatality as a rear-impact collision and crashes occurring on highways with the highest posted speed limits are 8.9 times as likely to involve a fatality as crashes occurring on roadways with lower posted speed limits.4 The following two diagrams illustrate how angling the patrol vehicle to the left can result in the patrol vehicle being struck on its left side, possibly increasing the risk of death to a police officer/driver.
New York State Police Collision Reconstruction
A collision that occurred in New York State on August 8th, 2004 verified the simulations outlined previously. That is, findings of the computer simulations were parallel to the outcome of the high-speed rear-end collision that occurred.
A brief synopsis of the incident is outlined as follows.
State Police members conducted a vehicle and traffic stop and, during the course of the stop, placed the patrol vehicle on the west shoulder of the roadway facing in a south direction. Both members exited the patrol vehicle (Vehicle #1) and approached the violator’s vehicle, a 2002 Chevrolet Cavalier (Vehicle #3), which was also stopped on the west shoulder. During the course of the initial interview with the operator, a 1998 Jeep Grand Cherokee (Vehicle #2) struck the left rear of the parked State Police vehicle; calculations approximate the speed of Vehicle #2 to be 70 miles-per-hour. The resulting impact then forced the State Police vehicle forward, causing it to strike the rear of the Chevrolet Cavalier. As each vehicle proceeded to their respective positions at final rest, the two State Police members were subsequently struck and injured. The operator of the Jeep Grand Cherokee and the two occupants of the Chevrolet Cavalier also received minor injuries. The weather at the time of the collision was reported to have been cloudy and the road surface was dry.
Trooper 1 positioned herself along the left side of Vehicle #3, while Trooper 2 positioned himself along the right side of the vehicle, slightly behind the right ‘B’ pillar. Vehicle #2 was traveling within the lane of travel. At an unknown point, for an unknown reason, Vehicle #2 proceeded partially onto the shoulder as the vehicle continued to proceed in a manner in which a portion of the right front of the vehicle struck the left rear of Vehicle #1 in an offset, in-line manner as illustrated in Configuration #1. As a result of the impact, Vehicle #1 was forced directly forward as the undercarriage was forced downward. Due to the offset manner in which the collision occurred, Vehicle #1 and Vehicle #2 each rotated clockwise.
Following the separation from maximum engagement, Vehicle #1 continued in the same direction as it rotated clockwise. Vehicle #2 rotated in an eccentric clockwise manner and proceeded into and across the lane of traffic. As the vehicle became broadside, it rolled onto its lower left side and continued across the lane. As the vehicle continued onto the shoulder, Vehicle #2 returned to an upright position, and rotated in a counter clockwise manner. Vehicle #2 then attained its position of final rest partially off the shoulder.
After being forced in a south direction, the left front of Vehicle #1 struck the right rear of Vehicle #3. The resulting impact redirected the rotation of Vehicle #1 from a clockwise to a counter clockwise manner. Vehicle #3 was

44
also forced in a forward manner as it rotated in a counter clockwise direction.
Following the initial impact, Vehicle #3 was forced in a south direction, as the rear portion was forced in a southwest direction, resulting from the initial rotation. During this phase of the collision sequence, Trooper #1 was likely struck by the operator’s door of Vehicle #3, as it was forced past her. Trooper #2 was likely struck by the right rear quarter panel of Vehicle #3, during the initial post impact movement and rotation. As a result of this impact, Trooper #2 was thrown in a southwest direction and attained a position of final rest near the wooded area bordering the highway.
Following impact, Vehicle #1 continued to rotate in a counter clockwise manner and proceeded off the west shoulder. Vehicle #1 attained its position of final rest off the west shoulder, facing in a south, southeast direction. Vehicle #3 continued in south direction, into the southbound lane of travel, where the vehicle attained its position of final rest, facing in a south direction.
Officer-in-Vehicle Scenario A: Rear Impact Officer-in-Vehicle Scenario B: Side Impact
This reconstruction verifies the findings of computer simulations conducted using Configuration #1. Although Trooper #1 obtained contusions to her right hand and shoulder and Trooper #2 experienced lower back pain, their injuries were relatively minor and they have both returned to full and strenuous duty status.

45
Training Implications
Since no single patrol vehicle configuration is capable of providing maximum protection in every situation, an officer has two choices; (1) to attempt to custom-tailor their patrol vehicle configuration to fit each individual situation or (2) to compromise and use a single patrol vehicle configuration, with slightly added risk, in every situation. Each of these choices has its own advantages and disadvantages.
The first choice demands that the officer possess a thorough understanding of all the risk factors associated with traffic stops and how to properly employ the correct techniques to minimize those risks. The officer must then be able to quickly assess each situation and accurately decide which patrol vehicle configuration will afford the most protection for that particular scenario. While a situation-specific configuration provides the best means for reducing risk, it also requires that officers receive a significant level of basic training, practice, and in-service refresher courses, to work effectively. Without the necessary training and understanding required to make the right decisions, an officer utilizing a situation-specific configuration may expose themselves to even greater risk than if they had chosen the “one-configuration-fits-all” approach with its risk trade-offs.
A significant advantage of the “one-configuration-fits-all” approach is that it tends to afford a reasonable level of protection in most situations, while requiring only a minimal investment in training. It also allows officers to devote more of their attention to the stopped vehicle and its occupants, since it does not involve the additional decision-making processes required by a situation-specific approach. This is especially important for newer officers, who may be struggling to master a number of other job skills at the same time. The amount of information necessary to effectively utilize a
situation-specific approach may only serve to confuse inexperienced officers and lead them to make potentially fatal mistakes with respect to patrol vehicle positioning. It could also cause the more experienced officers to resist training efforts, since they may be uncomfortable with the thought of having to deviate from techniques which they believe have served them well for many years.
The best course of action may be a multi-level approach to training that begins with a “one-configuration-fits-all” method for new officers. Although academy-level recruits should still be taught the advantages and disadvantages of alternative approaches, primary emphasis should be placed on one select patrol vehicle configuration for all “unknown risk” situations. This foundational training would then be reinforced at the next level by the recruit’s Field Training Officer, who should also possess an in-depth understanding of the risk factors associated with traffic stops and the correct techniques to minimize those risks.
The next level should involve supervisory monitoring and guidance, throughout the new officer’s probationary period. During these early phases of training, heavy emphasis should still be placed on the fundamentals of traffic stops and the “one-configuration-fits-all” approach. Once an officer has reached a point where they have become proficient in the fundamental techniques, they should then receive in-service training which would re-expose them to the alternative approaches necessary to employ a situation-specific approach. Depending on the individual, this in-service level of training should probably occur between the officer’s 2nd and 5th years of service.
Since the average length of service for officers accidentally killed in the line of duty is about 10 years, they should receive additional in-service training between their fifth and tenth years of

46
service. At this point, less emphasis should be placed on using a “one-configuration-fits-all” approach and more attention should be directed toward the proper application of the techniques learned in training. It is important that primary responsibility for approach selection remain solely with the officer. However, supervisors should continue to monitor the officer’s traffic stop protocol and provide direction whenever any unsafe behavior is observed.
CO NCLUSIO N
Determining an “optimal” patrol vehicle configuration for traffic stops is a complicated and challenging process because the patrol vehicle must serve two essential, yet equally different, functions; (1) to protect an officer from being struck by adjacent traffic and (2) to provide effective cover for an officer in the event of attack by an armed motorist. The problem is compounded even further by the fact that many of the variables affecting patrol vehicle conspicuity directly conflict with those influencing collision survivability. This means that, while the attributes of one particular vehicle configuration may reduce the risk of an officer being struck by an errant vehicle, they may also increase an officer’s vulnerability to attack or reduce the patrol vehicle’s conspicuity, thereby increasing the likelihood of a collision.
The patrol vehicle configuration selected should be versatile and possess all of the elements necessary to offer an acceptable balance of protection. Although the historical data indicates that an officer is more likely to be struck by an errant vehicle than shot by an armed motorist, the importance of tactical considerations cannot be totally disregarded. However, the decision to place more emphasis on protection from one threat over another must be based on a realistic assessment of the needs of the police agency making the selection.
Of the two patrol vehicle configurations found to be most effective against collisions, the “in-line” position (Configuration #1) appears to meet the demands for both versatility and protection. The “in-line” position presents five distinct advantages not offered by the “angled” position: (1) it provides increased protection for officers sitting inside the patrol vehicle, (2) it allows officers to approach stopped vehicles from either the right or left side, (3) it can still be used effectively in locations with adjacent barriers, such as guardrails, (4) the patrol vehicle’s fixed forward lighting does not pose a hazard to oncoming motorists at night, and (5) it requires very little modification to existing training programs.
Even though the angled position does provide a higher level of protection to pedestrian officers in some situations, it requires them to approach the stopped vehicle exclusively from the right side. The debate concerning the right-side approach involves officers walking between the patrol car and the stopped vehicle or going around the back of the patrol car. Crossing between the vehicles exposes officers to the possibility of being pinned between the two vehicles in a collision. Others contend that walking around the rear of their patrol vehicle to approach on the right requires officers to turn their back to the stopped vehicle during the approach and extends the length of the stop. The advantages of the angled position are increased conspicuity, particularly during daylight, and increased safety while exiting the patrol vehicle.
R ECOM M E N DATIO NS
Regardless of how an officer chooses to position his/her patrol vehicle, s/he must always remember that each stop or incident is both unique and dynamic. The very act of stopping a patrol vehicle in or adjacent to high-speed traffic is inherently dangerous and it is impossible to

47
design a single patrol vehicle configuration that will provide equal protection for every set of circumstances. Not only is it important for police officers to understand all of the available options for positioning their patrol vehicle, they must also be prepared to adapt as circumstances at the scene change and to capitalize on every available opportunity for reducing risk.
The purpose of this chapter is not to identify best practices and policies for officers. Its main intent is to identify advantages and disadvantages of vehicle and officer positioning during traffic stops and other roadside contacts through computer simulations. These simulations, which are verified by the reconstruction of actual high-speed rear-end collisions, provide information to officers so they can make informed decisions on how to position themselves, and their vehicles.
Agencies should review their current policies and consider all options when formulating new policies on vehicle stops and other roadside contacts. A multi-level approach to training officers should be provided.
References
1Federal Bureau of Investigation. (2004). Law enforcement officers killed and assaulted, 2004. Washington, D.C.
2Hunt, J. (2004). Safe Stops: An analysis of collisions, practices, and patrol vehicle positioning during traffic stops. New York State Police. Albany, New York.
3Chen, R., Geraghty, B., Nichols, G., & Ridenour, J., Jr. (2003). Police vehicle orientation during traffic stops: Protecting pedestrian officers from adjacent traffic. (SAE Technical Paper Series No.2003-01-0886). Warrendale, Pennsylvania.
4Cerrelli, E. (1997). Fatal crash involvements – what are the odds? National Highway Traffic Safety Administration, Research Note. Washington, D.C.

Afterword

49
A F T E R W O R D
While it is impossible to eliminate all potential sources of danger for officers conducting traffic stops and other roadside contacts, we can make important strides in improving officers’ safety. By identifying and analyzing the various dimensions that contribute to or detract from officer roadside safety, we cast light upon the strengths and weaknesses existing within our individual organizations, as well as at state and national levels. In the 2006 Staff Report, we have explored a number of safety measures in order to better understand their current effectiveness; new fronts where progress may be made; and potential challenges to improving existing laws, policies, and technologies.
This report considered behavioral aspects of the motoring public; examined equipment designed to enhance roadside visibility; estimated the level of danger typically experienced by officers conducting traffic stops; examined public awareness of move-over laws as well as penalties for violators; suggested potentially useful avenues for future research; and advocated efforts toward improving records collection and data quality so that we may better understand whether our combined efforts are effective in mitigating risk to officers. The following recommendations are based on the findings presented in the 2006 Staff Report:
• Build public awareness of the danger posed to law enforcement officers during traffic stops and other roadside contacts, as well as laws requiring motorists to move over or slow down upon approaching police vehicles with lights activated. Public awareness may be developed through multiple means, including educational media campaigns and increased signage warning motorists of move-over laws and penalties.
• Consider, promote, and provide training a) to officers, to reinforce safe behavior during roadside contacts, as well as complete and accurate reporting of incidents; b) to motorists, to promote safe driving and to develop understanding of their responsibilities upon approaching emergency vehicles; and c) to court officials, who are responsible for complete and accurate recording of case information related to move-over violations.
• Invest in improved emergency warning systems and retro-reflective striping for patrol vehicles, as well as reflective clothing for officers that meet accepted high-visibility standards in order to increase officer and vehicle conspicuity while conducting roadside contacts.
• Review and modify existing policies and procedures aimed at preserving or improving officer roadside safety. Each agency should strive to create, implement, and maintain internal systems of review, and continually make changes as our multi-dimensional understanding of traffic stop safety is developed and refined.
• Identify and engage in relevant research projects aimed at further developing our understanding of officer risk and how to enhance safety. Numerous questions remain regarding the factors that improve or compromise officer roadside safety.
50
• Develop electronic database systems for recording, maintaining, and sharing relevant information more effectively and efficiently among stakeholders. The ability to both understand the scope of the safety issue and to engage in meaningful research relies on complete and accurate data, especially national-level data.
In conclusion, the issue of how best to improve officer safety during traffic stops and other roadside contacts is not likely to be resolved through enforcement alone; nor do equipment or training hold the only key. Rather, a coordinated effort by multiple stakeholders aimed at addressing the range of concerns associated with officer safety is essential if progress is to be made. In contributing to a body of knowledge regarding roadside safety, the 2006 Staff Report has identified and discussed some of the major concerns and recommended future action. Our goal – the continuing improvement of officer safety – may ultimately depend on how we attend to those concerns in the future.

Appendices

52
Move - ove r L aws by St ate*
A P P E N D I X A
State
Mo
ve-O
ver
Law
?1
Legal Citation2
Effective Date2
Min/Max Fine3
Court Costs?4
Jail Time in Law?
Mu
ltip
lier
?5
Multiplier CauseMultiplier
EffectPoints?
Speed Requirement
Incl
ud
ed V
ehic
les
6
NotesY/N $ Y/N Length?
Fata
lity
Inju
ry
No
n-I
nju
ry C
rash
Mu
ltip
le V
iola
tio
n
Alc
oh
ol-
Invo
lved
Spec
ial T
raff
ic Z
on
e
Incr
ease
d F
ines
Incr
ease
d J
ail T
ime
Lice
nse
Su
spen
sio
n
Nee
ded
for
susp
ensi
on
Pts
/mo
s
# fo
r m
ove
-ove
r vi
ola
tio
n
Alabama YAla. Code § 32-5A-52.1
07-01-06 $100 / $500 Y Y10-90 days
12/24 < 50 mph E
Alaska YAlaska Stat. §
28.35.18509-02-04 $150 Y x x x x 12/12 2
“reasonable and prudent”
E
Class A misdemeanor if causes personal
injury - requires court appearance. Increased penalties in work zones.
Arizona YAriz. Rev. Stat.
§ 28-775 (E)04-18-05
(Amended)$75
(Average)Y $84 8/12 2
“safe speed for road conditions”
E
Arkansas YArk. Code § 27-51-310
04-04-03 $35 / $500 Y <90 days 14/12 No speed
requirementE
Court can also order up to seven days of
community service for each infraction.
California YCalifornia
Vehicle Code § 21809
01-01-07 $50 4/12 “slow to a
reasonable and prudent speed”
E, R
Report to the California Legislature regarding the effect of the law
is required before 1/01/2008. Unless extended, law is
automatically repealed 1/01/2009.
Colorado YColo. Rev. Stat.
§ 42-4-70507-01-05 $10 / $300 Y
10-90 days
Y x x x x 12/12 4“safe speed for road
conditions”E
Connecticut N 10/24
Delaware Y
Del. Code Ann. tit. 21, § 4134(b)
(amended)
07-01-07 14/12 “safe speed” E
Florida YFla. Stat. §
316.12607-01-02 $60 / $500 Y $60 Y x x x x x 12/12 3
“20 mph less than posted limit”
E, RFines paid to AG’s
Crimes Compensation Trust Fund.
Georgia YGa. Code Ann.
§ 40-6-1607-01-03 $500 15/24
“reasonable and proper speed”
E, M, R
Hawaii N NA
Idaho YIdaho Code §
49-62407-01-06 12/12 “safe speed” E
Illinois Y625 Ill. Comp. Stat. § 11-907
07-11-03$100 /
$10,000 Y x x x x x 15/12 “safe speed” E, M
Classified as a business offense. Factor of
aggravation is added to offense if alcohol is
involved.
Indiana YInd. Code § 9-21-8-35
07-01-00
$163 (Waiver w/ court costs)/
$10,000
Y Y x x x x 18/24 “safe speed”E, M,
RClass A infraction
Iowa YIowa Code §
321.323A07-01-02 $50 Y $30 6/72
“reasonable and proper speed”
E, M, R
Kansas YKan. Stat. Ann.
§ 8-153007-01-00 $60 Y $66 NA “safe speed”
E, M, R
Passed 8-1531 effective 7/2007 for maintenance
vehicles and highway workers.
Kentucky YKy. Rev. Stat.
Ann. § 189.93006-24-03 $60 / $500 Y < 30 days 6/24 “safe speed”
E, M, R
Louisiana YLa. Rev. Stat. §
32.12508-15-01
$167 (Waiver w/ court
costs)Y NA 25 mph E
Maine YMe. Rev. Stat. Ann. tit. 29-A,
§ 2054-909-01-05 $250 Y $61 12/12
careful and prudent speed
E Violators must be adjudicated.
* as of 10/10/2006.

53
A P P E N D I X A
State
Mo
ve-O
ver
Law
?1
Legal Citation2
Effective Date2
Min/Max Fine3
Court Costs?4
Jail Time in Law?
Mu
ltip
lier
?5
Multiplier CauseMultiplier
EffectPoints?
Speed Requirement
Incl
ud
ed V
ehic
les
6
NotesY/N $ Y/N Length?
Fata
lity
Inju
ry
No
n-I
nju
ry C
rash
Mu
ltip
le V
iola
tio
n
Alc
oh
ol-
Invo
lved
Spec
ial T
raff
ic Z
on
e
Incr
ease
d F
ines
Incr
ease
d J
ail T
ime
Lice
nse
Su
spen
sio
n
Nee
ded
for
susp
ensi
on
Pts
/mo
s
# fo
r m
ove
-ove
r vi
ola
tio
n
Maryland N 8/24 Referred to Committee in CY2005.
Massachusetts N NA
HB 1966 referred by Transportation
Committee for study on 6/22/2006.
Michigan YMich. Comp.
Laws § 257.653a
03-28-01 $80 / $500 Y $55 Y < 2 years Y x x x x 6/24 2 “safe speed”E, M,
RFined additional $40 Justice Assessment.
Minnesota YMinn. Stat. §
169.18, Sub1106-01-01 $60 Y $72 NA
No speed requirement
E, R $10 State Law Library fee.
Mississippi N NA
Missouri YMo. Rev. Stat. §
304.02206-29-06 $1000 Y < 1 year 8/18 “safe speed” E, R Class A misdemeanor.
Montana YMont. Code Anno., § 61-
8-34604-17-03 $10 / $100 Y $35 Y x x 30/36 2
reduce and maintain a safe
speedE
Nebraska N 12/24
Nevada YNev. Rev. Stat.
§ 484.36410-01-03
$180 (Waiver w/ court
costs)Y 12/12 4
“Reasonable and proper speed, less
than the posted speed limit.”
E
New Hampshire
YN.H. Rev.
Stat. Ann. § 265:37-a
01-01-05 12/12 “maintain a reduced
speed”E
New Jersey N 12/36
Two proposed bills in legislature. One for
recovery vehicles and one for emergency
vehicles. Proposed fine $50 for both.
New Mexico YN.M. Stat. §
66-7-33206-17-05
$126 (Average)
Y $35 12/12 3“reasonable and
prudent speed”E
New York N 11/18
Called “Ambrose-Searles Act” - Assemby Bill A02433 - Referred
to Ways and Means Committee 6/23/2006
North Carolina YN.C. Gen. Stat.
§20-157(f)07-01-06 $250 Y $110 Y x x x x x 12/36 3
“slow the vehicle and maintain a safe
speed”E, R
Court discretion in Class 1 misdemeanor
and felony cases.
North Dakota YN.D. Cent.
Code, § 39-10-26
03-21-01 $60 Y x 12f/UL 2“reduce the speed of
the vehicle”E
Applies only to emergency vehicles when flashing lights
are in use.
Ohio YOhio Rev. Code
§ 4511.21309-28-99 $150 Y $80 Y x 12/24 2
“reduce the speed of the vehicle”
E Minor misdemeanor.
Oklahoma YOkla. Stat. tit. 47, § 11-314
11-01-02 $5 / $500 Y Y <10 days Y x x x 10/60 “Reduce to a safe
speed”E
Ontario (Canada)
Y
R.S.O. 1990, Highway
Traffic Act, Sec 159.1
10-16-02$400 / $2,000
Y Y x x x x 15/UL“slow down and
proceed with caution”
E
Court can suspend license for max 2 years. Fines for subsequent offenses can range from $1,000-$4,000
and up to 6 months in prison.
Oregon YOr. Rev. Stat. §
811.14701-01-04
$242 (Waiver w/ court
costs) Y Y x x x x NA “Reduce the speed” E Class B traffic violation.
Pennsylvania Y75 Pa. Cons. Stat. § 3327
09-08-06 $85 / $300 Y x x x x x 11/12
“at a speed greater than is reasonable and prudent under
the conditions”
E

54
A P P E N D I X A
State
Mo
ve-O
ver
Law
?1
Legal Citation2
Effective Date2
Min/Max Fine3
Court Costs?4
Jail Time in Law?
Mu
ltip
lier
?5
Multiplier CauseMultiplier
EffectPoints?
Speed Requirement
Incl
ud
ed V
ehic
les
6
NotesY/N $ Y/N Length?
Fata
lity
Inju
ry
No
n-I
nju
ry C
rash
Mu
ltip
le V
iola
tio
n
Alc
oh
ol-
Invo
lved
Spec
ial T
raff
ic Z
on
e
Incr
ease
d F
ines
Incr
ease
d J
ail T
ime
Lice
nse
Su
spen
sio
n
Nee
ded
for
susp
ensi
on
Pts
/mo
s
# fo
r m
ove
-ove
r vi
ola
tio
n
Rhode Island N NA
§56-5-1538 requires vehicles to drive at an appropriate reduced
speed (not move-over)
South Carolina YS.C. Code Ann.
§56-5-153807-20-02 $300 / $500 12/UL
“significantly reduce the speed of the
vehicle”
E, M, R
Class 2 misdemeanor
South Dakota YS.D. Codified
Laws §32-31-6.1
07-01-03 $500 Y < 30 days 15/12 2
“Vehicle with ‘red lights,’ come to a complete stop
and proceeds with caution. When
the vehicle is displaying ‘yellow’
warning lights, slow down 20 mph.”
E Class 2 misdemeanor
Tennessee YTenn. Code Ann. § 55-
8-13207-01-06 $100 / $500 12/12 6 “reduce speed”
E, M, R
Class C misdemeanor. No road signs.
Texas YTex. Trans.
Code § 545.157
09-01-03 $85 / $200 Y $93 Y Y x x x x 6/36 2“reduce speed by
20 mph”E
Violations with injury crash become a Class B
misdemeanor.
Utah YUtah Code §
41-6a-904 (2a)02-25-05
(Amended)$75
(Average)Y $37 Y 200/36 “reduce speed”
E, M, R
Class C misdemeanor.
Vermont YVt. Stat. Ann.
tit. 23, § 1050(b)
07-01-02$224
(Average) 10/24 5
“proceed with caution”
E Civil violation
Virginia YVa. Code Ann. § 46.2-921.1
04-01-02 $30 / $2,500 Y $57 Y<12
monthsY x x x x 3
“safe speed for highway conditions”
E Class 1 misdemeanor
Washington YWash. Rev.
Code § 46.61.212
07-24-05 $500 NA
“proceed with due caution and reduce
the speed of the vehicle”
E
West Virginia YW. Va. Code §
17C-14-9a06-09-02 $500 Y < 60 days Y x x x x 12/24 2
“15 mph on non-divided highways,
25 mph on any divided highway”
E
Wisconsin YWis. Stat. §346.072
07-01-01 $30 / $300 Y x x x x 12/12 3“Slow the motor
vehicle”E, M,
R
Wyoming YWyo. Stat. §
31-5-22407-01-02 $40 / $200 Y $20 Y < 180 days NA
“20 miles per hour less than posted
speed limit”E
1 “Move-Over Laws” are defined as duties upon approaching a stationary emergency (or public safety, etc.) that are displaying emergency lights.2 Includes the most current law identified by researchers. In some cases, the date may be when the law was enacted or enhanced. 3 Where identified in the statute, the minimum and maximum fine for each move-over violation was included. If fines were not easily available, then an average of fines levied by a sample of courts in that state for move-over violations was included. “Waiver” identifies those instances where average fines and court costs could not be separated for the sample of courts. 4 When available, a sample of information was obtained from actual court bond and waiver schedules from local state courts. These costs can vary from court to court within states, and only reflect a sample of the total variance in court costs across the state. 5 Multipliers are additional penalties and/or charges that are clearly stated in the “move over” section of the state’s law. Typically, it includes increased fines and/or jail time if the offense involves property damage, injury or death – or if alcohol is involved. 6 ”E”=Emergency; “M”=Maintenance; “R”=Recovery vehicles. Each state defines the type of vehicles covered under their “move-over” law differently. For purposes of this table, ambulance, fire, and police vehicles are considered “emergency” vehicles. Department of transportation vehicles are considered “maintenance” vehicles. Tow trucks and wreckers are considered “recovery” vehicles.

55
Ohio State Highway Patrol Move-Over-Related Patrol Car Crashes, 2001-2005
Event Date Day of Week Time Location Severity Alcohol-
RelatedRoad
ConditionLight
ConditionLocation of Impact
Road Contour
Officer Age
Months of
Service
1 01/02/01 Tue 10:10 AM IR 70 Injury No Dry Daylight Rear-End CurveGrade 31 62
2 01/04/01 Thur 6:58 AM DaytonRoad PDO No Ice
Dark –Not
LightedRear-End Straight
Grade 30 90
3 01/04/01 Thur 8:25 AM CR 31 PDO No Ice Daylight Angle StraightLevel 32 90
4 01/05/01 Fri 6:15 PM US 30 Injury No SnowDark –
Not Lighted
Rear-End Straight Grade 34 134
5 01/05/01 Fri 6:58 PM US 24 PDO No DryDark –
Not Lighted
Sideswipe, Same
DirectionStraightLevel 25 41
6 01/28/01 Sun 9:43 AM IR 80 PDO No Dry DaylightSideswipe,
Same Direction
StraightLevel 41 197
7 03/05/01 Mon 8:10 PM IR 70 PDO Yes1 DryDark –
Not Lighted
Sideswipe, Same
DirectionStraightLevel 28 28
8 03/25/01 Sun 10:31 PM IR 70 PDO No IceDark –
Not Lighted
Rear-End Straight Grade 26 35
9 04/23/01 Mon 11:04 PM IR 275 Injury Yes WetDark –Lighted
RdRear-End Straight
Grade 31 89
10 05/07/01 Mon 8:57 PM IR 75 PDO No WetDark –
Not Lighted
Rear-End CurveLevel 32 138
11 08/02/01 Thur 11:46 PM IR 70 PDO Yes DryDark –
Not Lighted
Sideswipe, Same
DirectionStraightLevel 30 17
12 11/05/01 Sat 9:15 PM IR 270 Fatal Yes DryDark –
Not Lighted
Rear-End Straight Grade 26 57
13 11/10/01 Sat 2:49 AM IR 77 Injury Yes DryDark –Lighted
RdRear-End Straight
Grade 29 1
14 11/10/01 Sat 11:43 AM IR 275 Injury No Dry Daylight Rear-End Straight Grade 42 283
15 12/09/01 Sun 7:33 AM US 250 PDO No Wet Dawn Angle CurveGrade 41 250
16 12/23/01 Mon 9:14 PM IR 475 Injury No IceDark –Lighted
RdRear-End Curve
Grade 29 34
17 01/06/02 Sun 5:30 PM Middleboro Road PDO No Snow Daylight Head-On Curve
Grade 24 16
18 02/04/02 Mon 10:42 AM IR 75 Injury No Snow Daylight Rear-End StraightLevel 47 247
19 02/22/02 Fri 7:55 AM SR 95 Injury No Ice Daylight Rear-End CurveGrade 26 40
A P P E N D I X B

56
Event Date Day of Week Time Location Severity Alcohol-
RelatedRoad
ConditionLight
ConditionLocation of Impact
Road Contour
Officer Age
Months of
Service
20 02/22/02 Fri 8:39 PM SR 307 Injury No DryDark –
Not Lighted
Rear-End StraightLevel 29 99
21 02/27/02 Wed 6:14 AM IR 80 PDO No Ice Daylight Rear-End StraightLevel 45 227
22 03/25/02 Mon 9:16 AM US 30 PDO No Snow Daylight Rear-End StraightLevel 24 19
23 03/25/02 Mon 9:43 AM IR 75 PDO No Snow Daylight Rear-End CurveLevel 35 113
24 03/25/02 Mon 1:29 PM US 20 Injury No Snow Daylight Rear-End StraightLevel 44 199
25 03/25/02 Mon 2:26 PM IR 80 Injury No Snow Daylight Rear-End Straight Grade 21 6
26 03/28/02 Thur 2:25 PM IR 71 Injury No Dry DaylightSideswipe,
Same Direction
Straight Grade 29 76
27 06/06/02 Thur 12:02 AM IR 77 Injury Yes Wet
Dark –Not
LightedRear-End Straight
Level 25 21
28 06/19/02 Wed 4:42 PM IR 80 PDO No Dry DaylightSideswipe,
Same Direction
StraightLevel 31 39
29 11/16/02 Sat 12:21 AM IR 475 Injury No IceDark –Lighted
RdRear-End Straight
Level 32 20
30 12/01/02 Sun 12:08 AM CR 21 PDO Yes Ice
Dark –Not
LightedHead-On Curve
Grade 27 21
31 12/01/02 Sun 9:07 PM SR 95 Injury No SnowDark –
Not Lighted
Sideswipe, Same
DirectionStraightLevel 23 21
32 02/15/03 Sat 4:47 PM IR 70 PDO No Ice Daylight Rear-End StraightLevel 25 29
33 02/17/03 Mon 9:13 AM IR 75 Injury No Snow Daylight Rear-End StraightLevel 26 17
34 02/17/03 Mon 8:06 PM IR 71 Injury No WetDark –
Not Lighted
Angle Straight Grade 28 57
35 02/22/03 Sat 10:12 PM SR 309 PDO No IceDark –
Not Lighted
Angle CurveLevel 22 17
36 02/23/03 Sun 9:28 AM IR 70 PDO No Ice Daylight Angle StraightLevel 37 116
37 02/23/03 Sun 10:06 AM IR 271 Injury No Snow Daylight Rear-End Straight
Level 35 10
38 02/25/03 Tue 8:02 AM CR 72 PDO No Ice Daylight Head-On CurveGrade 38 130
39 03/31/03 Mon 6:26 AM US 23 Injury No Ice DaylightSideswipe,
Same Direction
Straight Grade 28 1
40 05/05/03 Mon 8:34 PM IR 75 Injury Yes Dry Dusk Rear-End Straight Grade 32 114
A P P E N D I X B

57
Event Date Day of Week Time Location Severity Alcohol-
RelatedRoad
ConditionLight
ConditionLocation of Impact
Road Contour
Officer Age
Months of
Service
41 05/15/03 Thur 11:48 PM IR 77 PDO Yes WetDark –Lighted
RdRear-End Straight
Level 39 162
42 06/10/03 Tue 2:33 PM Pole Lane Road PDO No Dry Daylight
Sideswipe, Same
DirectionStraightLevel 31 125
43 06/12/03 Thur 7:34 PM IR 675 PDO No Wet Dusk Angle StraightLevel 32 120
44 07/20/03 Sun 12:42 PM DurkeeRoad Injury No Dry Daylight Rear-End Straight
Level 45 215
45 09/26/03 Fri 9:20 PM ClepperRoad PDO No Dry
Dark –Lighted
RdRear-End Straight
Grade 24 31
46 11/29/03 Sat 2:34 AM IR 75 Injury Yes WetDark –
Not Lighted
Sideswipe, Same
DirectionStraightLevel 28 26
47 12/12/03 Fri 10:09 PM US 52 Injury Yes DryDark –
Not Lighted
Angle StraightLevel 36 121
48 01/14/04 Wed 11:41 PM IR 90 Injury No SnowDark –
Not Lighted
Rear-End StraightLevel 27 34
49 01/19/04 Mon 3:30 PM IR 71 PDO No Snow Daylight Angle StraightLevel 29 58
50 01/25/04 Sun 4:34 PM US 52 Injury No Snow Daylight Rear-End CurveLevel 26 63
51 01/26/04 Mon 7:48 AM IR 75 Injury No Ice Daylight Angle StraightLevel 27 50
52 01/28/04 Wed 7:30 AM SR 117 Injury No Snow Dawn Rear-End CurveGrade 35 127
53 03/16/04 Tue 11:15 AM IR 90 Injury No Snow Daylight Rear-End Straight Grade 31 100
54 03/21/04 Sun 10:27 PM IR 71 Injury No IceDark –
Not Lighted
Angle StraightLevel 27 13
55 04/05/04 Mon 2:57 AM IR 70 Injury Yes DryDark –Lighted
Rd
Sideswipe, Same
DirectionStraight Grade 27 30
56 04/10/04 Sat 1:15 AM SR 14 PDO Yes DryDark –
Not Lighted
Sideswipe, Same
DirectionStraight Grade 39 161
57 04/14/04 Wed 6:27 AM SR 39 PDO No Ice Daylight Head-On Straight Grade 31 125
58 04/30/04 Fri 6:47 PM SR 315 Injury No Wet Daylight Angle CurveLevel 34 101
59 06/28/04 Mon 2:00 PM SR 105 Injury No Wet DaylightSideswipe, Opposite
DirectCurveGrade 30 46
60 07/21/04 Wed 11:13 PM US 23 PDO No DryDark –
Not Lighted
Sideswipe, Same
DirectionStraightLevel 32 27
A P P E N D I X B

58
Event Date Day of Week Time Location Severity Alcohol-
RelatedRoad
ConditionLight
ConditionLocation of Impact
Road Contour
Officer Age
Months of
Service
61 07/27/04 Tue 10:19 PM SR 315 PDO No DryDark –Lighted
Rd
Sideswipe, Same
DirectionStraightLevel 24 4
62 10/28/04 Thur 12:35 PM IR 80 Injury No Dry Daylight Rear-End StraightLevel 30 59
63 11/12/04 Fri 3:28 PM IR 71 PDO No Dry Daylight Angle StraightLevel 30 36
64 11/25/04 Thur 5:44 AM IR 75 Injury No WetDark –
Not Lighted
Angle StraightLevel 28 14
65 11/30/04 Tue 10:41 PM IR 75 PDO No WetDark –
Not Lighted
Angle StraightLevel 30 88
66 12/22/04 Wed 11:22 AM IR 75 PDO No Snow Daylight Angle StraightLevel 51 303
67 12/22/04 Wed 2:43 PM IR 71 PDO No Snow Daylight Rear-End Straight Grade 29 67
68 12/23/04 Thur 5:32 PM IR 71 Injury No SnowDark –Lighted
RdAngle Straight
Level 30 22
69 12/31/04 Fri 10:09 PM IR 275 PDO No WetDark –
Not Lighted
Rear-End StraightLevel 28 9
70 01/07/05 Fri 11:10 PM SteltzerRoad PDO Yes1 Wet
Dark –Not
LightedAngle Straight
Level 35 90
71 01/20/05 Thur 4:23 PM CR 184 PDO No Snow Dusk Head-On Straight Grade 51 339
72 01/22/05 Sat 6:35 AM US 23 PDO No IceDark –
Not Lighted
Rear-End CurveGrade 22 10
73 01/23/05 Sun 5:32 AM IR 480 Injury Yes Snow Dawn Rear-End CurveGrade 37 139
74 01/29/05 Sat 7:43 AM IR 80 Injury No SnowDark –
Not Lighted
Rear-End StraightLevel 28 46
75 03/02/05 Wed 12:51 AM IR 75 Injury No IceDark –
Not Lighted
Rear-End StraightLevel 31 11
76 04/26/05 Tue 8:35 PM US 22 Injury Yes WetDark –Lighted
RdRear-End Straight
Level 36 178
77 05/13/05 Fri 10:56 AM IR 71 Injury Yes Dry DaylightSideswipe,
Same Direction
StraightLevel 30 73
78 08/08/05 Mon 11:45 AM US 35 Injury No Dry DaylightSideswipe,
Same Direction
CurveLevel 27 88
A P P E N D I X B

59
Event Date Day of Week Time Location Severity Alcohol-
RelatedRoad
ConditionLight
ConditionLocation of Impact
Road Contour
Officer Age
Months of
Service
79 08/26/05 Fri 3:11 AM IR 70 Injury Yes DryDark –Lighted
Rd
Sideswipe, Same
DirectionStraightLevel 27 75
80 09/01/05 Thur 11:30 AM IR 71 PDO No Dry DaylightSideswipe,
Same Direction
StraightLevel 31 88
81 09/18/05 Sun 2:42 AM SR 4 Injury Yes DryDark –
Not Lighted
Sideswipe, Same
DirectionStraight Grade 30 54
82 12/09/05 Fri 12:47 AM IR 75 Fatal No IceDark –
Not Lighted
Angle StraightLevel 28 63
Source: Ohio State Highway Patrol Car Crash Database. Note: Crash location codes are as follows: IR = Interstate Route, US = United States Route, SR = Ohio State Route, CR = County Road.
A P P E N D I X B

60
Resul t s of Move - O ve r Cases in O hio Municipal Cour t s
A P P E N D I X C
Total Cases = 1,561 # %DEFENDANT PLEA
GUILTY 284 18.2%NOT GUILTY 217 13.9%NO CONTEST 134 8.6%WAIVER GUILTY 484 31.0%UNKNOWN/NO PLEA 441 28.3%
COURT RULINGGUILTY 476 30.5%NOT GUILTY 16 1.0%WAIVER GUILTY 843 54.0%DISMISSED 143 9.2%OPEN/WARRANT 29 1.9%UNKNOWN 55 3.5%
FINES<$10 200 12.8%$10-25 480 30.7%$26-50 399 25.6%$51-100 306 19.6%>$100 69 4.4%UNKNOWN 108 6.9%
COURT COST<$10 130 8.3%$10-50 167 10.7%$51-70 744 47.7%$71-100 363 23.3%>$100 55 3.5%UNKNOWN 103 6.6%
ADDITIONAL VIOLATION COSTS<$10 1,236 79.2%$10-50 91 5.8%$51-100 103 6.6%$101-500 89 5.7%>$500 42 2.7%
TOTAL COST<$10 116 7.4%$10-50 11 0.7%$51-100 571 36.6%$101-150 411 26.3%$151-200 298 19.1%>$200 155 9.9%
Total Cases = 1,561 # %CITATION/CASE YEAR
2004 576 36.9%2005 648 41.5%2006 337 21.6%
CITING AGENCYOHIO STATE PATROL 1,169 74.9%COUNTY SHERIFFS 181 11.6%CITY/VILLAGE PD 171 11.0%TOWNSHIP PD 37 2.4%OTHER 3 0.2%
SEXFEMALE 539 34.5%MALE 991 63.5%UNKNOWN 31 2.0%
AGE16-20 94 6.0%21-25 215 13.8%26-30 177 11.3%31-35 158 10.1%36-40 142 9.1%41-45 154 9.9%46-50 139 8.9%51-55 133 8.5%56-60 87 5.6%61-65 65 4.1%66-70 43 2.7%71-75 26 1.7%76+ 24 1.5%UNK. 104 6.7%
RACEWHITE/CAUCASION 677 43.4%AFRICAN AMERICAN 95 6.1%HISPANIC 5 0.3%ASIAN 8 0.5%UNKNOWN 775 49.7%
STATE OF RESIDENCEOHIO 1,169 74.9%OTHER 176 11.3%UNKNOWN 216 13.9%
ADDITIONAL VIOLATIONSNONE 1,321OVI/BAC/DUI 92 38.5%BELT/CHILD RESTRAINT 85 35.5%DUS/NO OP. LICENSE 81 33.8%PLATES/REG.VIOLATION 29 12.1%SPEED 28 11.7%RKLS. OP./F.T.C. 25 10.4%VEHICLE-RELATED 11 4.8%OTH. DRIVING-RELATED 10 4.3%

61
Table AFlorida Highway Patrol Vehicle Crashes, Old Emergency Warning System
Date Patrol Vehicle Activity Other Vehicle ActivityEmergency Equipment a Factor?
At-Fault Vehicle
08-01-2005 Parked in Roadway, unoccupied. Rear ended vehicle stopped for patrol car, pushed it into patrol car. No Civilian
08-16-2005 Attempted to exit off entrance ramp to intercept suspected violator. Driving in correct lane. Unknown Patrol
08-18-2005 Making left turn during emergency response. Failed to yield, did not see or hear. Yes Civilian
08-20-2005 Parked on shoulder. Vehicle lost control when cut off by another, struck Vehicle in roadway, then patrol car. Unknown Civilian
08-21-2005 Struck sign turning through median. No Patrol
08-22-2005 Struck animal crossing road during emergency response. Unknown Animal
08-28-2005 Parked in roadway. Did not see emergency equipment until too late to avoid. Yes Civilian
08-29-2005 Attempting to change lanes to stop motorcycles ahead of vehicle struck. Occupying lane patrol vehicle moved into. Unknown Patrol
08-30-2005 Patrol vehicle struck vehicle ahead. Had stopped to yield to police vehicle crossing intersection. No Patrol
08-31-2005 Stopped on wrong side of roadway in construction area.
Motorist believed flagged to proceed, did not see patrol vehicle stopped in roadway. Yes Civilian
09-01-2005 Attempting to overtake lost control passing traffic. No Patrol
09-02-2005 Approaching motorist from rear. Vehicle abruptly changed lanes. Unknown Civilian
09-03-2005 Parked in roadway, behind traffic cones. Drove through cones struck patrol vehicle. Yes Civilian
09-05-2005 Parked in inside emergency lane, traffic stop.
Lost control of vehicle when braking for slowed traffic. Yes Civilian
09-05-2005 Stopping suspected violator. Violator changed lanes to avoid a vehicle ahead that was slowing. No Civilian
09-12-2005 Patrol vehicle changing lanes to enter median. Violator occupied lane. No Patrol
09-14-2005 Parked in roadway at toll plaza. Violator struck rear of patrol vehicle. Yes Civilian
09-14-2005 Backing in construction zone, hit temporary barrier wall. None. No Patrol
09-22-2005 Parked in roadway. Struck rear of patrol vehicle. Yes Civilian
09-28-2005 Making a U-turn to pursue a suspected violator.
Struck left side of patrol car as tried to pass in a no passing zone. No Deputy
Sheriff
09-29-2005 Stopped suspected violator in emergency lane.
When subject exited vehicle is was in reverse and not park. No Civilian
A P P E N D I X D
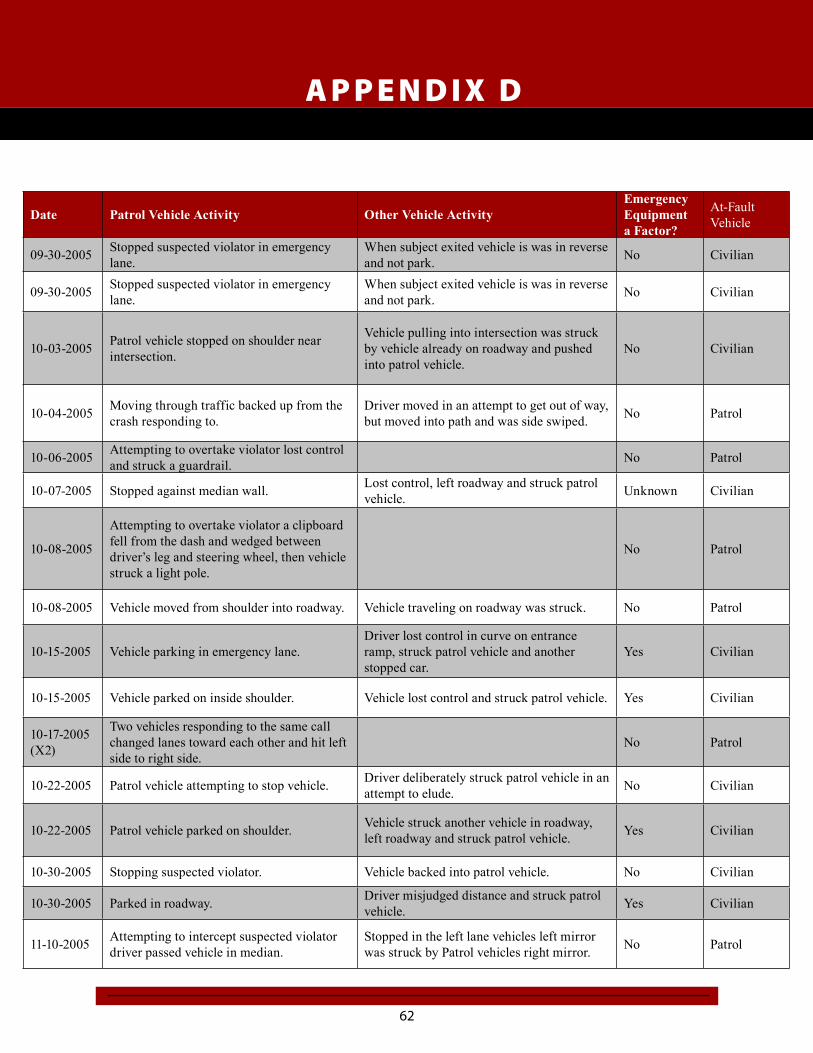
62
Date Patrol Vehicle Activity Other Vehicle ActivityEmergency Equipment a Factor?
At-Fault Vehicle
09-30-2005 Stopped suspected violator in emergency lane.
When subject exited vehicle is was in reverse and not park. No Civilian
09-30-2005 Stopped suspected violator in emergency lane.
When subject exited vehicle is was in reverse and not park. No Civilian
10-03-2005 Patrol vehicle stopped on shoulder near intersection.
Vehicle pulling into intersection was struck by vehicle already on roadway and pushed into patrol vehicle.
No Civilian
10-04-2005 Moving through traffic backed up from the crash responding to.
Driver moved in an attempt to get out of way, but moved into path and was side swiped. No Patrol
10-06-2005 Attempting to overtake violator lost control and struck a guardrail. No Patrol
10-07-2005 Stopped against median wall. Lost control, left roadway and struck patrol vehicle. Unknown Civilian
10-08-2005
Attempting to overtake violator a clipboard fell from the dash and wedged between driver’s leg and steering wheel, then vehicle struck a light pole.
No Patrol
10-08-2005 Vehicle moved from shoulder into roadway. Vehicle traveling on roadway was struck. No Patrol
10-15-2005 Vehicle parking in emergency lane.Driver lost control in curve on entrance ramp, struck patrol vehicle and another stopped car.
Yes Civilian
10-15-2005 Vehicle parked on inside shoulder. Vehicle lost control and struck patrol vehicle. Yes Civilian
10-17-2005(X2)
Two vehicles responding to the same call changed lanes toward each other and hit left side to right side.
No Patrol
10-22-2005 Patrol vehicle attempting to stop vehicle. Driver deliberately struck patrol vehicle in an attempt to elude. No Civilian
10-22-2005 Patrol vehicle parked on shoulder. Vehicle struck another vehicle in roadway, left roadway and struck patrol vehicle. Yes Civilian
10-30-2005 Stopping suspected violator. Vehicle backed into patrol vehicle. No Civilian
10-30-2005 Parked in roadway. Driver misjudged distance and struck patrol vehicle. Yes Civilian
11-10-2005 Attempting to intercept suspected violator driver passed vehicle in median.
Stopped in the left lane vehicles left mirror was struck by Patrol vehicles right mirror. No Patrol
A P P E N D I X D

63
Date Patrol Vehicle Activity Other Vehicle ActivityEmergency Equipment a Factor?
At-Fault Vehicle
11-13-2005 Unmarked vehicle stopped in roadway. Rear ended patrol vehicle. Yes Civilian
11-15-2005 Operator failed to place in park. Driverless vehicle struck another vehicle in roadway. No Patrol
11-16-2005 Patrol vehicle made U-turn to overtake suspected violator.
Driver uncertain as to actions of patrol vehicle and failed to react correctly, striking vehicle.
No Patrol
11-26-2005 Stopped across roadway to prevent escape of motorcycle that eluded officer earlier.
Motorcyclist in an attempt to flee, misjudged and struck patrol vehicle. No Civilian
12-03-2005 Parked on shoulder. Tow truck was moving vehicle from crash. Vehicle being moved struck patrol car. No Civilian
12-08-2005 Parked on shoulder. Vehicle lost control on wet roadway, left road and struck patrol vehicle. Unknown Civilian
12-11-2005 Parked in marked Safety Zone. Vehicle lost control on wet roadway and rear-ended patrol vehicle. Yes Civilian
12-12-2005 Parked on shoulder. Sideswiped by trailer pulled by vehicle. Yes Civilian
12-12-2005 Operator was crossing intersection against light. Vehicle did not see or hear patrol vehicle. Unknown Patrol
12-16-2005 Parked in inside emergency lane.
One vehicle slowed for traffic in area of patrol car, second vehicle did not. The rearmost vehicle struck the vehicle ahead which traveled off the roadway striking the patrol vehicle.
Yes Civilian
12-21-2005 Crossing intersection against traffic light.A motorcycle non-contact with patrol car. Lost control of bike attempting to avoid patrol car.
Yes Civilian
12-23-2005 Moving through slow heavy traffic responding to call.
Driver attempted to move out of way and inadvertently moved in the opposite direction.
No Civilian
12-27-2005 Moving vehicle in parking lot at traffic stop, struck pole. No Patrol
01-12-2006 Moved onto entrance ramp from main portion of expressway.
On entrance ramp did not see patrol car coming from main portion of roadway. No Patrol
01-16-2006 Crossing intersection on red signal. Did not see/hear patrol vehicle entered intersection and struck patrol vehicle. Unknown Patrol
A P P E N D I X D

64
Date Patrol Vehicle Activity Other Vehicle ActivityEmergency Equipment a Factor?
At-Fault Vehicle
01-22-2006 Stopped on shoulder.Driver could not slow for traffic ahead and to avoid collision, drove onto shoulder striking patrol vehicle.
Yes Civilian
01-23-2006Entering roadway from stop street. Unknown if gave crossing traffic sufficient time to yield.
Crossing intersection on through roadway. Was not wearing required corrective lenses. Unknown Mutual
01-26-2006 Parked in roadway due to previous crash. Failed to stop and struck rear of patrol car. Yes Civilian
01-28-2006 Making U-turn to overtake speeding vehicle.
Passing by vehicle on shoulder. Patrol vehicle left front struck right side. No Patrol
01-29-2006Responding to call slowed for vehicle ahead and was struck by City Police vehicle in rear.
Vehicle ahead slowed upon seeing patrol unit approach but stayed in lane. When trooper slowed for this vehicle he was rear ended by a City Police unit responding to the same call.
No Civilian/Other LEO
02-05-2006 Pulling vehicle over to shoulder. Traveling behind patrol vehicle failed to stop. Yes Civilian
02-10-2006 Tire blew out, causing driver to spin. Truck traveling beside patrol vehicle in next lane was struck by patrol vehicle. No Mechanical
02-16-2006 Hit curb flattened tires, bent rims. No Patrol
02-16-2006 Stopped on shoulder. After dropping a cigarette vehicle crossed edge line and sideswiped vehicle. Yes Civilian
02-22-2006 Making U-turn to overtake suspected violator.
Vehicle was approaching patrol vehicle in lane to patrol vehicles left side. Failed to yield to patrol vehicle.
NoStated saw lights
Civilian
02-22-2006 Crossing intersection against signal. Entered intersection on light and struck side of patrol vehicle with front. Yes Civilian
A P P E N D I X D
Table BFlorida Highway Patrol Vehicle Crashes, New Emergency Warning System

65
Date Patrol Vehicle Activity Other Vehicle ActivityEmergency Equipment a Factor?
At-Fault Vehicle
09-30-2005 Lost control while attempting to intercept a vehicle on wet roadway. No Patrol
10-29-2005 Struck other vehicles at end of pursuit. No Patrol
12-08-2005 Slid off wet roadway while responding to crash call. No Patrol
12-18-2005 Parked on shoulder.Vehicle lost control in roadway, left road and struck our vehicle and a Sheriff’s Department vehicle.
Yes Civilian
12-21-2005 Traveling down paved median responding to crash, apparently lights only.
Vehicle turned into grassy median and struck patrol car. Yes Civilian
02-10-2006 Stopped vehicle in inside emergency lane. Driver put vehicle in reverse instead of park, backed and struck patrol vehicle. No Civilian
A P P E N D I X D