Embed Size (px)
Citation preview

CPD11, 3937–3971, 2015
Laurentide Ice Sheetbasal temperatures atthe Last Glacial Cycle
as inferred fromborehole data
C. Pickler et al.
Title Page
Abstract Introduction
Conclusions References
Tables Figures
J I
J I
Back Close
Full Screen / Esc
Printer-friendly Version
Interactive Discussion
Discussion
Paper
|D
iscussionP
aper|
Discussion
Paper
|D
iscussionP
aper|
Clim. Past Discuss., 11, 3937–3971, 2015www.clim-past-discuss.net/11/3937/2015/doi:10.5194/cpd-11-3937-2015© Author(s) 2015. CC Attribution 3.0 License.
This discussion paper is/has been under review for the journal Climate of the Past (CP).Please refer to the corresponding final paper in CP if available.
Laurentide Ice Sheet basal temperaturesat the Last Glacial Cycle as inferred fromborehole dataC. Pickler1, H. Beltrami2,3, and J.-C. Mareschal1
1GEOTOP, Centre de Recherche en Géochimie et en Géodynamique, Universitédu Québec à Montréal, Canada2Climate & Atmospheric Sciences Institute and Department of Earth Sciences, St. FrancisXavier University, Antigonish, Nova Scotia, Canada3Centre ESCER pour l’étude et la simulation du climat à l’échelle régionale, Université duQuébec à Montréal, Canada
Received: 25 June 2015 – Accepted: 3 August 2015 – Published: 27 August 2015
Correspondence to: H. Beltrami ([email protected])
Published by Copernicus Publications on behalf of the European Geosciences Union.
3937
CPD11, 3937–3971, 2015
Laurentide Ice Sheetbasal temperatures atthe Last Glacial Cycle
as inferred fromborehole data
C. Pickler et al.
Title Page
Abstract Introduction
Conclusions References
Tables Figures
J I
J I
Back Close
Full Screen / Esc
Printer-friendly Version
Interactive Discussion
Discussion
Paper
|D
iscussionP
aper|
Discussion
Paper
|D
iscussionP
aper|
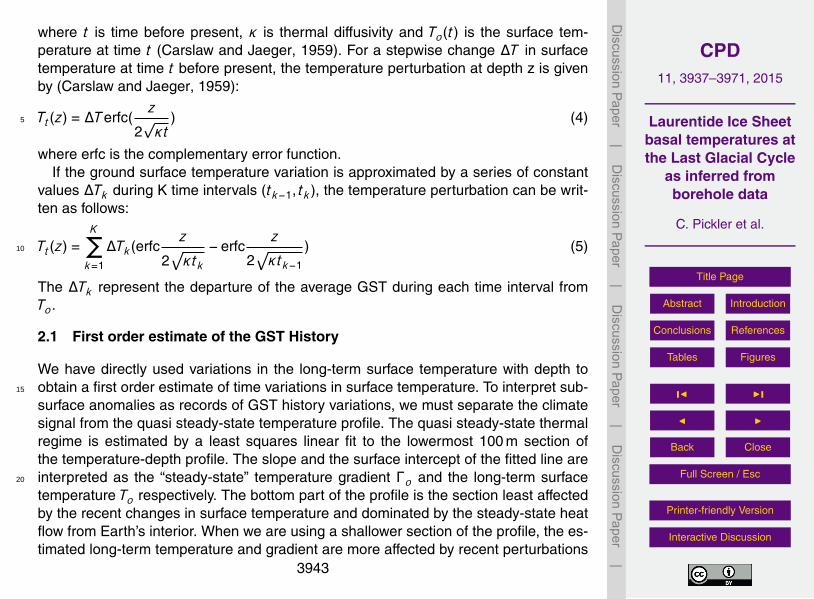
Abstract
Thirteen temperature-depth profiles (≥1500 m) measured in boreholes in eastern andcentral Canada were inverted to determine the ground surface temperature historiesduring and after the last glacial cycle. The sites are located in the southern part ofthe region covered by the Laurentide Ice Sheet. The inversions yield ground surface5
temperatures ranging from −1.4 to 3.0 ◦C throughout the last glacial cycle. These tem-peratures, near the pressure melting point of ice, allowed basal flow and fast flowingice streams at the base of the Laurentide Ice Sheet. Despite such conditions, whichhave been inferred from geomorphological data, the ice sheet persisted throughout thelast glacial cycle. Our results suggest some regional trends in basal temperatures with10
possible control by internal heat flow.
1 Introduction
The impact of future climate change on the stability of the present-day ice sheets inGreenland and Antarctica is a major concern of the scientific community (e.g. Gomezet al., 2010; Mitrovica et al., 2009). Satellite gravity measurements performed dur-15
ing the GRACE mission suggest that the mass loss of the Greenland and Antarcticglaciers has accelerated during the decade 2002–2012 (Velicogna and Wahr, 2013).Over the past two decades, mass loss from the Greenland Ice Sheet has quadrupledand contributed to a fourth of global sea level rise from 1992 to 2011 (Church et al.,2011; Straneo and Heimbach, 2013). In 2014, two teams of researchers noted that20
the collapse of the Thwaites Glacier Basin, an important component holding togetherthe West Antarctic Ice Sheet, was potentially underway (Joughin et al., 2014; Rignotet al., 2014). The collapse of the entire West Antarctic Ice Sheet would lead to rise insea level by at least 3 m. The present observations of the ice sheet mass balance areimportant. However, to predict the effects of future climate change on the ice sheets, it25
is necessary to fully understand the mechanisms of ice sheet growth, decay, and col-
3938

CPD11, 3937–3971, 2015
Laurentide Ice Sheetbasal temperatures atthe Last Glacial Cycle
as inferred fromborehole data
C. Pickler et al.
Title Page
Abstract Introduction
Conclusions References
Tables Figures
J I
J I
Back Close
Full Screen / Esc
Printer-friendly Version
Interactive Discussion
Discussion
Paper
|D
iscussionP
aper|
Discussion
Paper
|D
iscussionP
aper|
lapse throughout the past glacial cycles. The models of ice sheet dynamics during pastglacial cycles show that the thickness and elevation of the ice sheets and the thermalconditions at their base are key parameters controlling the basal flow regime and theevolution of the ice volume (Marshall and Clark, 2002; Hughes, 2009).
During the last glacial cycle (LGC), ∼12 0000–12 000 years BP, large ice sheets5
formed in the Northern Hemisphere, covering Scandinavia and almost all of Canada(Denton and Hughes, 1981; Peltier, 2002, 2004; Zweck and Huybrechts, 2005). Thegrowth and decay of ice sheets are governed mainly by ice dynamics and ice sheet-climate interactions (Oerlemans and van der Veen, 1984; Clark, 1994; Clark and Pol-lard, 1998). Ice dynamics are also strongly controlled by the underlying geological sub-10
strate and associated processes (Clark et al., 1999; Marshall, 2005). Clark and Pollard(1998) studied how the ice thickness and the nature of the geological substrate controlflow at the base of the glacier. They showed that soft beds, beds of unconsolidated sed-iment at relatively low relief, result in thin ice sheets that are predisposed to fast ice flowwhen possible. Hard beds, beds of high relief crystalline bedrock, on the other hand,15
provide the ideal conditions for the formation of larger, thick ice sheets that experiencestronger bed-ice sheet coupling and slow ice flow. Basal flow rate is also affected by thebasal temperatures, which play a key role in determining the velocity. However, the icesheet evolution models use basal temperatures that are poorly constrained because ofthe lack of direct data pertaining to thermal conditions at the base of ice sheets. The20
objective of the present study is to use borehole temperature depth data to estimatehow the temperatures varied at the base of the Laurentide Ice Sheet during the lastglacial cycle.
Temporal variations in ground surface temperatures (GST) are recorded by Earth’ssubsurface as perturbations to the “steady-state” temperature profile (e.g., Hotchkiss25
and Ingersoll, 1934; Birch, 1948; Beck, 1977; Lachenbruch and Marshall, 1986). Withno changes in GST, the thermal regime of the subsurface is governed by the outflow ofheat from Earth’s interior resulting in a profile where temperature increases with depth.In homogeneous rocks without heat sources, the “equilibrium temperature” increases
3939

CPD11, 3937–3971, 2015
Laurentide Ice Sheetbasal temperatures atthe Last Glacial Cycle
as inferred fromborehole data
C. Pickler et al.
Title Page
Abstract Introduction
Conclusions References
Tables Figures
J I
J I
Back Close
Full Screen / Esc
Printer-friendly Version
Interactive Discussion
Discussion
Paper
|D
iscussionP
aper|
Discussion
Paper
|D
iscussionP
aper|
linearly with depth. When changes in ground surface temperature occur and persist,they are diffused downward and recorded as perturbations to the semi-equilibrium ther-mal regime. These perturbations are superimposed on the temperature-depth profileassociated with the flow of heat from Earth’s interior. For periodic oscillations of thesurface temperature, the amplitude of the temperature fluctuations decreases expo-5
nentially with depth over a length scale proportional to the square root of the period(z ∝√κt), where κ is the thermal diffusivity of the rock. Long time persistent tran-
sients affect subsurface temperature to great depths. Hotchkiss and Ingersoll (1934)were the first to attempt and infer past climate from such temperature-depth profiles,specifically they estimated the timing of the last glacial retreat from temperature mea-10
surements in the Calumet copper mine in northern Michigan. Birch (1948) estimatedthe perturbations to the temperature gradient caused by the last glaciation and sug-gested a correction to heat flux determinations in regions that had been covered byice during the LGC. A correction including the glacial-interglacial cycles of the past400 000 years was proposed by Jessop (1971) to adjust the heat flow measurements15
made in Canada. It was only in the 1970s that systematic studies were undertaken toinfer past climate from borehole temperature profiles (Cermak, 1971; Sass et al., 1971;Beck, 1977). The use of borehole temperature data for estimating recent (<300 years)climate changes became widespread in the 1980s because of concerns about increas-ing global temperatures (Lachenbruch and Marshall, 1986; Lachenbruch, 1988). High20
precision borehole temperature measurements have been mostly made for estimatingheat flux in relatively shallow (a few hundred meters) holes drilled for mining explo-ration. Such shallow boreholes are suitable for studying recent (<500 years) climatevariations and the available data have been interpreted in many regional or globalstudies (e.g., Bodri and Cermak, 2007; Jaupart and Mareschal, 2011, and references25
therein). However, very few deep (≥1500 m) borehole temperature data are availableto study climate variations on the time scale of 10 to 100 kyr. Oil exploration wells areusually a few km deep but are not suitable because the temperature measurementsare not made in thermal equilibrium and lack the required precision. Nonetheless a
3940

CPD11, 3937–3971, 2015
Laurentide Ice Sheetbasal temperatures atthe Last Glacial Cycle
as inferred fromborehole data
C. Pickler et al.
Title Page
Abstract Introduction
Conclusions References
Tables Figures
J I
J I
Back Close
Full Screen / Esc
Printer-friendly Version
Interactive Discussion
Discussion
Paper
|D
iscussionP
aper|
Discussion
Paper
|D
iscussionP
aper|
few deep mining exploration holes have been drilled, mostly in Precambrian Shields,where temperature measurements can be used for climate studies on the time scaleof the LGC. In Canada, Sass et al. (1971) measured temperatures in a deep (3000 m)borehole near Flin Flon, Manitoba, and used direct models to show that the surfacetemperature during the last glacial maximum (LGM), ∼20 000 years BP, could not have5
been more than 5 K colder than present. Other Canadian deep boreholes tempera-ture profiles have since been measured revealing regional differences in temperaturesduring the LGM. From a deep borehole in Sept-Iles, Québec, Mareschal et al. (1999b)found surface temperatures to be approximately 10 K colder than present. This wasconfirmed by Rolandone et al. (2003b) who studied four deep holes and suggested10
that LGM surface temperatures were colder in eastern Canada than in central Canada.Chouinard and Mareschal (2009) examined eight deep boreholes located from cen-
tral to eastern Canada and observed significant regional differences in heat flux, tem-perature anomalies and ground surface temperature histories. On the other hand, stud-ies of deep boreholes in Europe lead to different conclusions for the Fennoscandian Ice15
Sheet which covered parts of Eurasia during the LGC (e.g., Demezhko and Shchapov,2001; Kukkonen and Jõeleht, 2003; Demezhko and Gornostaeva, 2015). Kukkonenand Jõeleht (2003) analyzed heat flow variations in the Baltic Shield and the RussianPlatform and found a 8±4.5 K temperature increase following the LGM. Demezhkoand Shchapov (2001) studied a ∼5 km deep borehole in the Urals, Russia, and found20
a postglacial warming of 12–13 K with basal temperatures below the melting point ofice during the LGM. This was confirmed by recent work indicating that temperatures inthe Urals were ∼−8 ◦C at the LGM (Demezhko and Gornostaeva, 2015).
In this study, we shall examine all the deep borehole temperature profiles measuredin central and eastern Canada in order to determine the temperature at the base of the25
Laurentide Ice Sheet, which covered the area during the LGC. The geographical extentof the study is confined to the southern portion of the Laurentide Ice Sheet becausedeep mining exploration boreholes have only been drilled in the southernmost part ofthe Canadian Shield.
3941

CPD11, 3937–3971, 2015
Laurentide Ice Sheetbasal temperatures atthe Last Glacial Cycle
as inferred fromborehole data
C. Pickler et al.
Title Page
Abstract Introduction
Conclusions References
Tables Figures
J I
J I
Back Close
Full Screen / Esc
Printer-friendly Version
Interactive Discussion
Discussion
Paper
|D
iscussionP
aper|
Discussion
Paper
|D
iscussionP
aper|
2 Theory
For calculating the temperature-depth profile, we assume that heat is transported onlyby vertical conduction and that the temperature perturbation is the result of a time-varying, horizontally uniform, surface temperature boundary condition. The tempera-ture at depth in the Earth, for a homogeneous, source-free half space with horizontally5
uniform variations in the surface temperature, can be written as:
T (z) = To +QoR(z)−z∫
0
dz′
λ(z′)
z′∫0
H(z′′)dz′′ + Tt(z) (1)
where To is the reference ground surface temperature (“steady-state”/long-term surfacetemperature), Qo is the reference heat flux (“steady-state” heat flux from depth), λ(z)is the thermal conductivity, z is depth, H is the heat generation, and Tt(z) is the tem-10
perature perturbation at depth z due to time-varying changes to the surface boundarycondition. R(z) is the thermal resistance to depth z, which is defined as:
R(z) =
z∫0
dz′
λ(z′)(2)
Thermal conductivity is measured on core samples, usually by the method of dividedbars (Misener and Beck, 1960). Radiogenic heat production is also measured on core15
samples. The temperature perturbation at depth z resulting from surface temperaturevariations can be written as (Carslaw and Jaeger, 1959):
Tt(z) =
∞∫0
z
2√πκt3
exp(−z2
4κt)To(t)dt (3)
3942
CPD11, 3937–3971, 2015
Laurentide Ice Sheetbasal temperatures atthe Last Glacial Cycle
as inferred fromborehole data
C. Pickler et al.
Title Page
Abstract Introduction
Conclusions References
Tables Figures
J I
J I
Back Close
Full Screen / Esc
Printer-friendly Version
Interactive Discussion
Discussion
Paper
|D
iscussionP
aper|
Discussion
Paper
|D
iscussionP
aper|
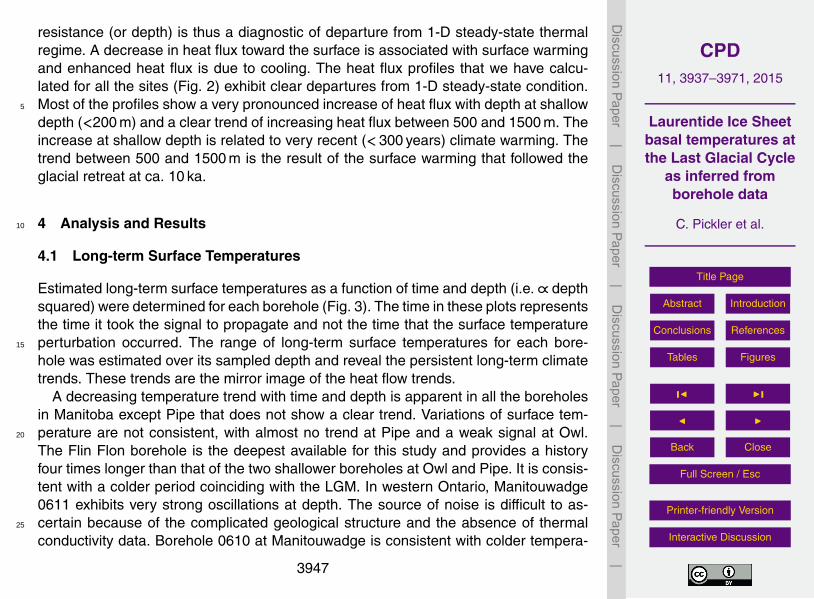
where t is time before present, κ is thermal diffusivity and To(t) is the surface tem-perature at time t (Carslaw and Jaeger, 1959). For a stepwise change ∆T in surfacetemperature at time t before present, the temperature perturbation at depth z is givenby (Carslaw and Jaeger, 1959):
Tt(z) = ∆Terfc(z
2√κt
) (4)5
where erfc is the complementary error function.If the ground surface temperature variation is approximated by a series of constant
values ∆Tk during K time intervals (tk−1,tk), the temperature perturbation can be writ-ten as follows:
Tt(z) =K∑k=1
∆Tk(erfcz
2√κtk−erfc
z
2√κtk−1
) (5)10
The ∆Tk represent the departure of the average GST during each time interval fromTo.
2.1 First order estimate of the GST History
We have directly used variations in the long-term surface temperature with depth toobtain a first order estimate of time variations in surface temperature. To interpret sub-15
surface anomalies as records of GST history variations, we must separate the climatesignal from the quasi steady-state temperature profile. The quasi steady-state thermalregime is estimated by a least squares linear fit to the lowermost 100 m section ofthe temperature-depth profile. The slope and the surface intercept of the fitted line areinterpreted as the “steady-state” temperature gradient Γo and the long-term surface20
temperature To respectively. The bottom part of the profile is the section least affectedby the recent changes in surface temperature and dominated by the steady-state heatflow from Earth’s interior. When we are using a shallower section of the profile, the es-timated long-term temperature and gradient are more affected by recent perturbations
3943

CPD11, 3937–3971, 2015
Laurentide Ice Sheetbasal temperatures atthe Last Glacial Cycle
as inferred fromborehole data
C. Pickler et al.
Title Page
Abstract Introduction
Conclusions References
Tables Figures
J I
J I
Back Close
Full Screen / Esc
Printer-friendly Version
Interactive Discussion
Discussion
Paper
|D
iscussionP
aper|
Discussion
Paper
|D
iscussionP
aper|
in the surface temperature. The shallower the section, the more recent the perturba-tion. Thus we determine how the estimated long-term surface temperature varies withtime by iterating through different sections of the temperature-depth profile. Using thescaling of Eq. (4), the time it takes for the surface temperature variation to propagateinto the ground and the depth of the perturbations are related by:5
t ≈ z2/4κ (6)
with κ thermal diffusivity, z is the depth, and t is time.This approach yields only a first order estimate because the temperature perturba-
tions are attenuated as they are diffused downward. However, the temporal variationof the long-term surface temperature is obtained by extrapolating the semi-equilibrium10
profile to the surface. The effect of a small change in gradient on the long-term surfacetemperature is proportional to the average depth where the gradient is estimated. Vari-ations in the calculated long-term surface temperature are thus less attenuated thanthe perturbations in the profile and may well provide a gross approximation of the GSThistory, but independent of the model assumptions in an inversion procedure.15
2.2 Inversion
In order to obtain a more robust estimate of the GST histories, we have inverted thetemperature-depth profiles for each site and, whenever profiles from nearby sites areavailable, we have inverted them jointly. The inversion consists of determining To, Qo,and the ∆Tk from the temperature-depth profile (Eq. 5). For each depth where temper-20
ature is measured, Eq. (5) yields a linear equation in ∆Tk . For N temperature measure-ments, we obtain a system of N linear equations with K +2 unknowns, To, Qo, and Kvalues of ∆Tk . Even when N ≥ K +2, the system seldom yields a meaningful solutionbecause it is ill-conditioned. This means that the solution is unstable and a small errorin the data results in a very large error in the solution (Lanczos, 1961). Different au-25
thors have proposed different inversion techniques to obtain the GST history from thedata (e.g., Vasseur et al., 1983; Shen and Beck, 1983; Nielsen and Beck, 1989; Wang,
3944

CPD11, 3937–3971, 2015
Laurentide Ice Sheetbasal temperatures atthe Last Glacial Cycle
as inferred fromborehole data
C. Pickler et al.
Title Page
Abstract Introduction
Conclusions References
Tables Figures
J I
J I
Back Close
Full Screen / Esc
Printer-friendly Version
Interactive Discussion
Discussion
Paper
|D
iscussionP
aper|
Discussion
Paper
|D
iscussionP
aper|
1992; Shen and Beck, 1991; Mareschal and Beltrami, 1992; Clauser and Mareschal,1995; Mareschal et al., 1999b). Here, to obtain a “solution” regardless of the number ofequations and unknowns and to reduce the impact of noise and errors on this solution,singular value decomposition is used (Lanczos, 1961; Jackson, 1972; Menke, 1989).This technique is well documented and further details can be found in Mareschal and5
Beltrami (1992); Clauser and Mareschal (1995); Beltrami and Mareschal (1995); Bel-trami et al. (1997).
2.3 Simultaneous inversion
As meteorological trends remain correlated over a distance on the order of 500 km(Beltrami et al., 1997), boreholes within the same region are assumed to have been10
affected by the same surface temperature variations and their subsurface tempera-ture anomalies are expected to be consistent. This holds only if the surface conditionsare identical for all boreholes. If these conditions are met, jointly inverting differenttemperature-depth profiles from the same region will increase the signal to noise ratio.Singular value decomposition was used to jointly invert the sites with multiple bore-15
holes. A detailed description and discussion of the methodology can be found in papersby Beltrami and Mareschal (1995) and Beltrami et al. (1997).
3 Data Description
We have used thirteen deep boreholes (≥1500 m) across eastern and central Canadato determine the temperature throughout and after the LGC. All the sites are located in20
the southern portion of the Canadian Shield, which was covered by the Laurentide IceSheet that extended over most of Canada during the LGC (Fig. 1). Borehole locationsand depths are summarized in Table 1. Detailed description of the measurement tech-niques as well as the relevant geological information can be obtained from the heat
3945

CPD11, 3937–3971, 2015
Laurentide Ice Sheetbasal temperatures atthe Last Glacial Cycle
as inferred fromborehole data
C. Pickler et al.
Title Page
Abstract Introduction
Conclusions References
Tables Figures
J I
J I
Back Close
Full Screen / Esc
Printer-friendly Version
Interactive Discussion
Discussion
Paper
|D
iscussionP
aper|
Discussion
Paper
|D
iscussionP
aper|
flow studies (Sass et al., 1971; Mareschal et al., 1999b, a; Rolandone et al., 2003a, b;Perry et al., 2006, 2009; Jaupart et al., 2014).
A description of eight sites, Flin Flon, Pipe, Manitouwadge 0610, Manitouwadge0611, Balmertown, Falconbridge, Lockerby, and Sept Iles, can be found in Rolandoneet al. (2003b) and Chouinard and Mareschal (2009). Five additional profiles (Owl, near5
Thompson, Manitoba, Victor and Craig Mines both near Sudbury, Ontario, Matagamiand Val d’Or, Québec) were analyzed. The Val d’Or borehole was logged in 2010 toa depth of ∼1750 m. It is situated 15 km east of the mining camp of Val d’Or, Québecin a flat forested area. The Matagami borehole is located near the mining camp ofMatagami, some 300 km north of Val d’Or. The Owl borehole, which was logged in10
1999 and 2001, is located ∼5 km from the Birchtree Mine and ∼8 km south of the cityof Thompson, Manitoba. The two other new boreholes, Craig Mine and Victor Mine,are located within the Sudbury structure, north-east of Lake Huron, in Ontario. TheCraig Mine borehole, near the town of Levack, north-west of Sudbury, was logged in2004. The deep mine was in operation when measurements were made and pumping15
activity was continuous to keep the deep mine galleries from flooding. The Victor Minesite was sampled in 2013, close to the community of Skead, north-east of Sudbury,Ontario. Victor Mine operated in 1959 and 1960 but exploration and engineering workis presently underway to prepare for reopening the mine at greater depth.
We found systematic variations of thermal conductivity at Flin Flon, Thompson (Owl),20
and Matagami, and we corrected accordingly (Bullard, 1939). We calculated the ther-mal resistance and obtained a temperature vs. thermal resistance profile that is almostlinear. We calculated the heat flux as the slope of the temperature-resistance and foundno discontinuity in heat flux along the profile (Table 1). For all the other sites that showno systematic variations in conductivity, we have used the mean thermal conductivity25
to calculate heat flux. Heat production was measured and found to only be significantat two sites, Lockerby (3 µW m−3) and Victor Mine (0.9 µW m−3), and therefore onlytaken into account at these sites. In absence of heat production and in steady-state,the heat flux does not vary with thermal resistance. Variations in heat flux with thermal
3946
CPD11, 3937–3971, 2015
Laurentide Ice Sheetbasal temperatures atthe Last Glacial Cycle
as inferred fromborehole data
C. Pickler et al.
Title Page
Abstract Introduction
Conclusions References
Tables Figures
J I
J I
Back Close
Full Screen / Esc
Printer-friendly Version
Interactive Discussion
Discussion
Paper
|D
iscussionP
aper|
Discussion
Paper
|D
iscussionP
aper|
resistance (or depth) is thus a diagnostic of departure from 1-D steady-state thermalregime. A decrease in heat flux toward the surface is associated with surface warmingand enhanced heat flux is due to cooling. The heat flux profiles that we have calcu-lated for all the sites (Fig. 2) exhibit clear departures from 1-D steady-state condition.Most of the profiles show a very pronounced increase of heat flux with depth at shallow5
depth (<200 m) and a clear trend of increasing heat flux between 500 and 1500 m. Theincrease at shallow depth is related to very recent (<300 years) climate warming. Thetrend between 500 and 1500 m is the result of the surface warming that followed theglacial retreat at ca. 10 ka.
4 Analysis and Results10
4.1 Long-term Surface Temperatures
Estimated long-term surface temperatures as a function of time and depth (i.e. ∝ depthsquared) were determined for each borehole (Fig. 3). The time in these plots representsthe time it took the signal to propagate and not the time that the surface temperatureperturbation occurred. The range of long-term surface temperatures for each bore-15
hole was estimated over its sampled depth and reveal the persistent long-term climatetrends. These trends are the mirror image of the heat flow trends.
A decreasing temperature trend with time and depth is apparent in all the boreholesin Manitoba except Pipe that does not show a clear trend. Variations of surface tem-perature are not consistent, with almost no trend at Pipe and a weak signal at Owl.20
The Flin Flon borehole is the deepest available for this study and provides a historyfour times longer than that of the two shallower boreholes at Owl and Pipe. It is consis-tent with a colder period coinciding with the LGM. In western Ontario, Manitouwadge0611 exhibits very strong oscillations at depth. The source of noise is difficult to as-certain because of the complicated geological structure and the absence of thermal25
conductivity data. Borehole 0610 at Manitouwadge is consistent with colder tempera-
3947

CPD11, 3937–3971, 2015
Laurentide Ice Sheetbasal temperatures atthe Last Glacial Cycle
as inferred fromborehole data
C. Pickler et al.
Title Page
Abstract Introduction
Conclusions References
Tables Figures
J I
J I
Back Close
Full Screen / Esc
Printer-friendly Version
Interactive Discussion
Discussion
Paper
|D
iscussionP
aper|
Discussion
Paper
|D
iscussionP
aper|
tures during the LGM but the Balmertown hole does not show any variation in long-termsurface temperature. Four profiles at Sudbury, are consistent with colder temperatureduring the LGM, but the amplitude of the trend varies between sites. Similar trends areobserved for the three easternmost holes in Québec with long-term temperatures onaverage 5 K lower near the bottom of the holes than near the surface.5
These first order estimates suggest colder surface temperatures during the LGM atmost of the sites. In order to better quantify the surface temperature changes, we mustturn to inversion and obtain the GST histories.
4.2 Individual inversions
The GST histories at all the studied sites for the time period of 100 to 100 000 years10
BP was inverted from the temperature-depth profiles. The time span of the GST historymodel consists of 16 intervals whose distribution varies logarithmically because theresolution decreases with time. A singular value cutoff of 0.08 was used for all theindividual profile inversions (Figs. 4–7). A summary of the inversion results can befound in Table 2. Two main episodes can be recognized in the GST histories: One is15
associated with a minimum temperature that occurred around the LGM at ca. 20 ka.The second is a warming observed at ca. 2–6 ka coinciding with the Holocene ClimaticOptimum (HCO), a warm period that followed the deglaciation (Lamb, 1995).
For the purpose of the discussion, we have grouped the sites sites that are fromthe same geographical region. We shall thus distinguish between Manitoba, western20
Ontario, the Sudbury area, and Québec.The sites from Manitoba, Flin Flon, Owl and Pipe, have not recorded a very strong
signal (Fig. 4). This may be in part because the present ground surface temperatureis very low; it is close to 0 ◦C in Thompson where intermittent permafrost is found.At Flin Flon, where the present ground temperature is near 3 ◦C, ground temperature25
variations were small. The surface temperature was minimum around the LGM andwas near the melting point of ice (−0.3 ◦C). For Pipe, little to no signal was recorded.We found that there was minimal change in the ground surface temperature (∼2.5 K
3948

CPD11, 3937–3971, 2015
Laurentide Ice Sheetbasal temperatures atthe Last Glacial Cycle
as inferred fromborehole data
C. Pickler et al.
Title Page
Abstract Introduction
Conclusions References
Tables Figures
J I
J I
Back Close
Full Screen / Esc
Printer-friendly Version
Interactive Discussion
Discussion
Paper
|D
iscussionP
aper|
Discussion
Paper
|D
iscussionP
aper|
in amplitude) over the past 100,000 years. For Owl, the amplitude of the temperaturechanges has doubled (∼5 K), with the minimum temperature (−2.4 ◦C) around the LGMand a warming around the HCO. Although this result is plausible, some uncertainty re-mains as Guillou-Frottier et al. (1996) noted high heat flux correlated with high thermalconductivity in the Thompson Belt. The elevated thermal conductivity is due to the pres-5
ence of vertical slices of quartzites, which increase thermal conductivity by a factor of1.7. Furthermore, the site is affected by a poorly resolved conductivity structure as ther-mal conductivity measurements vary in the deepest part of the borehole, between 2.21and 5.14 W m−1 K−1. The lateral heat refraction effects due to the thermal conductivitycontrast affect the temperature profiles and alter the GST history. For these reasons,10
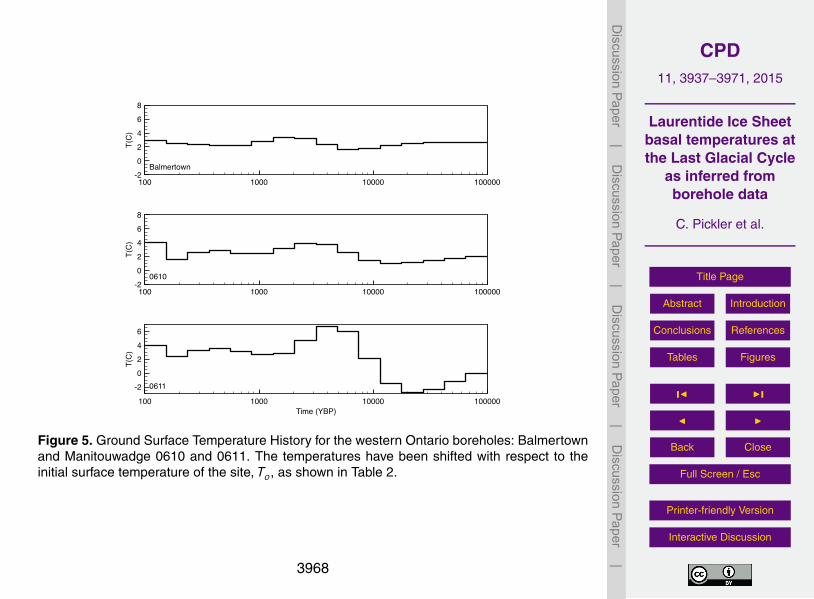
we have little confidence in the robustness of the Owl GST history reconstruction.In western Ontario (Balmertown, Manitouwadge 0610, and 0611), results at all sites
show minimum temperatures around the LGM, with a very weak minimum at Balmer-town (Fig. 5). However, the amplitude of the temperature change is much larger at Man-itouwadge 0611 (∼10 K) than Balmertown (∼2 K) and Manitouwadge 0610 (∼3 K). As15
the two Manitouwadge sites are only ∼40 km apart, this difference is surprising. WhileManitouwadge 0611 yields a plausible GST history, it appears to have an amplifiedsignal. The site is located in a complex geological structure and lacks thermal conduc-tivity data. There is also a change in the temperature gradient at 500 m, which cannotbe accounted for. In the absence of thermal conductivity data, we cannot consider the20
GST history for Manitouwadge 0611 as reliable.All four sites in the Sudbury region, Craig Mine, Falconbridge, Lockerby, and Vic-
tor Mine, have recorded minimal temperatures around the LGM (Fig 6). However, theminimum past temperatures for the region do vary between sites. The coldest mini-mum temperature occurs at Craig Mine. The amplitude of the temperature changes25
for the site (∼12 K) is much larger than those of the other sites, which vary between∼5–7 K. This difference is unexpected as these sites are all within the Sudbury cratonand should have recorded similar histories. The Craig Mine signal appears amplified,which could be the result of water flows induced by pumping at levels below 2000 m in
3949

CPD11, 3937–3971, 2015
Laurentide Ice Sheetbasal temperatures atthe Last Glacial Cycle
as inferred fromborehole data
C. Pickler et al.
Title Page
Abstract Introduction
Conclusions References
Tables Figures
J I
J I
Back Close
Full Screen / Esc
Printer-friendly Version
Interactive Discussion
Discussion
Paper
|D
iscussionP
aper|
Discussion
Paper
|D
iscussionP
aper|
the mine. We thus believe that the GST history for Craig Mine is not reliable. The min-imum temperatures at Lockerby and Victor Mine, 2.8 and 3.0 ◦C, are also the highestof the study. These are also the only two sites with non-negligible heat production, 3and 0.9 µW m−3 respectively. The corrections for heat production produce an increaseof the temperature gradient proportional to depth and result in an amplification of the5
warming signal in the profile. Consequently, the minimum and maximum temperatureswould be higher at these sites, Lockerby and Victor Mine, than those with negligibleheat production.
The GST histories from the three boreholes in Québec, Matagami, Val d’Or andSept Iles, display regional differences (Fig. 7). However, their minimum temperatures10
all occur around the LGM. The lowest minimum temperature occurred in this region,−1.4 ◦C at Sept Iles.
At all sites, excluding Pipe, there is warming following the LGM that can be asso-ciated with the HCO, a warm period whose maximal temperatures have been datedat 4.4–6.8 ka with palynological reconstructions from northern Ontario and northern15
Michigan (Boudreau et al., 2005; Davis et al., 2000).We have compared the ranges of temperature in the inverted GST histories with
those of the long-term surface temperature variations for all the sites (Table 4). Al-though the total range varies between sites from ∼2 to ∼8 K, the two methods yieldconsistent values that differ by less than 1 K at most of the sites. The warming trend20
in the long-term surface temperature variations is consistent with the inverted GSThistories. This correlation between the long-term surface temperature ranges and thepersistent long-term GST history trends suggests that our results are robust. All thelong-term surface temperature variations exhibit short period oscillations that are notpresent in the GST histories and do not clearly show the presence of the HCO. These25
oscillations could explain the discrepancy between the temperature ranges of the in-verted GST histories and that of the long-term surface temperature variations for FlinFlon and Pipe.
3950

CPD11, 3937–3971, 2015
Laurentide Ice Sheetbasal temperatures atthe Last Glacial Cycle
as inferred fromborehole data
C. Pickler et al.
Title Page
Abstract Introduction
Conclusions References
Tables Figures
J I
J I
Back Close
Full Screen / Esc
Printer-friendly Version
Interactive Discussion
Discussion
Paper
|D
iscussionP
aper|
Discussion
Paper
|D
iscussionP
aper|
4.3 Simultaneous Inversion
We have inverted simultaneously the boreholes of Thompson (Owl and Pipe), Mani-touwadge (0610 and 0611) and Sudbury (Craig Mine, Falconbridge, Lockerby, and Vic-tor Mine) to observe regional trends and to improve the signal to noise ratio (Fig. 8).For simultaneous inversion, the temperature-depth profiles were truncated to ensure5
a common depth for all the boreholes. This facilitates comparison and means that weare examining the subsurface temperature anomalies for the same time period. For allinversions, the minimum temperature occurs around the LGM and are followed by awarming associated with the HCO. While Owl and Manitouwadge 0611 have question-able individual inversions, the regions of Thompson and Manitouwadge are still simul-10
taneously inverted in an attempt to decrease the signal to noise ratio. For Thompson,the amplitude of the GST history temperature range is ∼4 K. As Pipe did not appear torecord a signal, the simultaneous inversion appears to have damped slightly the ques-tionable signal recorded at Owl. The amplitude difference for the Manitouwadge GSThistory is ∼8 K, between that of 0610 (∼3 K) and 0611 (∼10 K).15
The Sudbury simultaneous inversion was done with and without Craig Mine. Thiswas done to see whether the inclusion of Craig Mine, a site which is likely to havebeen affected by water flow, affects the reconstructions. Both inversions display similartrends, however, the differences lie in the amplitude variations. The inversion excludingCraig Mine yielded a ∆T of 7 K, similar to those of the individual inversions of Falcon-20
bridge (∼7 K), Lockerby (∼7 K) and Victor Mine (∼5 K). Upon inclusion of Craig Mine,∆T increased by 4 K, demonstrating the amplification effect of the site.
5 Discussion
The minimum temperatures of the GST histories occur around the LGM, representingthe basal temperatures of the Laurentide Ice Sheet. These temperatures vary spatially25
and range from -1.4−3.0oC, near the pressure melting point of ice. This spatial vari-
3951

CPD11, 3937–3971, 2015
Laurentide Ice Sheetbasal temperatures atthe Last Glacial Cycle
as inferred fromborehole data
C. Pickler et al.
Title Page
Abstract Introduction
Conclusions References
Tables Figures
J I
J I
Back Close
Full Screen / Esc
Printer-friendly Version
Interactive Discussion
Discussion
Paper
|D
iscussionP
aper|
Discussion
Paper
|D
iscussionP
aper|
ation is expected as numerous studies have demonstrated present-day spatial basaltemperature variability beneath the Antarctic and Greenland Ice Sheets (e.g., Dahl-Jensen et al., 1998; Pattyn, 2010; Schneider et al., 2006). The highest basal temper-atures occur within the Sudbury basin at Lockerby and Victor Mine. The region hasthe highest average heat flux of the Canadian Shield, ∼54mWm−2, implying higher5
than average crustal heat production (Perry et al., 2009). The lowest basal tempera-ture is recorded at Sept Iles, a region with the lowest heat flux of the studied regions,∼34mWm−2. These correlations suggest a link between heat flux and basal temper-atures. This is further supported by modelling work showing heat flux influences thethermal structure and properties of ice sheets, including basal temperatures and flow10
(Pollard et al., 2005). However, the Sept Iles basal temperature has been linked to itsproximity to the edge of the ice sheet and area of thinner ice (Rolandone et al., 2003b).Our studies support a possible link between basal temperature and heat flux along withice dynamics in the Laurentide Ice Sheet during the LGC but further modelling work isnecessary to confirm such a relationship. Variations in these parameters (heat flux and15
ice dynamics) could account for the differences observed in the basal temperatures ofthe Fennoscandian and Laurentide ice sheets.
The basal temperatures recorded, near the pressure melting point of ice, indicate thepossibility of basal flow and ice streams, two important factors affecting ice sheet evolu-tion. These processes have been suggested by geomorphological evidence presented20
by Dyke et al. (2002) and predicted by the ICE-5G model (Peltier, 2004). Basal flowhas the ability to transport large amounts of water from the interior of the ice sheet,leading to thinning of the ice sheet and climatically-vulnerable ice. It is postulated tobe a key factor in glacial terminations (Marshall and Clark, 2002). Furthermore, thesetemperatures demonstrate that the southern portion of the Laurentide Ice Sheet was25
not frozen to the bed, suggesting basal sliding. These conditions can lead to instability.Widespread basal sliding and increase surface meltwater could have been a factor re-sulting in the rapid collapse of the Laurentide Ice Sheet (Zwally et al., 2002). However,these basal temperatures and associated melt persisted prior to and throughout the
3952

CPD11, 3937–3971, 2015
Laurentide Ice Sheetbasal temperatures atthe Last Glacial Cycle
as inferred fromborehole data
C. Pickler et al.
Title Page
Abstract Introduction
Conclusions References
Tables Figures
J I
J I
Back Close
Full Screen / Esc
Printer-friendly Version
Interactive Discussion
Discussion
Paper
|D
iscussionP
aper|
Discussion
Paper
|D
iscussionP
aper|
LGM over more than 30 000 years with deglaciation only occurring rapidly during theearly Holocene (Carlson et al., 2008). While this indicates that basal temperatures nearthe pressure melting point of ice cannot be solely responsible for ice sheet instabilityand collapse, it demonstrates that they are a key parameter in ice sheet evolution, onethat ice sheet evolution models must take into account. Elevated basal temperatures,5
near or above the pressure melting point of ice, have been recorded in the present-day ice sheets (Fahnestock et al., 2001; Pritchard et al., 2012). Our results indicatethat alone this cannot be considered as an indication of ice sheet collapse. However,combined with other processes it could lead to instability and collapse.
6 Conclusions10
Thirteen deep boreholes from eastern and central Canada were analyzed to determinethe GST histories for the last 100 kyr. The long term trends are consistent betweensites. A warm period following the retreat of the ice sheet is inferred at ∼2–6 ka in theinverted GST histories, correlated to the Holocene Climatic Optimum.
The surface temperatures reached their minima during the LGM and post glacial15
warming started ca. 10 ka. The corresponding temperatures at the base of of the Lau-rentide Ice Sheet range from −1.4 to 3.0 ◦C, and are all near or above the pressuremelting point of ice. Such temperatures allow for basal flow and fast flowing ice streams,two important factors affecting ice sheet evolution, illustrating the need for models ofice sheet evolution to account for such a key parameters as basal temperature. Despite20
the suggestion that melting took place at its base, the Laurentide ice sheet persistedthroughout the LGM over more than 30 000 years. This demonstrates that basal tem-peratures near the melting point of ice do not indicate that an ice sheet is on the vergeof collapse. However, combined with other processes it could lead to instability andcollapse.25
The differences between GST histories at different sites raise other questions con-cerning the controls on temperatures at the base of ice sheets. Equilibrium between
3953

CPD11, 3937–3971, 2015
Laurentide Ice Sheetbasal temperatures atthe Last Glacial Cycle
as inferred fromborehole data
C. Pickler et al.
Title Page
Abstract Introduction
Conclusions References
Tables Figures
J I
J I
Back Close
Full Screen / Esc
Printer-friendly Version
Interactive Discussion
Discussion
Paper
|D
iscussionP
aper|
Discussion
Paper
|D
iscussionP
aper|
heat flow from the Earth’s interior and heat advection by glacial flow determines thetemperature at the boundary between the ice and the bedrock. The correlation be-tween higher heat flux and higher basal temperatures in the Sudbury region suggeststhat variations in crustal heat flux might account for some of the regional differences inbasal temperatures along with the dynamics of ice thickness controlled by the accumu-5
lation rate and the distance to the edge of the ice sheet.It is also noteworthy that similar deep borehole studies in Europe suggest that basal
temperatures beneath the Fennoscandian Ice Sheet during the LGC were much colderthan those observed in Canada (Perry et al., 2006). Because of the geological similar-ities between the two regions, this contrast is likely to be due to differences in climate10
and ice dynamics between Europe and North America during the LGC.
Acknowledgements. This work was supported by grants from the Natural Sciences and Engi-neering Research Council of Canada Discovery Grant (NSERC-DG, 140576948), a NSERC-CREATE award Training Program in Climate Sciences, the Atlantic Computational ExcellenceNetwork (ACEnet), and the Atlantic Canada Opportunities Agency (AIF-ACOA) to HB. H. Bel-15
trami holds a Canada Research Chair. C.Pickler is funded by a NSERC-CREATE Training Pro-gram in Climate Sciences based at St.Francis Xavier University.
References
Beck, A.: Climatically perturbed temperature gradient and their effect on regional and continen-tal heat-flow means, Tectonophysics, 41, 17–39, 1977. 3939, 394020
Beltrami, H. and Mareschal, J.: Resolution of ground temperautre histories inverted from bore-hole temperature data, Global Planet. Change, 11, 57–70, 1995. 3945
Beltrami, H., Cheng, L., and Mareschal, J. C.: Simultaneous inversion of borehole temperaturedata for determination of ground surface temperature history, Geophys. J. Int., 129, 311–318,1997. 394525
Birch, A. F.: The effects of Pleistocene climatic variations upon geothermal gradients, Am. J.Sci., 246, 729–760, 1948. 3939, 3940
Bodri, L. and Cermak, V.: Borehole Climatology, Elsevier, Amsterdam, 2007. 3940
3954

CPD11, 3937–3971, 2015
Laurentide Ice Sheetbasal temperatures atthe Last Glacial Cycle
as inferred fromborehole data
C. Pickler et al.
Title Page
Abstract Introduction
Conclusions References
Tables Figures
J I
J I
Back Close
Full Screen / Esc
Printer-friendly Version
Interactive Discussion
Discussion
Paper
|D
iscussionP
aper|
Discussion
Paper
|D
iscussionP
aper|
Boudreau, R., Galloway, J., Patterson, R., Kumar, A., and Michel, F.: A paleolimnological recordof Holocene climate and environmental change in the Temagami region, northeastern On-tario, J. Paleolimnol., 33, 445–461, 2005. 3950
Bullard, E.: Heat Flow in South Africa, P. R. Soc. Lon. A, 173, 474–592, 1939. 3946Carlson, A. E., LeGrande, A. N., Oppo, D. W., Came, R. E., Schmidt, G. A., Anslow, F. S.,5
Licciardi, J. M., and Obbink, E. A.: Rapid early Holocene deglaciation of the Laurentide icesheet, Nat. Geosci., 1, 620–624, 2008. 3953
Carslaw, H. and Jaeger, J.: Conduction of Heat in Solids, Oxford Science Publications, NewYork, 550 pp., 1959. 3942, 3943
Cermak, V.: Underground temperature and inferred climatic temperature of the past millenium,10
Palaeogeogr. Palaeoecol., 10, 1–19, 1971. 3940Chouinard, C. and Mareschal, J.-C.: Ground surface temperature history in southern Canada:
Temperatures at the base of the Laurentide ice sheet and during the Holocene, Earth Planet.Sci. Lett., 277, 280–289, doi:10.1016/j.epsl.2008.10.026, 2009. 3941, 3946, 3960
Church, J. A., White, N. J., Konikow, L. F., Domingues, C. M., Cogley, J. G., Rignot, E.,15
Gregory, J. M., van den Broeke, M. R., Monaghan, A. J., and Velicogna, I.: Revisitingthe Earth’s sea-level and energy budgets from 1961 to 2008, Geophys. Res. Lett., 38,doi:10.1029/2011GL048794, 2011. 3938
Clark, P. U.: Unstable behavior of the Laurentide Ice Sheet over deforming sediment and itsimplications for climate change, Quaternary Res., 41, 19–25, 1994. 393920
Clark, P. U. and Pollard, D.: Origin of the Middle Pleistocene Transition by ice sheet erosion ofregolith, Paleoceanography, 13, 1–9, 1998. 3939
Clark, P. U., Alley, R. B., and Pollard, D.: Northern Hemisphere Ice-Sheet Influences on GlobalClimate Change, Science, 286, 1104–1111, 1999. 3939
Clauser, C. and Mareschal, J.-C.: Ground temperature history in central Europe from borehole25
temperature data, Geophys. J. Int., 121, 805–817, 1995. 3945Dahl-Jensen, D., Mosegaard, K., Gundestrup, N., Clow, G. D., Johnsen, S. J., Hansen, A. W.,
and Balling, N.: Past Temperatures Directly from the Greenland Ice Sheet, Science, 282,268–271, 1998. 3952
Davis, M., Douglas, C., Calcote, R., Cole, K., Green Winkler, M., and Flakne, R.: Holocene30
climate in the Western Great Lakes national park and lakeshores: implications for futureclimate change, Conserv. Biol., 14, 968–983, 2000. 3950
3955

CPD11, 3937–3971, 2015
Laurentide Ice Sheetbasal temperatures atthe Last Glacial Cycle
as inferred fromborehole data
C. Pickler et al.
Title Page
Abstract Introduction
Conclusions References
Tables Figures
J I
J I
Back Close
Full Screen / Esc
Printer-friendly Version
Interactive Discussion
Discussion
Paper
|D
iscussionP
aper|
Discussion
Paper
|D
iscussionP
aper|
Demezhko, D. Y. and Gornostaeva, A. A.: Late Pleistocene-Holocene ground surface heat fluxchanges reconstructed from borehole temperature data (the Urals, Russia), Clim. Past, 11,647–652, doi:10.5194/cp-11-647-2015, 2015. 3941
Demezhko, D. and Shchapov, V.: 80 000 years ground surface temperature history inferred fromthe temperature-depth log measured in the superdeep hole SG-4 (the Urals, Russia), Global5
Planet. Change, 20, 219–230, 2001. 3941Denton, G. and Hughes, T., eds.: The Last Great Ice Sheets, Wiley-Interscience, New York,
1981. 3939Dyke, A., Andrews, J., Clark, P., England, J., Miller, G., Shaw, J., and Veillette, J.: The Laurentide
and Innuitian ice sheets during the Last Glacial Maximum, Quatern. Sci. Rev., 21, 9–31,10
doi:10.1016/S0277-3791(01)00095-6, 2002. 3952Gomez, N., Mitrovica, J. X., Tamisiea, M. E., and Clark, P. U.: A new projection of sea level
change in response to collapse of marine sectors of the Antarctic Ice Sheet, Geophys. J.Int., 180, 623–634, 2010. 3938
Guillou-Frottier, L., Jaupart, C., Mareschal, J. C., Gariépy, C., Bienfait, G., Cheng, L. Z., and15
Lapointe, R.: High heat flow in the trans-Hudson Orogen, Central Canadian Shield, Geophys.Res. Lett., 23, 3027–3030, doi:10.1029/96GL02895, 1996. 3949
Hotchkiss, W. and Ingersoll, L.: Post-glacial time calculations from recent geothermal measure-ments in the Calumet Copper Mines, J. Geol., 42, 113–142, 1934. 3939, 3940
Hughes, T.: Modeling ice sheets from the bottom up, Quatern. Sci. Rev., 28, 1831–1849, 2009.20
3939Jackson, D.: Interpretation of inaccurate, insufficient, and inconsistent data, Geophys. J. Int.,
28, 97–110, 1972. 3945Jaupart, C. and Mareschal, J.-C.: Heat generation and transport in the Earth, Cambridge Uni-
versity Press, 357–379, 2011. 394025
Jaupart, C., Mareschal, J., Bouquerel, H., and Phaneuf, C.: The building and stabilization of anArchean Craton in the Superior Province, Canada, from a heat flow perspective, J. Geophys.lRes.-Solid Earth, 119, 9130–9155, 2014. 3946, 3960
Jessop, A.: The Distribution of Glacial Perturbation of Heat Flow in Canada, Can. J. Earth Sci.,8, 162–166, 1971. 394030
Joughin, I., Smith, B., and Medley, B.: Marine Ice Sheet Collapse Potentially Under Way for theThwaites Glacier Basin, West Antarctica, Science, 344, 735–738, 2014. 3938
3956

CPD11, 3937–3971, 2015
Laurentide Ice Sheetbasal temperatures atthe Last Glacial Cycle
as inferred fromborehole data
C. Pickler et al.
Title Page
Abstract Introduction
Conclusions References
Tables Figures
J I
J I
Back Close
Full Screen / Esc
Printer-friendly Version
Interactive Discussion
Discussion
Paper
|D
iscussionP
aper|
Discussion
Paper
|D
iscussionP
aper|
Kukkonen, I. T. and Jõeleht, A.: Weichselian temperatures from geothermal heat flow data, J.Geophys. Res.-Solid Earth, 108, doi:10.1029/2001JB001579, 2003. 3941
Lachenbruch, A. and Marshall, B.: Changing climate: Geothermal evidence from permafrost inthe Alaskan Arctic, Science, 234, 689–696, 1986. 3939, 3940
Lachenbruch, A. H.: Permafrost, the active layer and changing climate, Global Planet. Change,5
29, 259–273, 1988. 3940Lamb, H.: Climate, History and the Modern World, Routledge, 2 edn., 114 pp., 1995. 3948Lanczos, C.: Linear Differential Operators, D. Van Nostrand, Princeton, N. J., 1961. 3944, 3945Mareschal, J.-C. and Beltrami, H.: Evidence for recent warming from perturbed
geothermal gradients: examples from eastern Canada, Clim. Dynam., 6, 135–143,10
doi:10.1007/BF00193525, 1992. 3945Mareschal, J. C., Jaupart, C., Cheng, L. Z., Rolandone, F., Gariépy, C., Bienfait, G., Guillou-
Frottier, L., and Lapointe, R.: Heat flow in the Trans-Hudson Orogen of the Canadian Shield:Implications for Proterozoic continental growth, J. Geophys. Res., 104, 7–29, 1999a. 3946,396015
Mareschal, J.-C., Rolandone, F., and Bienfait, G.: Heat flow variations in a deep borehole nearSept-Iles, Québec, Canada: Paleoclimatic interpretation and implications for regional heatflow estimates, Geophys. Res. Lett., 26, 2049–2052, doi:10.1029/1999GL900489, 1999b.3941, 3945, 3946, 3960
Marshall, S.: Recent advances in understanding ice sheet dynamics, Earth Planet. Sci. Lett.,20
240, 191–204, 2005. 3939Marshall, S. and Clark, P.: Basal tempeature evolution of North American ice sheets and impli-
cations for the 100-kyr cycle, Geophys. Res. Lett., 29, 67–1–67–4, 2002. 3939, 3952Menke, W.: Geophysical Data Analysis: Discrete Inverse Theory, vol. 4, Academic Press, San
Diego, 1989. 394525
Misener, A. and Beck, A.: The measurement of heat flow over land, Interscience, New York,11–60, 1960. 3942
Mitrovica, J. X., Gomez, N., and Clark, P. U.: The Sea-Level Fingerprint of West Antarctic Col-lapse, Science, 323, 753–753, 2009. 3938
Nielsen, S. and Beck, A.: Heat flow density values and paleoclimate determined from stochas-30
tic inversion of four temperature-depth profiles from the Superior Province of the CanadianShield, Tectonophysics, 164, 345–359, doi:10.1016/0040-1951(89)90026-7, 1989. 3944
3957

CPD11, 3937–3971, 2015
Laurentide Ice Sheetbasal temperatures atthe Last Glacial Cycle
as inferred fromborehole data
C. Pickler et al.
Title Page
Abstract Introduction
Conclusions References
Tables Figures
J I
J I
Back Close
Full Screen / Esc
Printer-friendly Version
Interactive Discussion
Discussion
Paper
|D
iscussionP
aper|
Discussion
Paper
|D
iscussionP
aper|
Oerlemans, J. and van der Veen, C.: Ice Sheets and Climate, D. Reidel Publishing Company,Dordrecht, Boston, Lancaster, 1984. 3939
Pattyn, F.: Antarctic subglacial conditions inferred from a hybrid ice sheet/ice stream model,Earth Planet. Sci. Lett., 295, 451–461, 2010. 3952
Peltier, W.: Global glacial isostasy and the surface of the ice-age Earth: The ICE-5
5G (VM2) Model and GRACE, Annu. Rev. Earth Planet. Sci., 32, 111–149,doi:10.1146/annurev.earth.32.082503.144359, 2004. 3939, 3952
Peltier, W. R.: Global glacial isostatic adjustment: palaeogeodetic and space-geodetic tests ofthe ICE-4G (VM2) model, J. Quatern. Sci., 17, 491–510, doi:10.1002/jqs.713, 2002. 3939
Perry, H., Jaupart, C., Mareschal, J., and Bienfait, G.: Crustal heat production in the Superior10
Province, Canadian Shield, and in North America inferred from heat flow data, J. Geophys.Res.-Solid Earth, 111, 2006. 3946, 3954
Perry, H., Mareschal, J. C., and Jaupart, C.: Enhanced crustal geo-neutrino production nearthe Sudbury Neutrino Observatory, Ontario, Canada, Earth Planet. Sci. Lett., 288, 301–308,2009. 3946, 3952, 396015
Pollard, D., DeConto, R., and Nyblabe, A.: Sensitivity of Cenozoic Antarctic ice sheet variationsto geothermal heat flux, Global Planet. Change, 49, 63–74, 2005. 3952
Rignot, E., Mouginot, J., Morlighem, M., Seroussi, H., and Scheuchl, B.: Widespread, rapidgrounding line retreat of Pine Island, Thwaites, Smith, and Kohler glaciers, West Antarctica,from 1992 to 2011, Geophys. Res. Lett., 41, 3502–3509, doi:10.1002/2014GL060140, 2014.20
3938Rolandone, F., Mareschal, J., Jaupart, C., Gosselin, C., Bienfait, G., and Lapointe, R.: Heat flow
in the western Superior Province of the Canadian Shield, Geophys. Res. Lett., 30, 2003a.3946, 3960
Rolandone, F., Mareschal, J.-C., and Jaupart, C.: Temperatures at the base of the Lau-25
rentide Ice Sheet inferred from borehole temperature data, Geophys. Res. Lett., 30,doi:10.1029/2003GL018046, 2003b. 3941, 3946, 3952, 3960
Rolandone, F., Jaupart, C., Mareschal, J.-C., Gariépy, C., Bienfait, G., Carbonne, C.,and Lapointe, R.: Surface heat flow, crustal temperatures and mantle heat flowin the Proterozoic Trans-Hudson Orogen, Canadian Shield, J. Geophys. Res., 107,30
doi:10.1029/2001JB000698, 2002. 3960
3958

CPD11, 3937–3971, 2015
Laurentide Ice Sheetbasal temperatures atthe Last Glacial Cycle
as inferred fromborehole data
C. Pickler et al.
Title Page
Abstract Introduction
Conclusions References
Tables Figures
J I
J I
Back Close
Full Screen / Esc
Printer-friendly Version
Interactive Discussion
Discussion
Paper
|D
iscussionP
aper|
Discussion
Paper
|D
iscussionP
aper|
Sass, J. H., Lachenbruch, A. H., and Jessop, A. M.: Uniform heat flow in a deep hole inthe Canadian Shield and its paleoclimatic implications, J. Geophys. Res., 76, 8586–8596,doi:10.1029/JB076i035p08586, 1971. 3940, 3941, 3946, 3960
Schneider, D. P., Steig, E. J., van Ommen, T. D., Dixon, D. A., Mayewski, P. A., Jones, J. M.,and Bitz, C. M.: Antarctic temperatures over the past two centuries from ice cores, Geophys.5
Res. Lett., 33, doi:10.1029/2006GL027057, 2006. 3952Shen, P. Y. and Beck, A. E.: Determination of surface temperature history from
borehole temperature gradients, J. Geophys. Res.-Solid Earth, 88, 7485–7493,doi:10.1029/JB088iB09p07485, 1983. 3944
Shen, P. Y. and Beck, A. E.: Least squares inversion of borehole temperature measurements in10
functional space, J. Geophys. Res.-Solid Earth, 96, 19965–19979, doi:10.1029/91JB01883,1991. 3945
Straneo, F. and Heimbach, P.: North Atlantic warming and the retreat of Greenland’s outletglaciers, Science, 504, 36–43, 2013. 3938
Vasseur, G., Bernard, P., de Meulebrouck, J. V., Kast, Y., and Jolivet, J.: Holocene paleotemper-15
atures deduced from geothermal measurements, Palaeogeogr. Palaeoecol., 43, 237–259,doi:10.1016/0031-0182(83)90013-5, 1983. 3944
Velicogna, I. and Wahr, J.: Time-variable gravity observations of ice sheet mass balance: Pre-cision and limitations of the GRACE satellite data, Geophys. Res. Lett., 40, 3055–3063,doi:10.1002/grl.50527, 2013. 393820
Wang, K.: Estimation of ground surface temperatures from borehole temperature data, J. Geo-phys. Res.-Solid Earth, 97, 2095–2106, doi:10.1029/91JB02716, 1992. 3944
Zwally, H. J., Abdalati, W., Herring, T., Larson, K., Saba, J., and Steffen, K.: Surface Melt-Induced Acceleration of Greenland Ice-Sheet Flow, Science, 297, 218–22, 2002. 3952
Zweck, C. and Huybrechts, P.: Modeling of the northern hemisphere ice sheets during the last25
glacial cycle and glaciological sensitivity, J. Geophys. Res., 110, 1984–2012, 2005. 3939
3959

CPD11, 3937–3971, 2015
Laurentide Ice Sheetbasal temperatures atthe Last Glacial Cycle
as inferred fromborehole data
C. Pickler et al.
Title Page
Abstract Introduction
Conclusions References
Tables Figures
J I
J I
Back Close
Full Screen / Esc
Printer-friendly Version
Interactive Discussion
Discussion
Paper
|D
iscussionP
aper|
Discussion
Paper
|D
iscussionP
aper|
Table 1. Technical information concerning the boreholes used in this study.
Site Log ID Latitude Longitude Depth λ Q Reference(m) (W m−1 K−1) (m W m−2)
FlinFlon n/a 54◦43′ 102◦00′ 3196 3.51 (≤1920 m) 42 Sass et al. (1971)2.83 (1920–2300 m)
2.51 (≥2300 m)Thompson – Pipe 01–14 55◦29′10′′ 98◦07′42′′ 1610 3.24 49 Mareschal et al. (1999a); Rolandone et al. (2002);
Chouinard and Mareschal (2009)Thompson – Owl 00–17, 01–16 55◦40′17′′ 97◦51′35′′ 1568 3.0 (<1200 m) 52 Mareschal et al. (1999a); Rolandone et al. (2002)
3.6 (>1200 m)Balmertown 00–02 51◦01′59′′ 93◦42′56′′ 1724 3.3 35 Rolandone et al. (2003a)Manitouwadge – 0610 06–10 49◦09′07′′ 85◦43′46′′ 2064 2.74 40 Rolandone et al. (2003b); Chouinard and Mareschal (2009)Manitouwadge – 0611 06–11 49◦10′16′′ 85◦46′31′′ 2279 – – Rolandone et al. (2003b); Chouinard and Mareschal (2009)Sudbury – Victor Mine 13–01 46◦40′17′′ 80◦48′34′′ 2060 2.7 44Sudbury – Falconbrige 03–16 46◦39′05′′ 80◦47′30′′ 2122 2.74 47 Perry et al. (2009)Sudbury – Lockerby 04–01 46◦26′00′′ 81◦18′55′′ 2207 3.29 58 Perry et al. (2009)Sudbury – Craig Mine 04–02 46◦38′34′′ 81◦21′03′′ 2279 2.65 – Chouinard and Mareschal (2009)Val d’Or 10–08 48◦06′02′′ 77◦31′26′′ 1754 3.81 47 Jaupart et al. (2014)Matagami 04–09 49◦42′29′′ 77◦44′28′′ 1579 3.27 (≤1000 m) 42
4.02 (>1000 m)Sept Iles 98-20 50◦12′46′′ 66◦38′19′′ 1820 2.04 32 Mareschal et al. (1999b); Chouinard and Mareschal (2009)
3960

CPD11, 3937–3971, 2015
Laurentide Ice Sheetbasal temperatures atthe Last Glacial Cycle
as inferred fromborehole data
C. Pickler et al.
Title Page
Abstract Introduction
Conclusions References
Tables Figures
J I
J I
Back Close
Full Screen / Esc
Printer-friendly Version
Interactive Discussion
Discussion
Paper
|D
iscussionP
aper|
Discussion
Paper
|D
iscussionP
aper|
Table 2. Summary of GST history results where To is the long-term surface temperature, Qo isthe quasi-equilibrium heat flow, Tmin is the minimal temperature, Tpgw is the maximum temper-ature attained during the postglacial warming, tmin and tpgw is the occurrence of the minimaltemperature and maximum postglacial warming temperature. Parentheses indicate sites wherethe GST history is not reliable.
Site To Qo Tmin tmin Tpgw tpgw
(◦C) (m Wm−2) (◦C) (ka) (◦C) (ka)
FlinFlon 3.8 38.7 −0.25 10–20 5.64 3–5Pipe 0.7 51.8 0.27 0.15–0.2 – –(Owl)a −0.3 54.9 −2.36 5–7.5 2.40 0.9–1Balmertown 2.6 33.0 1.65 5–7.5 3.36 1–2Manitouwadge 0610 2.3 35.6 0.95 10–20 3.95 2–3(Manitouwadge 0611)b 1.7 – −2.83 20–30 6.71 3–5Victor Mine 4.5 42.1 3.00 10–30 7.34 3–5Falconbridge 3.1 45.7 −0.20 20–30 5.88 5–7.5Lockerby 4.1 57.7 2.84 10–30 9.58 3-5(Craig Mine)c 3.0 45.2 −3.20 20–30 8.41 2–3Val d’Or 2.9 41.9 0.58 10–20 5.33 2–3Matagami 1.9 47.5 0.34 10–20 4.10 1–2Sept Iles 2.1 34.7 −1.42 10–20 5.66 1–2
a The temperature profile at this site may be distorted by horizontal contrasts in thermal conductivity,b The temperature profile in the lowermost part of the hole may be affected by subvertical layering andthermal conductivity contrasts, c The temperature profile may be affected by waterflow caused bypumping in the nearby mine.
3961

CPD11, 3937–3971, 2015
Laurentide Ice Sheetbasal temperatures atthe Last Glacial Cycle
as inferred fromborehole data
C. Pickler et al.
Title Page
Abstract Introduction
Conclusions References
Tables Figures
J I
J I
Back Close
Full Screen / Esc
Printer-friendly Version
Interactive Discussion
Discussion
Paper
|D
iscussionP
aper|
Discussion
Paper
|D
iscussionP
aper|
Table 3. Summary of GST history results for simultaneous inversions where tmin and tpgw is theoccurrence of the minimal temperature and maximal temperature associated with postglacialwarming, and ∆T is the temperature range
Site ∆T (GSTH) tmin tpgw(K) (ka) (ka)
Thompson 3.8 5–7.5 1–2Manitouwadge 7.9 30–40 5–7.5Sudbury 11.2 30–40 5–7.5Sudbury (exc. Craig) 6.6 20–30 3–5
3962

CPD11, 3937–3971, 2015
Laurentide Ice Sheetbasal temperatures atthe Last Glacial Cycle
as inferred fromborehole data
C. Pickler et al.
Title Page
Abstract Introduction
Conclusions References
Tables Figures
J I
J I
Back Close
Full Screen / Esc
Printer-friendly Version
Interactive Discussion
Discussion
Paper
|D
iscussionP
aper|
Discussion
Paper
|D
iscussionP
aper|
Table 4. Ranges in surface temperature variations estimated from: the iteration of the long-termsurface temperature as a function of depth (column 1) and from inversion of the GST history(column 2), along with the difference between the two (column 3).
Site ∆To ∆T (GSTH) Difference(◦C) (◦C)
Flin Flon 5.1 6.6 1.5Thompson, Pipe Mine 5.6 2.5 3.1Thompson, Owla 5.3 4.8 0.5Balmertown 2.3 1.7 0.6Manitouwadge, 0610 3.3 3.0 0.3Manitouwadge, 0611b 9.6 9.5 0.1Sudbury, Victor Mine 4.9 4.6 0.3Sudbury, Falconbridge 6.2 7.0 0.8Sudbury, Lockerby 6.6 6.8 0.2Sudbury Craig Minec 11.9 11.7 0.2Val d’Or 5.5 5.2 0.3Matagami 4.1 3.8 0.3Sept Iles 7.8 7.1 0.7
a The temperature profile at this site may be disturbed by horizontalcontrats in thermal conductivity, b The temperature profile in thelowermost part of the hole may be affected by subvertical layering andthermal conductivity contrasts, c The temperature profile may be affectedby waterflow caused by pumping in the nearby mine.
3963

CPD11, 3937–3971, 2015
Laurentide Ice Sheetbasal temperatures atthe Last Glacial Cycle
as inferred fromborehole data
C. Pickler et al.
Title Page
Abstract Introduction
Conclusions References
Tables Figures
J I
J I
Back Close
Full Screen / Esc
Printer-friendly Version
Interactive Discussion
Discussion
Paper
|D
iscussionP
aper|
Discussion
Paper
|D
iscussionP
aper|
−110˚
−110˚
−105˚
−105˚
−100˚
−100˚
−95˚
−95˚
−90˚
−90˚
−85˚
−85˚
−80˚
−80˚
−75˚
−75˚
−70˚
−70˚
−65˚
−65˚
−60˚
−60˚
40˚ 40˚
45˚ 45˚
50˚ 50˚
55˚ 55˚
60˚ 60˚
Flin FlonThompson (2)
Balmertown
Manitouwadge (2)
Sudbury (4)
Val d’Or
Matagami
Sept Iles
Figure 1. Map of central and eastern Canada and adjoining US showing the location of sampledboreholes. Thompson (Owl and Pipe), Manitouwadge (0610 and 0611) and Sudbury (Falcon-bridge, Lockerby, Craig Mine, and Victor Mine) have several boreholes present within a smallregion. The number of profiles available at locations with multiple holes is enclosed in paren-thesis.
3964

CPD11, 3937–3971, 2015
Laurentide Ice Sheetbasal temperatures atthe Last Glacial Cycle
as inferred fromborehole data
C. Pickler et al.
Title Page
Abstract Introduction
Conclusions References
Tables Figures
J I
J I
Back Close
Full Screen / Esc
Printer-friendly Version
Interactive Discussion
Discussion
Paper
|D
iscussionP
aper|
Discussion
Paper
|D
iscussionP
aper|
Figure 2. Heat flux variation as a function of depth. The Flin Flon, Owl and Matagami profileshave been corrected to account for thermal conductivity variations with depth as shown inTable 1.
3965

CPD11, 3937–3971, 2015
Laurentide Ice Sheetbasal temperatures atthe Last Glacial Cycle
as inferred fromborehole data
C. Pickler et al.
Title Page
Abstract Introduction
Conclusions References
Tables Figures
J I
J I
Back Close
Full Screen / Esc
Printer-friendly Version
Interactive Discussion
Discussion
Paper
|D
iscussionP
aper|
Discussion
Paper
|D
iscussionP
aper|
Figure 3. Long-term surface temperature variations over time (left y-axis) and depth (right y-axis) for the boreholes as determined by Eq.6
3966

CPD11, 3937–3971, 2015
Laurentide Ice Sheetbasal temperatures atthe Last Glacial Cycle
as inferred fromborehole data
C. Pickler et al.
Title Page
Abstract Introduction
Conclusions References
Tables Figures
J I
J I
Back Close
Full Screen / Esc
Printer-friendly Version
Interactive Discussion
Discussion
Paper
|D
iscussionP
aper|
Discussion
Paper
|D
iscussionP
aper|
Figure 4. Ground Surface Temperature History from the Manitoba boreholes, at Flin Flon andThompson (Pipe and Owl). The temperatures have been shifted with respect to the initial sur-face temperature of the site, To, as shown in Table 2.
3967
CPD11, 3937–3971, 2015
Laurentide Ice Sheetbasal temperatures atthe Last Glacial Cycle
as inferred fromborehole data
C. Pickler et al.
Title Page
Abstract Introduction
Conclusions References
Tables Figures
J I
J I
Back Close
Full Screen / Esc
Printer-friendly Version
Interactive Discussion
Discussion
Paper
|D
iscussionP
aper|
Discussion
Paper
|D
iscussionP
aper|
Figure 5. Ground Surface Temperature History for the western Ontario boreholes: Balmertownand Manitouwadge 0610 and 0611. The temperatures have been shifted with respect to theinitial surface temperature of the site, To, as shown in Table 2.
3968

CPD11, 3937–3971, 2015
Laurentide Ice Sheetbasal temperatures atthe Last Glacial Cycle
as inferred fromborehole data
C. Pickler et al.
Title Page
Abstract Introduction
Conclusions References
Tables Figures
J I
J I
Back Close
Full Screen / Esc
Printer-friendly Version
Interactive Discussion
Discussion
Paper
|D
iscussionP
aper|
Discussion
Paper
|D
iscussionP
aper|
Figure 6. Ground Surface Temperature History for all the boreholes around Sudbury, Ontario(Victor Mine, Falconbridge, Lockerby, and Craig Mine).The temperatures have been shifted withrespect to the initial surface temperature of the site, To, as shown in Table 2.
3969

CPD11, 3937–3971, 2015
Laurentide Ice Sheetbasal temperatures atthe Last Glacial Cycle
as inferred fromborehole data
C. Pickler et al.
Title Page
Abstract Introduction
Conclusions References
Tables Figures
J I
J I
Back Close
Full Screen / Esc
Printer-friendly Version
Interactive Discussion
Discussion
Paper
|D
iscussionP
aper|
Discussion
Paper
|D
iscussionP
aper|
Figure 7. Ground Surface Temperature History for the boreholes in Quebec, Matagami, Vald’Or and Sept-Iles. The temperatures have been shifted with respect to the initial surface tem-perature of the site, To, as shown in Table 2.
3970

CPD11, 3937–3971, 2015
Laurentide Ice Sheetbasal temperatures atthe Last Glacial Cycle
as inferred fromborehole data
C. Pickler et al.
Title Page
Abstract Introduction
Conclusions References
Tables Figures
J I
J I
Back Close
Full Screen / Esc
Printer-friendly Version
Interactive Discussion
Discussion
Paper
|D
iscussionP
aper|
Discussion
Paper
|D
iscussionP
aper|
Figure 8. GST changes from simultaneous inversion with respect to the long-term temperatureat 100 ka. The Sudbury GST changes include (black) and exclude (red) Craig Mine.
3971