Embed Size (px)
Citation preview
Lattice thermal conductivity of UO2 using ab-initio and classical moleculardynamics
Hyoungchul Kim,1,2 Moo Hwan Kim,3 and Massoud Kaviany1,3,a)
1Department of Mechanical Engineering, University of Michigan, Ann Arbor, Michigan 48109, USA2High-Temperature Energy Materials Research Center, Korea Institute of Science and Technology,Seoul 136–791, Republic of Korea3Division of Advanced Nuclear Engineering, Pohang University of Science and Technology, Pohang 790-784,South Korea
(Received 2 December 2013; accepted 16 March 2014; published online 26 March 2014)
We applied the non-equilibrium ab-initio molecular dynamics and predict the lattice thermal
conductivity of the pristine uranium dioxide for up to 2000 K. We also use the equilibrium classical
molecular dynamics and heat-current autocorrelation decay theory to decompose the lattice
thermal conductivity into acoustic and optical components. The predicted optical phonon transport
is temperature independent and small, while the acoustic component follows the Slack relation and
is in good agreement with the limited single-crystal experimental results. Considering the phonon
grain-boundary and pore scatterings, the effective lattice thermal conductivity is reduced, and we
show it is in general agreement with the sintered-powder experimental results. The charge and
photon thermal conductivities are also addressed, and we find small roles for electron, surface
polaron, and photon in the defect-free structures and for temperatures below 1500 K. VC 2014 AIPPublishing LLC. [http://dx.doi.org/10.1063/1.4869669]
I. INTRODUCTION
Uranium dioxide (UO2) is a stable fluorite structure
(CaF2 type, space group Fm3m) containing 4 U4þ and 8 O2�
ions in a conventional cell (Fig. 1). This crystalline solid is
one of the most common nuclear-fission fuel materials, with
high melting temperature (Tm� 3120 K), radiation stability,
and chemical compatibility. However, it has low thermal
conductivity (j), which directly influences its thermal stabil-
ity (e.g., local heating and swelling of the fuel pellet) and the
operating temperature.1,2 So, accurate thermal conductivity
data and its possible improvements are important.
To explain the heat conduction mechanisms in UO2, vari-
ous theoretical,3–5 computational,6–9 and experimental9–23
studies have been performed over the last five decades. These
include the effects of the crystalline structure,9,10,20–23
non-stoichiometry,5,16 porosity,12,18 and irradiation.11,19 The
results show that large grain and stoichiometry are favorable
for the heat conduction, while defects (e.g., pores remaining
after powder sintering, and radiation-caused voids, impurities,
and fission products) hinder the transport by the heat carriers.
Also, it has been suggested that charge carriers play a role
only at the high temperatures, while phonons are the domi-
nant carriers at low and moderate temperatures.1,4,5,10,20,22,24
This phonon behavior (and lattice dynamics) of UO2 is clearly
explained by the recent atomic-level simulations based on the
density-functional theory (DFT), including the prediction of
significant anharmonicity25 and mechanical/thermodynamic/
vibrational properties.26,27 In the high-temperature regime,
many report that the thermal conductivity of UO2 is domi-
nated by the charge-carrier transport.1,4,5,10,20,22,24 Despite the
semiconductor features of the UO2 crystal (bandgap energy
DEe;g � 2.0 eV),3,28–30 the classical band theory is inadequate
in describing its electrical properties.1,3,4,28,31–35 To
explain the high-temperature behavior of its thermal conduc-
tivity, the small-polaron hopping mechanism has been
suggested.1,4,28,31,32,35–37 However, so far due to the absence
of the first-principles based results, the fundamental under-
standing of the UO2 thermal conductivity mechanisms
(including the conditions for charged heat carriers) has been
lacking.
Here, we present a comprehensive analysis of the lattice
thermal conductivity, jL, of UO2 crystals employing the mo-
lecular dynamics (MD) (including ab-initio and classical
simulations) and analytic methods. We predict the
temperature-dependent lattice thermal conductivity of UO2
and compare our results with the available experimental
results for single crystals. We also use the heat-current auto-
correlation function (HCACF) decay theory to predict the
optical-phonon transport contribution. The effects of the po-
rosity and grain boundary scatterings are modeled using the
effective lattice thermal conductivity, hjLi. We combine
these to predict the total lattice thermal conductivity and
compare with the available experimental results of the
sintered-powder UO2 samples. Simple analyses on the elec-
tronic and radiative contributions are also addressed in
Appendices A to C.
II. MD SIMULATIONS
A. Non-equilibrium ab-initio MD
We calculate the electronic structures and the lattice dy-
namics of UO2 using the DFT method implemented in the
Vienna ab-initio Simulation Package (VASP).38 The
Perdew-Burke-Ernzerhof parameterization of the generalized
gradient approximation (GGA) for the exchange-correlateda)Electronic mail: [email protected]
0021-8979/2014/115(12)/123510/8/$30.00 VC 2014 AIP Publishing LLC115, 123510-1
JOURNAL OF APPLIED PHYSICS 115, 123510 (2014)
[This article is copyrighted as indicated in the article. Reuse of AIP content is subject to the terms at: http://scitation.aip.org/termsconditions. Downloaded to ] IP:
141.212.141.91 On: Wed, 26 Mar 2014 18:54:55

functional,39 and the projector augmented wave method for
modeling the core electrons (energy cutoff ¼ 400 eV),40,41
are used. The standard DFT calculations fail to simulate the
strong correlations among the U 5 f electrons, as reported in
several studies.27,29,42–46 Here, we use one of the alterna-
tives, i.e., the GGAþ U method, to predict the electronic and
phonon behaviors of UO2 more accurately. We apply the
same value for the effective Hubbard parameter (U¼ 4.5 eV
and J¼ 0.51 eV) as that used in the literature.42–46 We have
reproduced the previous results (e.g., band structure and
electronic density-of-states)42–46 and verified the suitability
of the GGAþ U method.
To predict the lattice thermal conductivity, we use the
non-equilibrium ab-initio MD (NEAIMD) with the modified
VASP code based on the energy exchange method47,48 as
reported in the literature.49,50 The lattice thermal conductiv-
ity is obtained from this NEAIMD formalism as the ratio of
the imposed heat flux to the resulting temperature gradi-
ent,49,50 i.e.,
jL ¼ �½QðtÞ=A�ðdT=dxÞ�1; (1)
where the overbar designates the time average, Q(t) is the
heat flow rate, t is time, T is temperature, and A is the cross-
sectional area of the simulation cell. The heat flux is imposed
by dividing the simulation cell into twelve sections of equal
width, and exchanging kinetic energy (velocity swapping)
between the hot and cold sections. Because the exchange of
the kinetic energy results in a non-Newtonian dynamics in
the hot and cold sections, only the linear portion of the tem-
perature gradient is considered in calculating the temperature
gradient.
Three different UO2 supercells, 4� 2� 2 (total 192
atoms), 6� 2� 2 (288 atoms), and 8� 2� 2 (384 atoms),
are used to account for the effects of finite system size on the
NEAIMD simulations. To consider the thermal expansion
with temperature changes, we prepare supercells using the
experimental thermal expansion coefficient and lattice pa-
rameter, i.e., a(T)¼ a8(9.9734� 10�1þ 9.802� 10�6T �2.705� 10�10 T2þ 4.391� 10�13T3), with a�¼ 5.455 A at
T¼ 300 K.51 The Fermi-Dirac smearing factor (kB T, where
kB is the Boltzmann constant) for each temperature is also
applied to ensure reliable thermal-disordered atomic coordi-
nates. The Brillouin zone is sampled at only the C point.
After constant-temperature simulations with the Nos�e
thermostat for 1 ps (0.5 fs time steps), we collect atomic tra-
jectories for 22 ps (1 fs time steps).
B. Equilibrium classical MD
In order to analyse/scrutinize the NEAIMD results and
to clarify the validity of the available empirical potential
models, the lattice thermal conductivity is also calculated
using the equilibrium classical MD (ECMD) techniques and
the Green-Kubo HCACF decay,24,52,53 i.e.,
jL ¼V
kBT2
ð10
hqðtÞ � qð0Þi�
3dt; (2)
where V is the system volume and hqðtÞ � qð0Þi� is the
HCACF (superscript � indicates equilibrium). The heat cur-
rent vector ðqÞ is
q ¼ 1
V
d
dt
Xi
Eiri ¼1
V
Xi
Eiui þ1
2
Xi;j
ðFij � uiÞrij
" #; (3)
where Ei, ri, and ui are the energy, position, and velocity
vectors of particle (atom) i, and rij, and Fij are the intera-
tomic separation and force vectors (between atoms i and j).After examining the computational size effect on the ECMD
results, averages are obtained over the three directions for a
system consisting of 6� 6� 6 conventional unit cells (2592
atoms). The Verlet leapfrog algorithm with the Nos�e-Hoover
thermostat and the Berendsen barostat are used in the NpTensemble for 200 ps and then in the NVE ensemble for 100
ps. Then, the 3000 ps raw data are obtained for the calcula-
tion of q and the resultant HCACFs are then directly inte-
grated and the lattice thermal conductivity is determined as
the average value in the stable regime of the integral.
III. RESULTS AND DISCUSSION
In this section, using ab-initio and classical MD (CMD)
simulations of Sec. II, the UO2 lattice thermal conductivity
(including the effective value with the grain boundary and
porosity) is examined. To verify and assess our findings on
the phonon contribution, as dominant below T¼ 1500 K, the
electronic and radiative contributions are also investigated in
Appendices A to C.
A. Lattice thermal conductivity
As described in Sec. II A, the NEAIMD predicted lattice
thermal conductivity is computed as the ratio of the applied
heat flux to the resulting temperature gradient. The tempera-
ture distribution along the direction of the imposed tempera-
ture is computed using the average temperature at locations
marked by dividing the supercell in that direction into twelve
segments [Fig. 2(a)]. Using three different simulation-cell
sizes, as shown in Fig. 2(b), we verify the expected size
effect and extrapolate the lattice thermal conductivity for the
infinite structure, through the linear extrapolation of their
reciprocal relation. Due to the extensive computational
requirement of these actinide oxides NEAIMD simulations,
FIG. 1. Crystal structure of the pristine UO2 using (a) the primitive and (b)
the conventional cell (blue is U and red is O atom). The lattice parameter a�
at 300 K is also indicated.
123510-2 Kim, Kim, and Kaviany J. Appl. Phys. 115, 123510 (2014)
[This article is copyrighted as indicated in the article. Reuse of AIP content is subject to the terms at: http://scitation.aip.org/termsconditions. Downloaded to ] IP:
141.212.141.91 On: Wed, 26 Mar 2014 18:54:55
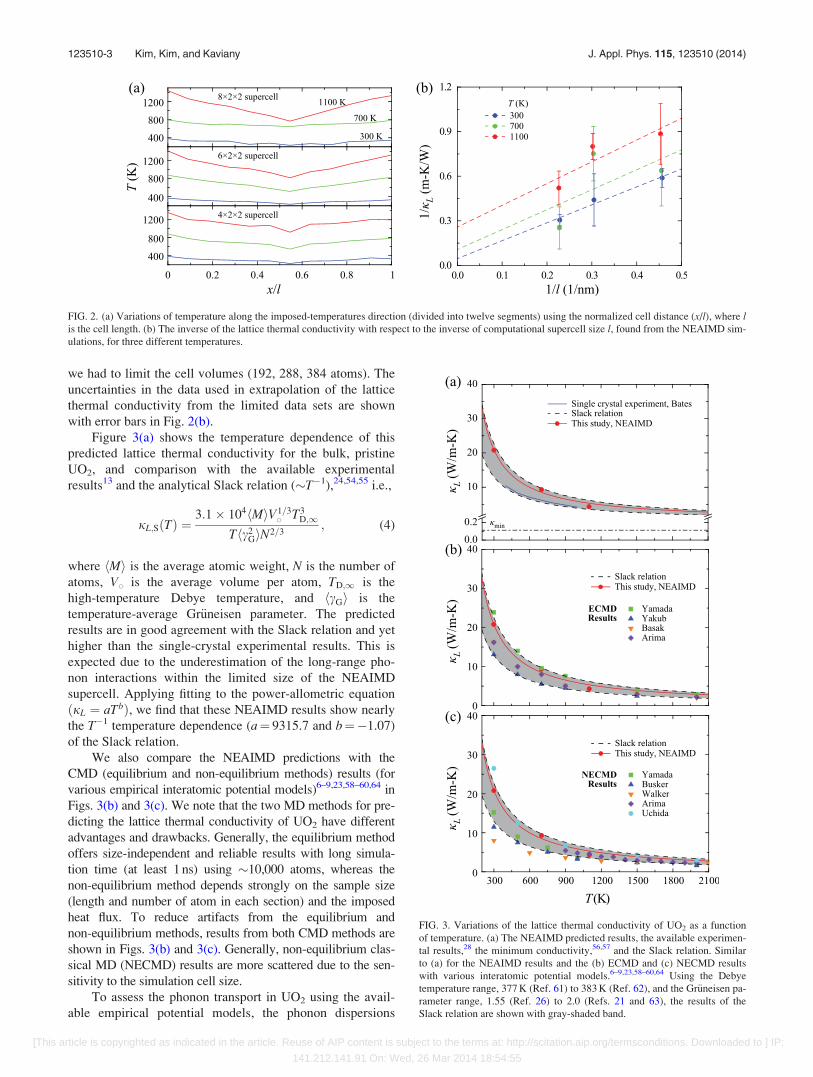
we had to limit the cell volumes (192, 288, 384 atoms). The
uncertainties in the data used in extrapolation of the lattice
thermal conductivity from the limited data sets are shown
with error bars in Fig. 2(b).
Figure 3(a) shows the temperature dependence of this
predicted lattice thermal conductivity for the bulk, pristine
UO2, and comparison with the available experimental
results13 and the analytical Slack relation (�T�1),24,54,55 i.e.,
jL;SðTÞ ¼3:1� 104hMiV1=3
�T3
D;1Thc2
GiN2=3; (4)
where hMi is the average atomic weight, N is the number of
atoms, V� is the average volume per atom, TD;1 is the
high-temperature Debye temperature, and hcGi is the
temperature-average Gr€uneisen parameter. The predicted
results are in good agreement with the Slack relation and yet
higher than the single-crystal experimental results. This is
expected due to the underestimation of the long-range pho-
non interactions within the limited size of the NEAIMD
supercell. Applying fitting to the power-allometric equation
ðjL ¼ aTbÞ, we find that these NEAIMD results show nearly
the T�1 temperature dependence (a¼ 9315.7 and b¼�1.07)
of the Slack relation.
We also compare the NEAIMD predictions with the
CMD (equilibrium and non-equilibrium methods) results (for
various empirical interatomic potential models)6–9,23,58–60,64 in
Figs. 3(b) and 3(c). We note that the two MD methods for pre-
dicting the lattice thermal conductivity of UO2 have different
advantages and drawbacks. Generally, the equilibrium method
offers size-independent and reliable results with long simula-
tion time (at least 1 ns) using �10,000 atoms, whereas the
non-equilibrium method depends strongly on the sample size
(length and number of atom in each section) and the imposed
heat flux. To reduce artifacts from the equilibrium and
non-equilibrium methods, results from both CMD methods are
shown in Figs. 3(b) and 3(c). Generally, non-equilibrium clas-
sical MD (NECMD) results are more scattered due to the sen-
sitivity to the simulation cell size.
To assess the phonon transport in UO2 using the avail-
able empirical potential models, the phonon dispersions
FIG. 2. (a) Variations of temperature along the imposed-temperatures direction (divided into twelve segments) using the normalized cell distance (x/l), where lis the cell length. (b) The inverse of the lattice thermal conductivity with respect to the inverse of computational supercell size l, found from the NEAIMD sim-
ulations, for three different temperatures.
FIG. 3. Variations of the lattice thermal conductivity of UO2 as a function
of temperature. (a) The NEAIMD predicted results, the available experimen-
tal results,28 the minimum conductivity,56,57 and the Slack relation. Similar
to (a) for the NEAIMD results and the (b) ECMD and (c) NECMD results
with various interatomic potential models.6–9,23,58–60,64 Using the Debye
temperature range, 377 K (Ref. 61) to 383 K (Ref. 62), and the Gr€uneisen pa-
rameter range, 1.55 (Ref. 26) to 2.0 (Refs. 21 and 63), the results of the
Slack relation are shown with gray-shaded band.
123510-3 Kim, Kim, and Kaviany J. Appl. Phys. 115, 123510 (2014)
[This article is copyrighted as indicated in the article. Reuse of AIP content is subject to the terms at: http://scitation.aip.org/termsconditions. Downloaded to ] IP:
141.212.141.91 On: Wed, 26 Mar 2014 18:54:55

predicted by these models are shown in Fig. 4. The DFT
method directly calculates the force field using VASP38 and
PHONON66 codes. The phonon dispersion curves are pre-
dicted using fits to the interatomic force-constant tensors of
the Hellmann-Feynman (HF) forces. The total energy and
the HF forces are found starting from the fully relaxed con-
figuration, with the criterion that the initial ionic forces are
less than 10�5 eV/A. The ionic displacement of 0.03 A for
each atom is sampled along the three directions. In the em-
pirical potential model, the GULP (general utility lattice pro-
gram)67 code is used for the prediction of the phonon
properties. Compared with the experiments65 and the DFT
results, each empirical potential model has distinct features
as follows. (a) The predicted acoustic modes are similar (or
slightly underestimated) to the experiments and the DFT
results, whereas the optical phonon frequencies are not (or
severely overestimated). (b) The Arima model predicts large
phonon bandgap, not consistent with the experiments and
DFT results. (c) The DFT phonon dispersion shows the best
agreement with the experiments. Considering the lattice ther-
mal conductivity of CMD predictions, the Yamada intera-
tomic potentials results are in closest agreement with the
NEAIMD results and the Slack relation. This supports the
use of this empirical potential model for the investigation of
the lattice thermal conductivity using the ECMD, which also
allows for decomposition and extraction of the
optical-phonon component.
Using the Yamada interatomic potential model, we
decompose the ECMD results for the lattice thermal conduc-
tivity of UO2 into the acoustic and optical compo-
nents,24,52,54 jL ¼ jL;A þ jL;O, where A and O denote
acoustic and optical. First, the optical component of HCACF
is filtered by the fast Fourier transform, low-pass filter with a
cutoff frequency of 6 THz (obtained from the upper value of
the acoustic-phonon dispersion). Then, the acoustic compo-
nent is obtained by subtracting the optical component from
the total lattice thermal conductivity. The decomposed
results are shown in Fig. 5, and we note again that the acous-
tic contribution has the expected strong T�1 temperature de-
pendence (mainly representing the long-range acoustic
transport) and dominates the lattice thermal conductivity,
while as expected the optical component is relatively small
and temperature independent. This is consistent with the
phonon transport in the bulk, crystalline solids.24,54
Recently,68 the optical phonon transport in UO2 was
measured and found not to be negligible and also tempera-
ture dependent. The difference can be associated with a
more pronounced anharmonicity than has been included in
our analyses. However, our results are in line with the gen-
eral agreement regarding the insignificance of the
optical-phonon contribution.25
B. Effective thermal conductivity
To consider the effects of the grain boundary and the po-
rosity in the heat conduction of (usually sintered powder) UO2
bulk, the relaxation time approximation24,69 and the effective
medium theory70–72 are used. Starting with the Slack relation
for the pristine UO2 dominated by the phonon-phonon scatte-
ring, we consider the additional grain-boundary scattering for
the polycrystalline UO2. The dominant phonon-phonon relax-
ation time ðsp�pÞ is found from
sp�p ¼3jL;S
qcvu2p;g;A
; (5)
where q is density and up;g;A is the average sound speed.
This gives sp�pðT ¼ 300 KÞ ¼ 1:69 ps using the pristine UO2
properties [i.e., cv(T¼ 300 K)¼ 227 J/kg-K, q(T¼ 300 K) ¼11.0 g/cm3, up,g,T¼ 5750 m/s, and up,g,L¼ 3275 m/s]. Using
the Matthiessen rule, the overall relaxation time with inclu-
sion of the grain-boundary scattering sp�b is
1
sp¼X
i
1
sp;i� 1
sp�pþ 1
sp�b: (6)
The polycrystalline scattering (i.e., grain-size effect) is based
on the diffuse boundary reflection and transmission, i.e., the
Casimir boundary scattering model.24,69 With simplifying
assumptions (phonon mean-free-path equal to grain size, and
using the average phonon speed), we have
FIG. 4. Calculated phonon dispersions along high-symmetry directions in
the FCC Brillouin zone. The results are obtained from various empirical
potential models6–9,23,64 of UO2 and from the DFT. The available experi-
mental results65 are also shown.
FIG. 5. Variations of the decomposed, acoustic, and optical components of
the lattice thermal conductivity of the pristine UO2 crystal, with respect to
temperature. The ECMD results use the Yamada empirical potentials.9
123510-4 Kim, Kim, and Kaviany J. Appl. Phys. 115, 123510 (2014)
[This article is copyrighted as indicated in the article. Reuse of AIP content is subject to the terms at: http://scitation.aip.org/termsconditions. Downloaded to ] IP:
141.212.141.91 On: Wed, 26 Mar 2014 18:54:55
1=sp�b ¼ up;g;A=dg, where dg is the grain diameter. Here, we
consider the half-mixed grain structure of dg¼ 0.01 and
0.1 lm, and the total relaxation time of the grain-boundary
scattering is obtained from 1=sp�b ¼ 1=sp�bðdg ¼ 0:01 lmÞþ 1=sp�bðdg ¼ 0:1 lmÞ. This gives sp�b ¼ 2:37 ps.
To consider the effect of pore structure in the heat con-
duction of UO2, the effective medium theory is applied.
Assuming negligible conduction through the pores (i.e.,
jf ; jL, where jf is the pore fluid conductivity) and
two-dimensional, periodic porous solids with continuous
pores, we derive the simple relation for the effective thermal
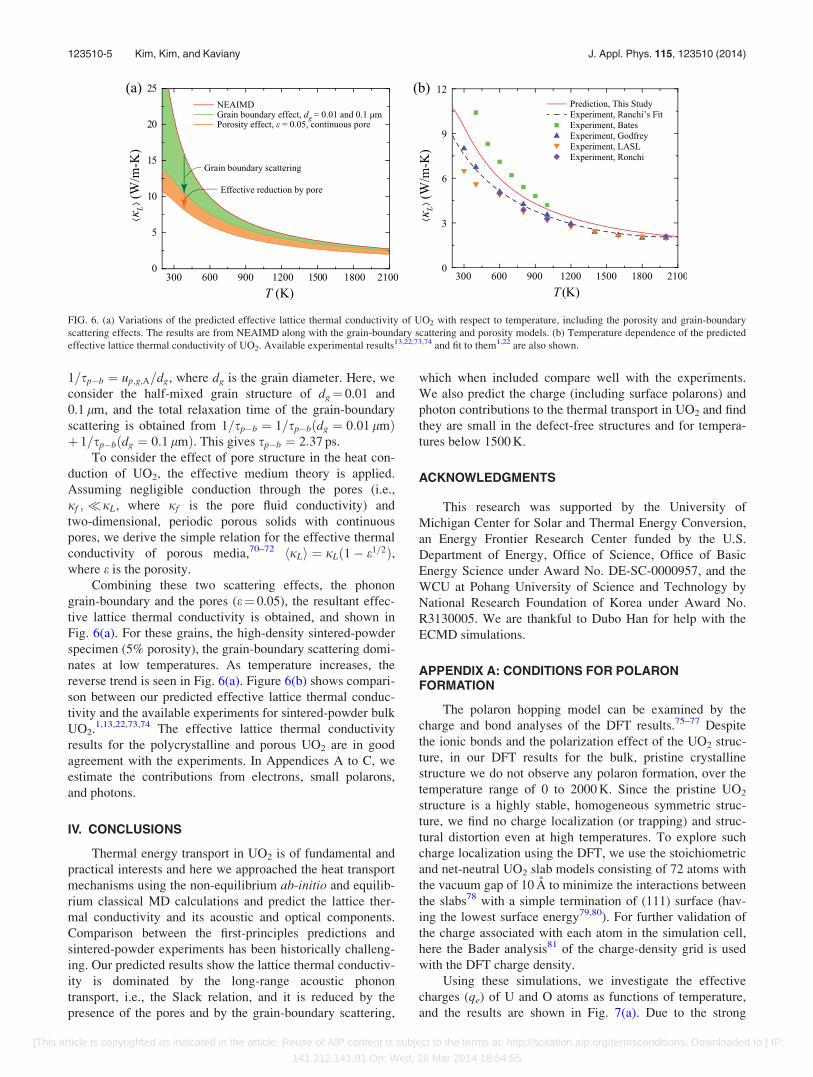
conductivity of porous media,70–72 hjLi ¼ jLð1� e1=2Þ,where e is the porosity.
Combining these two scattering effects, the phonon
grain-boundary and the pores (e¼ 0.05), the resultant effec-
tive lattice thermal conductivity is obtained, and shown in
Fig. 6(a). For these grains, the high-density sintered-powder
specimen (5% porosity), the grain-boundary scattering domi-
nates at low temperatures. As temperature increases, the
reverse trend is seen in Fig. 6(a). Figure 6(b) shows compari-
son between our predicted effective lattice thermal conduc-
tivity and the available experiments for sintered-powder bulk
UO2.1,13,22,73,74 The effective lattice thermal conductivity
results for the polycrystalline and porous UO2 are in good
agreement with the experiments. In Appendices A to C, we
estimate the contributions from electrons, small polarons,
and photons.
IV. CONCLUSIONS
Thermal energy transport in UO2 is of fundamental and
practical interests and here we approached the heat transport
mechanisms using the non-equilibrium ab-initio and equilib-
rium classical MD calculations and predict the lattice ther-
mal conductivity and its acoustic and optical components.
Comparison between the first-principles predictions and
sintered-powder experiments has been historically challeng-
ing. Our predicted results show the lattice thermal conductiv-
ity is dominated by the long-range acoustic phonon
transport, i.e., the Slack relation, and it is reduced by the
presence of the pores and by the grain-boundary scattering,
which when included compare well with the experiments.
We also predict the charge (including surface polarons) and
photon contributions to the thermal transport in UO2 and find
they are small in the defect-free structures and for tempera-
tures below 1500 K.
ACKNOWLEDGMENTS
This research was supported by the University of
Michigan Center for Solar and Thermal Energy Conversion,
an Energy Frontier Research Center funded by the U.S.
Department of Energy, Office of Science, Office of Basic
Energy Science under Award No. DE-SC-0000957, and the
WCU at Pohang University of Science and Technology by
National Research Foundation of Korea under Award No.
R3130005. We are thankful to Dubo Han for help with the
ECMD simulations.
APPENDIX A: CONDITIONS FOR POLARONFORMATION
The polaron hopping model can be examined by the
charge and bond analyses of the DFT results.75–77 Despite
the ionic bonds and the polarization effect of the UO2 struc-
ture, in our DFT results for the bulk, pristine crystalline
structure we do not observe any polaron formation, over the
temperature range of 0 to 2000 K. Since the pristine UO2
structure is a highly stable, homogeneous symmetric struc-
ture, we find no charge localization (or trapping) and struc-
tural distortion even at high temperatures. To explore such
charge localization using the DFT, we use the stoichiometric
and net-neutral UO2 slab models consisting of 72 atoms with
the vacuum gap of 10 A to minimize the interactions between
the slabs78 with a simple termination of (111) surface (hav-
ing the lowest surface energy79,80). For further validation of
the charge associated with each atom in the simulation cell,
here the Bader analysis81 of the charge-density grid is used
with the DFT charge density.
Using these simulations, we investigate the effective
charges (qe) of U and O atoms as functions of temperature,
and the results are shown in Fig. 7(a). Due to the strong
FIG. 6. (a) Variations of the predicted effective lattice thermal conductivity of UO2 with respect to temperature, including the porosity and grain-boundary
scattering effects. The results are from NEAIMD along with the grain-boundary scattering and porosity models. (b) Temperature dependence of the predicted
effective lattice thermal conductivity of UO2. Available experimental results13,22,73,74 and fit to them1,22 are also shown.
123510-5 Kim, Kim, and Kaviany J. Appl. Phys. 115, 123510 (2014)
[This article is copyrighted as indicated in the article. Reuse of AIP content is subject to the terms at: http://scitation.aip.org/termsconditions. Downloaded to ] IP:
141.212.141.91 On: Wed, 26 Mar 2014 18:54:55

stability and high symmetry of the fluorite structure, we do
not expect the effective charge changes to be large.
Surprisingly, the calculated effective charge of the surface U
atoms is significantly reduced and scattered compared to the
O atoms, for T> 500 K. As proposed in Refs. 33, 37, and 82,
the polaron formation arise due to the charge localization of
the U ions, 2U4þ ! U3þ þ U5þ. Based on our predicted
results, the presence of the surface (or defects in general) in
UO2 allows for the formation of charge localization at high
temperatures. Another evidence for the existence of small
polarons is the lattice distortion caused by its polarization
field. This can be shown with the iso-charge-density contours
(with positive or negative values) from the differential
charge density, qþ1ðrÞ � q0ðrÞ, where qþ1ðrÞ is the charge
density of the supercell with the polaron and q0ðrÞ is the
charge density without any injected excess electron. In Fig.
7(b), the polarized and distorted bond lengths of the sur-
rounding O and U atoms, induced by the small polaron, are
evident. The average U-O bond length around the U4þ site
(2.34 A), on a pristine structure, decreases to 2.30 A for U5þ,
while for the U3þ site it increases to 2.53 A. Based on these
results, we identify that charge localized U atoms signifi-
cantly attract/repel adjacent ions (i.e., distort its lattice struc-
ture), and then the lattice distortions are achieved.
APPENDIX B: CHARGE THERMAL CONDUCTIVITY
The polaron electrical conductivity ðre;IÞ of UO2 with
open surface (pore) is modeled by31
re;I ¼re;�;I
T2xð1� 2xÞexp � Ea
kBT
� �; (B1)
where re;�;I is the pre-exponential factor and x is the defect
concentration. Here, for Ea, we use the activation energy of a
small polaron migration (Ea¼ 0.21 eV (Ref. 34)). From the
results of the extrinsic regime given in the literature,31 and
using re;I ¼ ð1:2� 106=TÞ2xð1� 2xÞexp½�0:21=ðkBTÞ�, we
find x¼ 0.01.
For the intrinsic electrical conduction model, we use
re;II ¼ neecle, where ne is carrier density and le is the carrier
mobility. The carrier density based on the quantum-mechanical
treatment of the conduction electrons in nondegenerate state
is28
ne ¼2ð2pme;ekBTÞ3=2
h3p
exp �DEe;g
2kBT
� �; (B2)
where me,e is the effective mass and hp is the Planck
constant. This relation is then approximated to the simple
form re;II ¼ re;�;IIexp½�DEe;g=ð2kBTÞ�, where re;�;II is the
pre-exponential factor. Based on the average results of the
previous report,28 we used re;�;II ¼ 3:569� 103 S=cm.
FIG. 7. (a) Temperature dependence of the effective charge of UO2 atoms in
the (111) plane. The left and right panels are for the pore surface and the
bulk structure, respectively. The error range is plotted with the shaded area
of each element. The calculated effective charge of U and O atoms at
T¼ 0 K are also shown with the dashed lines ðqe;U ¼ 2:40 and
qe;O ¼ �1:20 ecÞ. (b) The iso-charge-density difference surfaces of U5þ
(left) and U3þ (right) compared to U4þ. The cut-off bond lengths of U-O
used are 2.33 and 2.29 A, respectively. The iso-charge-density surfaces are
set as 0.0137 (left) and 0.0583 (right) ec-Bohr�3. Yellow and cyan colors
mean positive and negative charges.
FIG. 8. Calculated temperature dependence of (a) electrical conductivity
and (b) electronic thermal conductivity of UO2 with pores. The contributions
are from small polaron and from the intrinsic semiconductor conduction
electrons, activated with different energies. The available experimental
results28,31 are also shown.
123510-6 Kim, Kim, and Kaviany J. Appl. Phys. 115, 123510 (2014)
[This article is copyrighted as indicated in the article. Reuse of AIP content is subject to the terms at: http://scitation.aip.org/termsconditions. Downloaded to ] IP:
141.212.141.91 On: Wed, 26 Mar 2014 18:54:55
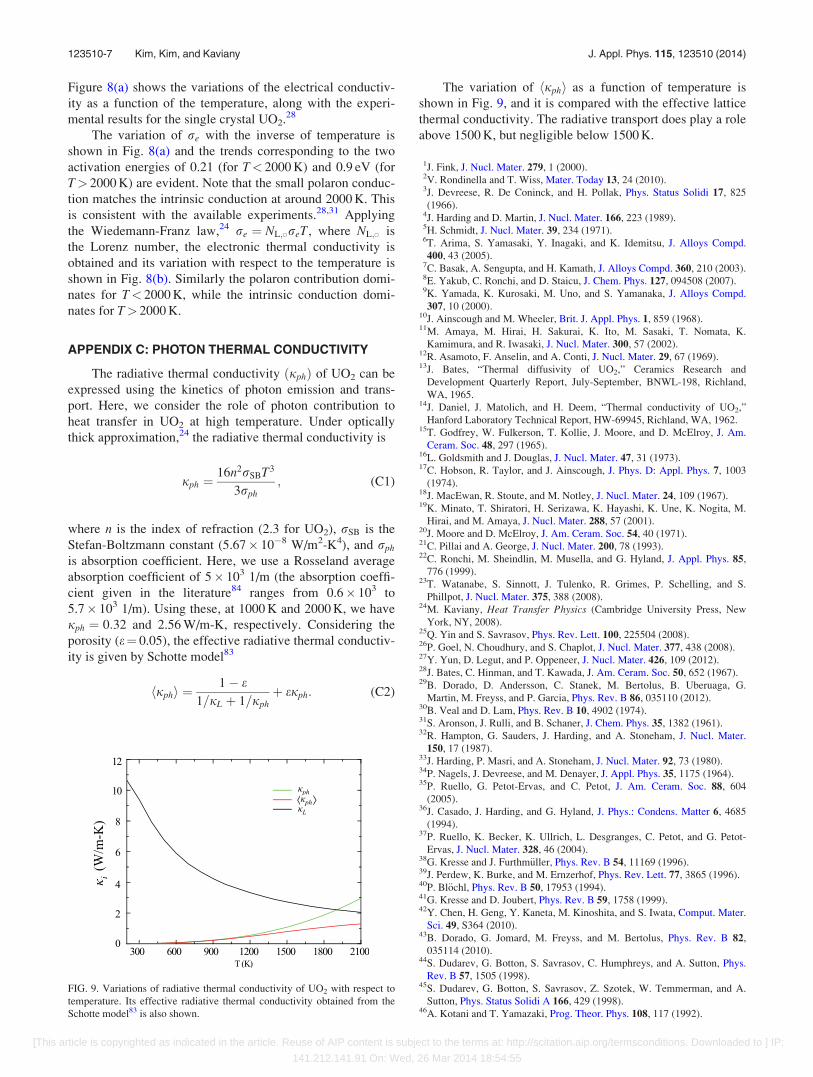
Figure 8(a) shows the variations of the electrical conductiv-
ity as a function of the temperature, along with the experi-
mental results for the single crystal UO2.28
The variation of re with the inverse of temperature is
shown in Fig. 8(a) and the trends corresponding to the two
activation energies of 0.21 (for T< 2000 K) and 0.9 eV (for
T> 2000 K) are evident. Note that the small polaron conduc-
tion matches the intrinsic conduction at around 2000 K. This
is consistent with the available experiments.28,31 Applying
the Wiedemann-Franz law,24 re ¼ NL;�reT, where NL;� is
the Lorenz number, the electronic thermal conductivity is
obtained and its variation with respect to the temperature is
shown in Fig. 8(b). Similarly the polaron contribution domi-
nates for T< 2000 K, while the intrinsic conduction domi-
nates for T> 2000 K.
APPENDIX C: PHOTON THERMAL CONDUCTIVITY
The radiative thermal conductivity ðjphÞ of UO2 can be
expressed using the kinetics of photon emission and trans-
port. Here, we consider the role of photon contribution to
heat transfer in UO2 at high temperature. Under optically
thick approximation,24 the radiative thermal conductivity is
jph ¼16n2rSBT3
3rph; (C1)
where n is the index of refraction (2.3 for UO2), rSB is the
Stefan-Boltzmann constant (5.67� 10�8 W/m2-K4), and rph
is absorption coefficient. Here, we use a Rosseland average
absorption coefficient of 5� 103 1/m (the absorption coeffi-
cient given in the literature84 ranges from 0.6� 103 to
5.7� 103 1/m). Using these, at 1000 K and 2000 K, we have
jph ¼ 0:32 and 2.56 W/m-K, respectively. Considering the
porosity (e¼ 0.05), the effective radiative thermal conductiv-
ity is given by Schotte model83
hjphi ¼1� e
1=jL þ 1=jphþ ejph: (C2)
The variation of hjphi as a function of temperature is
shown in Fig. 9, and it is compared with the effective lattice
thermal conductivity. The radiative transport does play a role
above 1500 K, but negligible below 1500 K.
1J. Fink, J. Nucl. Mater. 279, 1 (2000).2V. Rondinella and T. Wiss, Mater. Today 13, 24 (2010).3J. Devreese, R. De Coninck, and H. Pollak, Phys. Status Solidi 17, 825
(1966).4J. Harding and D. Martin, J. Nucl. Mater. 166, 223 (1989).5H. Schmidt, J. Nucl. Mater. 39, 234 (1971).6T. Arima, S. Yamasaki, Y. Inagaki, and K. Idemitsu, J. Alloys Compd.
400, 43 (2005).7C. Basak, A. Sengupta, and H. Kamath, J. Alloys Compd. 360, 210 (2003).8E. Yakub, C. Ronchi, and D. Staicu, J. Chem. Phys. 127, 094508 (2007).9K. Yamada, K. Kurosaki, M. Uno, and S. Yamanaka, J. Alloys Compd.
307, 10 (2000).10J. Ainscough and M. Wheeler, Brit. J. Appl. Phys. 1, 859 (1968).11M. Amaya, M. Hirai, H. Sakurai, K. Ito, M. Sasaki, T. Nomata, K.
Kamimura, and R. Iwasaki, J. Nucl. Mater. 300, 57 (2002).12R. Asamoto, F. Anselin, and A. Conti, J. Nucl. Mater. 29, 67 (1969).13J. Bates, “Thermal diffusivity of UO2,” Ceramics Research and
Development Quarterly Report, July-September, BNWL-198, Richland,
WA, 1965.14J. Daniel, J. Matolich, and H. Deem, “Thermal conductivity of UO2,”
Hanford Laboratory Technical Report, HW-69945, Richland, WA, 1962.15T. Godfrey, W. Fulkerson, T. Kollie, J. Moore, and D. McElroy, J. Am.
Ceram. Soc. 48, 297 (1965).16L. Goldsmith and J. Douglas, J. Nucl. Mater. 47, 31 (1973).17C. Hobson, R. Taylor, and J. Ainscough, J. Phys. D: Appl. Phys. 7, 1003
(1974).18J. MacEwan, R. Stoute, and M. Notley, J. Nucl. Mater. 24, 109 (1967).19K. Minato, T. Shiratori, H. Serizawa, K. Hayashi, K. Une, K. Nogita, M.
Hirai, and M. Amaya, J. Nucl. Mater. 288, 57 (2001).20J. Moore and D. McElroy, J. Am. Ceram. Soc. 54, 40 (1971).21C. Pillai and A. George, J. Nucl. Mater. 200, 78 (1993).22C. Ronchi, M. Sheindlin, M. Musella, and G. Hyland, J. Appl. Phys. 85,
776 (1999).23T. Watanabe, S. Sinnott, J. Tulenko, R. Grimes, P. Schelling, and S.
Phillpot, J. Nucl. Mater. 375, 388 (2008).24M. Kaviany, Heat Transfer Physics (Cambridge University Press, New
York, NY, 2008).25Q. Yin and S. Savrasov, Phys. Rev. Lett. 100, 225504 (2008).26P. Goel, N. Choudhury, and S. Chaplot, J. Nucl. Mater. 377, 438 (2008).27Y. Yun, D. Legut, and P. Oppeneer, J. Nucl. Mater. 426, 109 (2012).28J. Bates, C. Hinman, and T. Kawada, J. Am. Ceram. Soc. 50, 652 (1967).29B. Dorado, D. Andersson, C. Stanek, M. Bertolus, B. Uberuaga, G.
Martin, M. Freyss, and P. Garcia, Phys. Rev. B 86, 035110 (2012).30B. Veal and D. Lam, Phys. Rev. B 10, 4902 (1974).31S. Aronson, J. Rulli, and B. Schaner, J. Chem. Phys. 35, 1382 (1961).32R. Hampton, G. Sauders, J. Harding, and A. Stoneham, J. Nucl. Mater.
150, 17 (1987).33J. Harding, P. Masri, and A. Stoneham, J. Nucl. Mater. 92, 73 (1980).34P. Nagels, J. Devreese, and M. Denayer, J. Appl. Phys. 35, 1175 (1964).35P. Ruello, G. Petot-Ervas, and C. Petot, J. Am. Ceram. Soc. 88, 604
(2005).36J. Casado, J. Harding, and G. Hyland, J. Phys.: Condens. Matter 6, 4685
(1994).37P. Ruello, K. Becker, K. Ullrich, L. Desgranges, C. Petot, and G. Petot-
Ervas, J. Nucl. Mater. 328, 46 (2004).38G. Kresse and J. Furthm€uller, Phys. Rev. B 54, 11169 (1996).39J. Perdew, K. Burke, and M. Ernzerhof, Phys. Rev. Lett. 77, 3865 (1996).40P. Bl€ochl, Phys. Rev. B 50, 17953 (1994).41G. Kresse and D. Joubert, Phys. Rev. B 59, 1758 (1999).42Y. Chen, H. Geng, Y. Kaneta, M. Kinoshita, and S. Iwata, Comput. Mater.
Sci. 49, S364 (2010).43B. Dorado, G. Jomard, M. Freyss, and M. Bertolus, Phys. Rev. B 82,
035114 (2010).44S. Dudarev, G. Botton, S. Savrasov, C. Humphreys, and A. Sutton, Phys.
Rev. B 57, 1505 (1998).45S. Dudarev, G. Botton, S. Savrasov, Z. Szotek, W. Temmerman, and A.
Sutton, Phys. Status Solidi A 166, 429 (1998).46A. Kotani and T. Yamazaki, Prog. Theor. Phys. 108, 117 (1992).
FIG. 9. Variations of radiative thermal conductivity of UO2 with respect to
temperature. Its effective radiative thermal conductivity obtained from the
Schotte model83 is also shown.
123510-7 Kim, Kim, and Kaviany J. Appl. Phys. 115, 123510 (2014)
[This article is copyrighted as indicated in the article. Reuse of AIP content is subject to the terms at: http://scitation.aip.org/termsconditions. Downloaded to ] IP:
141.212.141.91 On: Wed, 26 Mar 2014 18:54:55

47P. Jund and R. Jullien, Phys. Rev. B 59, 13707 (1999).48F. M€uller-Plathe, J. Chem. Phys. 106, 6082 (1997).49S. Stackhouse, L. Stixrude, and B. Karki, Phys. Rev. Lett. 104, 208501
(2010).50D. Wang, L. Tang, M. Long, and Z. Shuai, J. Phys. Chem. C 115, 5940
(2011).51D. Martin, J. Nucl. Mater. 152, 94 (1988).52A. McGaughey and M. Kaviany, Int. J. Heat Mass Transf. 47, 1799 (2004).53D. McQuarrie, Statistical Mechanics (University Science Books,
Sausalito, CA, 2000).54B.-L. Huang and M. Kaviany, J. Appl. Phys. 100, 123507 (2006).55G. Slack, “The thermal conductivity of nonmetallic solids,” in Solid State
Physics, edited by F. Seitz, D. Turnbull, and H. Ehrenreich (Academic
Press, New York, NY, 1979).56D. Cahill, A. Melville, D. Schlom, and M. Zurbuchen, Appl. Phys. Lett.
96, 121903 (2010).57D. Cahill, S. Watson, and R. Pohl, Phys. Rev. B 46, 6131 (1992).58T. Arima, S. Yamasaki, K. Idemitsu, and Y. Inagaki, J. Nucl. Mater. 376,
139 (2008).59S. Motoyama, Y. Ichikawa, Y. Hiwatari, and A. Oe, Phys. Rev. B 60, 292
(1999).60T. Uchida, T. Sunaoshi, M. Kato, and K. Konashi, Prog. Nucl. Sci.
Technol. 2, 598 (2011).61B. Willis, Proc. R. Soc. London, Ser. A 274, 134 (1963).62H. Geng, H. Song, K. Jin, S. Xiang, and Q. Wu, Phys. Rev. B 84, 174115
(2011).63A. Momin and M. Karkhanavala, High Temp. Sci. 10, 45 (1978).64R. Devanathan, J. Yu, and W. Weber, J. Chem. Phys. 130, 174502 (2009).65G. Dolling, R. Cowley, and A. Woods, Can. J. Phys. 43, 1397 (1965).66K. Parlinski, Phonon Software (Cracow, Poland, 2008).67J. Gale and A. Rohl, Mol. Simul. 29, 291 (2003).
68J. Pang, W. Buyer, A. Chernatynskiy, M. Lumsden, B. Larson, and S.
Phillpot, Phys. Rev. Lett. 110, 157401 (2013).69M. Holland, Phys. Rev. 132, 2461 (1963).70M. Kaviany, Principles of Heat Transfer in Porous Media, 2nd ed.
(Springer, New York, NY, 1995).71J. Maxwell, A Treatise on Electricity and Magnetism (Clarendon Press,
Oxford, United Kingdom, 1904).72K. Schlichting, N. Padture, and P. Klemens, J. Mater. Sci. 36, 3003
(2001).73J. Conway and A. Feith, “An interim report on a round robin experimental
program to measure the thermal conductivity of stoichiometric uranium
dioxide,” General Electric Report, GEMP-715, Fairfield, CT, 1969.74T. Godfrey, W. Fulkerson, T. Kollie, J. Moore, and D. McElroy, “The
thermal conductivity of uranium dioxide and armco iron by an improved
radial heat flow technique,” Oak Ridge National Laboratory Report,
ORNL-3556, Oak Ridge, TN, 1964.75H. Kim and M. Kaviany, Phys. Rev. B 87, 155133 (2013).76J. Lee, S. Pennycook, and S. Pantelides, Appl. Phys. Lett. 101, 033901
(2012).77T. Maxisch, F. Zhou, and G. Ceder, Phys. Rev. B 73, 104301 (2006).78J. Rabone and M. Krack, Comput. Mater. Sci. 71, 157 (2013).79F. Skomursk, R. Ewing, A. Rohl, J. Gale, and U. Becker, Am. Min. 91,
1761 (2006).80P. Tasker, Surf. Sci. 87, 315 (1979).81G. Henkelman, A. Amaldsson, and H. Jonsson, Comput. Mater. Sci. 36,
354 (2006).82G. Hyland and J. Ralph, High Temp. High Press. 15, 179 (1983).83W. Schotte, AIChE J. 6, 63 (1960).84J. Bates, “Visible and infrared absorption spectra of uranium dioxide,”
Ceramics Research and Development Quarterly Report, July-September,
BNWL-198, Richland, WA, 1965.
123510-8 Kim, Kim, and Kaviany J. Appl. Phys. 115, 123510 (2014)
[This article is copyrighted as indicated in the article. Reuse of AIP content is subject to the terms at: http://scitation.aip.org/termsconditions. Downloaded to ] IP:
141.212.141.91 On: Wed, 26 Mar 2014 18:54:55