Embed Size (px)
Citation preview

~~ n NEW MEXICO STATE UNIVERSITY LAS CRUCES, NEW MEXICO 88001 AREA 505 646-2614
Observatory
LATITUDE AND LONGITUDE MEASUREMENTS OF JOVIAN FEATURES
IN 1967-68
E, J. Reese
and --4
H, G. Solberg
The Observatory* New Mexico State University Las Cruces, New Mexico 88001
April 1969
*TN-701-69-28 Supported i n part by NASA Grants NGL 32-003-001 and NGR 32-003-027
https://ntrs.nasa.gov/search.jsp?R=19690017032 2018-12-01T20:53:36+00:00Z

LATITUDE AND LONGITUDE MEASUREMENTS OF JOVIAN
FEATURES IN 1967-68
E, J. Reese and H. G. Solberg
ABSTRACT
Photographic observations of Jupiter during the apparition
of 1967-1968 are diSCUSsed,
and acceZerations i n the motions of atmospheric features are
described i n de ta i l .
of the Jovian be l t s and a nwnber of selected features are
sumarized.
Several interesting osoil lations
Photographic measurements of the lati tudes
INTRODUCTION
For several years the New Mexico State University Observatory has been
engaged in a photographic patrol of the planet Jupiter.
designed to give a photographic record of every longitude of the planet
in blue,, green, and red light at least once every six days,
in infrared and ultraviolet light are taken at less frequent intervals.
Observations are just as numerous when the planet is in the morning sky
as in the evening sky, and every effort is made to minimize the interval
during which Jupiter is not observed because of proximity to the sun, Each
photographic plate has a sensitometric step wedge for photometric work, and
a fiducial line for orientation purposes,
image is recorded to the nearest second by a digital recorder.
The patrol is
Photographs
The Universal Time for each
This photographic record provides an excellent basis for systematic
work in following the motions of Jovian spots in longitude and latitude,
We have been making a large number of measurements of selected Jovian
spots with a Mann measuring machine using techniques described elsewhere
(Reese and Solberg, 1966). We have found some interesting oscillations
in the motions of spots which probably would have been missed in the past
because of insufficiently accurate data,
A number of interesting events took place on Jupiter during the
apparition of 1967-68.
ness--especially in blue light--that has never before been equalled, not
even in 1938 (Peek, 1958, p. 97). A small yellow spot in the South
Polar Region at zenographic latitude -60' had a mean rotation period of
9 55 12
A very dark streak which developed in the middle of the South Temperate
The Equatorial Band attained a width and dark-
h m s which is unique in the records of the planet for that latitude.

2
Belt grea t ly resembled the "Red Streak of 1891t1 (Reese, 1968). The
highl ight of t he apprait ion, however, was the appearance of a small
dark spot on the south edge of t he North North Temperate Belt which,
by its rapid rotat ion, proved t o belong t o the r a re ly observed N , N,
Temperate Current B which was last observed i n 1945,
was a l l the more in t e re s t ing s ince i t s motion i n longitude displayed a
This NNTBs spot
nearly perfect f r ee osc i l l a t ion having an amplitude of 3f4 i n longitude
and a period of 66.4 days,
The terminology and abbreviations used i n t h i s report are similar t o
those used by Peek (1958). In addition, we sometimes use n/ and '/ t o
denote the north and south edges of an object.
LATITUDE MEASUREMENTS
A t o t a l of 632 measurements were made of the la t i tudes of the Jovian
b e l t s and 18 selected features during 1967-68. Most o f , t h e p la tes
measured were taken i n blue l i g h t s ince the limb of t he planet i s best
defined i n t h i s color. However, ce r t a in features, such as the Red Spot
Hollow and the small yellow spot i n the South Polar Region, were measured
on p l a t e s taken i n red l i g h t s ince they did not show up well on p l a t e s
taken i n blue l i gh t .
the appari t ion i n t o three pa r t s so t h a t any progressive changes i n
l a t i t ude might become apparent.
South Temperate Belt and an equatorward trend of the south edge of the
Table I , which summarizes the b e l t l a t i tudes , divides
A poleward trend of the north edge of the
SEBn are probably real. Other apparent trends are not appreciably larger
than the standard deviation of the measurements. Generally, the b e l t s on
Jup i t e r are remarkably fixed i n l a t i t ude . The l a t i t ude of a b e l t may vary
with time and longitude, but only within ra ther small limits.

3
For the most part the belts were near their normal latitudes in 1967-68
(Solberg and Reese, 1969).
wide, and the poleward edges of the North Equatorial Belt and the South
Equatorial Belt were a little further from the equator than usual. The
South Polar Belt near latitude -67" was quite dark and well-defined
despite its location in the dusky polar region,
of the South Tropical Zone at latitude -24P4 is an unusual feature which
appeared to emanate from the preceding tip of the Red Spot and to fade
away about 90' preceding the Red Spot.
of the violent interaction of SEBs spots with the Red Spot during the two
preceding apparitions.
The Equatorial Band was unusually dark and
The dark belt in the middle
This belt may have been an aftermath
Latitude measurements of selected spots will be summarized in the
following sections which deal with the longitudes and rotation periods of
those spots,
ROTATION PERIODS OF INDIVIDUAL SPOTS
We will now summarize reductions made from measurements of the
longitudes of individual spots,
Small Yellow Spot in the South Polar Region
Mean zenographic.latitude, 8" = -59P9 +0:4 (7 dates).
Mean width in latitude = 3:7 f0:3 (7 dates).
Mean length in longitude = 5:2 +092 (12 dates).
1968 Limiting Limiting A A2 Rot at i on
h m s Object Dates Longitudes N 'day Period S.D.
Yellow Spot Jan 16--Mar 15 229:7--187:1 12 -0:7222 9 55 11.0 kls5

4
The d r i f t of t h i s spot i n longitude was de f in i t e ly nonlinear (Fig, 1).
A t least squares polynomial so lu t ion indicates t h a t t he spot was subjected
t o constant accelerat ion i n its rate of d r i f t i n decreasing System IT
longitude.
1 September 1967, is given by the equation:
The computed longitude at any time, T, expressed i n days Erom
2 A2 = 140'15 + 1'1612T - 0'1007T
From t h i s it follows tha t the da i ly d r i f t of the spot i n System I1
longitude at any time, T, was 1'1612 -0'5014T. Thus, when first observed on
16 January, the spot had a ro ta t ion period of 9 h m s 55 28 which is normal f o r
i ts la t i tude ; but when las t observed on 15 March, the period had decreased
t o the unusual value of 9 54 54 . h m s
During the interval of observation, t he spot moved slowly but s t ead i ly
poleward i n la t i tude .
measurements placed the center of t he spot a t -58'36 k0:2 on 16 January and
-61:l k0'33 on 15 March, a s h i f t of 2% degrees i n two months,
A l i nea r least squares solut ion of the l a t i t ude
If t h i s small, yellow spot had behaved as a closed system conserving h m s
The fact tha t i t s period decreased only t o
angular momentum, i t s ro t a t ion period would have.decreased t o 8 34 38
it had moved 2'15 poleward.
9 54 54
after
h m s might indicate t h a t the spot l o s t ro t a t iona l veloci ty as it moved
poleward due t o res i s tance from more slowly moving atmospheric currents i n
higher la t i tudes .
from l a t i t ude -45' t o the pole might have a f a i r l y uniform ro ta t ion period
of about 9 55 30 , Such an atmosphere would have a ro ta t iona l veloci ty a t
l a t i t ude -61y1 which would be only 0.9296 as great as a t l a t i t ude -58'36,
The observed veloci ty
veloci ty a t l a t i t ude -58'16.
Peek (1958) has suggested t h a t the South Polar Region
h m s
2 of the spot a t l a t i t ude -61'11 was 0,9304 of i ts
The ro ta t iona l ve loc i ty of the spot ac tua l ly

5
2 underwent a deceleration of 0.94 x lf4m/sec rather thafi accelerating 2 1.02 x m/sec as would a closed system. However, relative t o a
meridian rotating at the uniform rate of System ?I, the spot actually
accelerated 0.01 x
as would a closed system.
conserving angular momentum, but with loses due to resistance corresponding
to a deceleration of 1.96 x m/sec .
m/sec 2 rather than accelerating 1,97 x lom4 m/sec 2
Hence the spot appeared ta behave as a system
2
Small White Spot in SSTeZ [S.S.S. Temperate Current)
Mean zenographic latitude, B" = -50:3 kOP2 (5 dates)
Mean width in latitude = 4:3 +0'14 (5 dates)
Mean length in longitude = 5'18 k0:3 (8 dates)
1968 Limiting Limiting Ax2 Rot at ion
Object Dates Longitudes N 'day Period S.D.
White Spot Jan 16--Feb 27 218'17-218'11 8 -6:0148 9 h m s 55 40.0 51:s
Spots in Southern Part of STeZ (S.S. Temperate Current)
19679-1968 Limiting Limiting Ax2 Rotation
Object Dates Longitudes N 'day Periog S.D.
1 CWf) Sep 18--Jan 22 201'15--90:0 10 -0'18851 9 h 55 m s 4 . 3 k0.6 S
2 I W f ) Oct 3--Jan 31 298.8--192.1 5 -0.8891 9 55 4 .2 +0,6 3 CWCI Dec 7--Apr 6 283.4--174.9 12 -0.8973 9 55 3.8 k1.0 4 CWC) Dec 7--Jun 7 291.5-125.9 15 -0.9050 9 55 3.5 50.2 5 CDcl May 11--Jun 30 30.8--346.9 8 -0.8784 9 55 4.6 21.8
Mean rotation period -,9 55 4.0 h m s
6
Me an Lati tude Ob j e c t
Mean Width
Mean Length
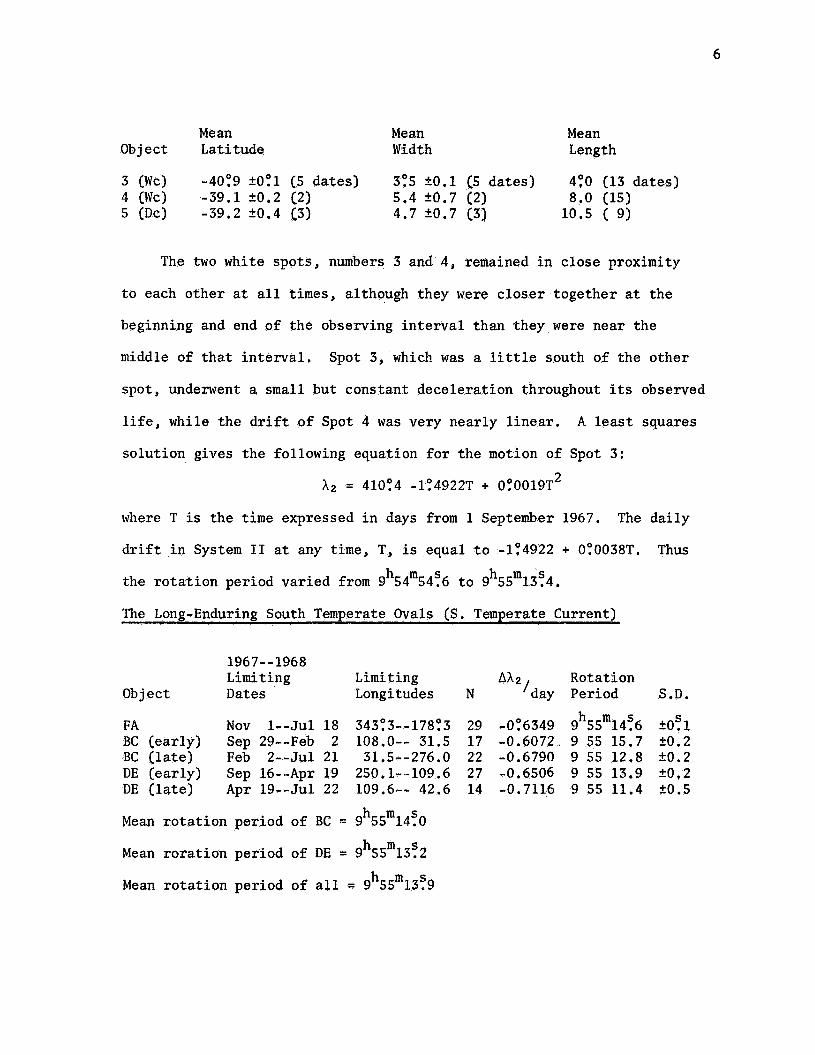
3 (Wc) -40:9 20'51 (5 dates) 3:s 50.1 (5 dates) 4:O (13 dates) 4 (WC) -39.1 20.2 (2) 5.4 k0.7 (2) 8.0 (15) 5 (Dc) -39.2 k0.4 (3) 4.7 k0.7 (3) 10.5 C 9)
The two white spots , numbers 3 and 4, remained i n close proximity
t o each other a t a l l times, although they were c loser together a t the
beginning and end of the observing interval than they were near t he
middle of t ha t i n t e rva l , Spot 3, which was a l i t t l e south of the other
spot, underwent a small but constant deceleration throughout i t s observed
l i fe , while t he d r i f t of Spot 4 was very nearly l inear . A least squares
solut ion gives the following equation f o r the motion of Spot 3:
2 X p = 410'34 -1'34922T + 0?0019T
where T is the time expressed i n days from 1 September 1967.
d r i f t i n System I1 a t any time, T, is equal t o -194922 + 0t0038T.
the ro ta t ion period varied from 9 54 54.6 t o 9 55 13.4.
The da i ly
Thus
h m s h m s
The Long-Enduring South Temperate Ovals (S. Temperate Current)
1967--1968 Limiting Limiting 2 Rot a t i on
Object Dates Longitudes N 'day Period S.D.
FA Nov 1--Jul 18 343'53--178'33 29 -0'56349 9 h m s 55 14.6 + O f 1 BC (early) Sep 29--Feb 2 108.0-- 31.5 17 -0.6072. 9 55 15.7 k0.2 BC ( l a t e ) Feb 2--Jul 2 1 31.5--276.0 22 -0.6790 9 55 12.8 20.2 DE (early) Sep 16--Apr 19 250.1--109.6 27 -0.6506 9 55 13.9 k0.2 DE ( l a t e ) Apr 19--Jul 22 109.6-- 42.6 14 -0.7116 9 55 11.4 20.5
Mean ro ta t ion period of BC 6: 9 55 14.0
Mean rorat ion period of DE = 9 55 13.2 h m s Mean ro ta t ion period of a l l = 9 55 13.9
h m s
h m s
7
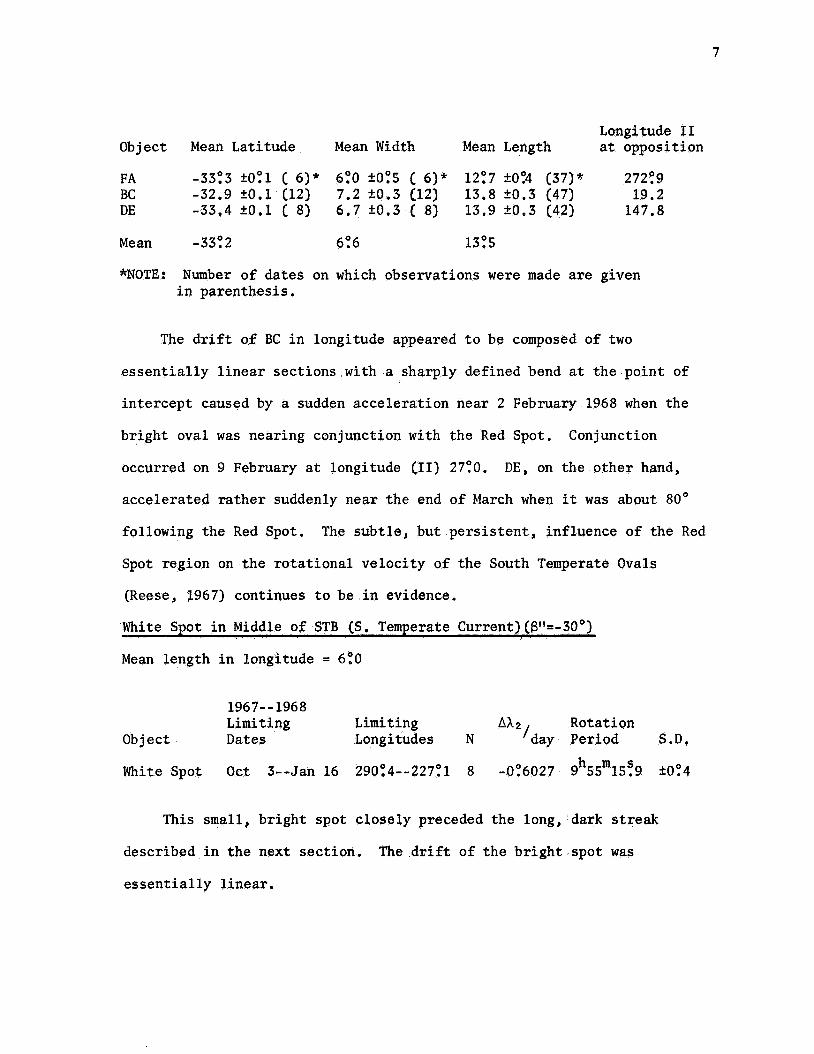
Longitude TI Object Mean Latitude Mean Width Mean Length a t opposition
FA -33:3 20'11 [ 6)* 6'10 20'15 ( 6)" 12:7 20:4 (37)" 272:9 BC -32.9 20.1 (12) 7.2 20.3 (12) 13.8 k0.3 (47) 19.2 DE -33.4 20 , l C 8) 6.7 k0.3 ( 8) 13.9 20.3 (42) 147.8
Mean -33'12 6'16 13'15
*NOTE: Number of dates on which observations were made are given i n parenthesis.
The d r i f t of BC i n longitude appeared t o be composed of two
essent ia l ly l i nea r sections with a sharply defined bend a t the point of
intercept caused by a sudden accelerat ion near 2 February 1968 when the
br ight oval was nearing conjunction with the Red Spot. Conjunction
occurred on 9 February a t longitude (11) 27'10. DE, on the other hand,
accelerated ra ther suddenly near the end of March when it was about 80'
following the Red Spot. The subt le , but pers i s ten t , influence of the Red
Spot region on the ro ta t iona l veloci ty of the South Temperate Ovals
(Reese, 1967) continues t o b e 8 i n evidence.
White Spot i n Middle of STB (S. Temperate Current) (f3"=-3Oo)
Mean length i n longitude = 6:O
1967- - 1968 Limiting Limiting 2 Rot a t i on
Object Dates Longitudes N 'day Period S.D,
White Spot O c t 3--Jan 16 290'14--227'11 8 -0'16027 9 h m s 55 15,9 +0:4
This small, br ight spot c losely preceded the long, dark s t reak
described i n the next section. The d r i f t of t h e b r igh t . spo t was
e s sen t i a l ly l inear ,

8
Dark Streak i n Middle of STB LS. TempePate'Current]
Mean zenographic l a t i t ude = -30:4 & O f 1 (11 dates)
Mean width i n l a t i t ude = 4:1 kOP5 (11 dates)
Mean length i n longitude = 17t3 kOP3 C31 dates)
1967--1968 Limiting Limiting Ah2 Rot a t i on , *
Object Dates Longitudes N 'day Period S.D.
Dark Streak (early) Oct 15--Jan 1 310:4--254:5 10 -0:7137 9 55 11.3 k0:3 Dark Streak ( l a t e ) Jan 1--Mar 10 254.5--212.9 21 -0.6038 9 55 15.9 k0.5
Mean ro t a t ion period of dark s t reak = 9 55 12.4
h m s
h m s
A descr ipt ion of t h i s conspicuous dark s t reak has already been
published (Reese, 1968). The s t reak began t o fade i n ear ly March and
was l a s t photographed on 15 March when i ts center was a t longitude 205:6
and i ts length had decreased t o about 14'.
motion i n decreasing longitude accelerated.
8 t o 15 March was 9 54 39 .
As the s t reak faded, i ts
The ro ta t ion period from
h m s There may be a tendency f o r dark spots t o
accelerate during in t e rva l s when they a re fading rapidly. A few very
small condensations were recorde4 i n the STB near the extrapoloted
longitude of the dark s t reak during the la t te r ha l f of March and ear ly
April; however, these fragments bore no resemblence~to the former s t reak.
1967-- 1968 Limiting Limiting AX2 Rot a t i on
Object Dates Longitudes N 'day Period S.D.
Dec, 8--Feb 16 144:0--308:5 6 -2:7939 9 h m s 53 46.3 *Os6 1 2 Feb 2O--Mar 13 269.7--199.6 5 -3.1863 9 53 30,3 k l . l 3 Mar 13--Apr 20 329.3--222.4 7 -2.8131 9 53 45.5 21.4
Mean ro ta t ion period = 9 53 40.7 h m s

9
Spot 1 apparently moved pas t the south edge of t he Red Spot on
20 January.without being caught i n the Red Spot vortex as was a similar
spot i n January, 1966 (Reqse and Swith, 1968). The d r i f t of Spot 1 seems
t o be r e l i a b l e since a l l of the measured longitudes f a l l within 1' of a
l i nea r least squares l ine, and the d r i f t c lose ly p a r a l l e l s those of spots
2 and 3,
respectively.
The mean lengths of spots 1, 2, and 3 were 4!7, 4t1, and 5:O
Red Spot Hollow
Mean zenographic l a t i t u d e = -22z18 2.0'115 (11 dates)
Mean width i n l a t i t ude = 8f8 AOq2 (11 dates)
Mean length i n longitude = 17z8 +Of3 (25 dates)
1967--1968 Limiting Limiting LU 2 Rot a t ion
Object Dates Longitudes N 'day Period S.D.
Oct l--Mar 16 27;2--26'18 25 -cl",OO28 9 h m 55 40:s kO.1 S RSH
Longitude (11) at opposition = 26'18
Measurements of t he length and width o f , t h e Red Spot Hollow ,were f o r
the br ight i n t e r i o r of t h a t object and d id not include the dark border,
The d r i f t of the Hollow (Fig. 2) was nonlinear and grea t ly resembled
a damped harmonic o s c i l l a t i o n of the form:
A2 = a + b t + ceTkt s i n 0 t
A general least squares so lu t ion gives the following equation fQr
the Hollow's motiQn i n longitude with no res idua l being grea te r than Of39:
X2= 27f)03 - 0'10028t + Oq649 e-0*014tsin 5!2941t
The period of o s c i l l a t i o n was 68 days, and t i s the time i n days from 14
December 1967.
1940-41 had a nearly iden t i ca l damping coef f ic ien t , k , of 0.015 (Peek, 1958),
I t is of interest t o note that t he o s c i l l a t i n g spot of

10
Longitude measurements of the Hollow were car r ied out a t a time when
the Hollow was very br ight and well defined i n red l i g h t (Fig. 3) while
the Red Spot was very f a i n t and d i f fuse i n blue l i gh t . A s t h e Red Spot
darkened late i n the apparit ion, t h e Hollow became poorly defined and
measurements of the Hollow were discontinued. Although the osc i l l a t ions
of the Red Spot and the Hollow generally were i n phase with one another,
the amplitude of t he Red Spot*s osc i l l a t ion was much greater than tha t of
the Hollow (Fig. 4)
Photographs taken i n green l i g h t c l ea r ly show a var iable displacement
of the Red Spot towards the following end of the Hollow.
apparit ion, the out l ine of the Red Spot expanded u n t i l it apparently
coincided with what was formerly the dark border of the Hollow.
Red Spot
Mean zenographic l a t i t ude = -23:O (59 dates)
Mean width i n l a t i t ude = lOP0 (59 dates)
Mean length i n longitude = 19:s (90 dates)
Later i n the
1967--1968 Limiting Limiting Ah 2 Rot at ion
Object Dates Longitudes N 'day Period S.D.
RSC Sep 12--Jul 1'7 28:0--26:'7 90 -0:0043 9 h m s 55 40.5 + O s 1
Longitude (11) at opposition, 20 February 1968 = 26:2
During the apparit ion, t he Red Spot increased grea t ly i n size and
became much more prominent. The behavior of the Red Spot during the
apparit ion has been discussed (Solberg, 1969).

11
White Spot i n Northern Part of South'Traplcal Zone CBfk-21f8)
196 8 Limiting Limiting Ah2 Rot a t ion
Object Dates Longitudes N 'day Period S.D.
White Spot Jan 22--Mar 6 325:1--340:6 10 +0:3528 9 h m s 55 55 , l +1:9
The d r i f t of t h i s spot was qui te sinuous, due perhaps t o i t s
nearness t o the l i n e of shear betweeen the South Tropical Current and the
retrograde current on the south edge of the South Equatorial Belt. The
spot was elongated i n the d i rec t ion of ro ta t ion and had a length of 5:6
and a width of 2:l.
Dark Spots on South Edge SEBs (N. Branch of Circulating C u r ~ e n t ) ( B ~ ~ = - 2 1 ~ )
Object
1 2 3 4 5 6 7 8 9
10 11 1 2 13 14 15 16 17 18
Limiting Dates 1967--1968
Sep 18--Nov 8 Sep 29--Nov 20 Nov 10--Dec 7 Nov 9--Dec 7 Nov 4--Jan 3 Nov 4--Jan 5 Dec l--Jan 13 Dec 23--Jan 29 Nov 14--Jan 24 Nov 14--Jan 5 Jan 16--Feb 11 Dec l--Feb 25 Jan 2--May 1 Jan 3--Feb 26 Feb 25--Mar 23 Mar 22--Apr 28 Mar 24--Apr 28 May 5--Jun 8
Limiting Longitudes
195"--338O 76 --245
181 --268 151 --247 119 --328 100 --316 174 --329 235 --356 90 --329 66 --231
257 --337 82 --352
134 --346 120 --299 169 --251 170 --282 140 --252 180 --287
A x 2 N 'day
7 +2:8039 9 +3.2500 3 +3.2222 3 +3,4285 6 +3.4833 9 +3.4838 7 +3,6046 6 +3.2702 8 +3,3661 7 +3.1730 5 +3.0769
25 +3.1395 13 +3.5932 8 +3.3148 4 +3.0370 9 +3.0270
10 +3.2000 6 +3.1470
Rot a t i on Period
h m S 9 57 36.1 9 57 54.6 9 57 53.5 9 58 2.0 9 58 4.2 9 58 4.2 9 58 9.2 9 57 55.4 9 57 59.4 9 57 51.4 9 57 47.5 9 57 50.0 9 58 8.7 9 57 57.3 9 57 45.8 9 57 45.4 9 57 52.5 9 57 50.4
Mean ro ta t ion period = gh5?54?9
12
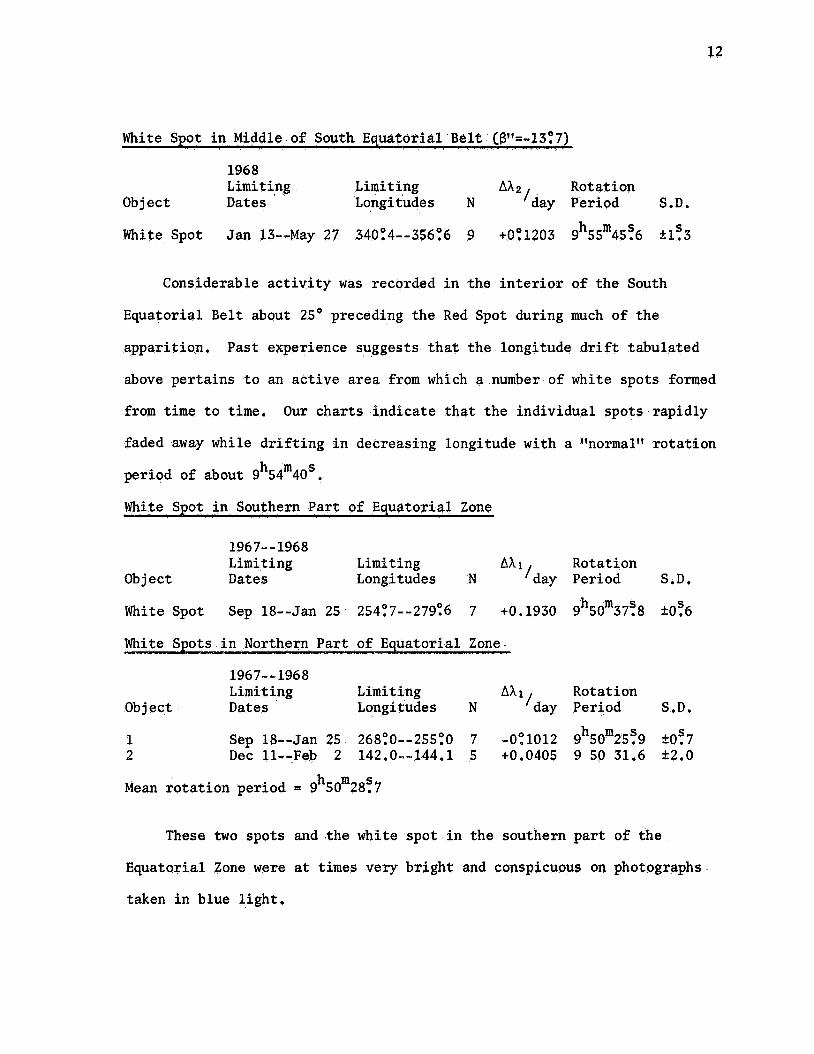
White Spot i n Middle of South Equatorial Belt (Bt1=-13f7)
1968 Limiting Limiting AX2 Rot a t i on
h m s
Object Dates Longitudes N 'day Period S.D.
White Spot Jan 13--May 27 340'14--356:6 9 4'11203 9 55 45.6 +l?3
Considerable a c t i v i t y was recorded i n the i n t e r i o r of the South
Equatorial Belt about 25' preceding the Red Spot during much of the
apparit ion.
above per ta ins t o an active area from which a number of white spots formed
from time t o time.
Past experience suggests t h a t t he longitude d r i f t tabulated
Our charts ind ica te tha t the individual spots rapidly
faded away while d r i f t i n g i n decreasing longitude with a %ormal" ro ta t ion
period of about 9 54 40 . h m s
White SDot i n Southern Part of Eauatorial Zone
1967--1968 L i m i r ing Limiting Ah 1 Rot a t ion
h m s Object Dates Longitudes N 'day Period S.D.
White Spot Sep 18--Jan 25 254:7--279:6 7 +0.1930 9 50 37.8 &Os6
White Spots i n Northern Part of Equatorial Zone
196 7- .. 1968 Limiting Limiting Ah 1 Rot a t i on
h m s Object Dates Longitudes N 'day Period S.D.
1 Sep 18--Jan 25 268f0--255:0 7 -0:1012 9 50 25.9 2027 2 Dec 11--Feb 2 142.0--144.1 5 +0.0405 9 50 31.6 52.0
Mean ro ta t ion period = 9 50 28.7 h m s
These two spots and the white spot i n the southern pa r t of the
Equatorial Zone were at times very br ight and conspicuous on photographs
taken i n blue l igh t .

13
White, Spots i n the I n t e r i o r of the Nmth Equatsrial Belt II
1968 Limiting Limiting A x 2 Rot a t ion
Object Dates Longitudes N 'day Period S.D.
1 2 Mar 16--Mar 25 38430--348:6 3 -3.9097 9 53 01 k9
Mean ro ta t ion period = 9 53 7
Spot 1:
Spot 2:
Mar 16--Mar 25 375:8--343:3 3 -3:6022 9h53m13S fr8 S
h m s
mean l a t i t ude = +12:3, mean width = 4:6, mean length = 5:6
mean l a t i t ude = +12:4, mean width = 4:5, mean length = 3'17
Spots on North Edge of North Equatorial Belt (N. Tropical Current)
Limiting Dates Limiting A x 2 Rot a t i on
Object 1967-91968 Longitudes N 'day Period S.D.
1CDP) , p a r t 1 pa r t 2 p a r t 3 p a r t 4 p a r t 5
l(Df), pa r t 1 p a r t 2 p a r t 3
2 (white spot) 3(dark spot) ~(WC) , p a r t 1
p a r t 2 p a r t 3 p a r t 4 p a r t 5 pa r t 6
Sep 29--Nov 2 Nov 2--Dec 25 Dec 25--Mar 13 Mar 13--Apr 20 Apr 20--May 3 Sep 29--Feb 16 Feb 16--Mar 26 Mar 26--May 3 Sep 29--Mar 23 Dec 3--Mar 25
Nov 8--Jan 24 Jan 24--Mar 10 Mar 10--Mar 26 Apr 2--Jun 5 Jun 5--Jun 25
Oct ~ - - N o v 8
30:2-- 16:8 16.8--350.2
350.2--317.0 317.0--305.9 305.9--294.1 48.9--344.4
344.7--331.6 331.6--317.8
78.7--335.5 52.0--343.9
119.0-- 93.2 93.2-- 47.4 47.4--359,3
359.3--346.5 337.7--304.0 304.0--293.7
7 8
22 10 9
27 18 10 14 20 7
19 17 6
16 8
-0:391 -0.498 -0.419 -0.299 -0.907 -0.459 PO. 332 -0.368 -0.587 -0,603 -0.699 -0.598 -1.036 -0.796 -0.461 -0.527
h m s 9 55 24.6 9 55 20.2 9 55 23.4 9 55 28.3 9 55 3.4 9 55 21.8 9 55 27.0 9 55 25.5 9 55 16.6 9 55 15.9 9 55 11.9 9 55 16.1 9 54 58.1 9 55 8.0 9 55 21,7 9 55 19.0
S 22,o 22.0 20,5 22.0 55.9 &0.2 20.5 k2.6 k0.3 20.3 50.4 k0.4 20.4 t1.7 50.8 20.7

14
Mean Rot a t i on
Object Period Mean Latitude Mean Width Mean Length
1 (dark bar) 9 55 23,O +16:3 +0:1 (4 dates) 4:6 (4 dates) 17:8 (55 dates) 2 (white spot) 9 55 16.6 +19' (estimate) ----- 6.0 (14 dates) 3 (dark spot) 9 55 15.9 +15:5 +O:k (6 dates) 3:7 (6 dates) 3.7 (18 dates) 4 (white spot) 9 55 12.2 +19.3 +0,2 (9 dates) 6.0 (73 dates]
Mean ro t a t ion period of a l l spots = 9 55 16.9
h m s
4.7 (9 dates) h m s
In the first tabulat ion above, t h e d r i f t s of s p o t s , l and 4 are
broken down i n t o a number of sect ions t o reveal the i r r e g u l a r i t i e s i n
t h e i r motions.
apparit ion is given i n the second tabulat ion,
The mean ro ta t ion period ,of each spot f o r the e n t i r e
White spot 4 was a ra ther remarkable feature , Its rate of d r i f t
i n longitude varied considerably during the appari t ion, from 24 January t o 10 March, the spot had a ro ta t ion period of 9 h m s 54 58 , l +Os4
For 46 days,
which may be the shor tes t period ever,recorded i n t h i s l a t i t ude (Peek, 1958),
A discontinuity i n the d r i f t of t h i s -spot took place between 26 March and
2 April which indicated a ro ta t ion period of 9 54 25.5 between these two h m s
dates.
e i t h e r disappeared or coalesced with white spot 4,
During t h i s in te rva l , dark spot 3 disappeared and white spot 2
Spot 1, which had been
a very conspicuous dark s t reak during much of t he apparit ion, disappeared
ra ther suddenly i n ear ly May soon after being overtaken by rapidly moving
spot 4.
An in te res t ing conjunction of dark spot 3 (see tab le above) and the
more rapidly-rotating white spot l > ( s e e t ab le of white spots i n the i n t e r i o r
of the North EquaTorial Belt) occurred on 25 March a t longitude (11) 343:s.
Two days earlier the spots,were external ly tangent with the white spot
extending from l a t i t ude +9'/7 t o +14'57, and the dark spot extending from

15
+13!1 t o +17f6.
appeared unchanged, while the white spot appeared crescent-shaped with
A t .the time of conjunction the out l ine of t he dark spot
the dark spot project ing i n t o it.
wast a t a higher level than the white spot, o r t h a t they were a t the same
level with the white spot being def lected by the dark spot.
This could ind ica te t h a t the dark spot
A conspicuous but short-l ived dark spot was v i s i b l e on the north edge
of the North Equatorial Belt ilt l a t i t ude +16P4 and longitude (11) 31P6
between 1 2 and 17 April 1968. The spot had a length of 8' and a width
of 6 ' . No de f in i t e spot could be seen near t h i s posi t ion on e i t h e r 9
or 24 April even though the photographs were of good qual i ty . The region,
however, appeared t o be qui te act ive and a d i f fuse spot had appeared
in te rmi t ten t ly i n the ,extrapolated longitude during February and March. Many
spots 9n J u p i t e r appear t o be manifestations of longer-enduring disturbances a t
a lower leve l i n the atmosphere. Individual spots w i l l fade away, but other
spots may later form i n the same posit ion.
The Osci l la t ing Spot on the NNTBs (N. N . Temperate Current B)
During January 1968 a small dark spot on the south edge of the NNTB
was.found t o be moving i n the d i rec t ion of decreasing System I1 longitude
at the very rapid r a t e of nearly 3' per day.
indicated t h a t the spot was moving i n the rarely.observed N , N. Temperate
Current B which had been inac t ive s ince 1945.
This unusual d r i f t c l ea r ly
This remarkable current was first discovered by Hargreaves (Phi l l ips ,
1937) during the appari t ion of 1929-30 when 7 spots gave a mean ro ta t ion
period of 9 53 54
observed during f i v e consecutive apparit ions.from 1940 t o 1945 [Peek, 1958).
h m s The .only other outbreak of s p o t s , i n t h i s current was

16
There is some evidence that a c t f v i t y on the NNTBs is i n some way
re la ted t o a c t i v i t y on the NTBs (Peek, 1944). The outbreak of spots on
the NNTBs seem t o occur concurrently with, o r a few years after, the outbreak
of spots on the
was observed on
was a c t i v i t y on
NTBs. Present a c t i v i t y seems t o confirm t h i s ru l e , Activity
the NTBs i n 1964-65 Deese and Smith, 1966), and there
the NNTBs i n 1968 3
When a l l the measured longitudes of the NNTBs.spot had been p lo t ted
on a graph, it became obvious tha t the spot was osc i l l a t ing i n longitude,
Since the osc i l l a t ion appeared t o resemble a s ine curve, the observations
were submitted t o a general l e a s t squares computer program of the form:
A2 = a + b t -+ c s i n O t
where t is the time i n days from to.
to i s the time when the least squares posi t ion of the spot was
on the axis of the s ine curve and moving toward increasing
longitude.
a is the System I1 longitude of the l e a s t squares posi t ion of the
spot a t to.
b is the slope o r da i ly d r i f t r a t e of the s ine curve axis i n System
c is the amplitude of the osc i l l a t ion i n degrees of longitude.
O i s 360° divided by the period of t he osc i l l a t ion i n days,
The computer program found the least squares values of to and 0 by repeatedly
incrementing them, computing the standard deviation from the residuals , and
f i n a l l y accepting the values which gave the smallest standard deviation.
equation of the spots, motion i s longitude is then:
The
A2 = 321'173 -2t827t + 3'1441 s i n 5:418t,
17
where t is the time elapsed in days from 1968, January 25.8.
equation we find that the period of the oscillation was 66.4 days, and
the rotation period of the axis was 9 53 44.9.
From this
h m s
The daily drift of the spot in System I1 longitude at any time, t,
was -2:827 + 0'3325 cos 5.418 t.
motion, the rotation period varied from 9 53 32 to 9 53 58 , The spot
underwent a.maximum acceleration
Due to the oscillating component in the h m s h m s
2 of f5.2 x lom6 m/sec ,
The latitude of the spot remained nearly constant at +35f15 throughout
the interval of observation; however, a linear least squares solution
indicates that the latitude gradually increased from +35:2 kO'3l on 13 January
to +35:8 fO'3l on 25 March.
Observational and least squares data of the NNTBs spot are summarized
in Table I1 and graphically depicted in Figure 6.
and computed longitudes have been diminished by the algebraic sum of the
first two terms in the above equation so that the presentation of the
oscillation is normal to the computed axis.
In Figure 6 the observed
We thank observers C. J, Banos, A. S . Murrell, and T. P, Pope for the
photographs used in this study; R. L. Fritz, R, B, Minton, and E. M. Ingraham
for the illustrations; and the New Mexico State University Computer Center
for time on the Control Data 3300 and the IBM 1130 computers.
The work reported here was supported by the National Aeronautics and
Space Administration under Grants NGL-32-003-001 and NGR-32-003-027.

18
REFERENCES
Peek, B. M. (1944), Thirty-second Report of the Jupiter Section, Memo - Brit. Astron. Assoc, 35 Part 3, 11. - - -3 Peek, B. M. (1958). "The Planet Jupiter.!! Macmillan, New York,
Phillips, T. E, R. (1937). Twenty-eighth Report of the Jupiter Section, Mem. Brit. Astron. Assoc. 32 Part 4, 13. - - - - - '
Reese, E. J. (1967). Jupitervs Great Red Spot and three white ovals. sky and Telescope, 2, 185-186.
Telescope, 3!i, 258-259.
North Temperate Belt. Icarys 5 248-257.
Red Spot of Jupiter.
- Reese, E. J, (1968). An old and a new dark streak on Jupiter. Sky and
Reese, E. J. and Smith, B, A. (1966). A rapidly moving spot on Jupiter's -3
Reese, E. J. and Smith, B, A. (1968). Evidence of vorticity in the Great Icarus 9, 474. -
Reese, E. J, and Solberg, H. G. (1966). Recent measures of the latitude and longitude of Jupiter's Red Spot. Icarus 5, 266, -
Solberg, H. G, (1969). Jupiter9s Red Spot in 1967-68. Icarus (in press).
Solberg, H. G. and Reese, E. J. (1969). Photographic measurements of c
Jovian features, 1960-1967. New Mexico State University Observatory TN-701-69-25.
19
FOOTNOTES
'Any change i n the height of the spot i n the r e l a t i v e l y shallow Jovian atmosphere would appear t o be inadaquate t o account f o r the difference between the observed.and computed ro ta t ion periods.
'The ro ta t iona l as follows:
veloci ty of a Jovian spot i n meters per second is found
Rotational veloci ty = [45,226 - 51.951 (td)] 0,2777 cos 8 ' , where 8' is the mean Jovian la t i tude , and d is the da i ly d r i f t of the spot i n System II longitude, Zenographic l a t i t ude , @I1, and mean Jovian la t i tude , 8 9 , are re la ted as follows:
tan 811 = tan 8'/1,0713
3After reexamining some of our p l a t e s taken i n 1965-66, we have found a t l ea s t two spots on the NNTBs which obviously belonged t o the N. N. Temperate Current B. +35:1 and moved from longitude (11) 359' on 25 Defie+rs1965 t o 234' on 10 February 1966 with a mean ro ta t ion period of 9 53 5 2 .
The b e t t e r observed spot was a t zenographic l a t i t ude

20
TABLE I
MEAN ZENOGRAPHIC LATITUDES [B"] OF JOVIAN BELTS I N 1967-68
N = Number of dates on which p l a t e s were measured.
NTERVAL -). 30 Sep 67-30 Nov 67 5 Dec 67-16 Feb 68 5 Mar 68-11 Jun 68 Mean for 1967-68 b belt B1@, S.D.' N 8" S.D.a N B" $.Doa N N cos 13'
SPB SSSTB SSTB
STeZB
/STB n
STrZB
/SEBs n
'/SEBn
/SEBn n
S / ~ ~ ~
S / ~ ~ ~ ~
'/EB n / ~ ~
n / ~ ~ ~ ~ /NEBS
'/NEBn
/NEBn n NTrZB
S
'/NTB
n/NTB
'/NNTB NNTB
NNNTB NPB
-67:4 -55.2 -43.3 -37.6 -33.2
-27.1 -24.3
-21.2
-15.8 -11.4
- 6.8
- 2.9
+ 3.0 + 7.1
+11* 2
+14.7
+21,1 +23,7
+2S .9 +31.7
+35.8 +37.6 +44.6 +59.5
2234 2 20.2 2 20.7 5 20.3 3
f0.1 7
20.2 7 20 , l 2 20.2 6 20.3 6 20. 2 7
20.1 7 $
20. 1 7
20.2 7
20.1 7
20,3 4
20.3 4
to . 1 7 1
20.4 8
20.3 8 20.7 3 20.8 3 20.7 3
1
-3--
----
2 2
2 9 3
8 21
8 21 3 5
7 19
7 19 8 21
8 21
7 20
7 20
7 20
7 11 7 11
7 20 1
7 20
7 20
2 6 2 6 1 5
1
- - -
c
-
-67:4 ,407 -55.2 ,597 -43.1 ,753 -37.6 ,812 -33.1 ,854
-27.1 ,902 -24.4 ,921
-21.2 .940
-15.7 .967 -11.4 ,983
- 7.0 .993
- 3.1 .999
+ 3.3 .999
+ 7.1 ,993
+10.9 ,984
+15,1 .970
+21.0 .941 +23,7 .925
+25,8 .911 +31.6 ,867
+35.8 .830 +38.Q ,808 +44.5 .737 +59.5 .534
---- 2030
2 0 . 1 20.2
20.2
t0.3 20.2
20.2
20.1
k0.2
20.1
----
---- -33.1 -2.6.6 ---- -21.5
-15.6
-11.8
- 7.0 - 2.9
+ 3.6
+ 7.3
20.2
20.3 20,5 20.3
20.4
20.2
20 , l 20.3
20.1 20.2
2 0 . 1 20.2
20.1 ----
6
6 - -33.0
-27,4 -24.4 -21 * 1
-15.6 -11.0
- 7.1
- 3.4
+ 3.4
+ 7.0
+10.8
+15.3
+20,8 ----..
--cc
20.3 ---- 6 - +26.2
+31 7 +36.6 +38.2 +44.9 ----
20.1
20.3
+25.5 +31.5
+35,3 +38.5 +43.6 ----
20.3
20,4
50.1 21.9
%easuring e r ro r s and real var ia t ions i n the l a t i t u d e of a b e l t from one date t o another contribul t o t h i s standard deviation.
bCos f3' i s the f ac to r by which the equator ia l radius of Jup i t e r must be mult ipl ied t o obtain the radius of ro t a t ion f o r a given zenographic l a t i t ude , fPr (tan f3' = tan Bt1/1.0713).

21
Date 1968
Jan 13.34 22.42 24.48 25.30 29.40
Feb 5.42 16.16 18.20 20.24 25 e 22 27.29
Mar 6.15 8.15 13.15 14.38 15,21 25,11 27.11 29.20
TABLE I1
THE OSCILLATING SPOT ON THE WTBs (N. N. TEMPERATE CURRENT B)
Observed Longitude I1
353:7 330.5 324.9 322.7 313.1, 294.1 264.8 258,4 252.1 236.6 230.0 204.8 199.7 184.3 181.1 178.9 152.2 146.8 141.1
Computed Probable Longitude I1 Error of Sine Curve
f0:2 k0.3
fO.1 f0.2 k0.4 $0.2
50.1 k0.2 kO.1 +o. 2 k0.5 kO.2 20.2 20.3 k0.4 t0.3 k0. 2
-s
"-
353:8 330 . 2 325.0 323.0 312 ,, 7 294.6 264.4 258,3 252.1 236,6 230.1 205.5 199.4
181.0 178.6 151.9 146.8 141,s
184.5
Dev . 0-c
-0:08
-0.17 -0 26 0,43 -0.47 0.37 0.09 0.01 0.02 -0.06 -0.66
0.29
0.28
0.18 0.31 0.31 0.03
-0.20
-0.42
Computed Longitude relative t o axis of sine curve
-3t19 -1.05 -0.41 -0.14 1.14 2.90 3.10 2.75 2.30 0.89 0'. 23 -2.16 -2.63 -3.36 -3.42 -3.44 -2.15 71.61 -0.99
Zsnographic Latitude
+35:3
+35,6 +35.0
+35.6 +35.6
+35.1 +35.6
c--
---
--s
--I
-P-
-c-
+35.8
+35.8 --- -7 -
-e-
Standard deviation o€ a sin8le observed longitude from computed s ine curve = +0:30
Mean l a t i t u d e of NWBs Spot = +35:5 &O:l (9 dates)
Mean width i n l a t i t u d e of Spot = 3:3 f0:3 (9 dates)
Mean length i n longitude of Spot = 5:3 f0'13 (19 dates)
Mean d r i f t rate of Spot = -2:8274 per-day i n System I1 h m s Mean ro ta t ion period =.9 53 44.9

J A N
J A N
F E B
FEB
FEB
MAR
M A R
19
2 9
8
18
28
9
19
I I I I I
180° 190° zooo 210° 220° 230°
S Y S T E M 1 L O N G I T U D E
Fig. 1. motion in longitude as it moved southward in latitude.
A yellow spot in the South Polar Region exhibited an accelerating

i s 6 7
O C T
N O V
N O V
D E C
1968
J A N
J A N
FEB
MAR
15
4
2 4
14
3
23
12
3
L 1 I I I I
t,
e
24O 25O 26O 27O 28O 29O
S Y S T E M TI L O N G I T U D E
Fig. 2. The d r i f t i n longitude of the center of the Red Spot Hollow resembled onic o s c i l l a t i o n .
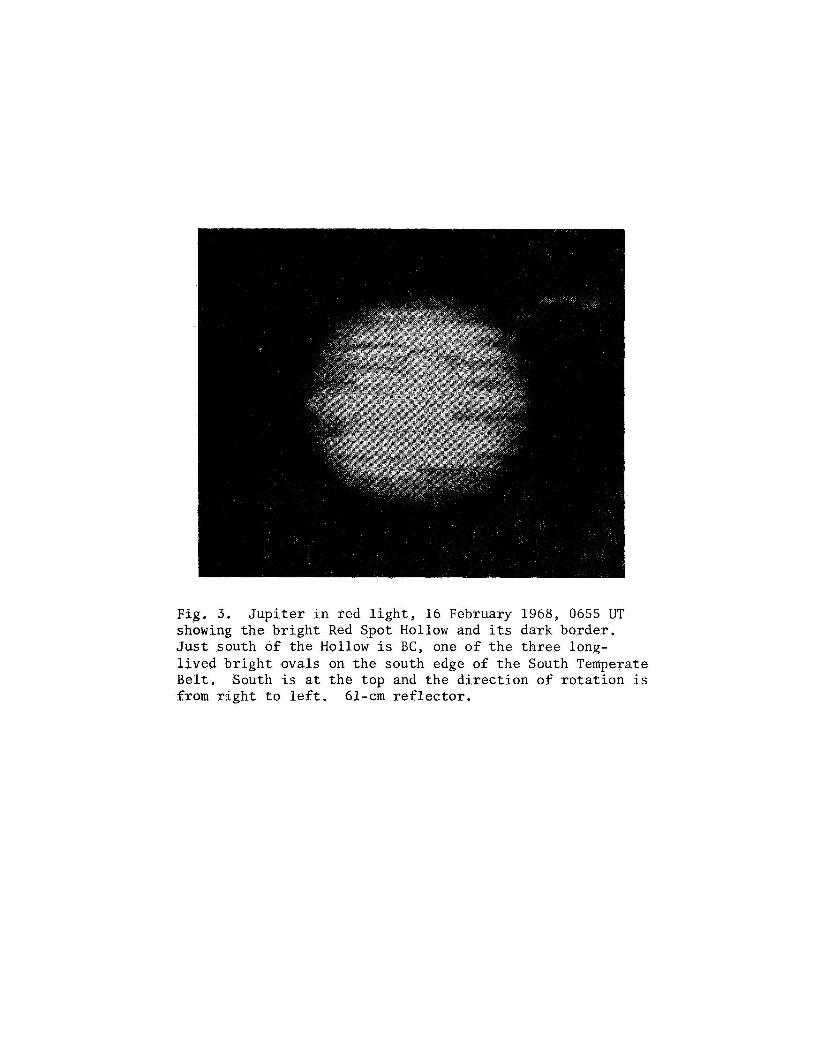
Fig. 3 . J u p i t e r i n red l i g h t , 16 February 1968, 0655 UT showing t h e b r i g h t Red Spot Hollow and i t s dark border. J u s t south of t h e Hollow i s BC, one o f t h e t h r e e long- l i v e d b r i g h t ovals on t h e south edge of t h e South Temperate Belt. South i s a t t h e top and t h e d i r e c t i o n of r o t a t i o n i s from r i g h t t o l e f t . 61-cm r e f l e c t o r .

I I I I 1 I I I 1 40"
39O
38"
37O
36O
35O
~
-
- -
'-
- -
1 3 O I 4 O 1
2 1 °
20"
1 9 O
1 8 O
1 7 O
1 6 O
1 5 O
'\- / I I I 's @'
- - - - - - -
\ /-\
1967
1 I I I I I I I I 1 I IO 20 29 9 18 28
O C T NOV DEC DEC MAR APR MAY
S Y S T E M L O N G I T U D E
Fig. 4. Red Spot (solid lines) and the Red Spot Hollow (broken lines) in 1967-68.
Oscillations in longitude of the preceding and following ends of the

m
.- a

D A Y S
-10
0
I O
20
30
40
5 0
60
-40 -30 -20 - I 0 oo lo Z0 3 O 4 O
L O N G I T U D E
Fig. 6. The o s c i l l a t i n g spot on t h e south edge of t h e NNTB i n 1968.