Embed Size (px)
Citation preview

Latif Kalin, Ph.D.School of Forestry and Wildlife Sciences, Auburn University
Auburn, AL
2007 ALABAMA WATER RESOURCES CONFERENCE
and ALABAMA SECTION OF AWRA SYMPOSIUM
Perdido Beach Resort, Orange Beach, Alabama
September 5 - 7, 2007
Model Predictive Uncertainty:
Why, How, and Three Case
Studies

Motivation
Hydrologic and water quality models are extensively used
by water resources planners, water quality managers, engineers and scientists
to make future predictions, find answers to what if scenarios and to evaluate the effectiveness of various control strategies.
Models involve many assumptions made by
model creators who develop the relationships and define the processes
model programmers who carry the model into computer platforms
Model users who generate/gather input data
Models are only approximate representations of the complex natural processes and therefore, in real world problems, uncertainties are unavoidable and should be rigorously addressed in the development and application of models.

Motivation
Estimating model predictive uncertainty is imperative to informed environmental decision making and management of water resources
In a state-of-the-science review of the role of research in confronting the nations’ water problems, NRC (2004) called for the explicit recognition of uncertainty occurrence, measuring its importance, and incorporating it into decision making.
Estimating model predictive uncertainty provides environmental managers a basis for selecting among alternative actions and for deciding whether or not additional experimental/field data are needed (Reckhow, 1994).

What is Uncertainty?
“The lack of certainty, A state of having limited knowledge where it is impossible to exactly describe existing state or future outcome, more than one possible outcome”
Aleatory (stochastic) uncertainty - data based
Associated with inherent variability
Irreducible
Best represented by probability dist.
Epistemic (imprecision) uncertainty - knowledge based
Imperfect models (knowledge) of real world
Can be reduced (improved models/experiments)
Best represented by intervals
Transboundary uncertainty (communicating information from models to decision makers or other stakeholders)
Decision uncertainty (ambiguities in quantifying social values)
Linguistic uncertainty (vagueness of communicating information)
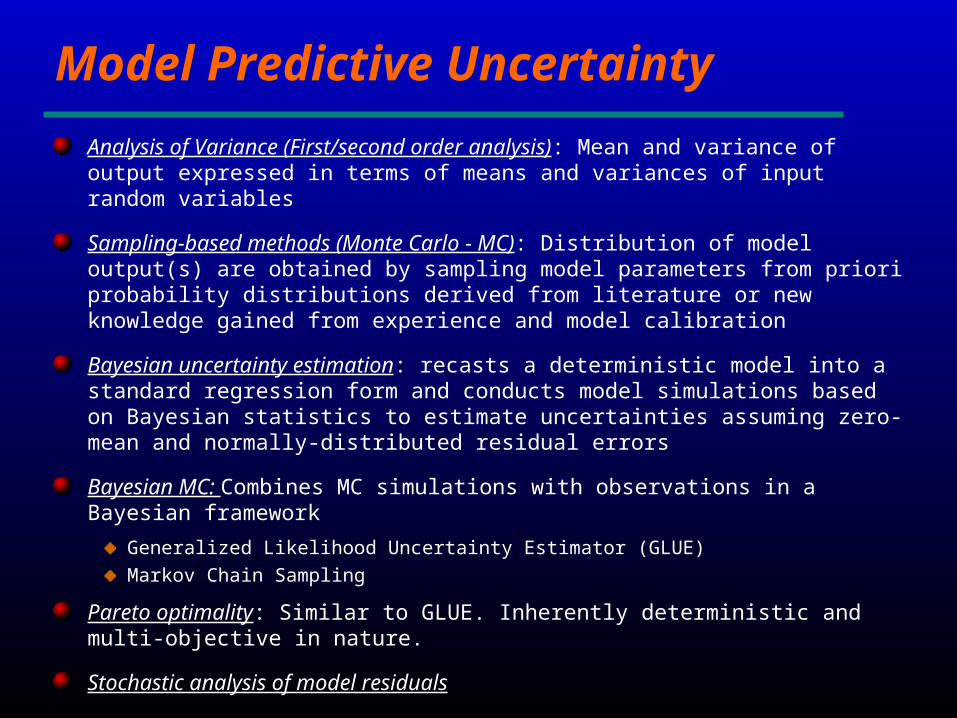
Model Predictive Uncertainty
Analysis of Variance (First/second order analysis): Mean and variance of output expressed in terms of means and variances of input random variables
Sampling-based methods (Monte Carlo - MC): Distribution of model output(s) are obtained by sampling model parameters from priori probability distributions derived from literature or new knowledge gained from experience and model calibration
Bayesian uncertainty estimation: recasts a deterministic model into a standard regression form and conducts model simulations based on Bayesian statistics to estimate uncertainties assuming zero-mean and normally-distributed residual errors
Bayesian MC: Combines MC simulations with observations in a Bayesian framework
Generalized Likelihood Uncertainty Estimator (GLUE)
Markov Chain Sampling
Pareto optimality: Similar to GLUE. Inherently deterministic and multi-objective in nature.
Stochastic analysis of model residuals

Case Study -1 (MC based)
Modeling Runoff and Sediment Yield Uncertainty
Treynor watershed: USDA operated (corn)
KINEROS-2 model
Monte Carlo sampling and simulations
W-2
IA
N
0.1
1
10
0.1 1 10 100
CV
Peak flow
0.1
1
0.1 1 10 100
Time to peak flow
0.1
1
10
0.1 1 10 100
Total flow
0.1
1
10
0.1 1 10 100
CV Peak
sediment discharge
0.01
0.1
1
0.1 1 10 100
Time to peak sediment discharge
0.1
1
10
100
0.1 1 10 100
Sediment yield
i (cm/hr)

Case Study -1 (con’t)
0.0
0.2
0.4
0.6
0.8
1.0
30 70 110 150 190
time (min)
flow
(m
3/s)
75%
50%
25%
avg-par
obs.
5/30/82
0
10
20
30
40
50
60
30 70 110 150 190
time (min)
sedi
men
t di
scha
rge
(kg/
s)
75%
50%
25%
avg-par
obs.
5/30/82
0
2
4
6
50 70 90 110 130 150
time (min)
flow
(m
3 /s)
75%
50%
25%
avg-par
obs.
6/13/83
0
200
400
600
800
1000
50 70 90 110 130 150
time (min)se
dim
ent
disc
harg
e (k
g/s) 75%
50%
25%
avg-par
obs.
6/13/83
0.0
0.2
0.4
0.6
0.8
1.0
1.2
40 60 80 100 120 140
time (min)
flow
(m
3/s
) 75%
50%25%avg-par
obs.
8/26/81
0
10
20
30
40
40 60 80 100 120 140time (min)
sedi
men
t di
scha
rge
(kg/
s)
75%50%25%avg-parobs.
8/26/81

Case Study -1 (con’t)
KINEROS-2 can be calibrated with soil parameters values consistent with national statistical soil data
Comparison of medians from MC simulations and simulations by direct substitution of average parameters with observed flow rates and sediment discharges indicates that KINEROS2 can be applied to un-gagged watersheds and still produce runoff and sediment yield predictions within order of magnitude of accuracy
Model predictive uncertainty measured by the coefficient of variation decreased with rainfall intensity, thus, implying improved model reliability for larger rainfall events
Physically-based models can be used in ungauged watersheds but not empirical conceptual models
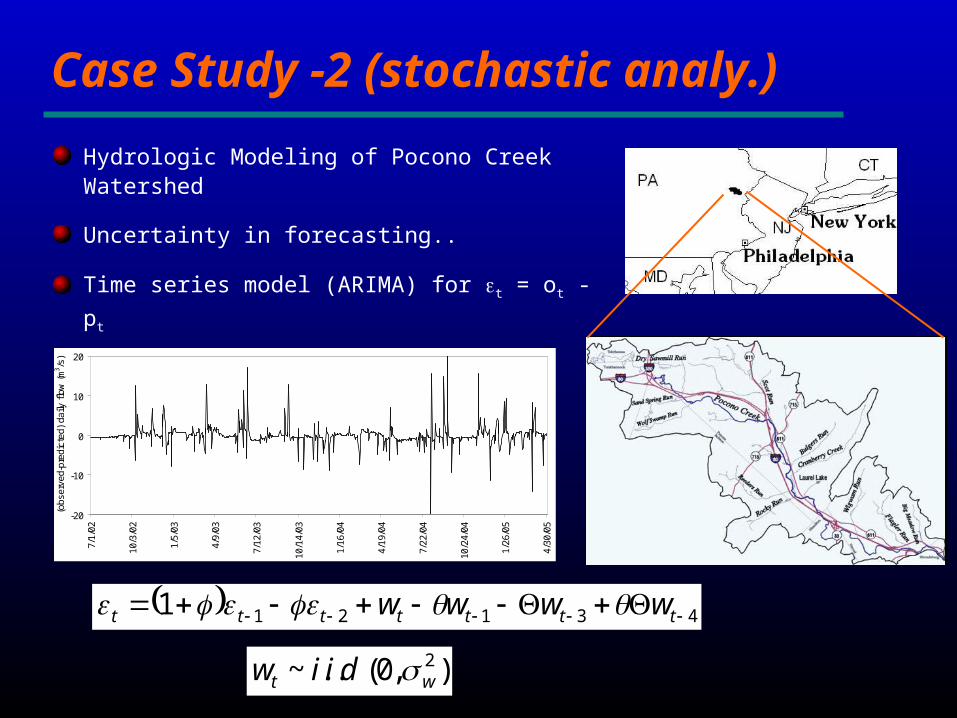
Case Study -2 (stochastic analy.)
Hydrologic Modeling of Pocono Creek Watershed
Uncertainty in forecasting..
Time series model (ARIMA) for t = ot - pt
431211 ttttttt wwww
-20
-10
0
10
20
7/1/
02
10/3
/02
1/5/
03
4/9/
03
7/12
/03
10/1
4/03
1/16
/04
4/19
/04
7/22
/04
10/2
4/04
1/26
/05
4/30
/05
(obs
erve
d-pr
edic
ted)
dai
ly f
low
(m
3 /s)
),0(..~ 2wt diiw

Case Study -2 (con’t)
0
5
10
15
20
25
30
0.001 0.01 0.1 1
Probability of exceedance
Daily
flo
w (
m3 /s
)
median
95% C.I - upper limit
95% C.I - low er limit
0
0.1
0.2
0.3
0.4
0.5
0.94 0.96 0.98 1
0
5
10
15
20
25
30
35
12/16/2004 1/5/2005 1/25/2005 2/14/2005 3/6/2005 3/26/2005 4/15/2005
3-d
ay
ave
rag
e fl
ow
(m
3 /s)
observed median 95% C.I.
Example:
with 95% confidence,
100-day flow, Q(Tr=100-
day) 11.5<Q<15 m3/s

Case Study -2 (con’t)
The seminonparametric model offers the added advantage of
relaxing the normality requirement for the random noise as a
condition for the application of the relatively simple time series
models.
Ensemble of streamflows generated through Latin-Hypercube
Monte Carlo simulations showed that long-term annual maximum
daily flows (relevant to storm runoff management) had higher
uncertainty than long-term daily, monthly median of daily flows
(ecologically relevant metric)
Simulated ensemble of flow duration curves showed that low
flows had higher uncertainty than flows in the medium and high
range

Case Study-3
Physically-based model of
Hantush (2007)
Applied to Chesapeake Bay
data in Di Toro (2001)
Generalized Likelihood
Uncertainty Estimator (GLUE)
Initial parameter distributions
from literature
P’(i) = ci * P(i) * L(i)
SOD, ammonia and nitrate
fluxes
Di Toro, D.M. (2001). Sediment Flux Modeling. John Wiley, New York.
Hantush, M.M. (2007). “Modeling nitrogen-carbon cycling and oxygen consumption in bottom sediments.” Adv. Water Resour. 30, 59-79

Case Study-3 (con’t)
0.00
0.05
0.10
0.15
0.20
0.25
0 10 20 30 40
Time (30 day average)
SOD
(m
g-O
2/cm
2 day-1
)
Observed median 90% C.I.
0.00
0.05
0.10
0.15
0.20
0.25
0 10 20 30 40
Time (30 day average)
SOD
(m
g-O
2/cm
2 day-1
)
Observed median 90% C.I.
-0.02
0.00
0.02
0.04
0.06
0.08
0 10 20 30 40
Time (30 day average)F a
(m
g-N
/cm
2da
y-1)
Observed median 90% C.I.
-0.003
0.000
0.003
0.006
0.009
0.012
0 10 20 30 40
Time (30 day average)
F a (
mg-
N/c
m2da
y-1)
Observed median 90% C.I.
-0.04
-0.03
-0.02
-0.01
0.00
0.01
0 10 20 30 40
Time (30 day average)
F n (
mg-
N/c
m2da
y-1)
Observed median 90% C.I.
-0.006
-0.004
-0.002
0.000
0.002
0.004
0 10 20 30 40
time (30 day average)
F n (
mg-
N/c
m2da
y-1)
Observed median 90% C.I.

Case Study-3 (con’t)
The significant number of observations positioned outside the 90% confidence bands is an indication of either or combinations of inadequate prior parameter distributions, sparse measurements, measurement errors, and inadequate model
Results remain preliminary and a more thorough analysis is needed:
Further analysis to revise prior parameter distributions
Increase the number of behavioral parameter sets for improved posterior cumulative distributions of the model outputs
Better inferences of the distribution of depositional flux of organic matter and refined relationship for the estimation of the thickness of the aerobic layer, may lead to more realistic predictive uncertainty estimates

Summary & Conclusions
Importance of uncertainty analysis
Three case studies
Flow time series in an rapidly urbanizing forested watershed
Runoff and sediment yield modeling in an agricultural watershed
Sediment-nutrient flux in Chesapeake Bay
Computed uncertainties of predicted water quality and quantity attributes provide basis for communicating the risk to water resources managers and decision makers