Embed Size (px)
Citation preview

Latest Results from the CLIC Geodetic Studies
Mark Jones, CERN
Sébastien Guillaume, ETH Zurich / CERN
Julien Boerez, Université de Strasbourg / CERN

Outline
17.09.2010Desy, Hamburg. Mark Jones, CERN
Introduction
Determination of a Precision Geoid
Modelling the Tidal and other Time Variable
Effects on HLS Measurements
Conclusions
2

Geodetic Studies Feasibility Study for CLIC Pre-Alignment tolerance
± 10 [mm] over 200 [m] (3s) Knowledge of gravity field
essential High precision geoid model Tidal and other periodic or non-periodic effects Particularly important for HLS
CLIC Metrology Reference Network
Two doctoral research projects in progress Sebastien Guillaume and Julien Boerez
17.09.2010Desy, Hamburg. Mark Jones, CERN
3
CLIC Geodetic Requirements Instantaneous equipotential surface at level of
HLS & Instantaneous shape of the Earth along the surface where the HLS / Accelerator is installed In Euclidean space As a function of time With a relative precision of a few microns over 200
m Earth’s gravity potential modelled by applying
Newton’s Universal Law of Gravitation and his Second Law of Motion for a point P(x, y, z), considering Earth’s mass distribution Earth’s motion within our quasi-inertial solar
system
17.09.2010Desy, Hamburg. Mark Jones, CERN
4

Earth’s Instantaneous Gravity Potential
Time independent elements define quasi-static part of the Earth’s gravity potential
17.09.2010Desy, Hamburg. Mark Jones, CERN
5
Earth
dVzyxr
zyx ''' ,,1
,, V 222 sin2
1,, RzyxΦ
Time dependent
Time independent
r = distance from P(x,y,z) to dV
r = density of dVdV = differential volume
element
w = Earth’s rotation angular velocity
R = Earth’s radiusj = latitude of P(x,y,z)
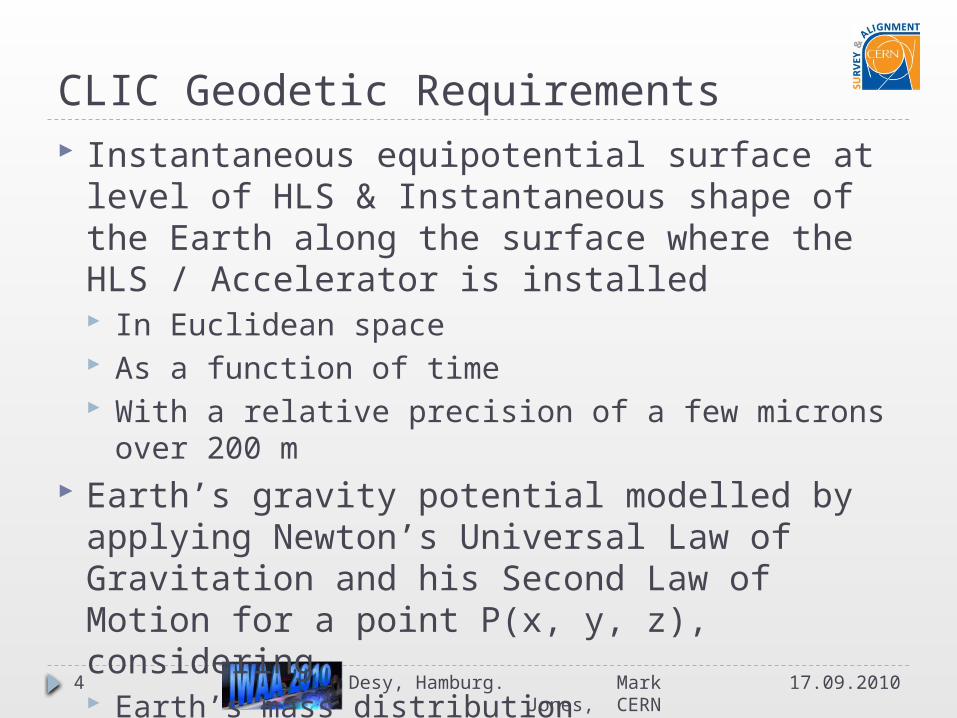
Disturbing Potential Can reformulate To give
Term U(x, y, z) is a known, perfect, mathematical potential field
Term T(x, y, z) is a disturbing potential Potential field induced by non-modelled density
anomalies
Disturbing potential cannot be modelled accurately Elements of derivatives can be observed Only astronomical levelling could meet CLIC
tolerance Integrate Earth’s surface deflections of the vertical, e
17.09.2010Desy, Hamburg. Mark Jones, CERN
6
zyxzyxzyx ,,,,,, ΦVW
zyxzyxzyx ,,,,,, TUW
tn ltn l HAB
B
A
HAB EdsN
Geometrical variations of the disturbing potential at level Htnl Orthometric correction
(gravity measurements)
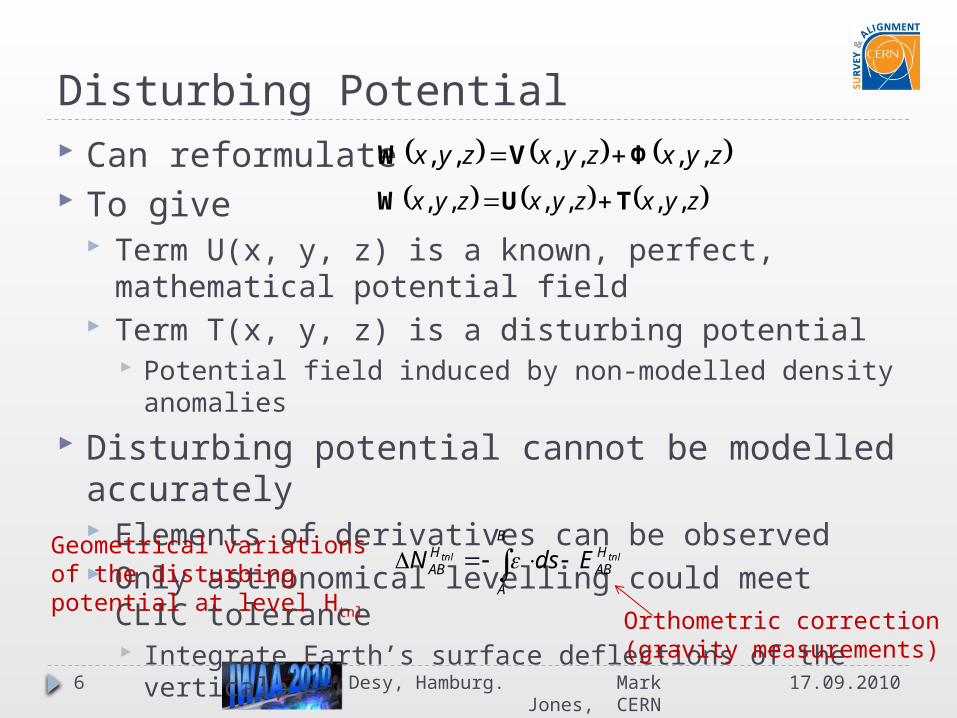
Measurement Campaign TZ32 tunnel
~850 long, ~80 m underground Gravity Measurements
Relative Gravimeter Scintrex CG-5 Absolute Gravimeter FG-5
Swiss Federal Office of Metrology (METAS) Profiles at Surface (every 10 m) and in Tunnel
(every 5 m) Deflection of the Vertical Measurements
DIADEM (ETHZ) AURIGA software (University of Hannover) Measurement every 10 m
17.09.2010Desy, Hamburg. Mark Jones, CERN
7
N
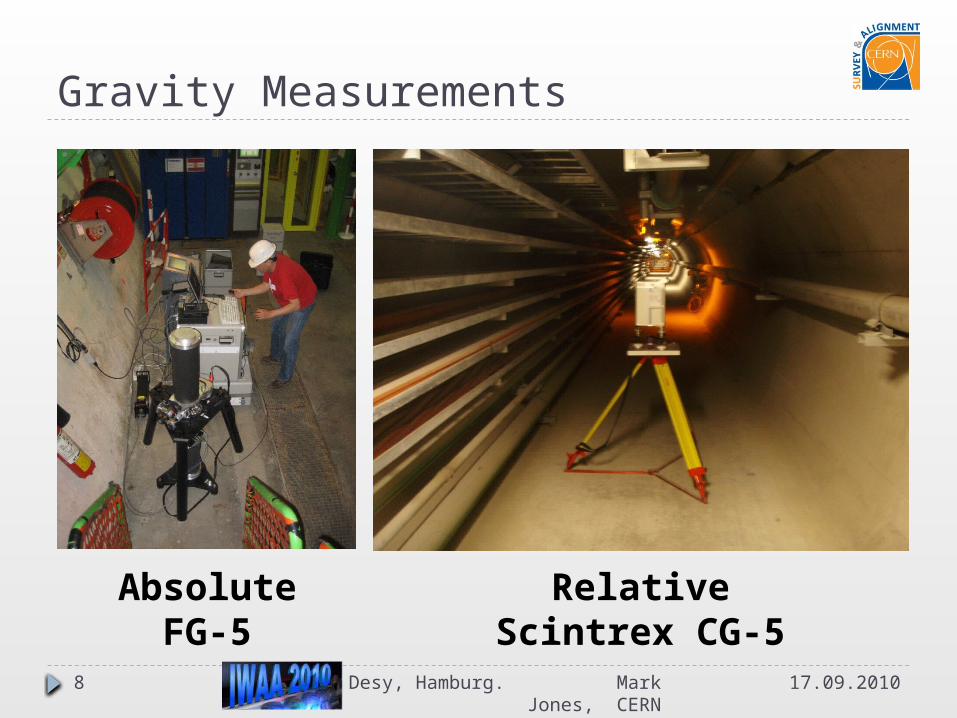
Gravity Measurements
17.09.2010Desy, Hamburg. Mark Jones, CERN
AbsoluteFG-5
RelativeScintrex CG-5
8

Astro-Geodetic Measurements DIADEM
17.09.2010Desy, Hamburg. Mark Jones, CERN
9
Component # type Characteristic
Optic 1x Mirotar f=1020 mm D=200 mm
CCD camera 1x Apogee Alta 2184x1472 pixel, 6.8x6.8 microns, 16 bits
GPS timing 1x ublox precision: < 0.1 milisecond
Tiltmeters 2x Wyler Zerotronics
range: +/- 3600'', precision: 0.15''
4x Lippmann range: +/- 200'', precision: <0.05''
Digital Focuser 1x FLI PDF range: 0-8.9 mm,
resolution: 1.3 microns
Automation 3x eletric cylinders5x servo motors
DAQ and Control 2x computers

Deflections of the Vertical
17.09.2010Desy, Hamburg. Mark Jones, CERN
10

Variation of the Disturbing Potential
17.09.2010Desy, Hamburg. Mark Jones, CERN
11
tnltnl HAB
B
A
HAB EdsN

Next Steps
Confirm and improve measurement results Complementary astro-geodetic measurements Deeper analysis of gravimetric measurements
Try to show what we should expect to find in the real gravity signal Improved mass models taking into account local
geological and hydrological information Stochastic simulations of the gravity field
17.09.2010Desy, Hamburg. Mark Jones, CERN
12
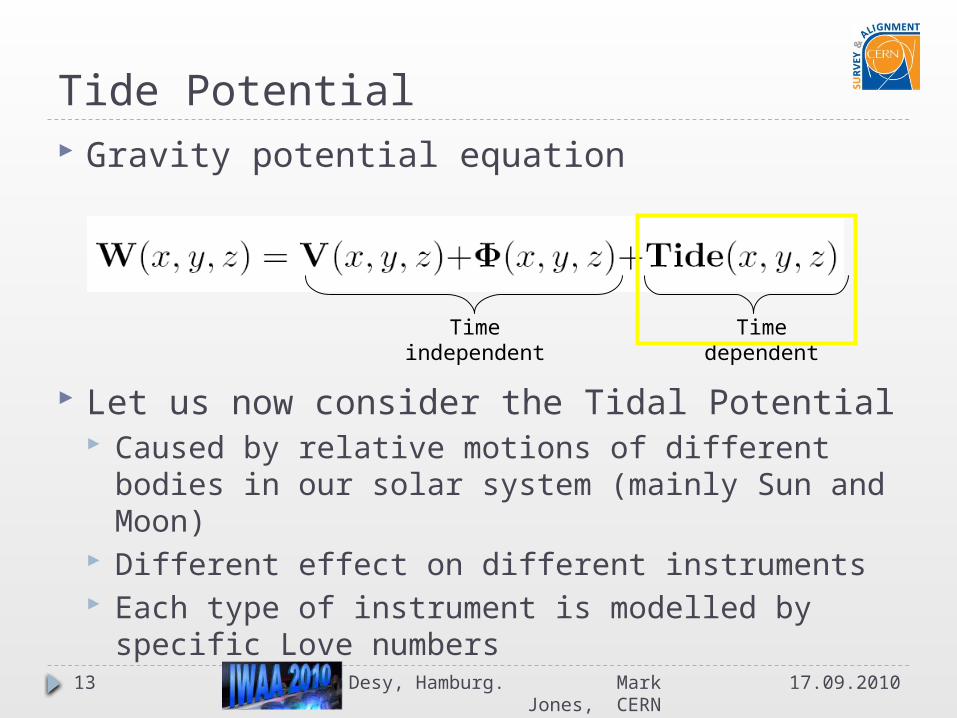
Tide Potential Gravity potential equation
Let us now consider the Tidal Potential Caused by relative motions of different bodies in
our solar system (mainly Sun and Moon) Different effect on different instruments Each type of instrument is modelled by specific
Love numbers
17.09.2010Desy, Hamburg. Mark Jones, CERN
13
Time dependent
Time independent

Perturbing Phenomena Love numbers define the tidal effects for a
perfect mathematical model of the Earth Model perturbed at different scales by various
phenomena geological structure of ground, topography
With a sufficient number of continuous measurements small corrections to the mathematical model can be calculated These corrections probably only apply to the
installed HLS providing the measurement signal There are other perturbing phenomena for an
HLS too E.g. oceanic load, hydrological load, cavity effects17.09.2010Desy, Hamburg. Mark Jones,
CERN14
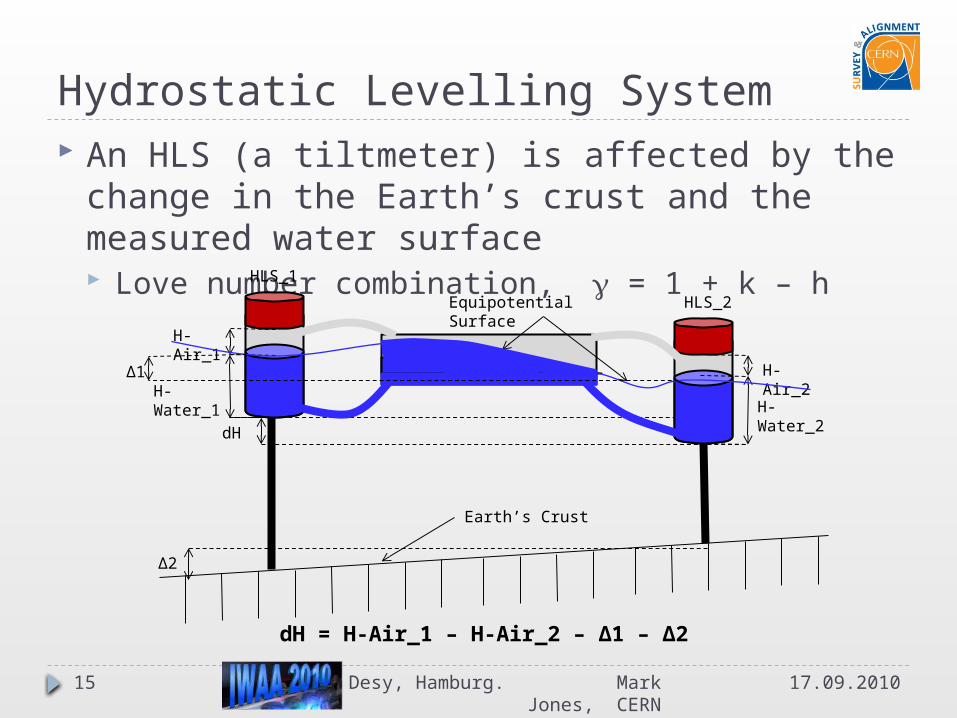
Hydrostatic Levelling System An HLS (a tiltmeter) is affected by the change
in the Earth’s crust and the measured water surface Love number combination, g = 1 + k – h
17.09.2010Desy, Hamburg. Mark Jones, CERN
15
HLS_1
HLS_2
H-Water_1H-Air_2
H-Water_2
dH
Earth’s Crust
Equipotential Surface
H-Air_1
Δ1
Δ2
dH = H-Air_1 – H-Air_2 – Δ1 – Δ2

Tilts and Deformations
In the context of accelerator alignment the difference between a tilt and a deformation is very important
The goal is to separate out the two from the raw measurement signal 17.09.2010Desy, Hamburg. Mark Jones,
CERN16
Ground Instrument Ground Instrument
Crust TideP eriods of 12 & 24h
Equipotential TideP eriods of 12 & 24h
Cavity effectsP eriods of 12 & 24h
TemperatureP eriods of 24h
TemperatureP eriods of 24h
Oceanic loadP eriods of 12 & 24h
Specific response of the water network
P eriods of 12 & 24h
Topography effectsP eriods of 12 & 24h
Atmospheric loadP ermanent
deformation Temperature
Hydrological load
Static Geoid
Tilt Deformation
P eriodic
No periodic
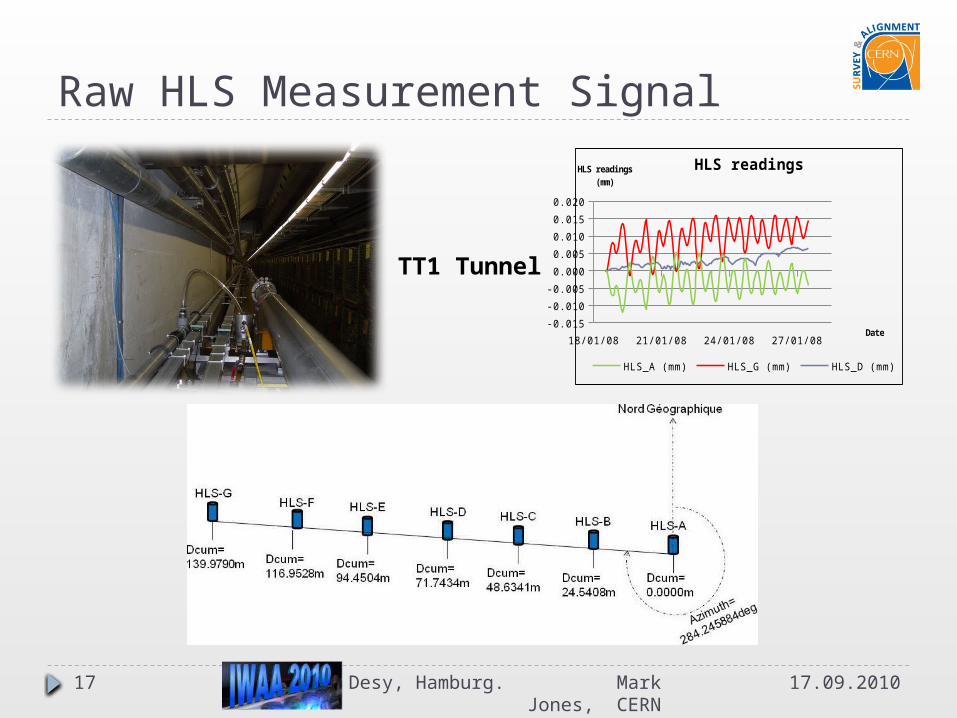
Raw HLS Measurement Signal
17.09.2010Desy, Hamburg. Mark Jones, CERN
17
TT1 Tunnel
18/01/08 21/01/08 24/01/08 27/01/08
-0.015
-0.010
-0.005
0.000
0.005
0.010
0.015
0.020
HLS readings
HLS_A (mm) HLS_G (mm) HLS_D (mm)
Date
HLS readings (mm)

Eterna Package Major tool for analysis and prediction of tidal
effects Developed by Prof.Dr.-Ing H.-G. Wenzel in the
1990’s Different tidal potential catalogues available Many programs included in the Eterna 3.30
Package ANALYZE program – for analysis of earth tide
observations Compares raw measurements against theoretical tide
models Determines modified tide parameters
New amplitude and phase shift parameters to predict future measurements
PREDICT program – computation of synthetic model tides Standard model, or results from ANALYZE
Main tool used for our research
17.09.2010Desy, Hamburg. Mark Jones, CERN
18

HLS Network Analysis Standard processing
technique using Eterna Analysis of 2.5 month
dataset Analysis values used
to predict tides for later 3 week period
Predicted tides and some load signals* removed from raw HLS signal
But we cannot distinguish between periodic signals in raw measurements We need to separate
some of them! 17.09.2010Desy, Hamburg. Mark Jones,
CERN19
SignalStdev of this signal (mm)
Correlation betwen this signal and
the previous raw (%)
Stdev of the signal after correction
(mm)
Raw HLS
Signal 10.0071 X X
Predicted
tide 20.0056 80 0.0043
Atmospheric
load 40.0009 52 0.0039
Hydrological
load 40.0002 45 0.0039
* Kindly provided by J.P. Boy, NASA GSFC

Analysis Results
17.09.2010Desy, Hamburg. Mark Jones, CERN
20

Analysis Results
17.09.2010Desy, Hamburg. Mark Jones, CERN
21
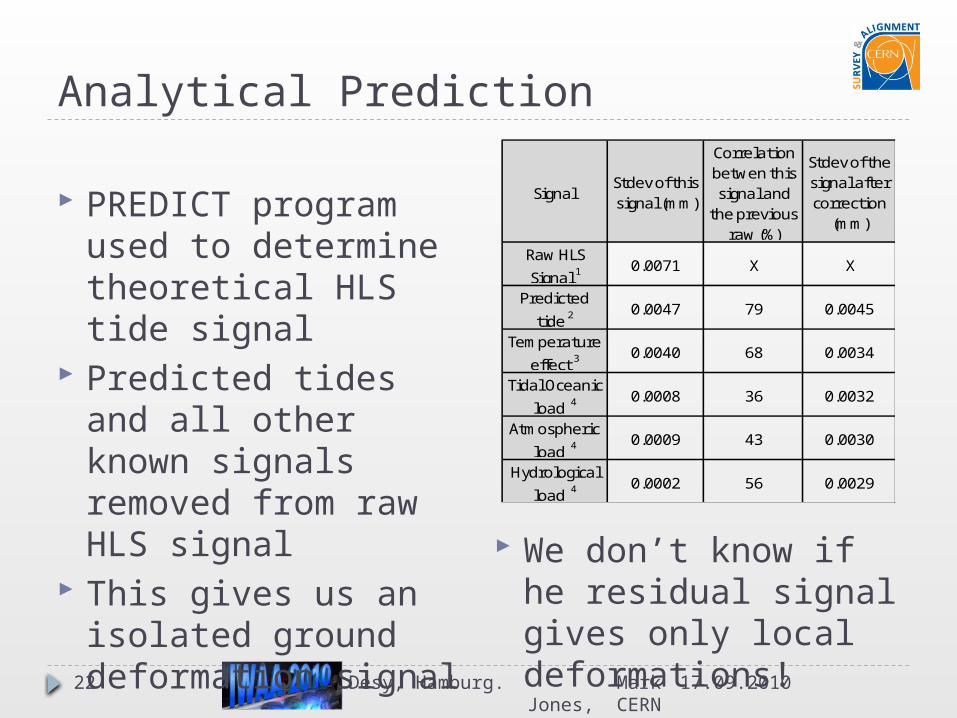
Analytical Prediction
PREDICT program used to determine theoretical HLS tide signal
Predicted tides and all other known signals removed from raw HLS signal
This gives us an isolated ground deformation signal
We don’t know if he residual signal gives only local deformations!17.09.2010Desy, Hamburg. Mark Jones,
CERN22
SignalStdev of this signal (mm)
Correlation betwen this signal and
the previous raw (%)
Stdev of the signal after correction
(mm)
Raw HLS
Signal 10.0071 X X
Predicted
tide 20.0047 79 0.0045
Temperature
effect 30.0040 68 0.0034
Tidal Oceanic
load 40.0008 36 0.0032
Atmospheric
load 40.0009 43 0.0030
Hydrological
load 40.0002 56 0.0029

Prediction Results
17.09.2010Desy, Hamburg. Mark Jones, CERN
23

Prediction Results
17.09.2010Desy, Hamburg. Mark Jones, CERN
24

Next Steps Need a different approach to meet specific
needs of accelerator alignment Isolate local tilt signal and local deformation signal
Another possibility using ANALYZE program Need to determine models for as many
phenomena as possible Remove all modelled signals from raw
measurement signal Use sensor at one end of HLS and pair it up with
each of the other sensors in turn Use results from end point sensors as base signal Remove signal from other analysed sensor pairs Remaining signals should represent relative
movements of intermediate sensors17.09.2010Desy, Hamburg. Mark Jones,
CERN25

Conclusions Two research projects launched to address
geoid and HLS issues from CLIC Feasibility Study and LHC installation Both projects in final year
800 metre tunnel selected for Geoid Precision study Campaigns of astro-geodetic and gravity
measurements Modifications to zenith camera (DIADEM) to
improve precision Initial results very promising
Further work required to confirm results
Improved precision of DIADEM confirmed in difficult field conditions
17.09.2010Desy, Hamburg. Mark Jones, CERN
26

Conclusions Two approaches tried to model tidal and other
effects on HLS measurements Disadvantanges to both methods
Need a new approach to meet the specific requirements of accelerator alignment Multiple sensors on each network, looking to
isolate local deformations and tilts Analysis is now in progress
Still some phenomena to take into account Need to apply results to LHC networks and
implement corrections
17.09.2010Desy, Hamburg. Mark Jones, CERN
27
17.09.2010Desy, Hamburg. Mark Jones, CERN
Thank you for your attention
28