Embed Size (px)
Citation preview

Lateral Stability of Rigid Poles Partially E1nhedded in Sand ROBERT L. KONDNER, Associate Professor of Civil Engineering, The Technological
Institute, Northwestern University, Evanston, Ill., and JAMES A. CUNNINGHAM, Instructor of Civil Engineering, Tri-State College, Angola,
Ind. Functional relationships are developed for the load-deflection characteristics of a rigid, vertical pole, embedded in sand and subjected to a horizontal load applied above the ground line. The study is based on non-dimensional techniques and the physical variables included in the theoretical analysis are the ground-line deflection, depth of embedment, geometry of the pole cross-section, applied force, moment arm, time of loading and soil parameters. The soil parameters used include the density, angle of internal friction, flow characteristics, and relative density of the sand. Non-dimensional techniques in conjunction with small-scale model studies are used to determine the explicit form of the interrelationship among the above physical variables for a pole embedded in a very dense, uniform, fine dune sand of constant properties and subjected to an applied horizontal force. Hyperbolic prediction equations are given from which the load-deflection characteristics of a prototype pole might be estimated. The superposition of groundline couple and ground-line thrust relationships to represent the more general case of a horizontal load applied above the ground line is investigated. The results of the present formulation are compared with both model and field studies previously reported by other investigators.
THE lateral stability of a pole embedded in soil has, to date, defied an altogether satisfactory analysis. In order to obtain a rigorous solution to the problem, the boundary forces or displacements must be known and a stress-strain-time relationship for the soil in question must be available. It is the assumptions that must be made inorder to fulfill these two requirements that seriously reduce the reliability of analytical results.
This paper uses the techniques of dimensional analysis and small-scale model experiments to study the behavior of a rigid circular pole embedded in a dense, uniform, fine dune sand of constant properties and subjected to a lateral force applied above the ground surface. Kondner (1, 2, 3, 4, 5, 6, 7) has previously demonstrated the effectiveness of these methods in the fleldof soiC mechanics. These methods allow the development of a prediction equation on a semi-empirical basis without requiring assumptions regarding boundary conditions or stress-strain laws for the soil.
A discussion of the literature on poles has been given by Kondner and Green (6). The following factors are reported in this paper: -
1. The applied moment-ground-line deflection relationship for a single circular pole embedded in sand.
2. The effect of pole diameter, depth of embedment and moment arm on the applied moment-ground-line deflection relationship.
Paper sponsored by Committee on Str ess Distribution in Earth Masses. 49

50
3. Investigation of the applicability of the superposition of ground-line couple and ground-line thrust relationships to represent the general case of a horizontal load applied above the ground line.
4. Comparison of the results of model testing with known field test results.
The work of Kondner and Green (6) was the first study to the authors' knowledge employing dimensional analysii:; and°'8mall-scale model tests for the purpose of examining the stability of laterally loaded poles. Their investigatiOJ! dealt with the general formulation of non-dimensional functional relationships for the lateral stability ofrigid poles, development of experimental apparatus, and effects of horizontal ground-line thrusts.
Later work by Kondner, Krizek and Schimming (7) demonstrated the effects of ap-plied couples. -
The purpose of the present investigation is to formulate a moment-deflection relationship for the given soil-pole system when the pole is subjected to an appliedlateral force at various distances above the ground surface. Preliminary considerations indicated that superposition of the ground-line thrust and ground-line couple cases was not equivalent to the general case. Thus, detailed considerations of superposition effects are investigated.
THEORETICAL ANALYSIS
Experiments are frequently conducted in which the independent physical quantities under consideration are varied, thus giving results that are seemingly different. Examination of the results in a non-dimensional form often leads to the realization that many of the tests were in actuality a duplication of effort. The method of dimensional analysis is one of the most effective ways of obtaining useful data with a minimum expenditure of experimental and computational effort. This method can be summarized as follows.
If there are m physical quantities containing n fundamental units, which can be related by an equation, then there are (m-n), and only (m-n), independent, non-dimensional parameters (called '" terms) such that the '" terms are arguments of some indeterminate, homogeneous function x.
(1)
In Eq. 1 and hereafter the symbol x denotes "some function of," but not necessarily the same function for each equation. This notation is used to avoid the use of numerous subscripts and superscripts as a means of differentiating between the functional forms.
To apply this procedure properly, a wise choice of the physical quantities involved must be made. Omission of significant variables may lead to very simplified but erroneous results while the consideration of unimportant variables may greatly reduce the usefulness of the results and considerably increase the expended experimental effort.
The quantities under consideration in this investigation are given in Table 1. A force, length, and time system of fundamental units has been used.
Once these physical quantities are chosen, a methodical process is used to obtain the '" terms contained in the functional formulation. The explicit form of the functional relationship must then be determined experimentally. Since there are 12 physical quantities and 3 fundamental units, there must be 9 independent, non-dimensional '" terms. These '" terms can be methodically obtained by choosing 3 physical quantities, which contain all 3 fundamental units and cannot be formed into a non-dimensional parameter by themselves, such as (M, t and L), and combining them with each of the remaining quantities one at a time. For example, combining them with y gives
'" = Ma tf3 If/' = F0 L0 T 0 (2)
Substituting the fundamental units of each of the physical quantities involved in Eq. 2 gives

F" LOTO
Equating exponents of the fundamental units gives:
QI + >.. = 0 f3 = 0 Cl' + p - 31.. 0
Solving Eq. 4 by letting a 1 gives
Cl' = 1 f3 = 0 >.. = -1 p
Therefore, the rr term under consideration is
rr = M/yL4
-4
51
(3)
(4)
(5)
(6)
By successive application of the above procedure, the remaining rr terms may be obtained. The resulting TT terms may be algebraically transformed to yield a new set of non-dimensional, independent'" terms which have a more significant form with regard to the experimentation.
The following nine non-dimensional, independent rr terms were used for this investigation:
Tl 1 x/C -rr2
D/L rrs
'YtC/1'7 rra = Dd TTg = s
C/L
(7)
The rr terms of Eq. 7 may be substituted into Eq. 1 to obtain the functional relationship:
x/C = )( (M/JCL3, C/L, D/L, C2
/ A, ¢, ytC/n, Dd, e) (8)
Physical significance can be attached to the rr terms appearing in Eq. 8. The dependent variable x/C is a deflection ratio. Shape effects are given by the term C2
/ A. The term D/L is a relative measure of moment arm to the embedment and may be thought of as an embedment ratio. A geometric factor C/L, called the slenderness ratio, pertains to the distribution of the cross-section area of the pole. The term M/yCL3 is the ratio of the applied moment to a soil strength parameter and is called the moment-strength ratio. Creep effects are included in the ytC/n term which is the ratio of the time of loading to a characteristic relaxation time of the soil. The significance of the angle of internal friction, rotation angle, and relative density of the sand are well known and they are by definition non-dimensional.
TABLE 1
PHYSICAL QUANTITIES CONSIDERED IN THE DIMENSIONAL ANALYSIS OF A RIGID POLE EMBEDDED IN SAND
Physical Quantity Symbol Fundamental
Units
1. Deflection at ground line x L 2. Depth of embedment L L 3. Cross-sectional area of pole A L2 4. Perimeter of pole c L 5. Moment at ground line M FL 6. Moment arm D L 7. Dry density of sand ')I FL-3
8. Angle of internal friction cp Fo Lo To 9. Viscosity of sand 1') FL-2T
10. Time of loading t T 11. Relative density Dd F OL OTO 12. Rotation of pole e FOL OTO

52
The form of the functional relation (Eq. 8) can be greatly simplified by restricting the scope of the study. If attention is confined to poles of circular cross-section, the shape factor C2 /A is a constant value equal to 4ir, regardless of the diameter. Preliminary work by Kondner and Green ( 6) indicates that by proper choice of the loading rate the effect of the term ytC/n can be minimized and hence eliminated from Eq. 8. Further work by Kondner , Krizek and Schimming (7) indicates that the ratio C/L has only a small influence on the results when the moment strength ratio is of the form M/yCL3
• This was verified in the present work. For the present study, the rotation e is dependent and expressable in terms of the other geometric variables.
Because the soil studied was a particular sand, maintained at a constant dense state by a vibratory preparation process, the angle of internal friction and relative density were constant for the present study. Thus, the functional relation of Eq. 8 can be written as
x/C = x (M/yCL3, D/L) (9)
subject to the restrictions placed on C2/ A, ¢ , Dd and loading rate.
EXPERIMENTAL PROCEDURE
Although the functional relationships for the general loading conditions of the rigid pole problem have been formulated for both cohesive and cohesionless soils (Kondner in an unpublished work in 1961), it was considered desirable for this initial phase of investigation to use sand rather than clay as the soil medium because sand properties are easier to control in the laboratory than those of clay and the time effects are generally considered to be less complex.
Sand
The particular sand used was a uniform, fine dune sand from Wolf Lake, Ind. , provided by Raymond Concrete Pile Company, Chicago. The sand had a gradation curve as shown in Figure 1 and was air-dried in the laboratory to a moisture content of about 1/ 4 percent. For a dense state (i.e., density = 108 pcf), this sand had an angle of friction ¢ of 37°, as determined from a series of triaxial compression tests. Subsequent to the beginning of each test, the sand was vibrated to a constant density of 107 pcf. Thus, the relative density was very close to one.
Poles
The model poles consisted of various lengths of polished aluminum or steel tube, plugged at the lower end. The properties of these poles are given in Table 2.
100
80
6o
Percent 40 Finer By Weigl:lt ;20
0 ;1
~
\
I
\"'--0.5 0 ,1 0 , 05 0 , 01
Grain Size in Hillimeters
Figure 1. Sand gradati on curve .

53
TABLE 2
PROPERTIES OF MODEL POLES
Diameter Area, Weight Perimeter, Pole Material (in.) A (g) c
(sq in.) (in.)
1 Aluminum 0.501 0.197 30 1. 573 2 Aluminum 0.626 0.307 62 1. 966 3 Steel 0.707 0.393 143 2. 221 4 Steel 0.927 0.674 216 2. 911 5 Steel 1.248 1. 222 229 3.921 6 Steel 1. 515 1. 801 478 4.755
Apparatus
A schematic diagram of the apparatus used in the study is shown in Figure 2. A cut-down oil drum was welded to a table-type concrete vibrator and mounted on a sturdy timber base. In order to minimize extraneous vibrations during the test, the timber base was supported on rubber blocks. The tank contained 330 lb of dry sand and the volume was determined from a calibration curve previously obtained. The load was applied to the model pole by hanging weights on a cord attached to the pole and passing over a small pulley.
Techniques
To eliminate any source of error resulting from loads due to the internal spring forces of the indicator dials, these springs were removed and the gage arms were secured to the pole by elastic bands.
Weight
Rigid Wood Base
Deflection Gages
D
L
Dr"' Sa!1d 14" 20,5"
_,.....,.....,._-r--t-7""'"""1~ Vibration Isolators
Figure 2. Experimental apparatus.

54
An investigation of the nature of the creep response indicated that after approximately two minutes the deflection continues at an extremely slow rate and ultimately tends toward a limiting value for a sufficiently large time. Therefore, it appears very reasonable to neglect the large-time portion of the deflection vs time curve and adopt a moment increment-time interval of two minutes. A similar conclusion was reached by Kondner and Green (~) in their analysis of the ground-line thrust problem.
EXPERIMENTAL RESULTS
The results analyzed were obtained from tests performed on model poles embedded in a dense sand and subjected to a lateral load at varying distances above the ground line. Loads were applied at a rate of 200 g per 2 min except for shallow embedments and large moment arms when the load increment was reduced to either 50 or 100 g.
As mentioned previously, Kondner, Krizek and Schimming (7) performed testsusing an applied couple only and showed that the C/L ratio has little effect on results plotted in the form x/C vs M/yCL3
• Consequently, tests were run keeping the D/L ratio at values of 0. 2, 0. 4, 0. 6, 0. 8, 1. 0 and 1. 2, while randomly changing pole size and hence C/L ratio. The schedule of tests (Table 3) gives the values of D and L for each pole in order to obtain some desired value of D/L and C/L. An intensive test program was carried out according to Table 3 and many tests were repeated to insure duplicability.
Results of the tests plotted in the form x/C vs M/yCL3 for each of the D/L ratios are shown in Figure 3. Inasmuch as no phenomenological pattern was noticeable as a result of using various poles and C/L ratios, each curve represents an average curve of a number of tests. An example of the type of scatter observed is shown in Figure 4 where the D/L ratio is 0. 4. To obtain a unique relationship between M/yCL3
, x/C, and D/L, a constant value of ytC/ri would have been required for all tests. Theoretically, this could be done by varying the loading rate or loading increment for each test. But, such loading rates cannot yet be predicted in the field of soil mechanics. Thus, the scatter in Figure 4 probably includes some error due to time effects and C/L effects as well as experimental error.
The shape of the moment-strength ratio vs deflection ratio curves is definitely that of a non-linear material. These curves tend asymptotically to their respective upper limits as x/C becomes large.
If the data given by the average curves of Figure 3 are replotted in the for m of the reciprocal of the secant modules, x/C + M/YCL3 = xyL3/M vs x/C, the straight lines
J;'igure j. Non-dimensional plot of M/yCL3 vs x/C for various values of D/L.

55
in Figure 5 can be used to represent the responses. These lines show that the explicit form of the functional relation between M/YCL 3 and x/C can be represented as a two-constant hyperbolic equation
xyL3/M = a + b (x/C) (10)
or
x/C a + b (x/C)
where a and b are the intercept and the slope, respectively, of each of the straight lines and are, therefore, functions of D/L.
(11)
Physical significance can be attached to the constants a and b (Kondner 8 , 9 ) • Differentiating Eq. 11 with respect to the deflection parameter and evaluating the-derivative for zero deflection gives
[d (M/yCL3
)]
d (x/C) 1 (12) a
x/C =0
Thus, the rec iprocals of the intercepts of the straight lines in the transformed hyperbolic plots of Figure 5 represent the initial tangent modulus of the M/yCL3 vs x/C relation and are a function of D/L.
By taking the mathematical limit of the moment-strength ratio in Eq. 11 as the deflection parameter x/C becomes excessive, the ultimate value of the strength ratio becomes
(y~L3)ult lim (*') ...l. (13)
x/C-+ ,,, b
TABLE 3
TEST SCHEDULE
C/ L D/ L
0.4 0.6 0.8 1. 0 1. 2
0.2 Pole 3 Pole 4 Pole 5 Pole 6 Pole 6 L = 5. 55 L = 4. 85 L =4. 90 L = 4. 76 L = 3.96 D=l.11 D= 0. 97 D = 0. 98 D = 0. 95 D = O. 79
0.4 Pole 3 Pole 4 Pole 5 Pole 6 Pole 6 L= 5. 55 L =4. 85 L = 4. 90 L = 4. 76 L = 3.96 D = 2. 22 D = 1. 94 D = 1. 96 D= 1. 90 D = 1. 58
0.6 Pole 3 Pole 4 Pole 5 Pole 6 Pole 6 L = 5. 55 L = 4. 85 L=4. 90 L = 4. 76 L = 3. 96 D = 3. 33 D= 2. 91 D= 2. 94 D= 2. 85 D = 2. 38
0.8 Pole 3 Pole 4 Pole 5 P ole 6 Pole 6 L = 5. 55 L = 4. 85 L=4. 90 L = 4.76 L = 3. 96 D=4. 44 D=3. 88 D= 3. 92 D = 3. 80 0=3.17
1. 0 Pole 3 Pole 4 Pole 5 Pole 6 Pole 6 L= 5. 55 L = 4. 85 L = 4. 90 L = 4. 76 L = 3.96 D = 5. 55 D = 4. 85 D = 4.90 D=4. 76 D = 3. 96
1. 2 Pole 1 Pole 4 Pole 5 Pole 4 Pole 6 L = 7. 27 L = 4. 85 L = 4. 90 L = 2. 91 L=3. 96 D= 8. 71 D = 5. 83 D= 5. 89 D = 3. 49 D=4. 76
Note : All dimensions are inches .

56
:<I~ 0. 251---~"°--'---,,...::i;_.=-----+------~------I ~ • 0 4
Values of t 0 400 0 48~ 0 600
.. 0 . 600 v I 200 0-00.._ _____ __.. ______ -1.... ______ ,,__ _____ _,
0 25 75 100
Figure 4. Non-dimensional plot of M/yCL3 vs x/C for various values of C/L D/L = 0.4
0 .15
D T 0.4
06
0 .8 1.0
0. I 0 1---r------t---/-----_,,"-l--~""-->4<~-':..::· 2~
0 .00..._ ______ _._ _______ 1-______ ....
0 25 50 75
Figure 5. Transformed hyperbolic form of M/yCL" vs x/C 1'or various values of D/L.
Therefore, the inverse of the slopes of the straight lines in Figure 5 represent a measure of the ultimate value of the moment-strength ratio and are a function of D/L.
To determine the relation between D/L and the intercept a, D/L for each straight line is plotted against the parameter D/L + a (Fig. 6). The equation of the straight line is again of the two constant hyperbolic form and can be written as
1. 022 x 10- 2 D/L a = D/L - 0. 258
(14)
Likewise, the relation between D/L and the slope of each straight line b is
b = 1.217 D/L D/L - 0.150
as shown in Figure 7.
(15)
Substitution of Eqs. 14 and 15 in Eq. 11 gives
M yCL3
x/C
(1. 022 x 10- 2
D/L + 1. 217 D/L) ~ D/L - 0. 258 D/L - 0. 150 C
(16)
The moment-strength parameter of Eq. 16 is a function of both the deflection parameter x/C and the moment arm parameter D/L.
Figure 8 compares the ultimate values of the moment-strength ratio given by Eq. 13 with the average measured values. The dashed line indicates a perfect correlation factor of one; the solid line gives the correlation factor of 0. 904. Thus, the ultimate moment-strength ratio can be written in terms of a stability or failure
numb( :L')i = k (n/.~1~ ~:~o) (t71
in which k is the correlation factor of Figure 8.
It must be emphasized that the relations given in Eqs. 14, 15, 16, and 17 are restricted to the range of values of D/L investigated; namely, 0. 2,;; D/L,;; 1. 2.
1.4
1.2
0.9
/ _/ v 0.6
0.3 / v
0 .0 0
Q
25 50
D T -;- a
57
./
/ /
75 100
Figure 6. Transformed hyperbolic form of D/L vs hyperbolic intercept.
0 025 0.50
-.!f -:- b
0.75 100
Figure 7. Transformed hyperbolic form of D/L vs hyperbolic slope.

58
Average Value of ( M ) YCL3 ult.
Fie;11re 8 . r.or.relation of(~) given by l / b vs average value of (-M-) . y CL ult y CL3 ult
SUPERPOSITION CONSIDERATIONS
Preliminary investigation showed that the response for the general case of a pole subjected to a horizontal load above the ground line could not be obtained by superimposing the two cases of a horizontal ground-line thrnst (6) and the equivalent groundline couple (7 ) although the loadings are statically equivalent. This illustrates the non-linearity of the pole problem in general and the stress-strain response of the soil in particular. Because of this non-linearity the tests presented herein represent a fairly general situation and not simply a combination of two special cases. Based on the present results, a more complete investigation of the applicability of superposition was performed.
The method used was to compa1·e the deflection parameter x/C of the general case with the si.1m of the deflection parameters of the other two cases [(x/C)F + (x/C)M] with given values of the moment-strength parameter M/yCL3 for each value of D/L. The thrust-strength parameter can be written as
F/yCL2 = M/yCL3 + D/L (18)
Kondner and Green (6) showed that the relation between the thrust-strength parameter F/yCL2 and the deflection parameter x/C can be represented by
F/yCL2 = 0. 72 log10 (500 x/C + 1) (19)
or solving for x/C
x/C = exp (3. 21F/yCL2
) -1 (20) 5,000
Kondner, Krizek and Schimming (7) showed that the relationship between the couple
strength parameter ( y~L1 c and the deflection parameter x/C is of the form
( y~L3) c = 0. 0048 ~/~. 57 x/C (2
l)

59
or solving for x/C 0.0048 (~ )c
1 - 0. 57 ( y~Lst x c (22)
The results obtained in the paper show that the relation between the moment-strength parameter M/yCL3
) and the deflection parameter x/C is of the form
M yCL3
x/C a + b x/C
where a and bare functions of D/L as given in Eqs. 14 and 15.
Solving for x/C
x = a(tu) C bM
1 - yCLs
(23)
(24)
The results of solving each of Eqs. 20, 22 and24 for ;iven values of M/yCL3 and D/L are shown in Figu1·e 9. For a given value of M/yCL, the deflection parameter x/C is much greater for the general case (solid curve) than for the sum of the other two cases (dashed curve). This demonstrates the fact that the superposition principle cannot be applied and hence the limitations of linear theories. Such limitations are also generally contained in theoretical analyses using a soil modulus approach.
L6
08
D/ L •1.2 -D/L • 0 .6 -D/L • 1.2
D/L • 0 .6
0/l. 0.2
-
-
- - SUPERPOSI ION: EQS (20)8(22 - GENERAL ASE: EO (24)
00"'------..__ ____ ..__ ____ _._ ____ ....._ ___ __, 0 20 40 60 80 100
Figure 9. Non-dimensional plot of M/yCL3 vs x/C demonstrating superposition corr elation.

60
CORRELATIONS WITH OTHER INVESTIGATIONS
A report of field and laboratory tests on the stability of posts subjected to lateral loads was reported by Shilts, Graves and Driscoll (10). Tests were performed on both full-scale posts and on large-scale model poles embedded in sand, similar to the testing done for the investigation presented herein. The data were presented in the form of a load-deflection curve for each test. Generalized conclusions were drawn concerning the effect of soil density, depth of embedment and shape of post. An equation was derived describing the relation between the movement of the post at ground level and an average soil pressure caused by a lateral load.
0
MODEL TESTS 3 inch I- beams
Shilts, et al
(C = LO)
Post No. t D 17 1.6
x 18 1.25
"' 19 1.0
a 0 20 1.0
* 22 1.25
o.o.._~~~~~~-'-~~~~~~~..__~~~~~~_,
0.5 ..!.. LO 1.5 c 0
Figure 10. Transformed hyperbolic forms of M/yCL3 vs x/C for 3-in. I-beams at various values of D/L.
61
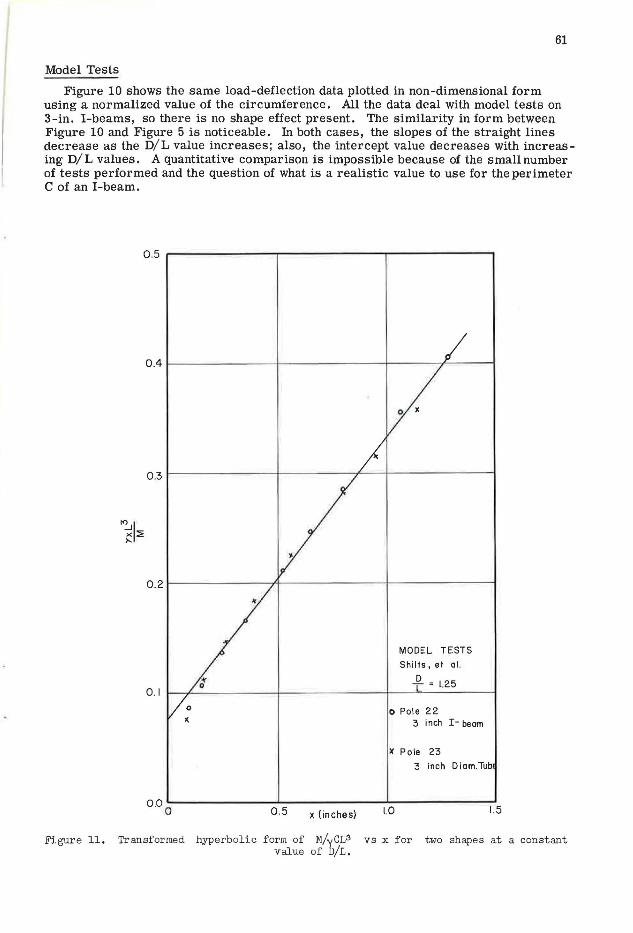
Model Tests
Figure 10 shows the same load-deflection data plotted in non-dimensional form using a normalized value of the circumference. All the data deal with model tests on 3-in. I-beams, so there is no shape effect present. The similarity in form between Figure 10 and Figure 5 is noticeable. In both cases, the slopes of the straight lines decrease as the D/L value increases; also, the intercept value decreases with increasing D/L values. A quantitative comparison is impossible because of the small number of tests performed and the question of what is a realistic value to use for the perimeter C of an I-beam.
Figure 11.
r<>_JI x::? >-
0.4 1---------------1--------+----------1
0 .3
MODEL TESTS
Shilts, et al.
_Q_ = l.25
o Pale 22 3 inch I- beam
~ Pole 23
3 inch Diam.Tub
0 .5 x (inches) 1.0 1.5
Transformed hyperbolic form of M/yCV~ vs x for two shapes at a constant value of D/L.

62
Figure 11 is a transformed hyperbolic plot for two tests performed on model poles with the same D/L ratio but different shapes. One is a circular pole with a 3-in. diameter and the other an I-beam with a 3-in. depth. They lie essentially along the same straight line. This seems to indicate that an I-beam has the same resistance as a circular pole with a diameter equal to the depth of the I-beam. If this is the case, a quantitative compari.son can be made between the circular poles inveslig;a.led in this paper and the I-beams tested by Shilts, Graves and Driscoll (10). Such a comparison is shown in Figure 12. -
The data for the I-beam are plotted non-dimensionally using a value of C equal to that of a circular pole with a diameter equal to the depth of the I-beam. The data for the round pole are taken directly from Figure 5. Since the two plots are for the same value of D/L, one would expect them to coincide on a non-dimensional plot. Their failure to coincide could be due to a difference in relative density of the sand used for the two sets of tests. For the tests presented herein the density was controlled very carefully through the use of a vibrator.
The test pit and models used for the I-beam tests were larger and probably subject to less control, and hence resulted in a loose state. A comparison of the two curves of Figure 12 strengthens this conclusion. The slope of the straight line for the I-beam tests is greater and hence the ultimate value of the moment parameter, as given by the
Figure 12.
0.4 .....-------.- ------.,.- ----....... ------.
3 inch I- beam
Shilts, et al .
Post 20
f = LO
Circular Pole Computed from
Fig . 3
D T = 1.0
o .o~-----"---------------------0 20 60 80
Transformed hyperbolic form of M/yCL3 vs x/C f or a 3-in. I-beam and a 3-in. circular pole, D/L = 1.0.

Figure 13.
0 .10 . .------.-------------~
"'..JI 0 .09 ~~
MODEL TESTS
Shilts, et al.
003 1-->,.,_y-~+---~--1-----1--~-----1 o 3 inch D am 2 Round
a D/L = 1. 67
a 3 inch quare
D/L = 2.00 o.oo.__---~-----'-----'-------'
0 03 06 0 .9 12
x (inches)
63
Tr ansformed hyperbolic form of M/yCL3 v s x f or two shapes at differ ent v alues of D/L.
inverse of the slope, is less than that of the round pole tests. This would be expected if the sand were loose (lower relative density). In addition, the intercept value is higher for the I-beam tests which means the initial tangent modulus is lower for the plot of M/yCL3 vs x/C. This also would be expected if the sand were in a loose state. Thus, the failure of the two curves of Figure 12 to coincide can be attributed to either one or both of two causes: (a) the relative density of the sand varied in the two different experimental apparatus and/ or (b) an I-beam is not equivalent to a circular pole with a diameter equal to the depth of the I-beam.
Shape effects have previously been mentioned several times. This study was confined to the testing of round poles. However, some results are given for other shapes by Shilts, Graves and Driscoll (10). They are given in non-dimensional form in Figure 13. Although not enough tests were performed to formulate a quantitative analysis, it is interesting that these plots also take the form of a two-constant hyperbola. This leads one to believe that further investigation on poles with various shapes will notlead to new relationships between load and deflection, but will only change the slope and intercept factors (a and b) by making them shape dependent.
Field Tests
The field test data on full-scale posts presented by Shilts, Graves and Driscoll (10) are shown plotted non-dimensionally in Figure 14. Posts 1, 5 and 6 were chosen be=cause they were the only tests carried to a significantly large deflection. An average density of 109. 5 pcf was used in the calculations. The abscissa, x, was not plotted non-dimensionally because of the question of the suitable choice of a value for the perimeter , C. The only effect due to the inclusion of the perimeter would be to change the abscissa scale; thus, the form of the plot would not be altered.

64
FIELD TESTS
Shilts, et al
Post No D T
v 2 .0 x 5 2 .0 0 6 2 .0
0 0 .8 1.6 2.4 3.2
x (inches)
Figure 14. Transformed hyperbolic form of M/yCL3 vs x, field tests.
0 .5
0 0.2 Loose
Ill 0 .2 , Dense x 0.4 Loose
* 0.4 , Dense
0,0 0 20 40 50
i ( 10-3)
Figure 15. Non-dimensional plots of M/yCL3 vs x/C for various C/L values and dcnsi ty conditions.

65
It is not significant that the lines nearly coincide because if the abscissa were nondimensionalized the curves would spread out inasmuch as post 1 is an Olmstead post, post 5 is a 7-in. steel I-beam with wings, and post 6 is an Olmstead post set in soil cement of 2-ft diameter.
The important aspect to note is that the form of the response is the same as that obtained for the model tests; namely, that of a two-constant hyperbolic representation.
Design Chart
A publication by the American Wood Preservers Institute (11) gives a design chart that is used by the Outdoor Advertising Association of America to obtain the required depth of embedment for posts subject to overturning loads. This chart was designed using information from Shilts, Graves and Driscoll (10). By knowing the load to be carried, the height of the load above the ground surface, the diameter of the pole to be used, and by estimating an allowable soil stress, an embedment depth can be found which will supposedly restrict the deflection at the ground-line surface to 0. 5 in.
If a depth of embedment, height of load above ground surface, and allowable soil stress are first chosen and the chart then used to arrive at a load which can be carried for each diameter of pole, then the same non-dimensional parameters M/y CL3
, x/C, D/ L can be calculated.
For a constant value of D/ L such a procedure will yield a horizontal line for each different depth of embedment on a plot of M/yCL3 vs x/C.
Replotting the same data as a function of the embedment parameter C/L will yield a group of straight lines (Fig. 15). Thus, the design chart has represented a nonlinear response by a set of linear relations. The value of the moment-strength parameter (Fig. 15) varies only from 0.182 to 0.458. This same range of values forthe moment parameter of Figure 3 at a large D/L value can be reasonably approximated by a straight line. However, the further this straight line is extended, the worse the approximation becomes. For example, if a small enough pole were chosen so that the value of x/C was very large, use of Figure 15 would predict a very large value of the M/yCL3 term. In iact, the ultimate value is infinite. This is unreasonable. The difficulty lies in the use of an arbitrary 0. 5-in. ground-line deflection as the design criterion. This may be acceptable as a criterion for the movement of a building member, but as a stability criterion for a pole an arbitrary maximum deflection is not satisfactory. A large pole that has deflected % in. may be perfectly safe, whereas a small pole that has deflected the same amount may be near failure (Fig. 3). A satisfactory stability criterion might possibly be expressed as some ratio of deflection to pole size, such as x/C.
To demonstrate the important effect of relative density, Figure 15 shows two sets of curves for which nothing is changed except the relative density (allowable soil stress on the design chart). The curves for the high relative density are steeper than for the low case, showing that the high value will withstand more load for a given deflection.
Model pole tests in the form of M/yCL3 vs x/C, where each curve is a function of C/L have been reported (7 ). The curves were two-constant hyperbolas with a slope concave downward. Figure 16 plots the data from the design chart in this form. The curves are concave upward, indicating that a pole-sand system would act as a "hard" system with the moment increasing more rapidly than the deflection. Such a response is unrealistic. This does not mean that the design chart has no value, but it should be restricted to certain ranges of parameters and care should be exercised in its use.
Correlation of the design chart with the experimental results indicates that it would be highly desirable to conduct a carefully planned and controlled field study of fullscale pole systems utilizing the non-dimensional functional relationships presented. It is felt that if such a program is designed and conducted on the basis of non-dimensional techniques, there is a better chance of developing rational design criteria for the entire response range from initial loading through failure with a minimum of effort.

66
4 0 ...------~-----~-------
30 1~------t-~---~---t~~-1-----1
Dato from
.Q.llign Chart
f . 2.0 y • 109.5 lbs /ft.3
SI • 2400 lbs/ft 2 10 1~------1--r+-iP--------t~~~----1
v L . 5 .0 ft.
0 L . 6.0 ft.
L . 7 .0 ft .
c L . B.O ft.
0 .0 ---=------'--------1-------' 0 10 20 30
Figure 16. Non-dimens i onal plot of M/yC3~ :s x/C for D/L 01 L.
2.0 and various values
CONCLUSION
Quantitative results show that the superposition of ground-line couple and groundline thrust relationships to represent the more general case of a horizontal load applied above the ground line is not valid.
ACKNOWLEDGMENTS
This research was conducted under support given by the National Science Foundation, research grant NSF-GP-359.
The authors also wish to express their appreciation to the various investigators whose previously published results have been utilized in this paper.
REFERENCES
1. Kondner, R. L., "A Non-Dimensional Approach to the Vibratory Cutting, Compaction and Penetration of Soils." Tech. Report No. 8, Dept. of Mechanics, Johns Hopkins Univ. (Aug. 1960).
2. Kondner, R. L., and Edwards, R. J., "The Static and Vibratory Cutting and Penetration of Soils." HRB Proc., 39:583-604 (1960).
3. Kondner, R. L., and Krizek, R. J., "A Non-Dimensional Approach to the Static and Vibratory Loading of Footings." HRB Bull. 277 37-60 (1960).
4. Kondner, R. L., "A Penetrometer study of the 'In-Situ' Strength of Clays." Materials Research and Standards, ASTM, 2:3 (March 1962).
5. Kondner, R. L., "Friction Pile Groups in Cohesive Soils." Jour. of Soil Mech. and Found. Div., ASCE, 88:3, 117-149 (June 1962).

67
6. Kondner, R. L., and Green, G. E., "Lateral Stability of Rigid Poles Subjected to a Ground Line Thrust." HRB Bull. 342, 124-151 (1962).
7. Kondner, R. L., Krizek, R. J., and Schimming, B. B., "Lateral Stability of Rigid Poles Subjected to an Applied Couple." Tech. Report, Civil Eng. Dept., Northwestern Univ., p. 36 (1962) .
8. Kondner, R. L., "Hyperbolic Stress-Strain Response: Cohesive Soils." Jour. of Soil Mech. and Found. Div., ASCE, 89:1, 115-143 (Feb. 1963).
9. Kondner, R. L., "Hyperbolic Stress-Strain Relation in Direct Shear." Tech. Report, Civil Eng. Dept. Northwestern Univ., p. 35 (1962).
10. Shilts, W. L., Graves, L. D., and Driscoll , G. G., "A Report of Field and Laboratory Tests on the Stability of Posts Against Lateral Loads." Second International Conf. of Soil Mech. and Found. Eng., Rotterdam (1948).
11. "How to Design Pole-Type Buildings." 3rd Ed., American Wood Preservers Institute (1962).
12. Bridgman, P. W., "Dimensional Analysis." New Haven (1931).