Embed Size (px)
Citation preview

Lateral and Torsional Seismic Vibration Control for
Torsionally Irregular Buildings
by
Osman Akyürek
A dissertation submitted to the Office of Graduate Programs of
Florida Institute of Technology
in partial fulfillment of the requirements
for the degree of
Doctor of Philosophy
in
Civil engineering
Melbourne, Florida
May, 2019

© Copyright 2019 Osman Akyürek
All rights reserved
The author grants permission to make single copies
_________________________________________________

We the undersigned committee hereby approve the attached thesis, “Lateral and
Torsional Seismic Vibration Control for Torsionally Irregular Buildings” by Osman
Akyürek.
_________________________________________________
Nakin Suksawang, Ph.D., P.E.
Associate Professor
Department of Mechanical and Civil Engineering
Committee Chair
_________________________________________________
Albert Bleakley, Ph.D., P.E.
Associate Professor
Department of Mechanical and Civil Engineering
_________________________________________________
Troy Nguyen, Ph.D., P.E.
Associate Professor
Department of Mechanical and Civil Engineering
_________________________________________________
Tiauw Hiong Go, Sc.D.
Associate Professor
Department of Aerospace, Physics and Space Sciences
_________________________________________________
Ashok Pandit, Ph.D., P.E.
Professor and Head
Department of Mechanical and Civil Engineering

iii
Abstract
Title: Lateral and Torsional Seismic Vibration Control for Torsionally Irregular
Buildings
Author: Osman Akyürek
Advisor: Nakin Suksawang, Ph.D., P.E.
During strong earthquakes or wind gusts, it is likely that buildings with torsional
irregularity in the plan have an can be seriously damaged, partially collapsed or fully
collapsed. This is because Torsionally Irregular Buildings (TIBs) may have
significant aerodynamic torsion loads that increase the eccentricity between the
center of mass and the center of rigidity, especially in dominant torsion modes. For
this reason, torsion leads to excessive increase in lateral motions when dynamic loads
excite the buildings.
Torsional irregularity is one of the main failure causes during strong dynamic
excitations due to earthquakes or wind gusts. Ignoring torsional irregularity in
seismic design analysis can cause unexpected damages and losses. To enhance the
safety and performance of buildings, most of the current seismic provisions address
this irregularity in two main ways. The first is computing torsional moment at each
floor by using equations provided in various current seismic code provisions. After

iv
they are applied on each floor, the seismic analysis will be performed. The second is
shifting the center of mass (CM) or stiffness (CS) to eliminate the eccentricity by
putting additional masses or structural components such as braced frame systems on
buildings.
This research developed and validated a new torsionally effective control system for
the purpose of enhancing the performance/safety and mitigating structural failure in
Torsionally Irregular Buildings (TIBs) under bidirectional strong earthquake loads.
It introduces the new integrated control system (ICS) applied to a benchmark 9-story
steel building developed for the SAC project in California to suppress the undesirable
lateral and torsional coupling effects due to eccentricity. The dynamic responses of
the system were evaluated under N-S and W-E components of the real earthquake
excitations of the El Centro (1940), Loma Prieta (1989) and Kocaeli (1999)
earthquakes. First the traditional method (cross-braced frame systems) was
implemented in the benchmark building with different pre-determined placement
layouts. The most effective placement was determined and the benchmark building
was analyzed with that for comparison purpose. Secondly, tuned mass dampers
(TMDs) were designed and applied to start from the center of mass (CM) through
two translational directions under bi-directional seismic loads such as N-S and E-W
components of selected ground motions. Then the performance evaluation for TMDs
was determined. The effectiveness of the TMD system was evaluated in terms of
energy analyses and performance evaluation criteria including maximum floor

v
displacement, maximum drift, and maximum floor acceleration. Based on these
comparisons, there is a substantial reduction of the amplitudes of the frequency
response validated the effectiveness of the ICS in controlling the seismic responses
for two-way eccentric elastic buildings. Unlike traditional TMDs placed in two
orthogonal directions, the ICS is more comprehended to control not only two
orthogonal (x- and y-) directions, but also effectively control rotational (θ-) direction.
By means of the proposed system configuration, the structures first-three dominants
modes can effectively be controlled by the ICS regardless of any external energy
sources. The ICS is also more robust in restricting the inter-story drift ratio as
compared with TMDs. It sufficiently mitigates the RMS and peak displacement on
the top floor of the Benchmark building. Thus, the ICS has a better performance than
the TMDs and the CFs placement in terms of response reductions. According to the
performance evaluation criteria, there are substantial reductions for both the tuning
case and the detuning case. For both cases, the performance indexes are overall less
than the bare Benchmark building and its respective application with the TMDs.

vi
Table of Contents
Table of Contents ................................................................................................................ vi
List of Figures ..................................................................................................................... xi
List of Tables .................................................................................................................... xvii
Acknowledgements ........................................................................................................... xix
Dedication ........................................................................................................................... xx
Chapter 1 Introduction ....................................................................................................... 1
1.1: Overview of Structural Seismic Analysis .................................................................. 1
1.2: Motivation .................................................................................................................. 2
1.3: Research Objective and Research Tasks .................................................................... 5
1.3: Research Organization ............................................................................................... 7
Chapter 2 Literature Review ............................................................................................ 10
2.1: Control System ......................................................................................................... 10
2.1.1: Passive Control System ......................................................................................... 10
2.1.1.1: Passive Energy Dissipation System ................................................................... 12
2.1.1.2: Tuned Mass Damper .......................................................................................... 13
2.1.1.3: Tuned Liquid Mass Damper ............................................................................... 18
2.1.1.4: Base Isolation ..................................................................................................... 21
2.1.2: Active Control System .......................................................................................... 23
2.1.3: Semi-Active Control System ................................................................................. 26

vii
2.1.4: Hybrid Control System .......................................................................................... 28
2.2: Summary .................................................................................................................. 28
Chapter 3 Methodology and Terminology ...................................................................... 30
3.1: Torsional Irregularity ............................................................................................... 30
3.1.1: A Brief Literature .................................................................................................. 31
3.1.2: Torsional Design Code (ASCE 07-10) .................................................................. 34
3.2: Definitions and Terminology ................................................................................... 37
3.2.1: Lateral-Torsional Coupling Effect ........................................................................ 37
3.2.2: Center of Mass ...................................................................................................... 38
3.2.3: Center of Stiffness ................................................................................................. 39
3.2.4: Eccentricity ........................................................................................................... 40
3.3: Additional Bracing Frame System ........................................................................... 41
3.3.1: Infill wall into Reinforced Concrete Buildings ..................................................... 41
3.3.1.1: Theory of the Equivalent Compression Strut ..................................................... 42
3.3.2: Cross Bracing Frames in Steel Buildings .............................................................. 43
3.3.2.1: Theory of the Equivalent Compression Strut ..................................................... 44
3.4: Control System ......................................................................................................... 45
3.4.1: Principal and Design of a Traditional TMD .......................................................... 45
3.4.2: Optimum Design Parameters ................................................................................ 51
3.5: Modern Control Theory ........................................................................................... 52
3.5.1: State Space Modelling for an LTI system ............................................................. 52
3.5.2: State Feedback....................................................................................................... 55
3.5.3: Linear Quadratic Regulator (LQR) ....................................................................... 56

viii
3.6: Performance Evaluation Criteria and Seismic Energy Analysis .............................. 57
3.7: Summary and Discussion ......................................................................................... 60
Chapter 4 Various Control Systems under Unidirectional Seismic Loading Case ...... 62
4.1: Introduction .............................................................................................................. 63
4.2: Description of Model Buildings ............................................................................... 66
4.3: Model Overview ....................................................................................................... 69
4.3.1: Control Systems and Applied Seismic Load ......................................................... 69
4.3.2: Adding Infill Wall ................................................................................................. 72
4.4: Structural Dynamics and Control Theory ................................................................ 75
4.4.1: Mathematical Modeling ........................................................................................ 75
4.4.2: Optimum Fundamental Properties of the TMD .................................................... 76
4.4.3: Control Theory ...................................................................................................... 77
4.4.4: Actuator Location & Actuator Dynamics ............................................................. 79
4.5: Simulation Results and Discussion .......................................................................... 81
4.6: Summary .................................................................................................................. 90
Chapter 5 Integrated Control System (ICS) under Bidirectional Seismic Loading
Case ..................................................................................................................................... 92
5.1: Introduction .............................................................................................................. 93
5.2: Integrated Control System ........................................................................................ 99
5.3: Equation of Motion ................................................................................................ 102
5.3.1: State-space Representation .................................................................................. 111
5.4: Design Procedure ................................................................................................... 113
5.4.1:Optimum Dynamic Property ................................................................................ 115

ix
5.5: Model Overview ..................................................................................................... 116
5.5.1: Description of Benchmark building .................................................................... 116
5.5.2: The Simplified Equivalent System ...................................................................... 118
5.5.3: Implementation of the TMDS and The ICS ........................................................ 120
5.5.4: Cross Frame System ............................................................................................ 121
5.5.4.3: Determining the Best Placement of CFs .......................................................... 125
5.5.5: Ground Motion Selections .................................................................................. 125
5.6: Simulation Results and Discussion ........................................................................ 127
5.7: Summary and Observation ..................................................................................... 148
Chapter 6 Active Integrated Control System (AICS) under Bidirectional Loading
Case ................................................................................................................................... 152
6.1: Introduction ............................................................................................................ 152
6.2: Optimum Vibration Control by the AICS .............................................................. 153
6.2.1: Model Overview and Configuration.................................................................... 153
6.2.2: Equation of Motion ............................................................................................. 155
6.2.3: Design Optimization Procedure .......................................................................... 157
6.2.4: Control Theory .................................................................................................... 157
6.3: Simulation Results and Discussion ........................................................................ 158
6.4: Summary and Observation ..................................................................................... 161
Chapter 7 Conclusions and Future Study ..................................................................... 162
7.1: Summary ................................................................................................................ 162
7.2: Future study ............................................................................................................ 162

x
References ......................................................................................................................... 167

xi
List of Figures
Figure 1-1. Three-dimensional civil structure representation and its torsional mode 2
Figure 1-2. The torsional effects on structural damage: (a) Courtesy of Gokdemir et
al. 2013; (b) Courtesy of Arslan and Korkmaz 2007 ......................................... 4
Figure 2-1. Comprehensive view of control systems ............................................... 10
Figure 2-2. One of the real-life implementations of the pendulum tuned mass
damper (Taipei World Financial Center) ......................................................... 11
Figure 2-3. TMD implementation in the Millennium Bridge, London, England .... 13
Figure 2-4. TLD application on Comcast center, Pennsylvania, USA .................... 20
Figure 2-5. The application of base isolation, Sabiha Gokcen Airport in Turkey, .. 22
Figure 2-6. The first active control system applied (Active Mass Damper),
Kyobashi Center Building, Tokyo in Japan, Courtesy of TAKEHIKO ........... 26
Figure 3-1. Torsional irregularity definition for the illustration of extreme and
average displacement ....................................................................................... 35
Figure 3-2. Design and natural eccentricities including accidental torsional
response (a) and equilibrium position before and after (‘) applied force (b) ... 36
Figure 3-3. The equivalent diagonal strut for infill wall representation (FEMA strut
model) .............................................................................................................. 42
Figure 3-4. Cross frame design in compression ....................................................... 44
xii
Figure 3-5. A schematic view of TMD attached to SDOF ...................................... 46
Figure 3-6. The frequency response by varying damping constant for TMD design
(μ=0.01 and ξ=0.02 for the uncontrolled structure) ......................................... 50
Figure 3-7. The frequency response by varying mass ratio for TMD design (μ=0.01
and ξ=0.02 for the uncontrolled structure) ....................................................... 50
Figure 3-8. Block diagram of an LTI system ........................................................... 53
Figure 3-9. Block diagram of the state feedback controller ..................................... 56
Figure 4-1. The infill wall placement in the plan for 5-story 3x3-bays; red color
represents fully infill wall placement into the frame ....................................... 66
Figure 4-2. El Centro (North-South) ground acceleration, in 1940. ........................ 70
Figure 4-3. RC building in plain-view ..................................................................... 70
Figure 4-4. Elevation-views of models in A-A direction with or without either
TMD or ATMD whether including masonry infill walls or not. ..................... 71
Figure 4-5. Desired actuator force (N) ..................................................................... 80
Figure 4-6. Datasheet of MTS 243 series actuator, taken it from (“Civil, Structural
and Architectural Engineering Testing Capabilities 4/11” 7AD) .................... 81
Figure 4-7. Bode diagram for the first floor of the structures .................................. 83
Figure 4-8. The first-floor relative displacements of the structures ......................... 85
Figure 4-9. Maximum inter-story drift ratio of the structures. ................................. 87
Figure 4-10. Total energy diagraphs for the model structures ................................. 88

xiii
Figure 5-1. Three-dimensional civil structure representation and its torsional mode:
(a) elevation view; (b) bird’s eye view ............................................................ 94
Figure 5-2. 3-D illustration of the three-story civil structure and the proposed
control system representation ......................................................................... 100
Figure 5-3. One story two-way eccentric building: (a) Building 3-D view; (b)
control system representation ......................................................................... 103
Figure 5-4. The simplified equivalent of the structure with the ICS ..................... 104
Figure 5-5. Structural design and analysis procedure of the structure with the ICS
........................................................................................................................ 114
Figure 5-6. The 9-story Benchmark buildings modified it from [31] and [32]: (a)
Plan view and column orientations; (b) Connection types of frames ............ 117
Figure 5-7. The nine-story Benchmark building: (a) Elevation-views; (b) simplified
equivalent system ........................................................................................... 118
Figure 5-8. A schematic representative of (a) the ICS and (b) TMDs at the top floor
of the Benchmark building ............................................................................. 121
Figure 5-9. Different placements of the x-bracing system in moment resisting
frames (MRFs): (a) in the plan view and (b) A-A elevation view of
Benchmark building for Case 1...................................................................... 122
Figure 5-10. X-bracing placement in the plan view of the Benchmark building for
(a) Case 2 and (b) Case 3 ............................................................................... 123

xiv
Figure 5-11. The N-S and E-W components of the saved real-life earthquake data:
(a) El Centro; (b) Loma Prieta; (c) Kocaeli earthquake ................................. 127
Figure 5-12. Top floor displacement transfer functions for the Benchmark building
and its application with cross frames, the TMDs and the ICS in the x-
translational direction (x9) .............................................................................. 130
Figure 5-13. Top floor displacement transfer functions for models in the y-
translational direction (y9) .............................................................................. 130
Figure 5-14. Top floor displacement transfer functions for xθ9-coupling direction
........................................................................................................................ 131
Figure 5-15. Top floor displacement transfer functions for yθ9-coupling direction
........................................................................................................................ 131
Figure 5-16. The peak response reduction percentage for the structures under El
Centro (El), Loma Prieta (LP) and Kocaeli (Koc) earthquakes ..................... 134
Figure 5-17. The RMS response reduction percentage for the structures under El
Centro (El), Loma Prieta (LP) and Kocaeli (Koc) earthquakes ..................... 134
Figure 5-18. Maximum inter-story drift ratio of the structures when subjected to
bidirectional ground excitations of El Centro ................................................ 135
Figure 5-19. Maximum inter-story drift ratio of the structures when subjected to
bidirectional ground excitations of Loma Prieta ............................................ 136
Figure 5-20. Maximum inter-story drift ratio of the structures when subjected to
bidirectional ground excitations of Kocaeli ................................................... 136

xv
Figure 5-21. The total energy of the bare Benchmark building when subjected to
bidirectional ground excitations of El Centro, 1940 ...................................... 138
Figure 5-22. The total energy of the Benchmark building with TMDs when
subjected to bidirectional ground excitations of El Centro, 1940 .................. 138
Figure 5-23. The total energy of the Benchmark building with ICS when subjected
to bidirectional ground excitations of El Centro, 1940 .................................. 139
Figure 5-24. The total energy of the Benchmark building with cross frames (CFs)
when subjected to bidirectional ground excitations of El Centro, 1940 ........ 139
Figure 5-25. The total energy of the bare Benchmark building when subjected to
bidirectional ground excitations of Loma Prieta, 1989 .................................. 140
Figure 5-26. The total energy of the Benchmark building with TMDs when
subjected to bidirectional ground excitations of Loma Prieta, 1989 .............. 140
Figure 5-27. The total energy of the Benchmark building with ICS when subjected
to bidirectional ground excitations of Loma Prieta, 1989 .............................. 141
Figure 5-28. The total energy of the Benchmark building with Cross Frames (CFs)
when subjected to bidirectional ground excitations of Loma Prieta, 1989 .... 141
Figure 5-29. The total energy of the bare Benchmark building when subjected to
bidirectional ground excitations of Kocaeli, 1999 ......................................... 142
Figure 5-30. The total energy of the Benchmark building with TMDs when
subjected to bidirectional ground excitations of Kocaeli, 1999 ..................... 142

xvi
Figure 5-31. The total energy of the Benchmark building with ICS when subjected
to bidirectional ground excitations of Kocaeli, 1999 ..................................... 143
Figure 5-32. The total energy of the Benchmark building with Cross Frames (CFs)
when subjected to bidirectional ground excitations of Kocaeli, 1999 ........... 143
Figure 6-1. Configurations of the active tuned mass dampers (ATMDs) in two
orthogonal direction ....................................................................................... 154
Figure 6-2. Configurations of the active integrated control system (AICS) with two
linear actuators in two orthogonal directions ................................................. 154

xvii
List of Tables
Table 4-1. Inter-story drift ration of the 3x3-bay 5-story model building, taken it
from (Akyurek 2014) ....................................................................................... 68
Table 4-2. Damage level at the first story columns for 3x3-bay 5-story model
building, taken it from (Akyurek 2014) ........................................................... 69
Table 4-3. Material and element properties of the structure .................................... 72
Table 4-4. The dynamic properties of the structure and TMDs ............................... 74
Table 4-5. The first five modal frequencies of the structures .................................. 82
Table 4-6. The response of the structures ................................................................ 86
Table 4-7. The total energy of the structures ........................................................... 89
Table 5-1. The first three fundamental frequencies of the main structure and design
properties of the TMDs and the ICS .............................................................. 116
Table 5-2. The structural components, dynamic and geometric properties of the 9-
story benchmark building ............................................................................... 120
Table 5-3. The Benchmark building structural components and steel sections used
in the braced frames ....................................................................................... 123
Table 5-4. Calculated eccentricities in the x- and y- directions for the bare
Benchmark building and its application with respect to Case 1, Case 2 and
Case 3 ............................................................................................................. 124

xviii
Table 5-5. The geometric property and the contributions of the used cross frame
systems into MRFs ......................................................................................... 124
Table 5-6. Peak response of the case structures under bidirectional loadings ....... 125
Table 5-7. The selected real-saved earthquakes characteristics ............................. 126
Table 5-8. The first five modal frequencies of the structures ................................ 128
Table 5-9. The peak and RMS displacement response of the Benchmark building
with the cross frames, TMDs and ICS applications ....................................... 132
Table 5-10. The total energy of the structures ....................................................... 146
Table 5-11. Performance evaluation of the structures ........................................... 147
Table 6-1. The first three fundamental frequencies of the main structure and design
properties of the TMDs and the ICS (previously given in Table 5-1) ........... 157
Table 6-2. The responses of the structure and its application with ATMDs and
AICS ............................................................................................................... 159
Table 6-3. Comparison the performance of the ATMDs to the AICS ................... 160

xix
Acknowledgements
First and always, I would like to start writing my thesis with the name of Allah
(K.S.A.) and I am grateful to Allah who created and gave this opportunity to me. I
also sincerely remember and bring salawats for Allah’s messenger, Muhammed
Mustafa (S.A.S.) and his companies and family.
I would like to trustily thank my advisor Dr. Suksawang for his help and mentorship
during my research. I also want to thank Dr. Go for his helpful lectures and
instructions. I have enjoyed and learned a lot from them. I sincerely thank my
committee members, Dr. Bleakley and Dr. Nguyen for serving in my dissertation
committee.
I want to thank my parents for always believing in and praying for me. I want to
thank my brother, Salih for his valuable advice and help. I must also thank my wife
Neslihan Zehra for her support and encouragement.
I would like to thank my colleagues and friends, especially Nasir Hariri, Yunus Egi
and Amir M. Sajjadi. I am grateful to have their help and friendship.
Finally, I would like to thank The Ministry of National Education of the Republic of
Turkey for the opportunity (scholarship) during my Ph.D. study in the United States
of America.

xx
Dedication
To my family, teachers and professors who helped me reach my dream

1
Chapter 1 Introduction
1.1: Overview of Structural Seismic Analysis
An earthquake is a sudden and destructive shaking of the ground, resulting from
released ground energy between the different layers of the earth. This released
energy, called earthquake ground motion, sometimes can be brutal and unmerciful
when the structures are not well-designed against a strong earthquake motion. It can
leave thousands of people dead, wounded and/or homeless. For this reason, civil
structures should be well-designed by taking the earthquake ground motion into
account in the seismic analysis.
The seismic analysis depends on two or three translational components of the
earthquake ground motion in terms of design, safety and performance assessment of
buildings. The rotational component of the ground motion might contribute
significantly to the response and damage of these structures. However, its effect is
undetermined because its intensity and frequency content are not measured by
accelerographs. Therefore, an unpredictable spatial distribution of load and the effect

2
of the rotational component of the ground motion are usually ignored in seismic
design practice (Moon 2012).
1.2: Motivation
In the 21st century with advanced technologies and developments in structural
design, buildings are taller and more flexible by using lighter materials and having
innovative structural systems. This trend causes buildings to become more
susceptible to dynamic loadings such as severe wind gusts and earthquakes,
especially for those having complex shapes where torsion becomes an issue. A
torsional sensitivity may lead to significant aerodynamic torsion loads and to
potentially significant eccentricity between the center of mass and the center of
rigidity, especially in dominant torsion modes, see Figure 1-1. Torsional motion
leads to excessive increase in lateral motions when dynamic loads excite the
buildings(Ross, El Damatty, and El Ansary 2015; FEMA 750 2009).
Figure 1-1. Three-dimensional civil structure representation and its torsional mode

3
The dynamic effect of an earthquake on a structure induces horizontal inertia forces
acting through the center of mass while these forces are resisted by the vertical
members through the center of rigidity. In many real-life structures, these opposing
forces are not coincident. The lack of coincidence between the centers of mass and
rigidity produces eccentricities, which cause an undesirable torsional response. The
term “lateral-torsional coupling effect (LTCE)” is used when the torsional response
is coupled with the lateral response (Moon 2012). Structures damaged by LTCE
under historical earthquake loading are illustrated in Figure 1-2a and Figure 1-2b.
(a)
4
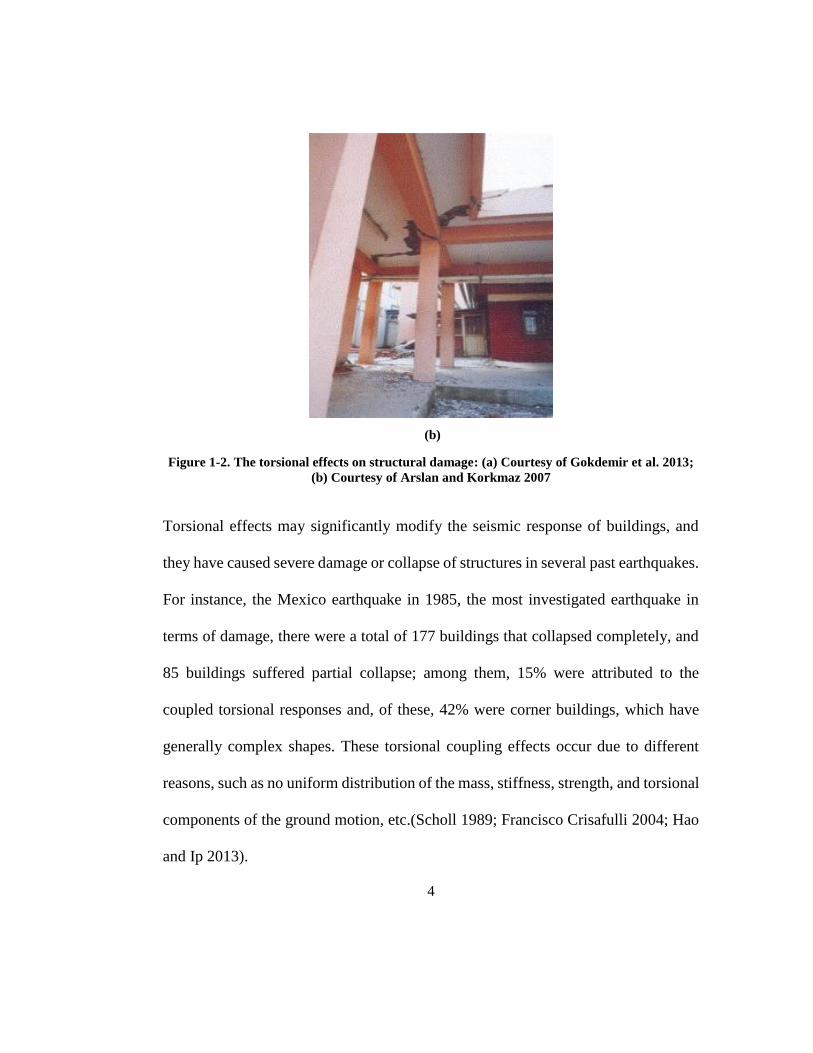
(b)
Figure 1-2. The torsional effects on structural damage: (a) Courtesy of Gokdemir et al. 2013;
(b) Courtesy of Arslan and Korkmaz 2007
Torsional effects may significantly modify the seismic response of buildings, and
they have caused severe damage or collapse of structures in several past earthquakes.
For instance, the Mexico earthquake in 1985, the most investigated earthquake in
terms of damage, there were a total of 177 buildings that collapsed completely, and
85 buildings suffered partial collapse; among them, 15% were attributed to the
coupled torsional responses and, of these, 42% were corner buildings, which have
generally complex shapes. These torsional coupling effects occur due to different
reasons, such as no uniform distribution of the mass, stiffness, strength, and torsional
components of the ground motion, etc.(Scholl 1989; Francisco Crisafulli 2004; Hao
and Ip 2013).
5
Many seismic design codes provide design parameters that buildings may experience
and undergo this torsional effect safely. However, even this consideration might not
be adequate for taking those design parameters into the design, because the
eccentricity is changeable and unpredictable, due to the indeterminate distribution of
mass/stiffness and torsional components of the dynamic load especially in high-rise
buildings, buildings with long spans, and buildings experiencing extreme dynamic
loads frequently. For this reason, a lot of control methods and mechanisms have been
developed to overcome these uncertainties and to enhance the performance and
safety of structures. In this research, various proposed control methods and systems
will be explored with the objective of recommending the best control system among
provided methods to suppress lateral and torsional vibrations of buildings.
Specifically, this research is going to address a new integrated control system (ICS)
and compare it with the best-recommended control system.
1.3: Research Objective and Research Tasks
The primary objective of this research is to mitigate structural failure in torsionally
irregular buildings (TIBs) under bi-directional seismic loads. To achieve this, an
integrated control system (ICS) will be proposed and employed on TIBs. It represents
the results of this exploratory study on the effectiveness of this system. The main
tasks of this research to accomplish the objective are:

6
Task 1: To mathematically model torsionally irregular buildings (TIBs).
Torsionally irregular buildings (TIBs) were mathematically formulated in
consideration of Torsional Coupling (TC) effect due to eccentricity between the
center of mass and stiffness. For the implementation purpose to test the effectiveness
of the ICS, a benchmark 9-story steel building, constructed for SAC project in
California, was picked and its structural details and material properties were also
provided in this task.
Task 2: To evaluate the Performance of Existing Seismic Control Systems for
TIBs.
Existing control systems to protect the structure against earthquake and strong wind
damages are: cross frames implementations, a single tuned mass damper (TMD) in
the x- or y-direction, and multi-tuned mass damper (MTMD) at the top floor of the
benchmark building.
Task 3: To develop an effective control system which passively and actively
reduces the lateral and torsional responses.
In this task, the new control system was investigated, which is not only effective in
horizontal directions but also effective in the torsional direction to suppress the
undesirable energy. The organization of this task was divided into two parts:
Firstly, the new ICS was proposed to see if it was effectively mitigating the
lateral and torsional effect in TIBs.
7
Second, the obtained results from the existing control systems were compared
with the ICS results to see the performance of the proposed control system
(ICS).
1.3: Research Organization
This dissertation focuses on the new control system configuration, which is not only
effective in lateral vibration control but also in torsional vibration control, called the
Integrated Control System (ICS), under selected bidirectional historical earthquake
ground motions for torsionally irregular buildings (TIBs). It is applied as a passive
(ICS) and active control system (AICS) respectively on TIBs for earthquake response
reduction. Theoretical studies were conducted to show that Passive and Active
Integrated Control Systems are comparable to conventional Passive and Active
Tuned Mass Dampers (TMDs or ATMDs) as a structural control strategy. This
section provides a description of the scopes for each chapter of this dissertation.
Chapter 2 is a literature review on the various types of structural control systems and
strategies to reduce the potential damage level and maximize the response reductions
on civil buildings when subjected to earthquake loadings. The structural control
systems can be categorized as passive, active, semi-active and hybrid control
strategies.
8
Chapter 3 provides the technical background necessary for this dissertation that
might be unfamiliar to researchers and engineers in civil engineering. First, a brief
literature review about the torsional irregularity and the definition of design
eccentricity in the seismic provision of ASCE 07-10 are given. Secondly, intensively
used terminology and definitions are also provided here. Thirdly, the principal and
optimum design procedure of a conventional TMD are explained. Furthermore, the
modern control theory is explained in order to perform the seismic analysis by state-
space modeling. In addition, it covers the full-state control methodology (Linear
Quadratic Regulator (LQR)) for an actively controlled structure. Finally, the
performance evaluation criteria and energy analysis are stated to test the proposed
control system performance as compared with other control systems.
Chapter 4 investigates the effectiveness of various control systems under
unidirectional earthquake loading without considering lateral torsional coupling
effects. The seismic response of reinforced concrete (RC) six-story building was
analyzed with the combinations of masonry infill-wall, a passive (TMD) and an
active tuned mass damper (ATMD). By comparing the results obtained from these
various control systems, the best control system was determined in terms of
performance and energy analysis.

9
Chapter 5 verifies the effectiveness of the new Integrated Control System (ICS),
which utilizes a new configuration of TMDs. The new control design approach was
applied to the two-way eccentric benchmark 9-story steel building. The performance
and effectiveness of the ICS were examined and compared with the Cross Frames
(CFs), Tuned Mass Dampers (TMDs) approach under bidirectional earthquakes
ground motions.
Chapter 6 extends the application of the integrated control system framework into an
active control strategy. First, two actuators, which are driven by the linear quadratic
regulator (LQR), are used to apply the control forces to the active TMDs and ICS
system in two directions. Secondly, to test the performance of the AICS, the final
design was applied to the Benchmark building subjected to bidirectional three
historical earthquakes and the numerical analysis was made. Finally, the seismic
performance was discussed by comparing it with the ATMDs.
Chapter 7 summarizes the research presented in this dissertation and provides
recommendations and future studies on the structural control system for seismic
protection of buildings.

10
Chapter 2 Literature Review
2.1: Control System
A comprehensive literature review is given in this section about the control systems,
which can be categorized into passive, active, semi-active and hybrid control
strategies. These have been studied by many researchers to protect structures against
various environmental dynamic loads such as blast, wind, and seismic loads, see
Figure 2-1.
Figure 2-1. Comprehensive view of control systems
2.1.1: Passive Control System
Passive control systems are external supplemental devices on a structure to dissipate
dynamic energy and to suppress the response of the structure under dynamic loads
without external power sources. These systems are widely used and easy to

11
implement on real-life structures (see Figure 2-2); it is simple to understand their
concepts\effectiveness, and they are accepted by the engineering community for
effectively mitigating severe dynamic load effects. Passive devices are reliable and
do not have the potential to destabilize the structure. However, using these systems
is not always a comprehensive method to follow because of its limitations, such as
not being adaptable to structural changes and not useful in a wide range of frequency
and loading conditions.
Figure 2-2. One of the real-life implementations of the pendulum tuned mass damper (Taipei
World Financial Center)

12
Many passive control mechanisms have been proposed and studied by researchers.
These systems can be divided into passive energy dissipaters, including metallic
yield, friction, and viscous dampers, tuned mass dampers, tuned liquid mass
dampers, and base isolation systems.
2.1.1.1: Passive Energy Dissipation System
Passive energy dissipation systems on a structure are generally divided into three
categories: displacement-dependent systems, velocity-dependent systems, and
others. Displacement-dependent systems include devices based on yielding of metal
(Andrew S. Whittaker et al. 1991; A. S. Whittaker, Constantinou, and Chrysostomou
2004) and friction (Pall et al. 1993; Bhaskararao and Jangid 2006).
Velocity-dependent systems include dampers consisting of viscoelastic solid
materials, dampers operating by deformation of viscoelastic fluids (e.g., viscous
shear walls), and dampers operating by forcing fluid through an orifice (e.g., viscous
fluid dampers) (M. C. Constantinou and Tsopelas 1993; Reinhorn and Constantinou
1995; A. S. Whittaker, Constantinou, and Chrysostomou 2004).
Other systems cannot be classified as either displacement-dependent or velocity-
dependent. They are dampers made of shape memory alloys, frictional-spring
assemblies with re-centering capabilities, and fluid restoring force/damping dampers

13
(Soong and Costantinou 1994; M. Constantinou, Soong, and Dargush 1998; A. S.
Whittaker, Constantinou, and Chrysostomou 2004).
2.1.1.2: Tuned Mass Damper
The most commonly and intensively used passive control strategy, thanks to its
simplicity and cost, is a tuned mass damper (TMD), which adds an external damping,
stiffness, and mass to the main structure during an earthquake or wind gust without
using any external energy sources (J. P. D. E. N. Hartog 1985; Villaverde 1994; C.
Li 2000a), see Figure 2-3. TMD might not be a comprehensive way to enhance the
security of the structure, because of some drawbacks to using a TMD. It can be solely
tuned to the fundamental frequency of the structure so that it is only effective in that
small range of frequency. It may have little or no effect on modes other than the one
that is used for its tuning process in the scenario of a dynamic load.
Figure 2-3. TMD implementation in the Millennium Bridge, London, England

14
The effectiveness of a conventional TMD is significantly affected by mistuning,
which can increase undesirable vibration on a structure, and not provide optimum
damping. Instead of using a single TMD, (Xu and Igusa 1992) first proposed to use
a multi-tuned mass damper (MTMD) to enhance the effectiveness. Additionally, the
MTMD has been studied by tuning to different natural frequencies, in order to
increase system stability at a wide range of frequencies (Yamaguchi and
Harnpornchai 1993; Igusa and Xu 1994; Masato Abé and Fujino 1994; Jangid 1995a;
M. Abé and Igusa 1995; Sadek et al. 1997; Park and Reed 2001; Shetty and
Krishnamoorthy 2011; Lavan 2017a; Gill et al. 2017a)
It is understood that implementing an MTMD on a structure is more effective than a
single TMD in terms of response reduction, effectiveness at a wide range of
frequencies, multi-mode response, and less sensitivity to mistuning in the design
process of a TMD. In most of these studies, the controlled structure was considered
to have a single degree of freedom (SDOF) system; however, a multi-story (real-life)
structure has six degrees of freedom, which are three translations along x, y, z-axes
and three rotations about these axes at each floor. For simplicity, translational
responses and rotational response about x, y directions are considered as effective
degrees of freedom (DOF), and the rest is ignored under dynamic loading.
Furthermore, it will experience lateral as well as torsional vibrations simultaneously
under even a translational excitation (x- and y-direction). Therefore, the simplified

15
SDOF system, which ignores the structural lateral-torsional coupling and TMD
effect on different modes, could overestimate the control effectiveness of TMD
(Shetty and Krishnamoorthy 2011; Jangid and Datta 1997). Hence, taking into
account the lateral-torsional coupling effect is necessary to consider in the design of
the controllers in scenarios in which torsional coupled modes are dominant.
Structures controlled by TMDs and MTMDs through consideration of the torsional
coupling effect, have been investigated by Jangid and Datta 1997; C. C. Lin, Ueng,
and Huang 2000; Singh, Singh, and Moreschi 2002; Pansare and Jangid 2003; Desu,
Deb, and Dutta 2006.
Jangid and Datta 1997; Pansare and Jangid 2003; Li and Qu 2006 have studied the
response control of two degrees of freedom (one translation and one rotation)
torsional systems by a set of MTMDs. C. C. Lin, Ueng, and Huang 2000 studied the
response reduction of a multi-story torsional building (two translations and one
rotation at each floor) system with one and two tuned mass dampers. Singh, Singh,
and Moreschi 2002 studied the response control of a multi-story tensional building
(with two translations and one rotation at each floor) system with four tuned mass
dampers, placed along two orthogonal directions in pairs.
16
Desu, Deb, and Dutta 2006 investigated on an arrangement of tuned mass dampers
called coupled tuned mass dampers (CTMDs), where a mass is connected by
translational springs and viscous dampers in an eccentric manner. They presented
comparative studies between CTMDs, conventional TMDs, and bi-directional TMDs
in terms of effectiveness and robustness in controlling coupled lateral and torsional
vibrations of asymmetric buildings.
Tse et al. 2007 conducted a study to demonstrate the suppression of the wind-induced
three-dimensional lateral-torsional motions on a wind-excited benchmark tall
building using a bi-directional tuned mass damper (TMD) incorporating two
magnetorheological dampers (MR). One damper was placed in each orthogonal
direction in order to perform as a semi-active control system, which means as a smart
tuned mass damper (STMD). The optimal control forces generated by the MR
dampers were driven by the linear quadratic regulator (LQR) to reduce the story
accelerations.
Ueng, Lin, and Wang 2008 proposed a new design procedure in torsionally coupled
3-D buildings to minimize the dynamic responses of structures subjected to bilateral
earthquake excitations (recorded at the 1979 El Centro earthquake), by incorporating
passive tuned mass dampers (PTMDs). They have considered some practical design
issues such as the optimal location for installation, movement direction, and numbers
of PTMDs. The PTMD optimal parameters for the tuning process are obtained by

17
minimizing the mean square displacement response ratio. Additionally, they have
tested the parametric planar position and the detuning effect of the PTMD to see if
they influence the response control effectiveness.
J. L. Lin, Tsai, and Yu 2010 studied the control of the structural response by using a
coupled tuned mass damper (CTMD) in one-way asymmetric-plan buildings. They
investigated respectively the design of CTMDs compared to TMDs, the physical
system transformation and the effectiveness of the CTMD, which is with and without
dampers, in reducing the vibrations of asymmetric-plan structures by comparing
three model structures.
J. L. Lin, Tsai, and Yu 2011 proposed bi-directional coupled tuned mass dampers
(BiCTMDs) for the seismic response control of two-way asymmetric-plan buildings
under bi-directional ground motions. The performance of the proposed BiCTMD was
examined by investigating the reductions of the amplitudes of the associated
frequency response functions for the elastic seismic response of two-way
asymmetric-plan buildings.
Rahman et al. 2017 proposed adaptive multiple-TMDs, distributed along with the
story height to control the seismic response of the structure. It proved its efficiency
by making seismic analysis in a 10-story building comparing this with a single tuned
18
mass damper and with multi-tuned mass dampers under real saved earthquake
excitations such as El-Centro, California, and North-Ridge Earthquakes.
He, Wang, and Xu 2017 proposed a new type of TMD with tuned mass blocks,
orthogonal poles, and torsional pendulums (TMDPP). The translational and torsional
motions are controlled by the movement of the mass blocks and the torsional
pendulums. According to the composition and the motion mechanism of the TMDPP,
the equation of motion for the total system considering the eccentric torsion effect is
derived. The damping capacity of the TMDPP is verified by the time history analysis
of an eccentric structure under multidimensional earthquake excitations. The
performance evaluation of the traditional TMD and the TMDPP is compared, and
the results show that the performance of TMDPP is superior to the traditional TMD.
2.1.1.3: Tuned Liquid Mass Damper
A tuned liquid damper (TLD) or a tuned liquid column damper (TLCD) is another
type of passive control system, and its application to civil structures was first
introduced by F Sakai, S Takaeda in 1989. In the composition of the TLD, the solid
mass is replaced by a liquid, usually water. The water might be in a tube with an
orifice in the horizontal segment or a tank with a gate in the middle and a slit in the
gate (Won, Pires, and Haroun 1996; Colwell and Basu 2009).

19
The design and control concept of a TLD is that the sloshing frequency of the TLD
is tuned to the frequency of a desired mode of the structure which needs to be
controlled. During dynamic excitation, the liquid will slosh against the walls of the
tank. This leads to a phase difference between the sloshing motion and inertial forces,
which can absorb some energy from the main structure, thus reducing the structural
motion. Using tuned liquid dampers (TLDs) has many advantages including low
installation and maintenance costs, an easily adjustable tuning frequency,
effectiveness in a wide range of excitation amplitudes, and applicability for existing
structures; however, space requirements can be high in order to achieve an adequate
mass of water (Kareem 1990; Koh, Mahatma, and Wang 1995; Yalla, Kareem, and
Kantor 2001; H. Kim and Adeli 2005; Fisco and Adeli 2011; Gutierrez Soto and
Adeli 2013; Ross, El Damatty, and El Ansary 2015). TLD systems have been
successfully applied in a 48-story building in Vancouver, Canada and in a 57-story
building, Comcast Center in Philadelphia, which is the largest passive TLD system,
see Figure 2-4.

20
Figure 2-4. TLD application on Comcast center, Pennsylvania, USA
A TLD system can also be effectively used to suppress the torsional effect for an
eccentric building, in which there is no coincidence between the center of mass and
rigidity, respectively (CM) and (CR). Implementation of TMDs or MTMDs on a
structure can substantially reduce the torsional behavior by using solid mass/masses,
placed away from the CR. Owing to the phase difference between the mass and the
structure, the mass thereby dissipates some of the motion of the building (Singh,
Singh, and Moreschi 2002; Tse et al. 2007; Xu and Igusa 1992; Ueng, Lin, and Wang
2008). A TLD behaves similarly to a TMD by means of exerting an inertial force
that opposes the motion; therefore, the TLD system (a TLD, an MTLD, or a
combination of a TLD and a TMD) can also reduce torsional motions (Koh,
21
Mahatma, and Wang 1995; H. N. Li, Jia, and Wang 2004; Aaron Samuel Brown
2000; Q. S. Li et al. 2007; M. Rahman 2008).
2.1.1.4: Base Isolation
Base isolation is one of the most crucial passive control concepts to protect structures
against the strong ground motion, which can be understood as separating or
decoupling the structure foundation from the ground. In other words, the concept of
seismic base isolation is to minimize the relation between the structure and
potentially dangerous ground motion, especially within the frequency range where
the building is most affected by inserting low stiffness devices such as lead-rubber
bearings, friction-pendulum bearings, or high damping rubber bearings between the
structure and the ground (J. M. Kelly, Leitmann, and Soldatos 1987; James Marshall
Kelly 1993; James M. Kelly 1999), see Figure 2-5.

22
Figure 2-5. The application of base isolation, Sabiha Gokcen Airport in Turkey,
The significant contribution of using base isolation as a controller in performance
assessment of a structure is to reduce inter-story drifts and absolute accelerations to
protect the structure from severe damage by absorbing earthquake energy with these
devices. However, there can be so much displacement occurring at the base level that
the passive base isolation system cannot handle it securely. Thus, the passive base
isolation is preferably not used alone: instead, it is used with a combination of
different passive, active or semi-active devices, meaning hybrid control, which can
23
control the base relative displacement in an acceptable range (Inaudi et al. 1992;
James M. Kelly 1999).
2.1.2: Active Control System
Passive control strategies have some limitations and restrictions such as not being
effective at a wide range of frequencies (only the effective desired mode) and loading
conditions. If the system is strengthened with an actuator which provides external
power, the system becomes more effective and resistant to strong ground motions or
severe wind gusts. However, putting vast amounts of external actuator energy on the
system is not always possible. Even when it is possible, it can destabilize the structure
in contrast to a passive controller. Therefore, it needs to be optimized for the desired
design perspective and the optimum force needs to be driven by control methods
such as feedback control algorithms, Eigen-structure assignment, a proportional
integral derivative (PID) controller, fuzzy logic controller, a sliding mode controller,
an adaptive controller, a Linear Quadratic Regulator (LQR) and a Linear Quadratic
Gaussian (H2/LQG), incorporating a Kalman estimator and an LQR.
All these control methodologies have been successfully applied to civil structures to
generate the optimal force from the actuators under severe dynamic loading by many
engineers and researchers (T. T. Soong 1988). The linear quadratic regulator (LQR)
control has been used to actively control the response of civil structures by (Chang
and Soong 1980; Shafieezadeh 2008a; Guclu and Yazici 2008; Jiang, Wei, and Guo

24
2010; Y. Kim et al. 2013). A Linear Quadratic Gaussian (H2/LQG) control has been
applied to a structure equipped with active devices (Reinhorn et al. 1989; Dyke, SJ
and Spencer Jr 1996; Ohtori et al. 2004; Bitaraf 2011; Nigdeli and Boduroǧlu 2013;
Asai 2014; Asai and Spencer 2015). A Hinf control was used to deal with mass and
stiffness uncertainties to reduce the response of a building with an active mass
damper (AMD) by Huo et al. 2008 and Bitaraf, 2011 has studied the effectiveness
of compensation algorithms for an AMD. Dyke, SJ and Spencer Jr, in 1996,
examined an AMD analytically and experimentally by using acceleration feedback
control, to suppress the response of slender tall buildings.
Most of the passive controller systems can be controlled as active systems by adding
an actuator to the system and controlling the actuators with a set of control
algorithms. An Active Tuned Mass Damper (ATMD) was first introduced by
Nishimura et al., 1992. The results they obtained are compared with a passive TMD.
The comparison showed that active controlled TMDs are much more effective by
getting 40–50% or more response reduction. Since then, many researchers continue
to study active control systems with different control algorithms like fuzzy logic,
LQR and LQG controllers (Samali and Al-Dawod 2003; H. Cao and Li 2004; Amini,
Hazaveh, and Rad 2013). Abe and Masato, in 1998, proposed an Active Tuned
Liquid Damper (ATLD) with Magnetic Fluid as an alternative active device. The
performance of the proposed active TLD was verified experimentally using a two-
25
story building model. An Active TLD was found to give a higher reduction of
vibration and to be less sensitive to the error of tuning. Active tendon control (ATC)
was studied by (Reinhorn et al. 1989; Nigdeli and Boduroǧlu 2013).
There are many real-life implementations of these controller systems and some
typical examples of practical applications: The Kyobashi Seiwa building was the first
building actively controlled by an AMD (Sakamoto et al. 1994), see Figure 2-6. The
Shanghai World Financial Center Tower (1997) implemented an ATMD in China
(X. L. Lu and Jiang 2011; X. Lu et al. 2014). The Sendagaya INTES Building (1992),
Applause Tower Building (1994), Riverside Sumida Building (1994), and the
HERBIS Osaka Building (1997) are some other examples with the application of
active control systems in Japan (Nishitani and Inoue 2001).

26
Figure 2-6. The first active control system applied (Active Mass Damper), Kyobashi Center
Building, Tokyo in Japan, Courtesy of Takehiko
2.1.3: Semi-Active Control System
During severe dynamic loading, an active control strategy is one of the most effective
methods to suppress undesirable responses and to enhance the safety of structures by
using significant amounts of actuator energy, provided by an external source, which
is generally electricity. However, providing a huge amount of external actuator
energy to the system is not always possible, especially in the case of strong
earthquakes and severe winds, which might cause outages of power and electricity.
Thus, for an alternative method to active control, semi-active control has been

27
proposed which needs less external power to operate (battery power can be enough)
and which can have either the same or better performance in achieving the design
goals as compared to active control (Feng and Shinozuka 1990; McClamroch and
Gavin 1995; Housner et al. 1997).
Semi-active controls originate from both a passive control system which dissipates
energy without needing external energy and battery power which modifies the
mechanical properties (e.g., stiffness and damping) of the devices and develops the
control forces opposite to the motion of the structure (Luca and Pastia 2009; Bitaraf
2011; Asai 2014). There are many semi-active control devices which are successfully
used in real life such as variable stiffness devices, controllable friction dampers,
controllable fluid dampers, semi-active tuned mass dampers, semi-active tuned
liquid dampers, variable orifice tuned column liquid dampers, electrorheological
dampers, and magnetorheological dampers. Many researchers have studied the
effectiveness of semi-active control by conducting numerous numerical simulations
and experiments (Dyke and Spencer 1997; Symans and Constantinou 1999; B. F.
Spencer and Nagarajaiah 2003; N Luo et al. 2003; Ningsu Luo et al. 2006; Erkus and
Johnson 2007; Zapateiro, Luo, and Karimi 2008; Zapateiro et al. 2009; Weber 2014;
Behrooz, Wang, and Gordaninejad 2014; Oliveira et al. 2018).

28
2.1.4: Hybrid Control System
A hybrid control system primarily consists of a combination of two or more passive,
active, or semi-active devices, which can cooperate to take advantage of their
potential to enhance the overall reliability and efficiency of the controlled structure.
The reasons for using a hybrid control system are that it can alleviate some of the
inherent restrictions and limitations when each system is employed alone. Thus, a
more robust control system may be achievable in order to ensure the safety and
performance of structures (T. T. Soong and Reinhorn 1993). The effectiveness of a
hybrid control system has been illustrated in some of the highlighted research as
follows: (J. M. Kelly, Leitmann, and Soldatos 1987; Inaudi et al. 1992; Symans and
Constantinou 1999; B. Spencer and Soong 1999; Mitchell et al. 2013; Friedman et
al. 2015; Huang and Loh 2017).
2.2: Summary
The references have been cited on the various types of structural control systems and
strategies to reduce the potential damage level and maximize the response reductions
on civil buildings when subjected to earthquake loadings are given in this chapter.
Overall, this chapter gives a comprehensive literature which covers overall control
systems for civil structures, can be controlled by passive, active or semi-active
control strategies.

29
Much attention has been paid so far especially the last couple of two decades by
many engineers and researchers to improve structural control technologies in civil
buildings. However, further investigations and developments are still necessary to
improve the efficiency and robustness the control systems.

30
Chapter 3 Methodology and Terminology
In this chapter, first, a brief literature review about the torsional irregularity and the
definition of design eccentricity in the seismic provision of ASCE 07-10 are given.
Secondly, extensively used terminology and definitions are provided. Thirdly, the
principal and design procedure of a translational TMD, which is applied to a single
degree of freedom (SDOF), are explained, and the optimum TMD design formulas
are provided in subsection 3.3. Furthermore, modern control theory is explained in
order to perform the seismic analysis for an SDOF or multi-degrees of freedom
(MDOF) system by state-space modeling. In addition to performing seismic analysis,
it covers the full-state control methodology (Linear Quadratic Regulator (LQR)) for
actively controlled structure. Finally, the performance evaluation criteria and energy
analysis are stated at the final stage of this chapter to see whether the proposed
control system has better performance or not as compared with other control systems.
3.1: Torsional Irregularity
Torsion irregularity is one of the primary failure reasons in buildings during a strong
dynamic excitation due to earthquakes or wind gusts. Such irregularity does not only
have devastating effects in the torsional direction but also leads to excessive
destructive effects in the lateral directions. Therefore, ignoring the torsional

31
irregularity in the seismic design analysis can cause unexpected damages and losses.
To enhance the safety and performance of the buildings, most of the current seismic
provision deals with this irregularity with two main ways. The first is computing
torsional moment at each floor by using equations provided in various current
seismic code provisions. After they are applied on each floor, the seismic analysis
will be performed. The second is shifting the center of mass (CM) or stiffness (CS)
to eliminate the eccentricity by putting additional masses, adding structural
components such as braced frame systems or applying control systems on the
structures, which can be passive or active. In this research, a new Integrated Control
System (ICS) is proposed.
3.1.1: A Brief Literature
Torsional irregularity has been intensively studied and been continuously updated
with new recoveries and recommendations. For two-way eccentric structures under
unidirectional ground motions, it was found that torsional coupling effects on a single
story two-way eccentric model can decrease the base shear, overturning moment, and
the top floor lateral displacement, but increase in the base torque. Also, if the
eccentricity is increased in a direction perpendicular to the ground motion, it leads to
an increase in the torsional moment (torque). However, if an increase of eccentricity
in the direction of the ground motion, it reduces the torsional moment. It was also
observed that the critical factor for the torsional coupling effect is the ratio of
32
torsional frequency to lateral frequency when it is between 0.75 and 1.25 for small
eccentric buildings, but not for large eccentric buildings (Kan and Chopra 1977;
Chandler and Hutchinson 1986). For a multi-story of the building, torsional coupling
effects were examined, and it is understood that a one-story building is more
convenient to compute the torsional effects (Hejal and Chopra 1989; De Stefano and
Pintucchi 2008).
The bi-directional ground motions can increase the torsional coupling effects as
compared to the unidirectional ground motion. Analyzing the unidirectional ground
motion is not adequate to estimate the torsional response. This is because the
parameters governing the torsional response significantly change the stiffness, the
radius of gyration, and the location of the center of rigidity under bidirectional
excitation (Hernández and López 2000; Damjan and Fajfar 2005; Magliulo and
Ramasco 2007; Cimellaro, Giovine, and Lopez-Garcia 2014). In the literature, there
is still a significant lack of experimental studies verifying the torsional coupling
effects.
Most of the current seismic design provisions require the consideration of torsional
effects, even if there is no inherently eccentricity found in the structure. Some
eccentricity is considered for each direction to enhance the safety of the structures
by adopting design eccentricities, which are inherent and accidental eccentricities.
Inherent (geometric) eccentricity is simply defined as the absolute difference

33
between CM and CS of a structure in the plan, while the accidental eccentricity
generally accounts for factors such as a difference between the actual and computed-
design eccentricities (Crisafulli, Reboredo, and Torrisi 2004; Basu, Whittaker, and
Constantinou 2012). Many seismic design codes also provide design parameters that
buildings may experience and undergo this torsional effect securely with an
assumption of accidental eccentricity. However, even this consideration might not
be adequate to take those design parameters into the design, because accidental
eccentricity is changeable and unpredictable, due to the structural uncertainty (the
distribution of mass/stiffness) and ground motion uncertainty (rocking and spatial).
Quite a few studies on ground motion uncertainty have been conducted by many
researchers (Basu, Constantinou, and Whittaker 2014; Basu and Giri 2015; Y. Cao
et al. 2017). The structural uncertainty has been studied by (Demir 2010; Özmen,
Girgin, and Durgun 2014).
In conclusion, accidental eccentricity occurs due to some uncertainties which may
be structural uncertainty or ground motion uncertainty. Many code provisions
provide an assumption-based solution considering the accidental eccentricity as a
percentage (5% or 10%) of the building dimension perpendicular to the earthquake
direction; however, even this consideration might not be adequate to taking those
eccentricity parameters into the design. For this reason, the Integrated Controlled

34
System (ICS) is proposed to improve the safety and performance of structure against
the uncertainties which may cause torsional coupling effects.
3.1.2: Torsional Design Code (ASCE 07-10)
There are two types of analyses to account for accidental eccentricity, which are a
dynamic and static analysis that is preferred in section 12.8 of ASCE\SEI 7-10
(American Society of Civil Engineers Standard 7). Static analysis, which is easy and
practical as compared to the time history analysis, employs the equivalent lateral
force (ELF) procedure that provides ways to compute equivalent shear forces at the
level of each floor and total shear force at the base without requiring the computing
of the center of stiffness (CS). There is, therefore, an assumption-based solution to
account for accidental eccentricity, which is addressed by shifting the center of mass
(CM) at each floor from its actual location by a distance equal to 5% of the dimension
of the structure perpendicular to the ground excitation direction (ASCE 7-10 Section
12.8.4.2). The torsional moment, obtained due to shifting CM, is applied at CM. The
torsional irregularity is defined by considering three cases of ASCE 7-10 as follows:
If 𝑨𝒙 is less than 1, torsional irregularity does not exist and 𝑨𝒙 is equal to 1.
If 𝑨𝒙 is between 1 and 3, then it exists and the torsional amplification factor,
𝑨𝒙, is defined as

35
Figure 3-1. Torsional irregularity definition for the illustration of extreme and average
displacement
1.0 ≤ 𝐴𝑥 = (
𝛿𝑚𝑎𝑥1.2𝛿𝑎𝑣𝑔
)
2
≤ 3.0 (1)
in which, 𝜹𝒎𝒂𝒙 is the maximum displacement and 𝜹𝒂𝒗𝒈 is the average of the
displacements at the extreme points of the structure at level i+1th floor.
If 𝑨𝒙 is bigger than 3, torsional irregularity exists extremely, and 𝑨𝒙 is equal
to 3.
The design eccentricities, 𝒆𝒅𝟏 𝑎𝑛𝑑 𝒆𝒅𝟐 as seen in Figure 3-2a, are respectively
computed as follows:
𝑒𝑑1 = 1.0𝑒𝑛 + 0.05𝐷𝐴𝑥 (2)
36
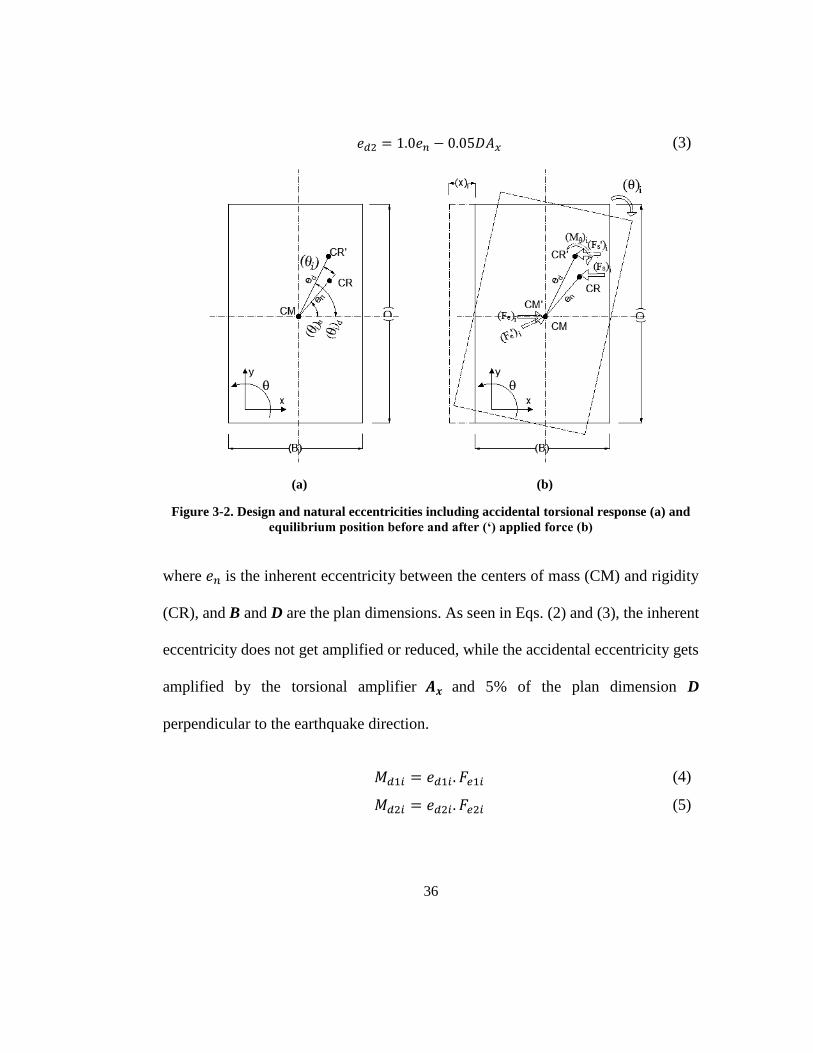
𝑒𝑑2 = 1.0𝑒𝑛 − 0.05𝐷𝐴𝑥 (3)
(a) (b)
Figure 3-2. Design and natural eccentricities including accidental torsional response (a) and
equilibrium position before and after (‘) applied force (b)
where 𝑒𝑛 is the inherent eccentricity between the centers of mass (CM) and rigidity
(CR), and B and D are the plan dimensions. As seen in Eqs. (2) and (3), the inherent
eccentricity does not get amplified or reduced, while the accidental eccentricity gets
amplified by the torsional amplifier 𝑨𝒙 and 5% of the plan dimension D
perpendicular to the earthquake direction.
𝑀𝑑1𝑖 = 𝑒𝑑1𝑖. 𝐹𝑒1𝑖 (4)
𝑀𝑑2𝑖 = 𝑒𝑑2𝑖. 𝐹𝑒2𝑖 (5)

37
The design torsional moments, 𝑴𝒅𝟏𝒊 and 𝑴𝒅𝟐𝒊, at a given i story are defined as the
moment resulting from inherent, 𝒆𝒏 and accidental, 𝒆𝒂𝒄 eccentricities times the
design lateral forces at the levels, see Eqs. (4) and (5). The accidental torsional
moment is determined by shifting the mass a distance equal to multiplication by the
torsional amplifier, 𝑨𝒙, and 5% of the plan dimension, D. Shifting the center of mass
is widely accepted by the engineering community to account for accidental torsion
in both static and dynamic analysis. However, the dynamic characteristics of a
building change with this shift. The validation of the method to evaluate the torsional
effect on the analyses still needs to be reviewed. Instead of shifting the center of
mass, determining the accidental eccentricity analytically would be a better and
reasonable method to ascertain the torsional effect without changing the dynamic
characters of a building.
3.2: Definitions and Terminology
In this research, the the center of mass (CM), center of stiffness (CS), and eccentricity
are used to describe the torsional response for Torsionally Irregular Buildings (TIBs)
when subjected to an earthquake ground motion.
3.2.1: Lateral-Torsional Coupling Effect
The dynamic effect of an earthquake on a structure induces horizontal inertia forces
acting through the center of mass while these forces are resisted by the vertical lateral

38
load resisting members through the center of rigidity. In many real-life structures,
these reverse forces are not coincident. The lack of coincidence between the centers
of mass and rigidity produces eccentricities causes an undesirable torsional response.
The term “lateral-torsional coupling effect (LTCE)” is used when the torsional
response is coupled with the lateral response (Moon 2012).
3.2.2: Center of Mass
When an earthquake dynamic load is acting on a structure, the center of mass (CM)
can be defined as the point which the earthquake-induced load is concentrated on.
The locations of CM with respect to time t can be expressed in the x- and y-directions
as follow:
𝑥𝑐𝑚(𝑡) =
∑𝑚𝑖𝑥𝑖(𝑡)
∑𝑚𝑖 (6)
𝑦𝑐𝑚(𝑡) =
∑𝑚𝑖𝑦𝑖(𝑡)
∑𝑚𝑖 (7)
Where
𝑚𝑖 is the i-th lumped mass,
𝑥𝑖(𝑡) and 𝑦𝑖(𝑡) are locations for corresponding mass 𝑚𝑖 in the x- and y- directions.
When the floor acts as a rigid diaphragm which leads to rigid body motions
(translational and rotational motions), the CM does not differ within its plan in the

39
elastic or inelastic ranges. However, if it is assumed as a semi-rigid floor, which can
be a more realistic representation, there is only slightly different as compared to rigid
diaphragm because the floor stiffness is significantly higher than the corresponding
lateral load-resisting members. For simplicity, the floors are, therefore, defined as a
rigid diaphragm in the seismic analysis.
3.2.3: Center of Stiffness
When an earthquake dynamic load is acting on a structure, the center of stiffness
(CS) can be determined as the location where lateral load-resisting members are
resisting against this force. The locations of the CS in the x- and y-directions can be
calculated with respect to time t as seen below:
𝑥𝑐𝑠(𝑡) =
∑𝑘𝑦𝑖(𝑡)𝑥𝑖(𝑡)
∑ 𝑘𝑦𝑖(𝑡) (8)
𝑦𝑐𝑠(𝑡) =
∑𝑘𝑥𝑖(𝑡)𝑦𝑖(𝑡)
∑𝑘𝑥𝑖(𝑡) (9)
Where
𝑘𝑥𝑖(𝑡) and 𝑘𝑦𝑖(𝑡) are lateral stiffnesses in the x and y directions for the i-th lateral
load-resisting member
𝑥𝑖(𝑡) and 𝑦𝑖(𝑡) are x and y-locations of the i-th lateral load-resisting member over
time.

40
As shown in Eqs. (8) and (9), the location and lateral loading capacity (stiffness) of
each lateral load-resisting member is required to find the center of stiffness.
3.2.4: Eccentricity
Eccentricity is defined as the distance between CM and CS. The eccentricities in the
x- and y-directions can be formulated from the equations below:
𝑒𝑥(𝑡) = 𝑥𝑐𝑠(𝑡) − 𝑥𝑐𝑚(𝑡) (10)
𝑒𝑦(𝑡) = 𝑦𝑐𝑠(𝑡) − 𝑦𝑐𝑚(𝑡) (11)
Where
𝑥𝑐𝑠(𝑡) and 𝑦𝑐𝑠(𝑡) are the x- and y-locations of the center of stiffness,
𝑥𝑐𝑚(𝑡) and 𝑦𝑐𝑚(𝑡) are the x- and y-locations of the center of mass with repect to time
t.
Absolute eccentricity (|𝑒(𝑡)| ) can be defined as the absolute distance between the
centers of mass and stiffness, see equation below.
|𝑒(𝑡)| = √(𝑒𝑥(𝑡))
2+ (𝑒𝑦(𝑡))
2 (12)
Where
𝑒𝑥(𝑡) is the eccentricity in the x-direction
𝑒𝑦(𝑡) is the eccentricity in the y-direction with respect to time.

41
3.3: Additional Bracing Frame System
Adding the bracing systems into structure frames is a simple and effective way to
enhance the safety especially for torsionally irregular building (TIB) because it
increases the lateral and torsional load capacity. If the structure is steel, the bracing
system can be v- or x-bracing frame system (Emrah Erduran and Ryan 2010). If it is
a concrete structure, the masonry infill walls function as bracing (Akyurek, Tekeli,
and Demir 2018).
3.3.1: Infill wall into Reinforced Concrete Buildings
The infill wall can be categorized as a passive control system since it acts as a passive
energy dissipater (PED). In many reinforced concrete (RC) buildings, the infill wall
is mostly ignored in structural analysis and widely used for architectural design
purpose for dividing the areas of residential reinforced concrete buildings. However,
it does also have a significant effect on seismic analysis, particularly its impact on
the period, the lateral load capacity, and the total dissipated energy of the building
(Akyurek, Tekeli, and Demir 2018). In this research, the infill wall is employed to
control undesirable lateral vibration under a real saved earthquake ground motion
(N-S component of El Centro, 1940).

42
3.3.1.1: Theory of the Equivalent Compression Strut
The stiffness contribution of the infill wall is considered by modeling it as an
equivalent compression strut. It is assumed that it only works under compression in-
plane direction and cannot handle any loads under tension. Additionally, it is also
assumed that the infill wall does not have deformation capacity when it is laterally
loaded out-of-plane. All analyses are performed in the elastic range.
Figure 3-3. The equivalent diagonal strut for infill wall representation (FEMA strut model)
In Figure 3-3, Ø is the angle between the height and length of the masonry wall and
the thickness of the wall (twall) is 120mm. Hwall, Hk and Lwall, Lk are respectively the
height and length of the equivalent compression strut and frame. The diagonal length
of the equivalent compression strut is defined as rwall, the width of the strut is awall
(Federal Emergency Management Agency (FEMA) 2000), which is given as:

43
𝑎𝑤𝑎𝑙𝑙 = 0.175 (𝜆𝑤𝑎𝑙𝑙 𝐻𝑘)
−0.4 ∗ 𝑟𝑤𝑎𝑙𝑙 (13)
where, 𝜆𝑤𝑎𝑙𝑙 = [
𝐸𝑤𝑎𝑙𝑙 𝑡𝑤𝑎𝑙𝑙 𝑠𝑖𝑛 (2Ø)
4 𝐸𝑐 𝐼𝑐 𝐻𝑤𝑎𝑙𝑙]
1
4
(14)
The diagonal stiffness contribution of the infill wall can be calculated by using Eq.
(15). (Dolšek and Fajfar 2008) shown below as:
𝑘𝑤𝑎𝑙𝑙 =
𝐺𝑤𝑎𝑙𝑙 𝐿𝑤𝑎𝑙𝑙𝑡𝑤𝑎𝑙𝑙𝐻𝑤𝑎𝑙𝑙
(15)
where 𝑮𝒘𝒂𝒍𝒍 is the shear modulus of the infill wall and the other terms are as
previously defined.
3.3.2: Cross Bracing Frames in Steel Buildings
Cross frames behave as the primary members to resist the twist of the structures such
as steel buildings and bridges when they are integrated into the load carrying systems.
In addition, cross frames into moment-resisting-frames (MRFs) of a steel structure
can significantly improve the safety and stability of the structure by increasing lateral
and torsional load capacity. The effectiveness of the cross frame can be controlled
and improved when the cross frame must satisfy the design requirements (Helwig,
Engelhardt, and Frank 2012). In this research, cross frames are employed to control
undesirable lateral and torsional vibration under selected real saved earthquake
ground motions.

44
3.3.2.1: Theory of the Equivalent Compression Strut
When calculating the torsional stiffness of the cross frame, an elastic truss analysis
is often employed (Yura 2001). As previously stated, for a tension-only system, the
contribution of the compression diagonal is ignored, and the single diagonal model
shown in Figure 3-4 is analyzed.
Figure 3-4. Cross frame design in compression
where Ø is the angle between the height and length of the cross frame member. Hbr,
Hk and Lbr, Lk are respectively the height and length of the equivalent compression
strut and frame. The diagonal length of the cross frame is defined as rbr in
compression, the width of the strut is abr .
To determine the diagonal and rotational (according to Yura (2001)) stiffness of the
cross frame are respectively as:

45
𝑘𝑏𝑟 =
𝐴𝑏𝑟𝐸 sin2(Ø)
𝐿𝑏𝑟 (16)
𝛽𝑏𝑟 =
𝐸𝐻𝑏𝑟2𝐿𝑏𝑟
2
2𝑟𝑏𝑟3
𝐴𝑐+𝐿𝑏𝑟
𝐴ℎ
(17)
where βbr is the torsional stiffness of the cross frame considering only the axial
stiffness of the cross frame members, E is the modulus of elasticity (29000 ksi), Ac
is the area of the diagonal member, and Ah is the area of each strut.
3.4: Control System
In the current research to protect Torsional Irregular Buildings (TIBs) against
dynamic environmental loadings such as earthquakes or winds, significant attention
has been paid to the torsional response control by one or a set of TMDs. The
improvements are overall achieved using several traditional TMDs or the
optimization of the TMDs placed in either the same or two orthogonal directions. For
these reasons, the principal and design of TMD and its optimized dynamic properties
are explained in detail in this section.
3.4.1: Principal and Design of a Traditional TMD
Tuned mass damper (TMD) is a passive energy dissipating device which adds
external damping, stiffness, and mass to the main structure to reduce undesirable
vibrations, see Figure 3-5.

46
Figure 3-5. A schematic view of TMD attached to SDOF
Where m, k, and c are respectively mass stiffness and damping constant of an SDOF
structure. A TMD system with an additional mass, stiffness and damping
components (md, kd, and cd) are attached to the main structure, and this system is
consists of two degrees of freedom system which is similar to the Den Hartog’s
model with the exception of the structure damping (i.e., c=0) equal zero. When this
system is exposed to dynamic forces F(t) induced on the structure, and the equation
of motion for the two masses (m see Eq. (18), and md see Eq. (19)) can be
mathematically expressed by the following differential equations:

47
𝑚�� + 𝑐�� + 𝑘𝑥 − 𝑐𝑑(��𝑑 − ��) − 𝑘𝑑(𝑥𝑑 − 𝑥) = 𝐹(𝑡) (18)
𝑚𝑑��𝑑 + 𝑐𝑑(��𝑑 − ��) + 𝑘𝑑(𝑥𝑑 − 𝑥) = 0 (19)
Where 𝒙, ��, and �� and 𝒙𝒅, ��𝒅, and ��𝒅 are the structurel responses (displacement,
velocity and acceleration) for the SDOF and TMD system. The equations above can
be written in a matrix for the structure subjected to a hormonic load as follow:
[𝑚 00 𝑚𝑑
] {����𝑑} + [
𝑐 + 𝑐𝑑 −𝑐𝑑−𝑐𝑑 𝑐𝑑
] {����𝑑} + [
𝑘 + 𝑘𝑑 −𝑘𝑑−𝑘𝑑 𝑘𝑑
] {𝑥𝑥𝑑}
= {𝐹0𝑒𝑖𝜔𝑡
0}
(20)
Where, 𝑭(𝒕) is eqaul to 𝐹0𝑒𝑖𝜔𝑡 . 𝑭𝟎 and 𝝎 are the initial force constant and the
frequency of the applied harmonic load with time t. The solution can be obtained
using the complex form when the displacements velocities and acceleretations are
written in the harmonic functions as follow:
{𝑥(𝑡)𝑥𝑑(𝑡)
} = {𝑥𝑥𝑑} 𝑒𝑖𝜔𝑡
{��(𝑡)��𝑑(𝑡)
} = 𝑖𝜔 {𝑥𝑥𝑑} 𝑒𝑖𝜔𝑡
{��(𝑡)��𝑑(𝑡)
} = −𝜔2 {𝑥𝑥𝑑} 𝑒𝑖𝜔𝑡
(21)
Putting Eq. (21) into Eq (20) yields
−𝜔2 [𝑚 00 𝑚𝑑
] {𝑥𝑥𝑑} 𝑒𝑖𝜔𝑡 + 𝑖𝜔 [
𝑐 + 𝑐𝑑 −𝑐𝑑−𝑐𝑑 𝑐𝑑
] {𝑥𝑥𝑑} 𝑒𝑖𝜔𝑡
+ [𝑘 + 𝑘𝑑 −𝑘𝑑−𝑘𝑑 𝑘𝑑
] {𝑥𝑥𝑑} 𝑒𝑖𝜔𝑡 = {𝐹0𝑒
𝑖𝜔𝑡
0}
(22)
so after cancelations and rearranging, yields
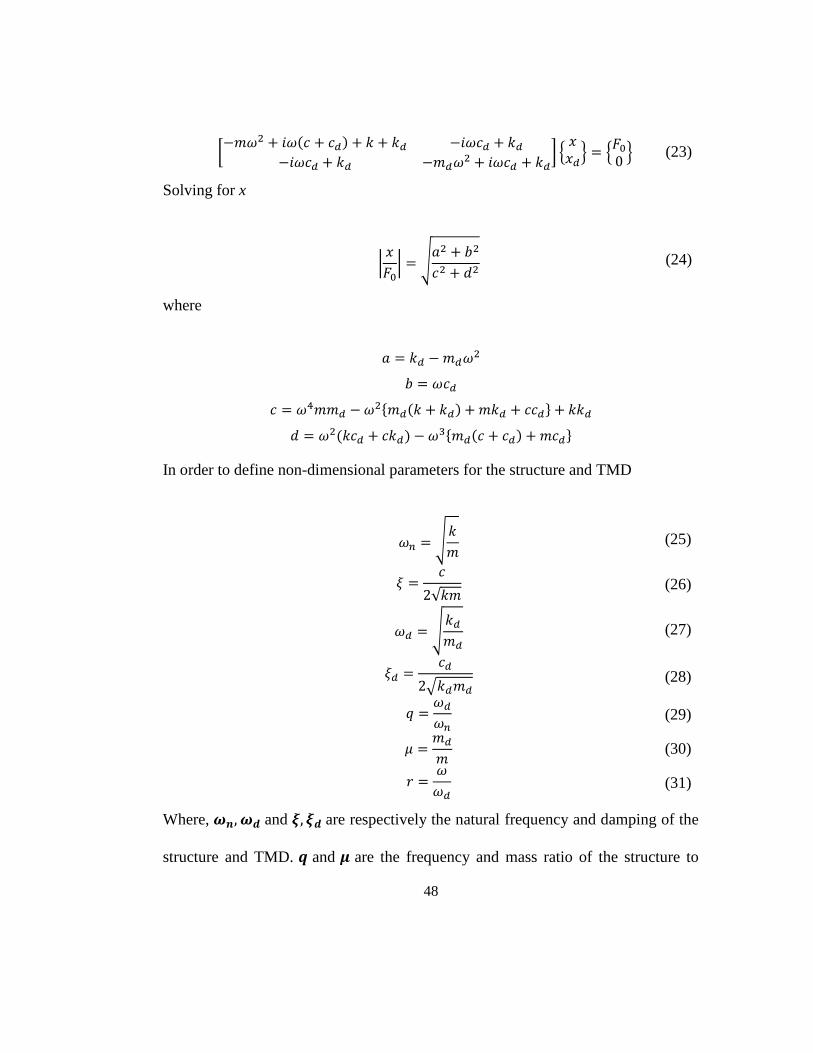
48
[−𝑚𝜔2 + 𝑖𝜔(𝑐 + 𝑐𝑑) + 𝑘 + 𝑘𝑑 −𝑖𝜔𝑐𝑑 + 𝑘𝑑
−𝑖𝜔𝑐𝑑 + 𝑘𝑑 −𝑚𝑑𝜔2 + 𝑖𝜔𝑐𝑑 + 𝑘𝑑
] {𝑥𝑥𝑑} = {
𝐹00} (23)
Solving for x
|𝑥
𝐹0| = √
𝑎2 + 𝑏2
𝑐2 + 𝑑2 (24)
where
𝑎 = 𝑘𝑑 −𝑚𝑑𝜔2
𝑏 = 𝜔𝑐𝑑
𝑐 = 𝜔4𝑚𝑚𝑑 −𝜔2{𝑚𝑑(𝑘 + 𝑘𝑑) + 𝑚𝑘𝑑 + 𝑐𝑐𝑑} + 𝑘𝑘𝑑
𝑑 = 𝜔2(𝑘𝑐𝑑 + 𝑐𝑘𝑑) − 𝜔3{𝑚𝑑(𝑐 + 𝑐𝑑) + 𝑚𝑐𝑑}
In order to define non-dimensional parameters for the structure and TMD
𝜔𝑛 = √𝑘
𝑚 (25)
𝜉 =𝑐
2√𝑘𝑚 (26)
𝜔𝑑 = √
𝑘𝑑𝑚𝑑
(27)
𝜉𝑑 =𝑐𝑑
2√𝑘𝑑𝑚𝑑
(28)
𝑞 =𝜔𝑑𝜔𝑛
(29)
𝜇 =𝑚𝑑
𝑚 (30)
𝑟 =𝜔
𝜔𝑑 (31)
Where, 𝝎𝒏, 𝝎𝒅 and 𝝃, 𝝃𝒅 are respectively the natural frequency and damping of the
structure and TMD. 𝒒 and 𝝁 are the frequency and mass ratio of the structure to

49
TMD. 𝒓 is the frequency ratio of excating force to the main structure. Eq. (24) can
be rewriten in non-dimensional form as follow:
|𝑥
𝐹0
| = √
��2 + ��2
𝑐2 + ��2 (32)
where
�� = 𝑞2 − 𝑟2
�� = 2𝜉𝑑2𝑟𝑞
𝑐 = 𝑟4 − 𝑟2{𝑞2(1 + 𝜇) + 1 + 4𝜉𝜉𝑑𝑞} + 𝑞2
�� = 2𝜉𝑑𝑟𝑞 + 2𝜉𝑟𝑞2 − 2𝑟3{𝜉 + 𝜉𝑑𝑞𝜇 + 𝜉𝑑𝑞}
When varying damping and mass ratios of a TMD, normalized displacement
magnitude vs frequency ratio comparing the structure with TMD to the uncontrolled
structure are provided in Figure 3-6 and Figure 3-7 respectively.

50
Figure 3-6. The frequency response by varying damping constant for TMD design (μ=0.01 and
ξ=0.02 for the uncontrolled structure)
Figure 3-7. The frequency response by varying mass ratio for TMD design (μ=0.01 and ξ=0.02
for the uncontrolled structure)
0
5
10
15
20
25
30
0.0 0.5 1.0 1.5 2.0 2.5
Norm
aliz
ed d
isp
lace
men
t m
agn
itu
te
(X/F
0)
Frequency ratio (r)
TMD design with varying damping ratio
Uncontrolled structureNo damping2% damping4% damping6% damping8% damping10%damping
0
5
10
15
20
25
30
0.0 0.5 1.0 1.5 2.0 2.5
No
rmal
ized
dis
pla
cem
ent
mag
nit
ute
(X/F
0)
Frequency ratio (r)
TMD design with varying mass ratio
Uncontrol structure
μ=1% mass ratio
μ=3% mass ratio
μ=5% mass ratio
μ=7% mass ratio
μ=9% mass ratio

51
3.4.2: Optimum Design Parameters
A significant amount of research has been done on how best to design the tuned mass
dampers in the passive control of structures under dynamic excitation such as strong
winds and earthquakes (Warburton and Ayorinde 1980; Warburton 1982). Most of
the researchers have agreed that the performance of TMDs depends onto the accuracy
of frequency ratio which is tuning the natural frequency of the TMD to the natural
frequency of the structure (Abubakar and Farid 2009).
J. P. Den Hartog in 1956 has come up with the equations below to obtain the optimum
values of the TMD parameters for an undamped SDOF structure under a harmonic
excitation.
𝜉𝑑𝑜𝑝𝑡 = √
3µ
8(1 + µ) (33)
𝑞𝑜𝑝𝑡 =
1
1 + µ (34)
Abubakar and Farid in 2009 have studied the Den Hartog optimization procedure for
the TMD parameters with harmonic loading applied to an undamped SDOF structure
with the consideration of the damping of the main structure, see equations below:
𝜉𝑑𝑜𝑝𝑡 = √
3µ
8(1 + µ)+0.1616 𝜉
1 + µ (35)

52
𝑞𝑜𝑝𝑡 =
1
1 + µ(1 − 1.5906 𝜉 )√
µ
1 + µ (36)
In this research, Eqs. (35) and (36) are employed to get the optimum dynamic
properties of the TMDs of the ICS, because it has a consideration of structural
damping constant, which is more realistic, in addition to Den Hartog model. With
this consideration, the efficiency of TMD is expected to be improved.
3.5: Modern Control Theory
A brief overview of modern control theory which covers active controller design is
provided in this chaptersection?. Classical control depends on frequency domain
analysis by using transfer function approaches, while modern control is concentrated
on time domain analysis formulated in the state space representation by governing
first-order differential equations. In this section, it provides the basic knowledge
which is necessary on a Linear Time-Invariant (LTI) system to understand this
dissertation.
3.5.1: State Space Modelling for an LTI system
Linear Time-Invariant (LTI) system is a linear system where its output responses are
the superposition of applied inputs and whose dynamics do not change over time.
These linearity and time-invariant properties make LTI systems easy to model and
understand the system graphically.

53
The general state-space model can be expressed for an LTI system as follows:
�� = 𝐴𝑥 + 𝐵𝑢 (37)
𝑦 = 𝐶𝑟𝑥 + 𝐷𝑟𝑢 (38)
Where x, u and y are the state space vector, the input and output of the system in ℝn,
ℝm and ℝp, respectively and A and B are the system matrix and the input matrix, and
Cr and Dr are the output matrix and the direct transmission matrix with appropriate
dimensions. If the input and output are scalar, then the system is referred as single-
input-single-output (SISO); if either dimension of input or output is higher than one,
then the system is multi-input-multi-output (MIMO). The block diagram of Eqs. (32)
and (33) are shown in Figure 3-8.
Figure 3-8. Block diagram of an LTI system
Assume that an initial condition x0 is given at when t=0. Taking Laplace transforms
of Eqs. (37) and (38) gives the equations as:
𝑠𝑋 − 𝑥0 = 𝐴𝑋(𝑠) + 𝐵𝑈(𝑠) (39)
𝑌(𝑠) = 𝐶𝑟𝑋(𝑠) +𝐷𝑟𝑈(𝑠) (40)
Solving for 𝑿(𝒔) gives

54
𝑋(𝑠) = 𝜓(𝑠)𝑥0 + 𝜓(𝑠)𝐵𝑈(𝑠) (41)
Where
𝜓(𝑠) = (𝑠𝐼 − 𝐴)−1 (42)
Eq. (42) can be converted into the time domain by taking inverse Laplace transform
as:
∅(𝑡) = ℒ−1(𝜓(𝑠)) = ℒ−1((𝑠𝐼 − 𝐴)−1) (43)
Using convolution, Eq. (39) can be expressed by substituting the inverse Laplace
transform of 𝜓(𝑠) as:
𝑥(𝑡) = ∅(𝑡)𝑥0 +∫ ∅(𝑡 − 𝜏)𝐵𝑢(
𝑡
0
𝜏)𝑑𝜏 (44)
Assuming for simplicity that 𝑥0 = 0, and substituting Eq. (44) into Eq. (39), the
ouput becomes as:
𝑌(𝑠) = 𝐶𝑟𝜓(𝑠)𝐵𝑈(𝑠) +𝐷𝑟𝑈(𝑠) (45)
Thus, the transfer function is a pxm matrix-valued function of s which takes the form
𝐺(𝑠) = 𝐶𝑟𝜓(𝑠)𝐵 +𝐷𝑟 (46)
The transfer function yields the impulse response by taking the inverse Laplace
transform
𝑔(𝑡) = ℒ−1(𝐺(𝑠)) = 𝐶𝑟𝜓(𝑠)𝐵 +𝐷𝑟𝛾(𝑡) (47)
Where 𝜸(𝒕) is the Dirac delta function and it is defined as:

55
𝛾(𝑡) = {+∞ 𝑡 = 00 𝑡 ≠ 0
(48)
∫ 𝛾(𝑡)𝑑𝑡+∞
−∞
= 1 (49)
Thus, the output can be expressed with an assumption for zero initial conditions
𝑦(𝑡) = 𝑔 ∗ 𝑢(𝑡) = ∫ 𝑔(𝑡 − 𝜏)𝑢(
𝑡
0
𝜏)𝑑𝜏
= ∫ 𝐶𝑟𝜓(𝑡 − 𝜏)𝐵𝑢(𝜏)𝑡
0
𝑑𝜏 +𝐷𝑟𝑢(𝜏)
(50)
Where (*) is symboled for convolution integral
3.5.2: State Feedback
Assuming that all of the states of a system are available, the controller is given as:
𝑢 = −𝐾𝑥 (51)
Where K is an nxm matrix. Substituting the input u into Eq. (37) gives the closed-
loop system as:
�� = 𝐴𝑥 − 𝐵𝐾𝑥 = (𝐴 − 𝐵𝐾)𝑥 (52)
The block diagram of the closed-loop system is illustrated in Figure 3-9.

56
Figure 3-9. Block diagram of the state feedback controller
For stability of the closed-loop sysytem, the eigenvalues of the closed-loop matrix
(A-BK) must be evaluated to determine whether or not 𝑥(𝑡) → 0 as 𝑡 → ∞ from any
initial condition. The eigenvalues of (A−BK) can be found arbitrarily in the form of
complex conjugate, if and only if (A, B) is controllable.
3.5.3: Linear Quadratic Regulator (LQR)
Linear quadratic regulator (LQR) is one of the effective and widely used methods for
determining the state feedback gain matrix K in Eq. (51) by minimizing a defined
cost function. For an LTI system described by Eq. (37), the cost function is described
as when assuming that 𝑥(𝑡) → 0 as 𝑡 → ∞:
𝐽 = ∫ [𝑥𝑇𝑄
∞
0
𝑥 + 𝑢𝑇𝑅𝑢]𝑑𝑡 (53)
𝑄 = 𝑁𝑇𝑁 ∈ ℝ𝑛𝑥𝑛 (54)
𝑅 ∈ ℝ𝑚𝑥𝑚 (55)

57
where Q is semi-positive definite and R positive definite matrices. If (A, B) is
stabilizable and (A, N) is detectable, the solution of the optimal control problem
exists and is unique.
The optimal cost Jmin (which is the minimum value of J) will be
𝐽𝑚𝑖𝑛(𝑥0) = 𝑥0𝑇𝑃𝐿𝑄𝑅𝑥0 (56)
and the feedback control law u with the optimal cost Jmin can be written as:
𝑢 = −𝐾𝐿𝑄𝑅𝑥 (57)
where 𝑲𝑳𝑸𝑹 is given by
𝐾𝐿𝑄𝑅 = 𝑅−1𝐵𝑇𝑃𝐿𝑄𝑅 (58)
𝑃𝐿𝑄𝑅A+ AT𝑃𝐿𝑄𝑅 + Q− 𝑃𝐿𝑄𝑅BR
−1BT𝑃𝐿𝑄𝑅 = 0 (59)
Where 𝑷𝑳𝑸𝑹, is semi positive the solution of the Control Algebraic Riccati Equation
(CARE) is given in Eq. (59). Matlab is employed in order to get the CARE solution.
3.6: Performance Evaluation Criteria and Seismic Energy
Analysis
In this section, the performance evaluation (PE) indexes and seismic energy analysis
are discussed and introduced in order to evaluate the performance of a control
system.
(Spencer Jr., Christenson, and Dyke 1998) proposed and established a set of fifteen
performance criteria (PC) for the Benchmark model buildings with or without

58
various control systems for comparison of performance evaluation. The smaller
values of one of these PC are more desirable for improved effectiveness. In this study
for performance evaluation, energy analyses and three performance criteria are
selected the maximum; floor displacement (J1), drift (J2), and floor acceleration (J3).
𝐽1{𝐸𝑙 𝐶𝑒𝑛𝑡𝑟𝑜
𝐿𝑜𝑚𝑎 𝑃𝑟𝑖𝑒𝑡𝑎𝐾𝑜𝑐𝑎𝑒𝑙𝑖
}
= 𝑚𝑎𝑥 {𝑚𝑎𝑥|𝛿𝑖(𝑡)|
𝛿𝑚𝑎𝑥}
(60)
𝐽2{𝐸𝑙 𝐶𝑒𝑛𝑡𝑟𝑜
𝐿𝑜𝑚𝑎 𝑃𝑟𝑖𝑒𝑡𝑎𝐾𝑜𝑐𝑎𝑒𝑙𝑖
}
= 𝑚𝑎𝑥 {𝑚𝑎𝑥|𝑑𝑖(𝑡)|/ℎ𝑖
𝑑𝑛𝑚𝑎𝑥 }
(61)
𝐽3{𝐸𝑙 𝐶𝑒𝑛𝑡𝑟𝑜
𝐿𝑜𝑚𝑎 𝑃𝑟𝑖𝑒𝑡𝑎𝐾𝑜𝑐𝑎𝑒𝑙𝑖
}
= 𝑚𝑎𝑥 {𝑚𝑎𝑥|��𝑖(𝑡)|
��𝑚𝑎𝑥} 𝑓𝑜𝑟 𝑖 = 1 𝑡𝑜 𝑛
(62)
Where,
|𝜹𝒊(𝒕)| is the absolute displacement of the controlled system at ith floor.
𝜹𝒎𝒂𝒙 is the maximum absolute displacement of the uncontrolled system at any floor.
|𝒅𝒊(𝒕)| is the inter-story drift of the floor above ground level.
𝒉𝒊 is the height of ith floor.
𝒅𝒏𝒎𝒂𝒙
is the maximum absolute inter-story ratio at any floor ( 𝑑𝑛𝑚𝑎𝑥 =
𝑚𝑎𝑥{𝑑𝑖(𝑡)}/ℎ𝑖)).
|��𝒊(𝒕)| is the absolute displacement of the controlled system at ith floor.

59
��𝒎𝒂𝒙 is the maximum absolute acceleration of the uncontrolled system at any floor.
The general equation of motion for an MDOF system can be expressed in terms of
energy computation as follow (Wong and Yang 2002);
∫ ��T(τ)[𝑀𝑠𝑡]��(τ)t
0
dτ + ∫ ��T(τ)[𝐶𝑠𝑡]��(τ)t
0
dτ + ∫ ��T(τ)[𝐾𝑠𝑡]𝛿(τ)t
0
= −∫ ��T(τ)[𝑀𝑠𝑡]�� ��𝑔(τ)t
0
dτ + ∫ ��T(τ)𝐻𝑈(𝜏) 𝑡
0
𝑑𝜏
(63)
Where, 𝑴𝒔𝒕 , 𝑪𝒔𝒕 , and 𝑲𝒔𝒕 are respectively the nxn matrix of mass, damping, and
stiffness of the structure. 𝜹(𝒕) is the n dimensional displacement vector to the base
excitation and 𝜞 is the modification vector of the earthquake excitation.
The energy equations can be written as;
𝐸𝑘𝑟 + 𝐸𝑑 + 𝐸𝑎 = 𝐸𝑖𝑟 + 𝐸𝑎𝑐 (64)
Where,
𝑬𝒕𝒊𝒓 is total input energy, which is equal to the sum of 𝑬𝒊𝒓 and 𝑬𝒂𝒄.
𝑬𝒌𝒓 is relative kinetic energy.
𝑬𝒅 is the damping energy.
𝑬𝒂 is the strain energy.
𝑬𝒊𝒓 stands for the relative input energy.

60
𝑬𝒂𝒄 is the actuator energy in case a system is actively controlled as formulated
respectively below:
𝐸𝑘𝑟 =
1
2��𝑇(𝜏)[𝑀𝑠𝑡]��
𝑇(𝜏) (65)
𝐸𝑑 = ∫ ��𝑇(𝜏)[𝐶𝑠𝑡]��(𝜏)
𝑡
0
𝑑𝜏 (66)
𝐸𝑎 = ∫ ��𝑇(𝜏)[𝐾𝑠𝑡]𝛿(𝜏)
𝑡
0
(67)
𝐸𝑖𝑟 = −∫ ��𝑇(𝜏)[𝑀𝑠𝑡]�� ��𝑔(𝜏)
𝑡
0
𝑑𝜏 (68)
𝐸𝑎𝑐 = ∫ ��
T(τ)𝐻𝑈(𝜏)
𝑡
0
𝑑𝜏 (69)
3.7: Summary and Discussion
This chapter provided the methodology and terminology that are essential and used
in this dissertation. First, we were answering the following questions ‘what is
torsional irregularity?’ and ‘what has been done so far by researchers about that?’.
That is why a brief literature review about the torsional irregularity and the definition
of design eccentricity in the seismic provision of ASCE 07-10 was introduced and
defined. Intensively used terminology and definitions in this dissertation were also
described. In addition, in order to develop the new control system and understand its
dynamic performance, the principal and design procedure of a translational TMD,
which is applied to a single degree of freedom (SDOF), were explained and the
optimum TMD design formulas were provided. Finally, the necessary background

61
on modern control theory to develop the proposed control system was provided and
the performance evaluation criteria and energy analysis were stated to test the
proposed control system in this chapter.

62
Chapter 4 Various Control Systems under Unidirectional
Seismic Loading Case
There are a lot of control mechanisms, developed to withstand against various
environmental dynamic loadings caused by earthquakes or strong wind gusts. One
of the most commonly used and important control methods is a tuned mass damper
(TMD), which is often employed to mitigate the amplitude of mechanical vibrations.
To get a more effective response reduction of the structure, it is essential that the
dynamics of the structure are modeled as accurately as possible. In this section, the
seismic response of reinforced concrete (RC) six-story building was analyzed with
the combinations of masonry infill-wall, a passive (TMD) and an active tuned mass
damper (ATMD). The infill walls were placed along all frames without any space
between column-wall and beam-wall connection. The TMD has no external source
of energy, while the ATMD has an external energy source generated by the actuator
which is driven by a linear quadratic regulator (LQR) controller. The dynamic
response of the building was evaluated using the data from a real earthquake
excitation of El Centro in 1940.

63
4.1: Introduction
The development of advanced technologies and structural material in the 21st
century have led to taller and more flexible buildings using lighter materials. This
trend makes buildings less damping and becoming more susceptible to dynamic
loadings such as severe wind gusts and earthquakes.
Earthquake is a sudden and destructive shaking of ground resulting from released
ground energy between the different layers of the Earth. This released energy, called
earthquake ground motion, sometimes can be brutal and unmerciful when the
structures are not well-designed against strong earthquake energy. It can cause
thousands of people dead, wounded or homeless. For this reason, civil structures
should be well-designed by taking the earthquake ground motion into account of
structural analysis.
In the last two decades, there has been significant attention to the development of
control systems to dissipate the earthquake ground motion on buildings. The control
systems can be divided into passive, active (Nishimura et al. 1998; Arfiadi 2000),
semi-active and hybrid control strategies proposed to enhance the safety and
performance of structures induced by various dynamic loadings such as an
earthquake.
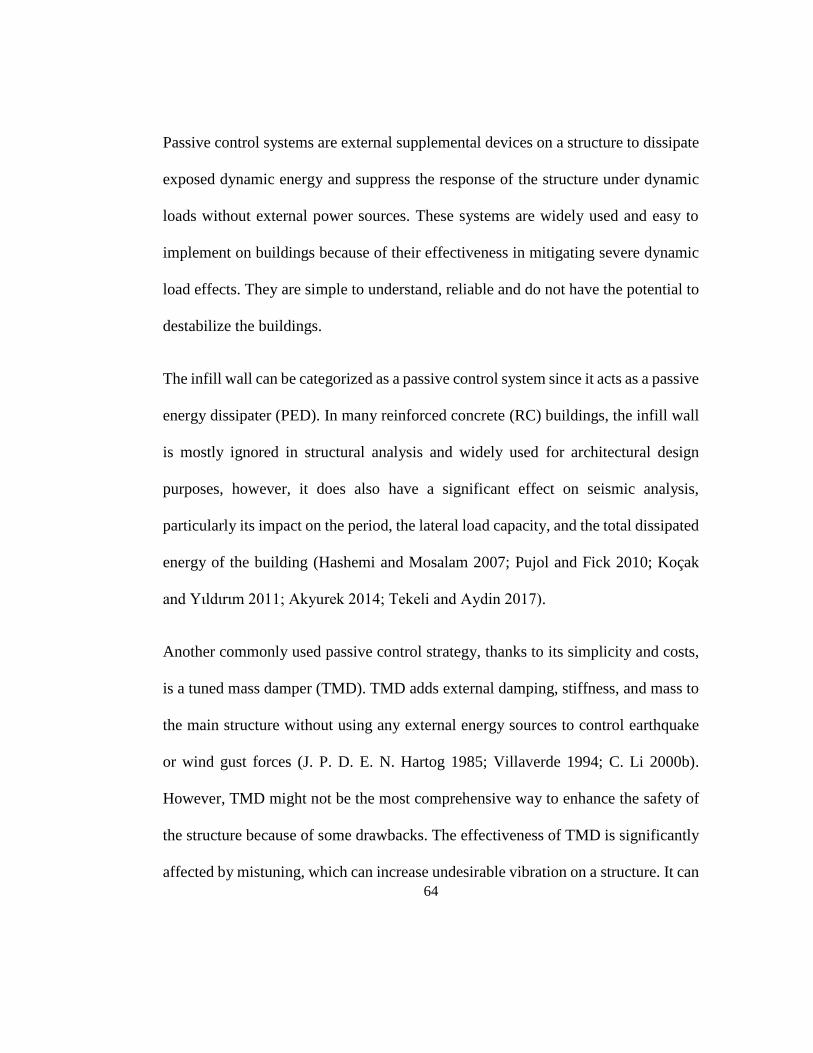
64
Passive control systems are external supplemental devices on a structure to dissipate
exposed dynamic energy and suppress the response of the structure under dynamic
loads without external power sources. These systems are widely used and easy to
implement on buildings because of their effectiveness in mitigating severe dynamic
load effects. They are simple to understand, reliable and do not have the potential to
destabilize the buildings.
The infill wall can be categorized as a passive control system since it acts as a passive
energy dissipater (PED). In many reinforced concrete (RC) buildings, the infill wall
is mostly ignored in structural analysis and widely used for architectural design
purposes, however, it does also have a significant effect on seismic analysis,
particularly its impact on the period, the lateral load capacity, and the total dissipated
energy of the building (Hashemi and Mosalam 2007; Pujol and Fick 2010; Koçak
and Yιldιrιm 2011; Akyurek 2014; Tekeli and Aydin 2017).
Another commonly used passive control strategy, thanks to its simplicity and costs,
is a tuned mass damper (TMD). TMD adds external damping, stiffness, and mass to
the main structure without using any external energy sources to control earthquake
or wind gust forces (J. P. D. E. N. Hartog 1985; Villaverde 1994; C. Li 2000b).
However, TMD might not be the most comprehensive way to enhance the safety of
the structure because of some drawbacks. The effectiveness of TMD is significantly
affected by mistuning, which can increase undesirable vibration on a structure. It can

65
be solely tuned to the fundamental frequency of the structure so that it is only
effective in the small range of frequency. It may have little or no effect for other
modes that are not used for its tuning process in the scenario of a dynamic load.
In overcoming such problems of TMDs, an active control strategy (ATMD) has been
widely proposed using the same TMDs equipment but with the inclusion of external
energy sources provided by an actuator. There are various algorithms to control the
force from the actuator, and some of them are Proportional-Integral-Derivative
(PID), Linear Guadratic Regulator (LQR), and Linear Guadratic Gaussian (LQG).
This study focuses on the performance of masonry infill walls, which is generally
neglected in the design, in a 6-story RC building under unidirectional seismic load
where the infill walls were placed along all frames without any space between
column-wall and beam-wall connection. Additionally, the performance of the
masonry infill wall was compared to other seismic control strategies including the
use of TMD and ATMD. For an active control system, the control force is generated
by the actuator of ATMD, which is driven by LQR. The LQR using a genetic
algorithm for an optimization of the weighting matrix (Shafieezadeh 2008b; Jiang,
Wei, and Guo 2010; Guclu and Yazici 2008, 2009) was employed. Matlab&Simulink
was used to simulate the system under real-time excitation data of the El Centro
earthquake in 1940.

66
4.2: Description of Model Buildings
Phase 1 of the study was used to determine the impact of the infill wall placement in
different plans of the structure. The seismic performance evaluation was performed
with different infill wall placement layouts in the plan on the designed models by
varying number of span and story. Model 1 is a bare 5-story 33-bays RC building
without the infill wall, while Model 2 is fully placed by infill wall. Model 3 has only
exterior infill wall placement layouts and Model 4 has only interior axes placed with
the infill wall. Model 5 is placed by the infill wall in an asymmetrical way, see Figure
4-1.
Model 1 Model 2 Model 3 Model 4 Model 5
Figure 4-1. The infill wall placement in the plan for 5-story 3x3-bays; red color represents
fully infill wall placement into the frame
The seismic performances of RC model buildings with and without infill wall were
determined by using pushover nonlinear static analysis of structural analysis program
(SAP 2000, 2011). The effects of the rate (area of infill wall to floor plan) and the
placement layouts (symmetrical or asymmetrical) of infill wall were investigated in
the model buildings to examine inter-story drift, torsional irregularity coefficient,
capacity curve, fundamental period, sway demand in the roof story, damage level of

67
columns in the base floor, building performance level. Damage levels were
categorized into four: operational (OP), immediate occupancy (IO), life safety (LF),
and collapse prevention (CP). In order to show the effectiveness of infill wall
placement layouts especially when it is symmetrically placed, the obtained results
showed that symmetrically fully placed infill wall contributed to RC performance
positively, see Table 4-1, whereas asymmetrical placement of infill wall in the
building may lead the building to increase damage levels in the structural elements,
see Table 4-2. For more details, readers are referred to (Akyurek 2014). To this end,
Model 2 was adopted and evaluated further to compare with other control strategies.

68
Table 4-1. Inter-story drift ration of the 3x3-bay 5-story model building, taken it from
(Akyurek 2014)
Type of
model
Story
no
Displacement
at the ith floor
di (m)
Relative
displacement
i (m)
ii×R
(m)
Story
height
hi(m)
Inter-story
drift ratio
i) max/hi
Model 1 0 0.000 - 0.000 - 0.000
1 0.002 0.002 0.020 3 0.001
2 0.006 0.003 0.024 3 0.001
3 0.008 0.003 0.021 3 0.001
4 0.010 0.002 0.015 3 0.001
5 0.011 0.001 0.008 3 0.000
Model 2 0 0.000 - 0.000 - 0.000
1 0.002 0.002 0.013 3 0.001
2 0.004 0.002 0.015 3 0.001
3 0.005 0.002 0.013 3 0.001
4 0.006 0.001 0.009 3 0.000
5 0.007 0.001 0.005 3 0.000
Model 3 0 0.000 - 0.000 - 0.000
1 0.002 0.002 0.016 3 0.001
2 0.004 0.002 0.019 3 0.001
3 0.006 0.002 0.016 3 0.001
4 0.008 0.001 0.011 3 0.000
5 0.009 0.001 0.006 3 0.000
Model 4 0 0.000 - 0.000 - 0.000
1 0.002 0.002 0.016 3 0.001
2 0.004 0.002 0.019 3 0.001
3 0.006 0.002 0.016 3 0.001
4 0.008 0.001 0.011 3 0.000
5 0.008 0.001 0.006 3 0.000
Model 5 0 0.000 - 0.000 - 0.000
1 0.002 0.002 0.014 3 0.001
2 0.004 0.002 0.017 3 0.001
3 0.006 0.002 0.014 3 0.001
4 0.007 0.001 0.010 3 0.000
5 0.008 0.001 0.005 3 0.000
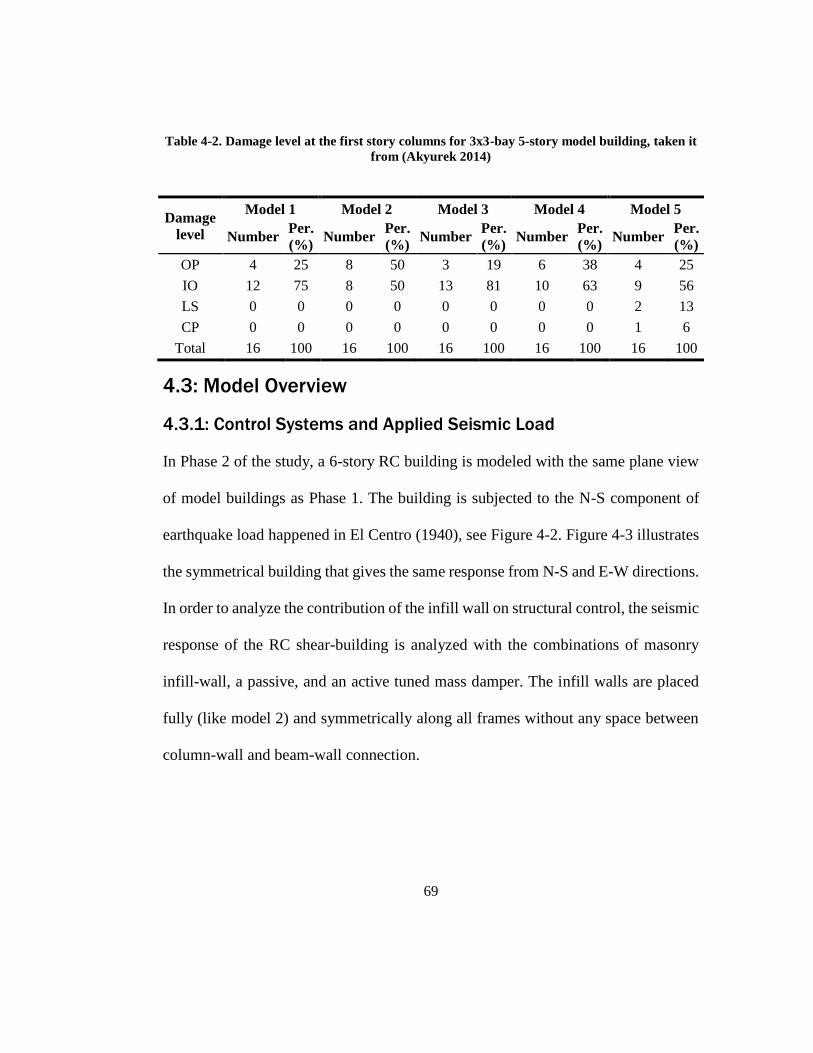
69
Table 4-2. Damage level at the first story columns for 3x3-bay 5-story model building, taken it
from (Akyurek 2014)
Damage
level
Model 1 Model 2 Model 3 Model 4 Model 5
Number Per.
(%) Number
Per.
(%) Number
Per.
(%) Number
Per.
(%) Number
Per.
(%)
OP 4 25 8 50 3 19 6 38 4 25
IO 12 75 8 50 13 81 10 63 9 56
LS 0 0 0 0 0 0 0 0 2 13
CP 0 0 0 0 0 0 0 0 1 6
Total 16 100 16 100 16 100 16 100 16 100
4.3: Model Overview
4.3.1: Control Systems and Applied Seismic Load
In Phase 2 of the study, a 6-story RC building is modeled with the same plane view
of model buildings as Phase 1. The building is subjected to the N-S component of
earthquake load happened in El Centro (1940), see Figure 4-2. Figure 4-3 illustrates
the symmetrical building that gives the same response from N-S and E-W directions.
In order to analyze the contribution of the infill wall on structural control, the seismic
response of the RC shear-building is analyzed with the combinations of masonry
infill-wall, a passive, and an active tuned mass damper. The infill walls are placed
fully (like model 2) and symmetrically along all frames without any space between
column-wall and beam-wall connection.

70
Figure 4-2. El Centro (North-South) ground acceleration, in 1940.
Figure 4-3. RC building in plain-view
The RC building elevation is illustrated in Figure 4-4a. When it is strengthened by
masonry infill wall placement, it is shown in Figure 4-4b. The implementations of

71
TMD and ATMD are respectively illustrated in Figure 4-4c and Figure 4-4d. The
simplified equivalent system used in the seismic analysis is illustrated in Figure 4-4e.
(a) RC building (b) RC building with infill wall (c) RC building with TMD
(d) RC building with ATMD (e) Simplified equivalent system
Figure 4-4. Elevation-views of models in A-A direction with or without either TMD or ATMD
whether including masonry infill walls or not.

72
4.3.2: Adding Infill Wall
The stiffness contribution of the infill wall is considered by modeling it as an
equivalent compression strut which is described in section 3.3.1.1. The masonry infill
wall is made of clay bricks with the modular size of 102mm 203mm 68mm. The
material properties of the infill wall are taken from the experimental study conducted
by (Hashemi and Mosalam 2007) and properties of structural components are
provided in Table 4-3.
Table 4-3. Material and element properties of the structure
Type
of
components
Size (mm)
Compression
strength
(MPa)
Modulus of
elasticity
(GPa)
Poisson’s
ratio
Density
(kg/m3)
Beams 300x500 20 28
0.15
2400
Columns
(fc, Ec) 350x350 20 28 2400
Slabs 150 20 28 2400
Masonry wall
(fwall, Ewall) 2500x3650 17 6.19 1500
Assuming that the slab for each floor behaves as a rigid diaphragm, the response for
each node of the floor is relative to one another under an earthquake force.
Considering that flexural rigidity of the beams is infinite, the lateral stiffness of
columns and the stiffness contribution of the infill wall are respectively calculated
by using Eq. (70) (Clough and Penzien 1995) shown below and Eq. (15) (Dolšek and
Fajfar 2008) as described in section 3.3.1.1. The damping contribution of the infill
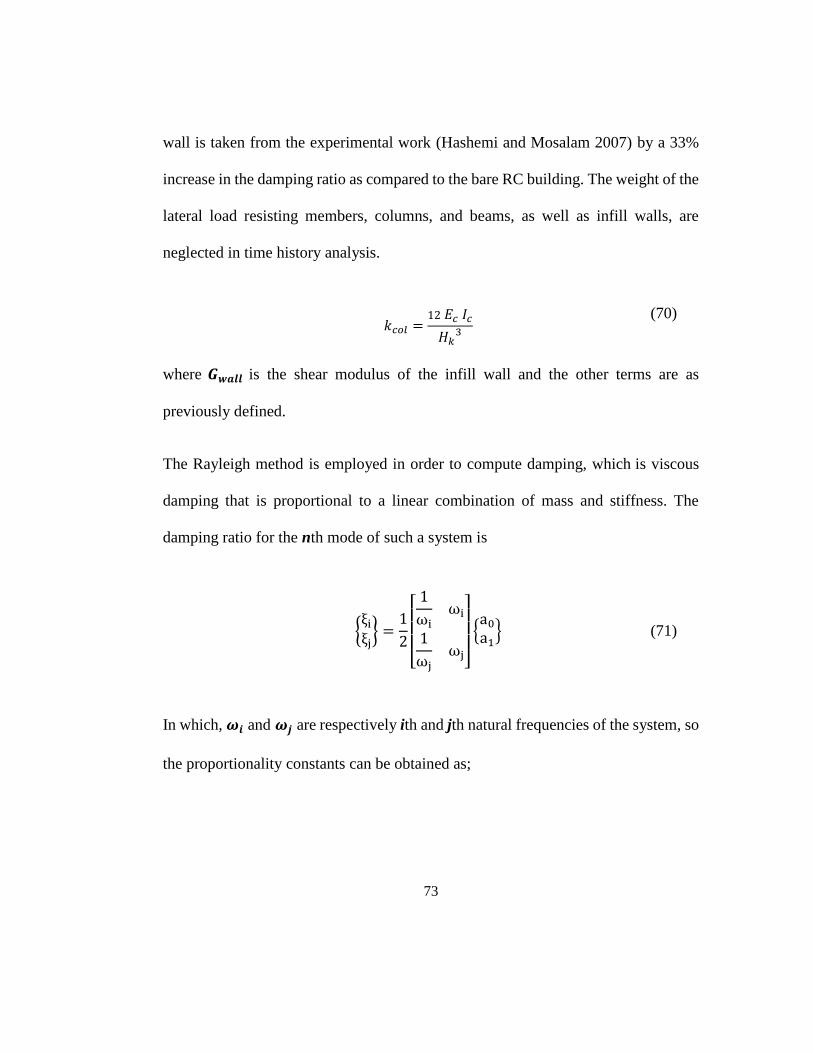
73
wall is taken from the experimental work (Hashemi and Mosalam 2007) by a 33%
increase in the damping ratio as compared to the bare RC building. The weight of the
lateral load resisting members, columns, and beams, as well as infill walls, are
neglected in time history analysis.
𝑘𝑐𝑜𝑙 =
12 𝐸𝑐 𝐼𝑐
𝐻𝑘3
(70)
where 𝑮𝒘𝒂𝒍𝒍 is the shear modulus of the infill wall and the other terms are as
previously defined.
The Rayleigh method is employed in order to compute damping, which is viscous
damping that is proportional to a linear combination of mass and stiffness. The
damping ratio for the nth mode of such a system is
{ξiξj} =
1
2
[ 1
ωiωi
1
ωjωj]
{a0a1} (71)
In which, 𝝎𝒊 and 𝝎𝒋 are respectively ith and jth natural frequencies of the system, so
the proportionality constants can be obtained as;

74
a0 = ξ
2 ωi ωj
ωi +ωj, a1 = ξ
2
ωi +ωj (72)
Where, 𝒂𝟎 and 𝒂𝟏 are constants of proportionality and 𝝃 is the damping factor or
damping ratio. The damping factor for a model building is taken 4.30% and for the
models with the infill wall is 5.7% by 33 percent increase to the model without infill
wall placement (Hashemi and Mosalam 2007). The damping matrix (C) is governed
as:
𝐶 = 𝑎0 𝑀 + 𝑎1𝐾
(73)
Table 4-4 summarizes the dynamic properties, including mass, damping, and
stiffness, used in various building models.
Table 4-4. The dynamic properties of the structure and TMDs
Type of
models
Dynamic properties for each floor
Mass
(tone)
Damping
(kN.s/mm)
Stiffness
(kN/mm)
RC building 51.84 0.324 249
Infill wall
Contribution 1.64 0.493 472
TMD properties 15.55 0.687 3.85

75
4.4: Structural Dynamics and Control Theory
4.4.1: Mathematical Modeling
Assuming that 6 story RC building has a six-degree-of-freedom and subjected to a
one-dimensional base excitation in A-A direction. The equation of motion can be
expressed as;
𝑀��(𝑡) + 𝐶��(𝑡) + 𝐾𝛿(𝑡) = 𝐻𝑈(𝑡) + 𝑀𝛤��𝑔(𝑡) (74)
𝑀 = 𝑑𝑖𝑎𝑔𝑜𝑛𝑎𝑙[𝑚1,𝑚2,𝑚3…𝑚𝑛] (75)
1 2 2
2 2 3 3
3
n
n n d d
d d
c c c
c c c c
c . .
C . . .
. . c
c c c c
c c
1 2 2
2 2 3 3
3
n
n n d d
d d
k k k
k k k k
k . .
K . . .
. . k
k k k k
k k
where, M, C, and K are respectively the n n matrix of mass, damping, and stiffness
of the structure including a tuned mass damper (TMD). Prime (.) represents
derivative respect to time. 𝜹(t) is the n-dimensional displacement vector to the base
excitation, U(t) is the control force vector, and H is the location vector of the
controllers. 𝜞 is the modification vector of the earthquake excitation. Then state
space representation of Eq. (13) can be written as;
��(𝑡) = 𝐴𝑍(𝑡) + 𝐵𝑈(𝑡) +𝑊��𝑔(𝑡) (76)
𝑋(𝑡) = 𝐶𝑟𝑍(𝑡) + 𝐷𝑟𝑈(𝑡) (77)

76
𝑍(𝑡) = [𝛿(𝑡)
��(𝑡)] 𝐴 = |
𝑧𝑒𝑟𝑜𝑠(𝑛, 𝑛) 𝑒𝑦𝑒(𝑛, 𝑛)
−𝑀−1𝐾 −𝑀−1𝐶| 𝐵 = [
𝑧𝑒𝑟𝑜𝑠(𝑛,𝑚)
𝑀−1𝐻] 𝑊 = [
𝑧𝑒𝑟𝑜𝑠(𝑛, 1)𝛤
]
𝐶𝑟 = [𝑒𝑦𝑒(𝑛, 𝑛) 𝑧𝑒𝑟𝑜𝑠(𝑛, 𝑛)] 𝐷𝑟 = [𝑧𝑒𝑟𝑜𝑠(𝑛, 1)]
Where Z (t) is the (2n1) state vector, A is the (2n2n) system matrix, B is the (2nm)
input matrix. W is an appropriate (2n1) vector. Cr (n2n) and Dr (n1) are the output
matrix and direct transmission matrix respectively. They are defined according to the
desired output. In this condition, the desired output of state space is displacement.
4.4.2: Optimum Fundamental Properties of the TMD
There are significant optimum parameters to suppress the response of the main
structure by using TMD, which are a mass ratio, tuning natural frequency ratio and
damping ratio. The first thing is done by selecting the effective mass ratio of the
structure and TMD as µ =𝒎𝒅
𝒎= 5%, where md is the mass of TMD. The damping
ratio (𝝃𝒅) and natural frequency (𝝎𝒅) of the TMD are obtained by using modified
Den Hartog equations (I. M. Abubakar & B. J. M. Farid 2012):
𝜉𝑑 = √
3µ
8(1 + µ)+0.1616 𝜉
1 + µ (78)
𝜔𝑑 = 𝑞 𝜔𝑛 (79)
In which, q is the frequency ratio of the TMD and the structure, obtained as:
𝑞 =
1
1 + µ(1 − 1.5906 𝜉 )√
µ
1 + µ
(80)

77
In order to compute the damping ratio and frequency of the structure, they are
governed by Eqs. (26) and (27).
𝜔𝑛 = √𝑘
𝑚
(81)
𝜉 =𝑐
2√𝑘𝑚 (82)
Then, the stiffness and damping of the TMD are computed by governing Eqs. (28)
and (29).
kd = mdωd2 (83)
𝑐𝑑 = 2𝜉𝑑√𝑘𝑑𝑚𝑑 (84)
4.4.3: Control Theory
In the control problem, the main purpose is to find control U(t) that minimizes a cost
function subject to the constraints of the plant dynamics. General cost function (J) is
given by
𝐽 = ∫ [𝑍(𝑡)𝑇𝑄
∞
0
𝑍(𝑡) + 𝑈(𝑡)𝑇𝑅𝑈(𝑡)]𝑑𝑡 (85)
𝑄 = 𝑁𝑇𝑁 ∈ ℝ2𝑛𝑥2𝑛 (86)
𝑅 ∈ ℝ𝑚𝑥𝑚 (87)
where Q is semi-positive definite and R positive definite matrices. If (A, B) is
stabilizable and (A, N) is detectable, the solution of the optimal control problem exists
and is unique. Where 𝑲 ∈ ℝ2nx2n is semi-positive definite, the solution of the
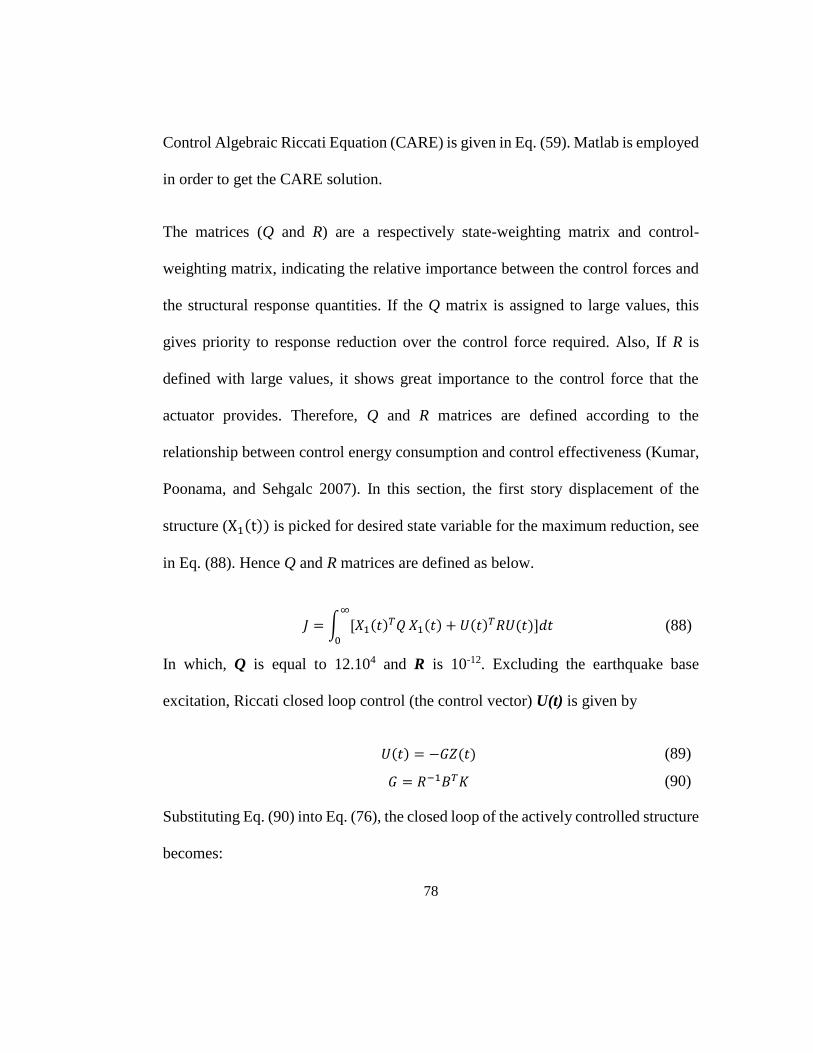
78
Control Algebraic Riccati Equation (CARE) is given in Eq. (59). Matlab is employed
in order to get the CARE solution.
The matrices (Q and R) are a respectively state-weighting matrix and control-
weighting matrix, indicating the relative importance between the control forces and
the structural response quantities. If the Q matrix is assigned to large values, this
gives priority to response reduction over the control force required. Also, If R is
defined with large values, it shows great importance to the control force that the
actuator provides. Therefore, Q and R matrices are defined according to the
relationship between control energy consumption and control effectiveness (Kumar,
Poonama, and Sehgalc 2007). In this section, the first story displacement of the
structure (X1(t)) is picked for desired state variable for the maximum reduction, see
in Eq. (88). Hence Q and R matrices are defined as below.
𝐽 = ∫ [𝑋1(𝑡)
𝑇𝑄∞
0
𝑋1(𝑡) + 𝑈(𝑡)𝑇𝑅𝑈(𝑡)]𝑑𝑡 (88)
In which, Q is equal to 12.104 and R is 10-12. Excluding the earthquake base
excitation, Riccati closed loop control (the control vector) U(t) is given by
𝑈(𝑡) = −𝐺𝑍(𝑡) (89)
𝐺 = 𝑅−1𝐵𝑇𝐾 (90)
Substituting Eq. (90) into Eq. (76), the closed loop of the actively controlled structure
becomes:

79
��(𝑡) = (𝐴 − 𝐵𝐺)𝑍(𝑡) +𝑊��𝑔(𝑡) (91)
4.4.4: Actuator Location & Actuator Dynamics
Many studies so far have used single and multi-actuators implementation either on
the first or any number of floors of the structure. Installation of the actuator at every
floor, in practice, is extremely expensive and may not be applicable in consideration
of dynamic of actuators. There are plenty of electric and mechanical components
such as sensors, transducers, and a computer that are cooperated in order to operate
the control system. Therefore, the system with fewer actuators may be more realistic
in terms of cost and simplicity.
Another important concern about actuators is the maximum force that they can
provide. In the case of a strong earthquake, this limitation will be exceeded where
the actuator will not be able to deliver the required control force. Therefore, it is
essential to design controllers to reduce structural damage and prevent total structural
failure in the event of a strong earthquake (Aaron Samuel Brown 2000).
In this case, the force (approximately a maximum value of 485 kN) the actuator needs
to generate, driven by the LQR controller, is illustrated in Figure 4-5 with the
selection of Q and R parameter. MTS 244 or 243 series actuator for civil structures
might be employed to perform the dynamic scenario. For more detailed information,
see Figure 4-6, the readers are referred to (“Civil, Structural and Architectural
Engineering Testing Capabilities 4/11” 7AD).

80
Figure 4-5. Desired actuator force (N)

81
Figure 4-6. Datasheet of MTS 243 series actuator, taken it from (“Civil, Structural and
Architectural Engineering Testing Capabilities 4/11” 7AD)
4.5: Simulation Results and Discussion
A 6-story RC building was modeled, and the analyses are respectively conducted on
the RC building by retrofitting with the placement of the infill walls layout, the
implementation of TMD and ATMD, see Figure 4-4.

82
In order to illustrate the effect of the infill wall in the dynamic analysis, the results
are obtained and compared with the RC building and the RC building with TMD and
ATMD. As seen in Table 4-5, the infill wall significantly increases the frequencies
of the structure, which is vital for the effectiveness of TMD and ATMD in the tuning
process. It has also a substantial amount of stiffness contribution (lateral bearing load
capacity) and damping contribution (energy dissipation capacity), see Table 4-4.
After tuning TMD and ATMD to the fundamental frequency (16.7 rad/sec) of the
RC building and its dynamic properties are provided in Table 4-4, the maximum
response of the structures at the resonance frequency and their phase angle are
obtained and compared one another, see in Figure 4-7.
Table 4-5. The first five modal frequencies of the structures
Modal
frequency
(rad/s)
RC
building
RC building with
infill wall
RC building
with TMD
RC building
with ATMD
1st mode 16.77 28.52 13.94 13.94
2nd mode 49.32 83.90 18.80 18.80
3rd mode 79.01 134.41 49.55 49.55
4th mode 104.11 177.10 79.12 79.12
5th mode 123.16 209.51 104.16 104.16
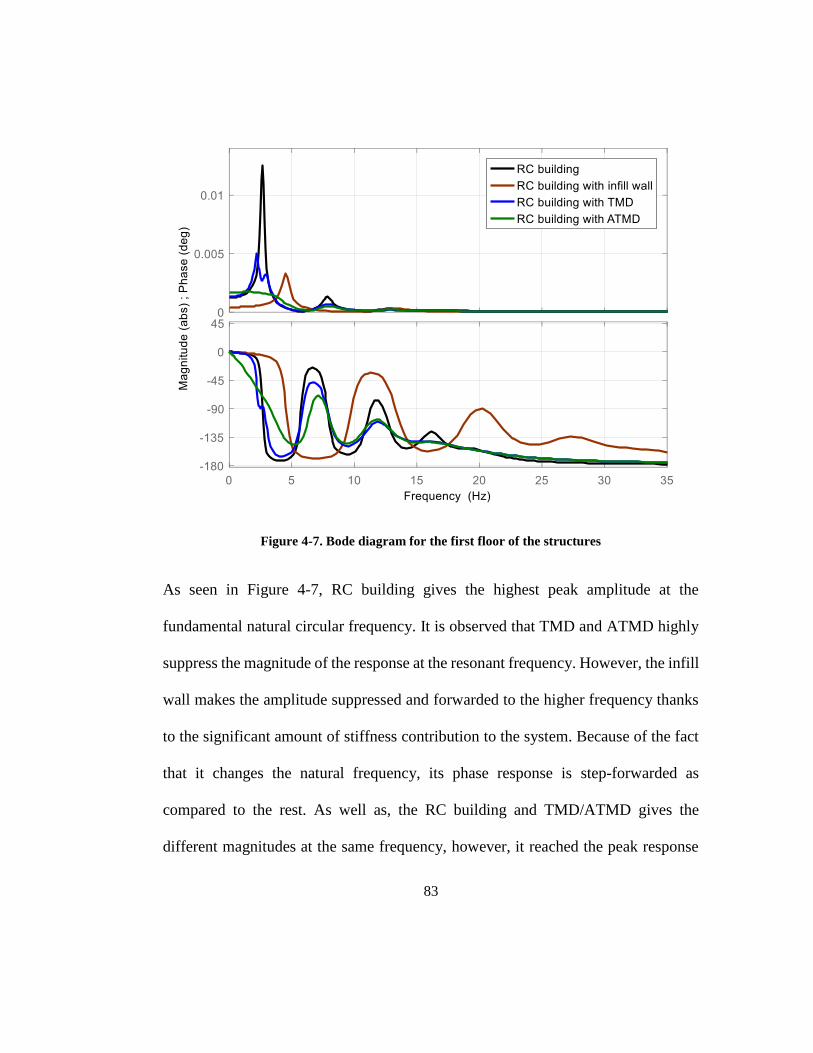
83
Figure 4-7. Bode diagram for the first floor of the structures
As seen in Figure 4-7, RC building gives the highest peak amplitude at the
fundamental natural circular frequency. It is observed that TMD and ATMD highly
suppress the magnitude of the response at the resonant frequency. However, the infill
wall makes the amplitude suppressed and forwarded to the higher frequency thanks
to the significant amount of stiffness contribution to the system. Because of the fact
that it changes the natural frequency, its phase response is step-forwarded as
compared to the rest. As well as, the RC building and TMD/ATMD gives the
different magnitudes at the same frequency, however, it reached the peak response

84
at the different frequency. This is because TMD and ATMD are tuned to the first
natural frequency.
The time history simulations are performed in Matlab/Simulink and it is observed
from the results that the RC building experiences the highest peak amplitude (7.83
mm) in the first floor, see Figure 4-8. When it is respectively retrofitted with the infill
wall, TMD and ATMD, there is a reduction in the peak response of 68%, 17% and
32% on the first floor. Similarly, the reductions in the roof floor are respectively
69%, 15% and 34% as compared to the bare RC building. There are also significant
reductions in the peak acceleration both the first and the roof floor, see Table 4-6.
The root mean square (RMS) is an important parameter, which is used to measure
the intensity of vibration, to evaluate accumulative structural response and energy.
Table 4-6 also shows the comparison of the RMS results of displacement and
acceleration for each of the structures. A reduction of 71%, 24% and 52% in the first-
floor absolute acceleration is obtained under El Centro excitation. For the roof floor,
the reductions are respectively founded 70%, 18% and 50% which are slightly
different comparing the first-floor reduction except the RC building with ATMD.

85
Figure 4-8. The first-floor relative displacements of the structures

86
Table 4-6. The response of the structures
Type of
structures
Displacements Accelerations
The first floor The top floor The first floor The top floor
Peak
(mm)
RMS
(mm)
Peak
(mm)
RMS
(mm)
Peak
(mm/s2)
RMS
(mm/s2)
Peak
(mm/s2)
RMS
(mm/s2)
RC building 7.83 1.5 32.88 5.9 2640 435.8 9260 1641
RC building
with infill wall 2.47 0.43 10.06 1.74 2150 314.3 7800 1284
RC building
with TMD 6.47 1.14 27.79 4.81 2417 285.4 8167 1122
RC building
with ATMD 5.29 0.72 21.11 2.91 2636 222.1 5933 728
The inter-story drift is another useful response quantity for structural (earthquake)
engineers and an indicator of structural performance, especially for high-rise
buildings. Inter-story drifts can be reduced in the first floor from 0.26% to 0.08%,
0.22% and 0.17% by strengthening the RC building respectively with infill wall,
TMD and ATMD for El Centro earthquake. It is important to note that the infill wall
was superior to the TMD and ATMD in terms of inter-story drift performance.
87
Figure 4-9. Maximum inter-story drift ratio of the structures.
The input energy (Eir) to a structure is introduced as a new measure of criticality
during an earthquake and it depends proportional to the relationship between relative
velocity and the ground acceleration (Takewaki 2004). The RC building actively
controlled by ATMD has the maximum energy with 393 kN.m as well as its
maximum kinetic energy is the maximum with 34.5 kN.m, because it has the fastest
relative velocity among the others. The RC building with infill wall has the minimum
input energy among the others, which means that it is subjected to less dynamic
energy under earthquake loadings. Furthermore, the structure, controlled by TMD is
with the earthquake input energy (191 kN.m), which is less than the one with ATMD.
Thus, in this circumstance, ground accelerations and actuator energy are playing an
important role in the input energy of the structures, see Table 4-7.

88
The strain energy is another indicator to test structural performance and it has a
strong relationship to the structural damages. The bearing systems of a structure;
columns and beams have capacities that can dissipate energy safely. If those
capacities are exceeded, structural damages could be the outcome under earthquakes.
In a comparison of the strain energy between the models, the bare RC building has
the highest strain energy of Ea=69 kN.m. The RC building with infill wall has the
lowest strain energy of Ea=41.9 kN.m, followed by the building model with TMD
with Ea= 51.2 kN.m and building model with ATMD with Ea=55.8 kN.m. This is
because strengthening the RC building by the infill wall significantly increases the
lateral load capacity, so it maximizes the response reduction among others.
Figure 4-10. Total energy diagraphs for the model structures

89
In the damping energy of the structures, there are gradually increased from 50.5 to
241.2 kN.m, by implementing, in acceding order, of the TMD and ATMD on the
bare RC building, which is dissipating energy effectively. However, the infill wall
implementation decreases the damping energy to the 50.5 kN.m. The active and
passive controllers dissipate the dynamic energy by taking advantages of the phase
difference between the controller mass and the main structure, on the other hand, the
infill wall can reduce the undesirable energy by increasing lateral load and damping
capacity, in addition, the bare structure. In short, it is obvious that the structure with
infill wall performs the best among others, however, the performance of the structure
with TMD and ATMD can be upgraded by adding multiple TMDs either at the first
or any floors and the actuators on the bare system to increase the effectiveness and
to suppress undesirable response and energy, see Table 4-7.
Table 4-7. The total energy of the structures
Type of
structures
The total energy
Peak kinetic
energy
(Ekr)(kN.m)
Damping
energy
(Ed)(kN.m)
Strain
energy
(Ea)(kN.m)
Input
energy
(Eir)(kN.m)
Actuator
energy
(Eac) (kN.m)
RC building 27.1 100 69 169 N/A
RC building
with infill wall 5.4 50.5 41.9 92.4 N/A
RC building
with TMD 19.7 140 51.2 191 N/A
RC building
with ATMD 34.5 241.2 55.8 393 96

90
4.6: Summary
The purpose of this chapter was to examine and investigate the effect of the masonry
infill wall, which is generally neglected when the structure is subjected to dynamic
loading. Additionally, the RC building is passively (TMD) and actively (ATMD)
controlled for comparison purposes and for verifying the effectiveness of the infill
wall. The following conclusions were pointed out from the numerical results:
1. The infill wall has a significant effect on the fundamental frequency of the
structure, which is also vital in tuning process of TMD and ATMD, especially
in case the structure with infill wall layout wants to be controlled actively and
passively. As well as, infill wall increases significantly the rigidity (190%
increase) and the damping (150% increase) of the structures when it is fully
symmetrically placed into the frame and it performs as a structural element
during an earthquake.
2. The strain energy (Ea) has a strong relationship to the damage level of the
structural components. Thus, the infill wall, which has the lowest the strain
energy, could be the securest energy dissipater system in terms of energy
instead of using TMD and ATMD.

91
3. The infill wall is very effective to restrict inter-story drift ratio as compared
to the others because its damping and stiffness contribution to the bare RC
building is very sufficient.
4. In the RMS and peak displacement/acceleration for the first and roof floor,
the performance infill wall is superior to the rest. Therefore, the infill wall
can be used for structural control thanks to mostly be used in real life, simple
to construct, its cost and its performance without external energy, and
mechanical components as compared to TMD and ATMD controller,
5. The performance of the active control device (ATMD) depends mostly upon
the amount of external source of energy, which is driven by a control
methodology such as LQR.
92
Chapter 5 Integrated Control System (ICS) under Bidirectional
Seismic Loading Case
Torsion irregularity is one of the main failure reasons that buildings can undergo
during a strong dynamic excitation due to earthquakes or wind gusts. This is because
it does not only have devastating effects in the torsional direction but also leads to
excessive destructive effects in the lateral directions. Therefore, ignoring the
torsional irregularity in the seismic design analysis can cause unexpected damages
and losses. To enhance the safety and performance of the buildings, most of the
current seismic provision deals with this irregularity with two main ways. The first
is computing torsional moment at each floor by using equations provided in various
current seismic code provisions. After they are applied to each floor, the seismic
analysis will be performed. The second is shifting the center of mass (CM) or
stiffness (CS) to eliminate the eccentricity by putting additional masses, structural
components braced frame systems on buildings or control systems applied on
structures which can be passively and actively controlled. In this research, two-way
eccentric Benchmark 9-story steel building, constructed for SAC project in
California, is picked for analysis purpose. Each floor is represented by two
translational and one rotational degree of freedom. Firstly, traditional passive energy
dissipating device is cross frames (CFs) placed into moment resisting frames of the

93
Benchmark building and the best placement was selected. Secondly, Tuned mass
dampers (TMDs) were designed and applied from the center of mass (CM) through
translational directions under bi-directional seismic loads such as N-S and E-W
components of El Centro in 1940, North-Ridge in 1994 and Kocaeli, Turkey in 1999.
The performance evaluation for the CFs and TMDs were obtained. Finally, the new
integrated control system (ICS) is proposed and employed in the Benchmark
building. In conclusion, the research focus is on the performance evaluation of the
ICS as compared to other stated control systems.
5.1: Introduction
The development of advanced technologies and structural material in the 21st
century have led to taller and more flexible buildings using lighter materials. This
trend makes buildings less damping and becoming more susceptible to dynamic
loadings such as severe wind gusts and earthquakes especially for those having
complex shapes where torsion becomes an issue. Torsional irregularity exists when
the center of mass (CM) and stiffness (CS), which is the distribution of the lateral
load-resisting members within a story, including braced frames, moment frames, and
walls, are not coincident. In such condition, the structures will tend to twist as well
as deflect horizontally under an earthquake excitation (Ross, El Damatty, and El
Ansary 2015; FEMA 750 2009), see Figure 5-1.

94
(a)
(b)
Figure 5-1. Three-dimensional civil structure representation and its torsional mode:
(a) elevation view; (b) bird’s eye view
The traditional method to protect the buildings against torsional sensitivity is by
adding the bracing systems into structure frames. It is a simple and effective way to
enhance the safety and performance especially for torsionally irregular buildings
(TIBs) under bidirectional earthquake excitations because it does not only increase
the lateral and torsional load capacity, but also eliminate the lack of coincidence

95
between CM and CS. The system can be a v- or x-bracing frame system or masonry
infill wall for steel (Emrah Erduran and Ryan 2010; Damjan and Fajfar 2005; Chen,
Lai, and Mahin 2004) and reinforced concrete structure (Akyurek 2014) respectively.
Many innovative smart control systems have been developed so far to protect the
structures very effectively against severe earthquake and wind loads. The most
commonly and intensively used passive control system, thanks to its simplicity and
cost, is a tuned mass damper (TMD), which adds external damping, stiffness, and
mass to the main structure without using any external energy sources (J. P. D. E. N.
Hartog 1985; C. Li 2000b). However, TMD has its drawbacks. It can be tuned only
to the fundamental frequency of the structure so that it is effective only in the small
range of frequency. It may have little or no effect on the other modes other than the
one that is used for its tuning process in the scenario of a dynamic load. Therefore,
Xu and Igusa, 1992 (Xu and Igusa 1992) first proposed to use a multi-tuned mass
damper (MTMD) to enhance the effectiveness. Additionally, the MTMD has been
studied by tuning to different natural frequencies, in order to increase system stability
at a wide range of frequencies (Igusa and Xu 1994; Yamaguchi and Harnpornchai
1993; Jangid 1995b; Park and Reed 2001; Sadek et al. 1997; Lavan 2017b; Shetty
and Krishnamoorthy 2011; Gill et al. 2017b).
Many researchers (Jangid and Datta 1997; Pansare and Jangid 2003b; C. Li and Qu
2006) have studied the response control of two degrees of freedom (one translation
96
and one rotation) torsional systems by a set of MTMDs. Lin et al., 2000 (C. C. Lin,
Ueng, and Huang 2000) studied the response reduction of a multi-story torsional
building (with two translations and one rotation at each floor) system with one and
two tuned mass dampers. Singh et al., 2002 (Singh, Singh, and Moreschi 2002)
studied the response control of a multi-story tensional building (with two translations
and one rotation at each floor) system with four tuned mass dampers, placed along
two orthogonal directions in pairs.
(Desu, Deb, and Dutta 2006) investigated on an arrangement of tuned mass dampers,
called coupled tuned mass dampers (CTMDs), where a mass is connected by
translational springs and viscous dampers in an eccentric manner. They presented
comparative studies between CTMDs, conventional TMDs, and bi-directional TMDs
in terms of effectiveness and robustness in controlling coupled lateral and torsional
vibrations of asymmetric buildings.
(Tse et al. 2007) conducted a study to demonstrate the suppression of the wind-
induced three-dimensional lateral-torsional motions on a wind-excited benchmark
tall building using a bi-directional tuned mass damper (TMD) incorporating two
magnetorheological dampers (MR). Each one was placed in each orthogonal
direction in order to perform as a semi-active control system, which means as a smart
tuned mass damper (STMD). The optimal control forces generated by the MR

97
dampers were driven by the linear quadratic regulator (LQR) to penalize the story
accelerations.
Ueng, Lin, and Wang 2008 proposed a new design procedure in torsionally coupled
3-D buildings in order to reduce the dynamic responses of structures subjected to
bilateral earthquake excitations (recorded at the 1979 El Centro earthquake), by
incorporating passive tuned mass dampers (PTMDs). They have considered some
practical design issues such as the optimal location for installation, movement
direction, and numbers of PTMDs. The PTMD optimal parameters for the tuning
process are obtained by minimizing the mean square displacement response ratio.
Additionally, they have tested the parametric planar position and the detuning effect
of the PTMD to see if they influence the response control effectiveness.
J. L. Lin, Tsai, and Yu 2010 studied the control of the structural response by using a
coupled tuned mass damper (CTMD) in one-way asymmetric-plan buildings. They
investigated respectively the design of CTMDs compared to TMDs, the physical
system transformation and the effectiveness of the CTMD, which is with and without
dampers, in reducing the vibrations of asymmetric-plan structures by comparing
three model structures. J. L. Lin, Tsai, and Yu 2011 proposed bi-directional coupled
tuned mass dampers (BiCTMDs) for the seismic response control of two-way
asymmetric-plan buildings under bi-directional ground motions. The performance of
the proposed BiCTMD was examined by investigating the reductions of the

98
amplitudes of the associated frequency response functions for the elastic seismic
response of two-way asymmetric-plan buildings.
M. S. Rahman et al. 2017 proposed an adaptive multiple tuned mass damper,
distributed along with the story height to control the seismic response of the structure.
He proved its efficiency by making seismic analysis in a 10-story building comparing
this with a single tuned mass damper and with multi-tuned mass dampers under
picked real-saved earthquake excitations.
He, Wang, and Xu 2017 proposed a new type of tuned mass damper with tuned mass
blocks, orthogonal poles, and torsional pendulums (TMDPP). The translation-
torsion coupled vibration is tuned by the movement of the mass blocks and the
torsional pendulums. The damping effect of the traditional TMD and the TMDPP is
compared, and the results show that the performance of TMDPP is superior to the
traditional TMD.
According to the current researches, significant attention has currently been paid on
the torsional response control by one or a set of TMDs. The improvements are overall
achieved using several traditional TMDs or the optimization of the TMDs placed in
either the same or two orthogonal directions. However, only a few researchers
concentrate on the innovation approach about the new configuration and the form of
TMD or MTMDs according to the structural and ground motion characteristics. In
99
this research, a new Integrated Control System (ICS), which utilizes a new
configuration of TMDs, is proposed. The new control design approach was applied
to the two-way eccentric Benchmark 9-story steel building, constructed for the SAC
project in California, where each floor was represented by two translational and one
rotational degree of freedom. The performance and effectiveness of the ICS were
examined and compared with the Cross Frames (CFs), Tuned Mass Dampers
(TMDs) approach under the data from the real earthquake excitations of N-S and E-
W components of El Centro in 1940, Loma Prieta in 1989, and Kocaeli, Turkey in
1999.
5.2: Integrated Control System
A traditional tuned mass damper (TMD) is only effective in the direction placed and
only effective in the frequency of the main structure tuned. Hence, it does not have
any or little effects in controlling the torsional response. In order to levitate this
limitation in the research, the ICS will be proposed, which is not only effective in
horizontal directions but also effective in the torsional direction. A three-dimensional
illustration of the proposed ICS and its implementation is shown in Figure 5-2.

100
Figure 5-2. 3-D illustration of the three-story civil structure and the proposed control system
representation
The ICS consists of two TMDs along two horizontal axes of the structure. It employs
appropriate linear spring, linear damper, and additional mass into the main structure
to ensure TMDs can dissipate undesirable energy conveniently. Additionally, the
TMDs are placed in each orthogonal directions and they can either move orthogonal
or torsional direction with the help of the rigid rod and global bearing systems (tires).
The motion of the TMDs in torsional direction is restricted by torsional damper
located at the CM and torsional springs, which one end is attached to the rigid rod
(not the mass of the TMDs) and other end is fixed to the floor. One mass in the ICS
system can be used by a TMD as well as being used as a mass of the pendulum
system with the aid of the proposed system configuration. This can make the system
more feasible because it is not always possible to add multiple masses. They can be

101
very heavy to be carried on the top floor of the main structures. The structural design
configuration of the ICS is shown in Figure 5-2.
The masses of TMDs will move back and forward from the equilibrium position in
the two horizontal directions as well as rotational direction when the structure is
subjected to earthquake excitations. They produce the inertia forces due to relative
displacements and the rotational inertia force with the help of the rigid rod. While
the linear damper and spring of TMDs will produce damping force and restoring
force, the torsional damper and spring will provide suitable damping and restoring
force into the system. Hence, the structural responses can be effectively controlled
in the two orthogonal directions as well as in the rotational direction by the ICS.
Compared to the traditional TMDs in the orthogonal directions, the Integrated
Control System (ICS) has the following advantages:
(1) It employs Multi Tuned Mass Dampers (MTMD) and other components such
as a torsional damper, springs, rigid rod and global bearing system to
cooperate with each other as a single control system, which is effective in
controlling torsional response in addition to the lateral responses.
(2) One mass can be used for both a TMD and pendulum system thanks to the
rigid rod, so this can make the system more feasible, because it is not always

102
possible to add multiple masses, which might be too much to be carried by,
on the top floor of the main structures.
(3) The torsional response reduction can be substantially obtained and the tuning
design of the ICS is flexible because it depends upon the initial length of the
TMD, the damper and spring parameters, the mass ratio and the location of
the ICS, so the ICS is highly capable of enhancing the control capacity of the
structure conveniently in multi-directions.
(4) The control system can be easily strengthened by the translational and
torsional actuator in order to improve the performance and safety of the
structures against especially under the lateral/torsional vibrations and
structural/ground motion uncertainties.
5.3: Equation of Motion
A torsionally irregular one-story shear building, which is under the effects of
bidirectional earthquake excitation in horizontal directions, has three degrees of
freedom (DOF) for each story including lateral displacement in two directions and
rotation at the center of the mass. In this structure, x(t) represents translational motion
in the x-direction, y(t) is translational motion in the y-direction, θ(t) is the angular
motion with respect to time.

103
(a) (b)
Figure 5-3. One story two-way eccentric building: (a) Building 3-D view; (b) control system
representation
The 3-D view of a torsionally coupled structure and the proposed control system can
be seen in Figure 5-3a and Figure 5-3b. The center of stiffness and mass are
represented with CS and CM respectively. The distance between these centers is
shown with ex and ey. It is assumed that the location of the center of mass is lumped
at the center of each floor. Lx and Ly are the lengths of the structure in the x- and y-
direction, respectively and h is the height of the structure. The displacements and
velocities of the center of stiffness and mass in translational directions and torsional
direction can be mathematically expressed as follow;

104
The location of the CS
[
𝑥𝑠𝑦𝑠𝜃𝑠] = [
𝑥(𝑡)
𝑦(𝑡)
𝜃(𝑡)] and [
��𝑠��𝑠��𝑠
] = [
��(𝑡)
��(𝑡)
��(𝑡)
]
The location of the CM with respect to the CS
[
𝑥𝑚𝑦𝑚𝜃𝑚] = [
𝑥(𝑡) − 𝑒. 𝑐𝑜𝑠(𝜃)
𝑦(𝑡) − 𝑒. 𝑠𝑖𝑛(𝜃)
𝜃(𝑡)] and [
��𝑚��𝑚��𝑚
] = [
��(𝑡) + 𝑒. ��(𝑡) 𝑠𝑖𝑛(𝜃)
��(𝑡) − 𝑒. ��(𝑡)𝑐𝑜𝑠 (𝜃)
��(𝑡)
]
Figure 5-4. The simplified equivalent of the structure with the ICS
One story building and the ICS applied in the x-direction and y-direction are
respectively simplified and the Lagrangian energy method is to choose to derive the
equation of motion. The kinetic and potential energy is therefore computed for each
link in polar coordinate. We realized that it moves in between x and y like open-chain

105
robotic arms as seen in Figure 5-4, where CRot denotes the center of rotation. The
position and velocity of the md1 and md2 are then given by
[𝑥1𝑦1] = [
{𝐿1 + 𝑟1(𝑡)}𝑐𝑜𝑠(𝜃1)
{𝐿1 + 𝑟1(𝑡)}𝑠𝑖𝑛(𝜃1)] , [𝑥2𝑦2] = [
−{𝐿2 + 𝑟2(𝑡)}𝑠𝑖𝑛(𝜃2)
{𝐿2 + 𝑟2(𝑡)}𝑐𝑜𝑠(𝜃2)]
[��1��1] = [
𝑐𝑜𝑠(𝜃1) −{𝐿1 + 𝑟1(𝑡)}𝑠𝑖𝑛(𝜃1)
𝑠𝑖𝑛(𝜃1) {𝐿1 + 𝑟1(𝑡)}𝑐𝑜𝑠(𝜃1)] [��1(𝑡)
��1(𝑡)]
[��2��2] = [
−𝑠𝑖𝑛(𝜃2) −{𝐿2 + 𝑟2(𝑡)}𝑐𝑜𝑠(𝜃2)
𝑐𝑜𝑠(𝜃2) −{𝐿2 + 𝑟2(𝑡)}𝑠𝑖𝑛(𝜃2)] [��2(𝑡)
��2(𝑡)]
Lagrange energy method for each state variable where i is equal to respectively s, 1
and 2 as follow;
𝑑
𝑑𝑡(
𝜕𝑇
𝜕��𝑖 , 𝜕��𝑖 , 𝜕��𝑖) − (
𝜕𝑇
𝜕𝑥𝑖, 𝜕𝑦𝑖 , 𝜕𝜃𝑖) + (
𝜕𝑅
𝜕��𝑖, 𝜕��𝑖 , 𝜕��𝑖)
+ (𝜕𝑉
𝜕𝑥𝑖 , 𝜕𝑦𝑖 , 𝜕𝜃𝑖) = 𝐹𝑥𝑖,𝑦𝑖,𝜃𝑖
(92)
Where the kinetic energy is T, the potential energy is denoted V, the Rayleigh’s
dissipation function is represented with R and external force is symbolled as F for
each dynamic component of the system by assuming that there is no friction and
gravitational effect on the control system.
The kinetic energy of the main system is
𝑇 =
1
2𝑀(��𝑚
2 + ��𝑚2) +
1
2𝐼𝑚(��𝑚)
2+1
2𝑚𝑑1(��1
2 + ��12)
+1
2𝑚𝑑2(��2
2 + ��22)
(93)

106
𝑇 =
1
2𝑀((��(𝑡) + 𝑒. ��(𝑡) 𝑠𝑖𝑛(𝜃))2 + (��(𝑡) − 𝑒. ��(𝑡)𝑐𝑜𝑠 (𝜃))2)
+1
2𝐼𝑚(��𝑚)
2+1
2𝑚𝑑1(��1
2 + ��12)
+1
2𝑚𝑑2(��2
2 + ��22)
𝑑
𝑑𝑡(𝜕𝑇
𝜕��) = 𝑀��(𝑡) + 𝑀𝑒𝑦��(𝑡),
𝑑
𝑑𝑡(𝜕𝑇
𝜕��) = 𝑀𝑒𝑦��(𝑡) + 𝑀𝑒𝑦
2��(𝑡)
𝑑
𝑑𝑡(𝜕𝑇
𝜕��) = 𝑀��(𝑡) − 𝑀𝑒𝑥��(𝑡),
𝑑
𝑑𝑡(𝜕𝑇
𝜕��) = −𝑀𝑒𝑥��(𝑡) + 𝑀𝑒𝑥
2��(𝑡)
𝑑
𝑑𝑡(𝜕𝑇
𝜕��) = 𝐼𝑚��(𝑡)
𝑑
𝑑𝑡(𝜕𝑇
𝜕��1) = 𝑚𝑑1��1,
𝑑
𝑑𝑡(𝜕𝑇
𝜕��1) = 𝑚𝑑1��1(𝐿1 + 𝑟1)
2
𝑑
𝑑𝑡(𝜕𝑇
𝜕��2) = 𝑚𝑑2��2,
𝑑
𝑑𝑡(𝜕𝑇
𝜕��2) = 𝑚𝑑2��2(𝐿2 + 𝑟2)
2
The potential energy of the main system is
𝑉 =
1
2𝐾𝑥𝑥𝑠
2 +1
2𝐾𝑦𝑦𝑠
2 +1
2𝐾𝜃𝜃(𝑡)
2
+1
2𝑘𝑑1[(𝑥1
2 − 𝑥2) + (𝑦12 − 𝑦2)]
+1
2𝑘𝑞1(𝜃1(𝑡) − 𝜃(𝑡))
2
+1
2𝑘𝑑2[(𝑥2
2 − 𝑥2) + (𝑦22 − 𝑦2)]
+1
2𝑘𝑞2(𝜃2(𝑡) − 𝜃(𝑡))
2
(94)

107
𝑉 =
1
2𝐾𝑥𝑥𝑠
2 +1
2𝐾𝑦𝑦𝑠
2 +1
2𝐾𝜃𝜃(𝑡)
2
+1
2𝑘𝑑1[(𝐿1 + 𝑟1(𝑡))
2 + 𝑥(𝑡)2 + 𝑦(𝑡)2 + 𝑒2
− 2𝑒(𝑥(𝑡) 𝑐𝑜𝑠(𝜃) + 𝑦(𝑡) 𝑠𝑖𝑛(𝜃)) − 2(𝑥(𝑡)(𝐿1+ 𝑟1(𝑡))𝑐𝑜𝑠(𝜃1)) + 𝑦(𝑡)(𝐿1 + 𝑟1(𝑡))𝑠𝑖𝑛(𝜃1)
− 𝑒𝑥{𝐿1 + 𝑟1(𝑡)}𝑐𝑜𝑠(𝜃1) − 𝑒𝑦{𝐿1 + 𝑟1(𝑡)}𝑠𝑖𝑛(𝜃1))]
+1
2𝑘𝑞1(𝜃1(𝑡) − 𝜃(𝑡))
2
+1
2𝑘𝑑2[(𝐿2 + 𝑟2(𝑡))
2 + 𝑥(𝑡)2 + 𝑦(𝑡)2 + 𝑒2
− 2𝑒(𝑥(𝑡) 𝑐𝑜𝑠(𝜃) + 𝑦(𝑡) 𝑠𝑖𝑛(𝜃)) − 2(−𝑥(𝑡)(𝐿2+ 𝑟2(𝑡))𝑠𝑖𝑛(𝜃2)) + 𝑦(𝑡)(𝐿2 + 𝑟2(𝑡))𝑐𝑜𝑠(𝜃2)
+ 𝑒𝑥{𝐿2 + 𝑟2(𝑡)}𝑠𝑖𝑛(𝜃2) − 𝑒𝑦{𝐿2 + 𝑟2(𝑡)}𝑐𝑜𝑠(𝜃2))]
+1
2𝑘𝑞2(𝜃2(𝑡) − 𝜃(𝑡))
2
Equations are linearized if the displacements are assumed small so that
𝑐𝑜𝑠(𝜃1) 𝑎𝑛𝑑 𝑐𝑜𝑠(𝜃2) ≈ 1 and 𝑠𝑖𝑛(𝜃1) ≈ 𝜃1, 𝑠𝑖𝑛(𝜃2) ≈ 𝜃2. When Tyler series
expansion is used to linearize the nonlinear system about the equilibrium position
(𝑥(𝑡), 𝑦(𝑡)𝑎𝑛𝑑 𝜃(𝑡) = 0 ), the constants are going to be zero like 𝑘𝑑1𝑒𝑥 or 𝑘𝑑1𝐿1.
Hence the constants are not taken into account while constructing the stiffness
matrix. The linearized equations can be derived and then the potential energy
partially becomes as:
𝜕𝑉
𝜕𝑥= 𝐾𝑥𝑥(𝑡) + 𝑘𝑑1{𝑥(𝑡) − 𝑒𝑥 − (𝐿1 + 𝑟1(𝑡))}
+ 𝑘𝑑2{𝑥(𝑡) − 𝑒𝑥 + (𝐿2 + 𝑟2(𝑡))𝜃2(𝑡)}
𝜕𝑉
𝜕𝑦= 𝐾𝑦𝑦(𝑡) + 𝑘𝑑1{𝑦(𝑡) − 𝑒𝑦 − (𝐿1 + 𝑟1(𝑡))𝜃1(𝑡)}
+ 𝑘𝑑2{𝑦(𝑡) − 𝑒𝑦 − (𝐿2 + 𝑟2(𝑡))}
𝜕𝑉
𝜕𝜃= 𝐾𝜃𝜃(𝑡) + 𝑘𝑞1(𝜃(𝑡) − 𝜃1(𝑡)) + 𝑘𝑞2(𝜃(𝑡) − 𝜃2(𝑡))

108
𝜕𝑉1𝜕𝑟1
= 𝑘𝑑1𝐿1 + 𝑘𝑑1𝑟1(𝑡) − 𝑘𝑑1{𝑥(𝑡) − 𝑒𝑦𝜃1(𝑡)}
𝜕𝑉1𝜕𝜃1
= −𝑘𝑑1 {𝑦(𝑡)(𝐿1 + 𝑟1(𝑡)) − 𝑒𝑦{𝐿1 + 𝑟1(𝑡)}}
+ 𝑘𝑞1(𝜃1(𝑡) − 𝜃(𝑡))
𝜕𝑉2𝜕𝑟2
= 𝑘𝑑2𝐿2 + 𝑘𝑑2𝑟2(𝑡) − 𝑘𝑑2{𝑦(𝑡) + 𝑒𝑥𝜃2(𝑡)}
𝜕𝑉2𝜕𝜃2
= −𝑘𝑑2{−𝑥(𝑡)(𝐿2 + 𝑟2(𝑡)) + 𝑒𝑥{𝐿2 + 𝑟2(𝑡)}}
+ 𝑘𝑞2(𝜃2(𝑡) − 𝜃(𝑡))
The Rayleigh’s dissipation function is
𝑅 =
1
2𝐶𝑥��(𝑡)
2 +1
2𝐶𝑦��(𝑡)
2 +1
2𝐶𝜃��(𝑡)
2
+1
2𝑐𝑑1((��1 − ��𝑚)
2 + (��1 − ��𝑚)2)
+1
2𝑐𝑞1(��1(𝑡) − ��(𝑡))
2
+1
2𝑐𝑑2((��2 − ��𝑚)
2 + (��2 − ��𝑚)2)
+1
2𝑐𝑞2(��2(𝑡) − ��(𝑡))
2
(95)

109
𝑅 =
1
2𝐶𝑥��(𝑡)
2 +1
2𝐶𝑦��(𝑡)
2 +1
2𝐶𝜃��(𝑡)
2
+1
2𝑐𝑑1{��1(𝑡)
2 + [(𝐿1 + 𝑟1(𝑡))2]��1(𝑡)
2 + ��(𝑡)2
+ ��(𝑡)2 + 𝑒2��(𝑡)2 + 2��(𝑡)(��(𝑡)𝑒𝑦 − ��(𝑡)𝑒𝑥)
− 2[��1(𝑡)��(𝑡) + ��1(𝑡)��(𝑡)𝑒𝑦 + (𝐿1
+ 𝑟1(𝑡)). {��(𝑡)��1(𝑡) − 𝑒𝑥��(𝑡)��1(𝑡)}]}
+ 𝑐𝑞1(��1(𝑡) − ��(𝑡))2
+1
2𝑐𝑑2 {��2(𝑡)
2 + [(𝐿2 + 𝑟2(𝑡))2]��2(𝑡)
2 + ��(𝑡)2
+ ��(𝑡)2 + 𝑒2��(𝑡)2 + 2��(𝑡)(��(𝑡)𝑒𝑦 − ��(𝑡)𝑒𝑥)
− 2 [−��2(𝑡)��(𝑡)𝑠𝑖𝑛(𝜃2) + ��2(𝑡)��(𝑡)𝑐𝑜𝑠(𝜃2)
− ��2(𝑡)��(𝑡) (𝑒𝑦𝑠𝑖𝑛(𝜃2) + 𝑒𝑥𝑐𝑜𝑠(𝜃2)) − (𝐿2
+ 𝑟2(𝑡)){��(𝑡)��2(𝑡)𝑐𝑜𝑠(𝜃2) + ��(𝑡)��2(𝑡)𝑠𝑖𝑛(𝜃2)
− 𝑒𝑦��(𝑡)��2(𝑡)𝑐𝑜𝑠(𝜃2) + 𝑒𝑥��(𝑡)��2(𝑡)𝑠𝑖𝑛(𝜃2)}]}
+ 𝑐𝑞1(��1(𝑡) − ��(𝑡))2
Equations are linearized if the displacements are assumed small so that
𝑐𝑜𝑠(𝜃1), 𝑐𝑜𝑠(𝜃2) ≈ 1 and 𝑠𝑖𝑛(𝜃1), 𝑠𝑖𝑛(𝜃2) ≈ 0. The linearized equations can be
derived and then the kinetic energy partially becomes as:
𝜕𝑅
𝜕��= 𝐶𝑥��(𝑡) + 𝑐𝑑1��(𝑡) + 𝑐𝑑1𝑒𝑦��(𝑡) − 𝑐𝑑1��1(𝑡) + 𝑐𝑑2��(𝑡)
+ 𝑐𝑑2𝑒𝑦��(𝑡) + 𝑐𝑑2(𝐿2 + 𝑟2(𝑡))��2(𝑡)
𝜕𝑅
𝜕��= 𝐶𝑦��(𝑡) + 𝑐𝑑1��(𝑡) − 𝑐𝑑1𝑒𝑥��(𝑡) − 𝑐𝑑1(𝐿1 + 𝑟1(𝑡))��1(𝑡)
+ 𝑐𝑑2��(𝑡) − 𝑐𝑑2𝑒𝑥��(𝑡) − 𝑐𝑑2��2(𝑡)
𝜕𝑅
𝜕��= 𝐶𝜃��(𝑡) + 𝑐𝑑1𝑒
2��(𝑡) + 𝑐𝑑1𝑒𝑦��(𝑡) − 𝑐𝑑1𝑒𝑥��(𝑡) − 𝑐𝑑1��1(𝑡)𝑒𝑦
+ 𝑐𝑑1𝑒𝑥(𝐿1 + 𝑟1(𝑡))��1(𝑡) + 𝑐𝑞1(��(𝑡) − ��1(𝑡))
+ 𝑐𝑑2𝑒2��(𝑡) + 𝑐𝑑2𝑒𝑦��(𝑡) − 𝑐𝑑2𝑒𝑥��(𝑡) + 𝑐𝑑2𝑒𝑥��2(𝑡)
− 𝑐𝑑2𝑒𝑦(𝐿2 + 𝑟2(𝑡)��(𝑡) + 𝑐𝑞2 (��(𝑡) − ��2(𝑡))

110
𝜕𝑅
𝜕��1= 𝑐𝑑1��1(𝑡) − 𝑐𝑑1��(𝑡) − 𝑐𝑑1𝑒𝑦��(𝑡)
𝜕𝑅
𝜕��1= 𝑐𝑑1(𝐿1 + 𝑟1(𝑡))
2��1(𝑡) − 𝑐𝑑1(𝐿1 + 𝑟1(𝑡))��(𝑡) + 𝑐𝑑1𝑒𝑥(𝐿1
+ 𝑟1(𝑡))��(𝑡) + 𝑐𝑞1(��1(𝑡) − ��(𝑡))
𝜕𝑅
𝜕��2= 𝑐𝑑2��2(𝑡) − 𝑐𝑑2��(𝑡) + 𝑐𝑑2𝑒𝑥��(𝑡)
𝜕𝑅
𝜕��2= 𝑐𝑑2(𝐿2 + 𝑟2(𝑡))
2��2(𝑡) + 𝑐𝑑2(𝐿2 + 𝑟2(𝑡))��(𝑡) − 𝑐𝑑2𝑒𝑦(𝐿2
+ 𝑟2(𝑡))��(𝑡) + 𝑐𝑞2(��2(𝑡) − ��(𝑡))
Assume that (𝐿1 + 𝑟1) and (𝐿2 + 𝑟2) are constants and bounded as
𝐿1 + 𝑟1(𝑡)𝑚𝑖𝑛 ≤ (𝐿1 + 𝑟1) ≤ 𝐿1 + 𝑟1(𝑡)
𝑚𝑎𝑥 (96)
𝐿2 + 𝑟2(𝑡)𝑚𝑖𝑛 ≤ (𝐿2 + 𝑟2) ≤ 𝐿2 + 𝑟2(𝑡)
𝑚𝑎𝑥 (97)
Where 𝐿1 and 𝐿2 are the initial length of the linear damper and spring and 𝑟1(𝑡) and
𝑟2(𝑡) are the diagonal response of the ICS seismic load.
The mass matrix, stiffness, and damping become as follow;
𝑀𝑠𝑡
𝑀𝑥 0 𝑀𝑒𝑦 . . . 0 0 𝑀𝑦 −𝑀𝑒𝑥 . . . . 𝑀𝑒𝑦 −𝑀𝑒𝑥 𝐼𝑚 0 . . .
. . 0 𝑚𝑑1 0 . .
. . . 0 𝐼𝑑1 0 . . . . . 0 𝑚𝑑2 0 0 . . . . 0 𝐼𝑑2
where 𝑴 𝑎𝑛𝑑 𝑲𝒙, 𝑲𝒚 are the mass and stiffness of the main structure in the x and y-
translational directions. 𝑰𝒎 and 𝑲𝜽 are the polar mass of inertia and torsional
stiffness of the main structure and are computed, see Eqs. (97) and (98).
𝑒𝑥 = 𝑒. 𝑐𝑜𝑠(𝜃) , 𝑒𝑦 = 𝑒. 𝑠𝑖𝑛(𝜃) (98)

111
𝑟𝑥 =
𝐵
√12, 𝑟𝑦 =
𝐷
√12, 𝑟 = √𝑟𝑥
2 + 𝑟𝑦2 (99)
𝐿 = √(𝑟2 + 𝑒2) (100)
𝐼𝑚 = 𝑀. 𝐿2, 𝐼𝑑1 = 𝑚𝑑1(𝐿1 + 𝑟1)2, 𝐼𝑑2 = 𝑚𝑑2(𝐿2 + 𝑟2)
2 (101)
𝐾𝜃 = 𝐾𝑥 .
𝐿𝑦2
2+ 𝐾𝑦.
𝐿𝑥2
2
(102)
𝐾𝑠𝑡
𝐾𝑥 + 𝑘𝑑1+ 𝑘𝑑2
0 . −𝑘𝑑1 . . 𝑘𝑑2(𝐿2+ 𝑟2)
0 𝐾𝑦 + 𝑘𝑑1+ 𝑘𝑑2
. . −𝑘𝑑1(𝐿1+ 𝑟1)
−𝑘𝑑2 .
. . 𝐾𝜃 + 𝑘𝑞1
+ 𝑘𝑞2 0 −𝑘𝑞1 . −𝑘𝑞2
−𝑘𝑑1 . 0 𝑘𝑑1 𝑘𝑑1𝑒𝑦 . .
0 −𝑘𝑑1(𝐿1+ 𝑟1)
−𝑘𝑞1 𝑘𝑑1𝑒𝑦 𝑘𝑞1 0 .
. −𝑘𝑑2 . . 0 𝑘𝑑2 −𝑘𝑑2𝑒𝑥
𝑘𝑑2(𝐿2 + 𝑟2) . −𝑘𝑞2 . . −𝑘𝑑2𝑒𝑥 𝑘𝑞2
𝐶𝑠𝑡
𝐶𝑥 + 𝑐𝑑1+ 𝑐𝑑2
0 (𝑐𝑑1 + 𝑐𝑑2)𝑒𝑦 −𝑐𝑑1 . . 𝑐𝑑2(𝐿2+ 𝑟2)
0 𝐶𝑦 + 𝑐𝑑1+ 𝑐𝑑2
−(𝑐𝑑1+𝑐𝑑2)𝑒𝑥 . −𝑐𝑑1(𝐿1 + 𝑟1) −𝑐𝑑2 .
(𝑐𝑑1+ 𝑐𝑑2)𝑒𝑦 −(𝑐𝑑1+𝑐𝑑2)𝑒𝑥
𝐶𝜃 + 𝑐𝑞1 + 𝑐𝑞2 + (𝑐𝑑1+ 𝑐𝑑2)𝑒
2 −𝑐𝑑1𝑒𝑦
−𝑐𝑞1 + 𝑐𝑑1𝑒𝑥(𝐿1+ 𝑟1)
𝑐𝑑2𝑒𝑥 −𝑐𝑞2− 𝑐𝑑2𝑒𝑦(𝐿2+ 𝑟2)
−𝑐𝑑1 . −𝑐𝑑1𝑒𝑦 𝑐𝑑1 0 . .
0 −𝑐𝑑1(𝐿1+ 𝑟1)
−𝑐𝑞1 + 𝑐𝑑1𝑒𝑥(𝐿1 + 𝑟1) 0 𝑐𝑞1+ 𝑐𝑑1(𝐿1 + 𝑟1)
2 . .
. −𝑐𝑑2 𝑐𝑑2𝑒𝑥 . . 𝑐𝑑2 .
𝑐𝑑2(𝐿2+ 𝑟2)
. −𝑐𝑞2 − 𝑐𝑑2𝑒𝑦(𝐿2 + 𝑟2) . . . 𝑐𝑞2+ 𝑐𝑑2(𝐿2+ 𝑟2)
2
5.3.1: State-space Representation
The equation of motion, for a two-way eccentric structure, can be mathematically
expressed as follow
[𝑀𝑠𝑡]{��(𝑡)} + [𝐶𝑠𝑡]{��(𝑡)} + [𝐾𝑠𝑡]{𝛿(𝑡)} = −[𝑀𝑠𝑡]{Γ}��𝑔 (103)

112
Where, 𝑴𝒔𝒕 , 𝑪𝒔𝒕 , and 𝑲𝒔𝒕 are respectively the nxn matrix of mass, damping, and
stiffness of the structure. 𝜹(𝒕) is the n dimensional displacement vector to the base
excitation and 𝜞 is the modification vector of the earthquake excitation.
{𝛿(𝑡)} =
{
𝑥(𝑡)𝑦(𝑡)𝜃(𝑡)𝑟1(𝑡)𝜃1(𝑡)𝑟2(𝑡)𝜃2(𝑡)}
, {��(𝑡)} =
{
��(𝑡)��(𝑡)
��(𝑡)��1(𝑡)
��1(𝑡)��2(𝑡)
��2(𝑡)}
, {��(𝑡)} =
{
��(𝑡)��(𝑡)
��(𝑡)��1(𝑡)
��1(𝑡)��2(𝑡)
��2(𝑡)}
��𝑔={��𝑔��𝑔}, and {Γ} =
[ 1001000
0100010]
Then the state-space representation of Eq. 12 can be written as:
��(𝑡) = 𝐴𝑍(𝑡) + 𝐵��𝑔(𝑡) (104)
𝑋(𝑡) = 𝐶𝑟𝑍(𝑡) + 𝐷𝑟��𝑔(𝑡) (105)
𝑍(𝑡) = [
𝛿(𝑡)
��(𝑡)], 𝐴 = |
𝑧𝑒𝑟𝑜𝑠(𝑛, 𝑛) 𝑒𝑦𝑒(𝑛, 𝑛)
−𝑀𝑠𝑡−1𝐾𝑠𝑡 −𝑀𝑠𝑡
−1𝐶𝑠𝑡|, 𝐵 = [
𝑧𝑒𝑟𝑜𝑠(𝑛, 2)−𝛤
] (106)
𝐶𝑟 = [𝑒𝑦𝑒(𝑛, 𝑛) 𝑧𝑒𝑟𝑜𝑠(𝑛, 𝑛)], 𝐷𝑟 = [𝑧𝑒𝑟𝑜𝑠(𝑛, 1)] (107)
Where Z(t) is the (2nx1) state vector, A is the (2nx2n) system matrix, B is the (2nx2)
input matrix, and Cr (nx2n) and Dr (nx2) are the output matrix and the direct
transmission matrix, respectively. They are defined according to the desired output.
In this condition, the desired output of state space is the displacements.

113
5.4: Design Procedure
Before applying the proposed ICS to the main structure, the equivalent dynamic
properties (Mu, Cu, and Ku) of the main structure for two orthogonal and torsional
directions need to be computed. Then the geometric properties (ex, ey, and rx, ry) of
the main structure are carried out, Table 5-2. After obtaining the dynamic and
geometric characteristics of the main structure, the fundamental frequencies for the
first-three dominant-modes are found by solving the eigenvalue problem, see Table
5-1. Hereafter, the first traditional TMD is placed from CM through x-direction,
while the second TMD is implemented in the y-direction. They are tuned to the first-
two orthogonal modes and acquired the design parameters (μ1, L1, ξd1, kd1, cd1 and
μ2, L2, ξd2, kd2, cd2) where they are respectively mass ratio, initial length damping
ratio, stiffness and damping constants for the first and second traditional TMDs.
Right now, we can compute total length (L1+r1max and L2+r2
max) of torsional
pendulum parts of ICS, which is bounded by the initial length of linear damper/spring
and the maximum response of TMDs under selected input earthquake excitations.
The ICS is tuned by using generalized Den Hartog equations in the torsional direction
and the dynamic properties for torsional spring and damping constants of the first
and second TMDs connected (kq1, cq1, and kq2, cq2) are obtained, see Figure 5-5. Now,
the ICS is ready to be implemented, and its performance will be compared with the

114
traditional TMDs in the orthogonal direction which they have the same dynamic
properties and mass ratio with the ICS, see Table 5-1.
Design
Producure of
ICS
Determine the equivalent properties of the main
structures in two orthogonal and torsional
directions
Geometric
characteristic
Dynamic
characteristic
rx, ry, r
Compute gyration and the location of
the center of mass and stiffness
CM and CS
ex, ey, e
μ1, L1, ξd1, kd1, cd1
μ2, L2, ξd2, kd2, cd2
Tunning
Process
TR-TMD in y-direction
Tunning
Process
Results
Analysis
L1+r1max
L2+r2max
μq, kq1, cq1, kq2, cq2
Tunning for torsional damper and
springs
After time history analysis
under bidirectional loading
AnalysisStructure with ICS
Select tuning
frequency
TR-TMD in x-direction
wx
wy
wθ
Mst, Cst, Kst
Mu, Cu, Ku
Figure 5-5. Structural design and analysis procedure of the structure with the ICS

115
5.4.1:Optimum Dynamic Property
There are significant optimum parameters to suppress the response of the main
structure by using TMD, which are a mass ratio, tuning natural frequency ratio and
damping ratio. The first thing is done by selecting the effective mass ratio of the
structure and TMD in orthogonal directions as µ𝒊 =𝒎𝒅𝒊
𝒎= 5%, where md1 and md2 are
the mass of TMDs. The mass ratio of the ICS for torsional direction (𝝁𝒒𝒖) can be
governed by using Eq. (108). The structural damping ratio (𝝃) is assumed to be 2%
and the frequencies of the structure governed can be computed by Eq. (110). The
damping ratio (𝝃𝒅𝒊) and natural frequency (𝝎𝒅𝒊) of the TMDs are obtained by using
generalized Den Hartog equations (I. M. Abubakar & B. J. M. Farid 2012).
𝜇𝑞𝑢 =
𝐼𝑑1 + 𝐼𝑑2∑ 𝐼𝑚
(108)
𝜉𝑑𝑖 = √
3µ
8(1 + µ)+0.1616 𝜉
1 + µ 𝑜𝑟 𝜉𝑞𝑖 = √
3𝜇𝑞𝑢8(1 + 𝜇𝑞𝑢)
+0.1616 𝜉
1 + 𝜇𝑞𝑢 (109)
𝜔𝑖 = √𝐾𝑥𝑀𝑥
, √𝐾𝑦
𝑀𝑦 𝑜𝑟 √
𝐾𝜃𝐼𝑚
(110)
𝜔𝑑𝑖 = 𝑞𝑖 𝜔𝑖 (111)
In which, qi is the frequency ratio of the TMD and the structure, obtained as:
𝑞𝑖 =
1
1 + µ(1 − 1.5906 𝜉 )√
µ
1 + µ (112)

116
Then, the stiffness and damping coefficients of the ICS and TMD in torsional and
translational directions can be computed by governing Eq. (22) and (23). It is
tabulated as seen in Table 5-1.
𝑘𝑑𝑖 = 𝑚𝑑𝑖𝜔𝑖2𝑜𝑟 𝑘𝑞𝑖 = 𝐼𝑑𝑖𝜔𝑖
2 (113)
𝑐𝑑𝑖 = 2𝜉𝑑𝑖√𝑘𝑑𝑖𝑚𝑑𝑖 𝑜𝑟 𝑐𝑞𝑖 = 2𝜉𝑑𝑖√𝑘𝑑𝑖𝑚𝑑𝑖 (114)
Table 5-1. The first three fundamental frequencies of the main structure and design properties
of the TMDs and the ICS
Main
structure
TMD design properties in orthogonal directions
L1 kd1 cd1 L2 kd2 cd2
wx (rad/sec)
(m) (kN/mm) (kN.s/mm) (m) (kN/mm) (kN.s/mm)
12.87 10 66.67 1.57 10 23.91 0.94
wy (rad/sec)
ICS design properties in torsional direction
7.71 L1+r1max kq1 cq1 L2+r2
max kq2 cq2
wθ (rad/sec)
(m) (kN.mm/rad) (kN.mm.s/rad) (m) (kN.mm/rad) (kN.mm.s/rad)
20.88 10.18 1.90E+10 2.02E+08 10.20 1.91E+10 2.03E+08
5.5: Model Overview
5.5.1: Description of Benchmark building
In the details of the Benchmark 9-story steel structure, the columns are simply
connected to the ground and made of 345 MPa steel. The bays are 9.15m between
two axes in both horizontal directions with 5 bays in the x- and y-direction. The
columns are wide-flange and the orientation of them are illustrated in Figure 5-6a.
Moment resisting frames (MRFs) and simply connected frames (SCFs) are defined

117
as seen in Figure 5-6b. The interiors bays of the structures are the simple connection
with the composite floor. The floors are composite structures, defined as rigid
diaphragms, which provides the relative response to one another for each node under
dynamic loading. The floors and bays are comprised of 248 MPa steel acting together
at each floor level. The seismic mass of the ground level is 9.65×10⁵ kg, for the first
level is 1.01×10⁶ kg, for the second through eighth levels is 9.89×10⁵ kg and for the
ninth level is 1.07×10⁶ kg. The seismic mass of the above ground levels of the entire
structure is 9.00×10⁶ kg. The 9-story N-S MRF is depicted in Figure 5-7a. For further
detailed information about the structural design, the readers refer to (Ohtori et al.
2004).
(a) (b)
Figure 5-6. The 9-story Benchmark buildings modified it from [31] and [32]: (a) Plan view and
column orientations; (b) Connection types of frames

118
5.5.2: The Simplified Equivalent System
Assuming that the slab for each floor behaves as a rigid diaphragm, all horizontal
loads transfer directly to the columns. The response for each node of the floor is
relative to one another under an earthquake force. All structures are simplified with
two translational (x and y) and one rotational (θ) degree of freedom in each story,
see Figure 5-7b.
(a) (b)
Figure 5-7. The nine-story Benchmark building: (a) Elevation-views; (b) simplified equivalent
system
Assuming that shear deformation in elements are neglected and there is a 10%
moment reduction at the splices. The lateral stiffness of moment resisting frames

119
(MRFs) can be computed similarly for any values Ib and Ic using frame stiffness
(Chopra 2000), see Eq. 24 and Eq. 25. For the simple-connected frames, the stiffness
contribution is taken into account by governing Eq. 26. Total stiffness for each floor
is obtained as seen in Table 5-2.
𝑘 =
24 𝐸 𝐼𝑐
ℎ312 𝜌 + 1
12 𝜌 + 4 (115)
𝜌 =
𝐼𝑏
4𝐼𝑐 (116)
𝑘 =
3 𝐸 𝐼𝑐
ℎ3 (117)
where 𝒌 is the equivalent stiffness for a simple connected frame and a moment
resisting frame (MRF), 𝝆 is the beam-to-column stiffness ratio, 𝑰𝒄 and 𝑰𝒃 are
respectively moment of inertia for selected beams and columns, 𝑬 is the elasticity of
the material and 𝒉 is the height of the floor. The inherent (geometric) eccentricity of
the structure for each floor is calculated and taken as , see Table 5-2.
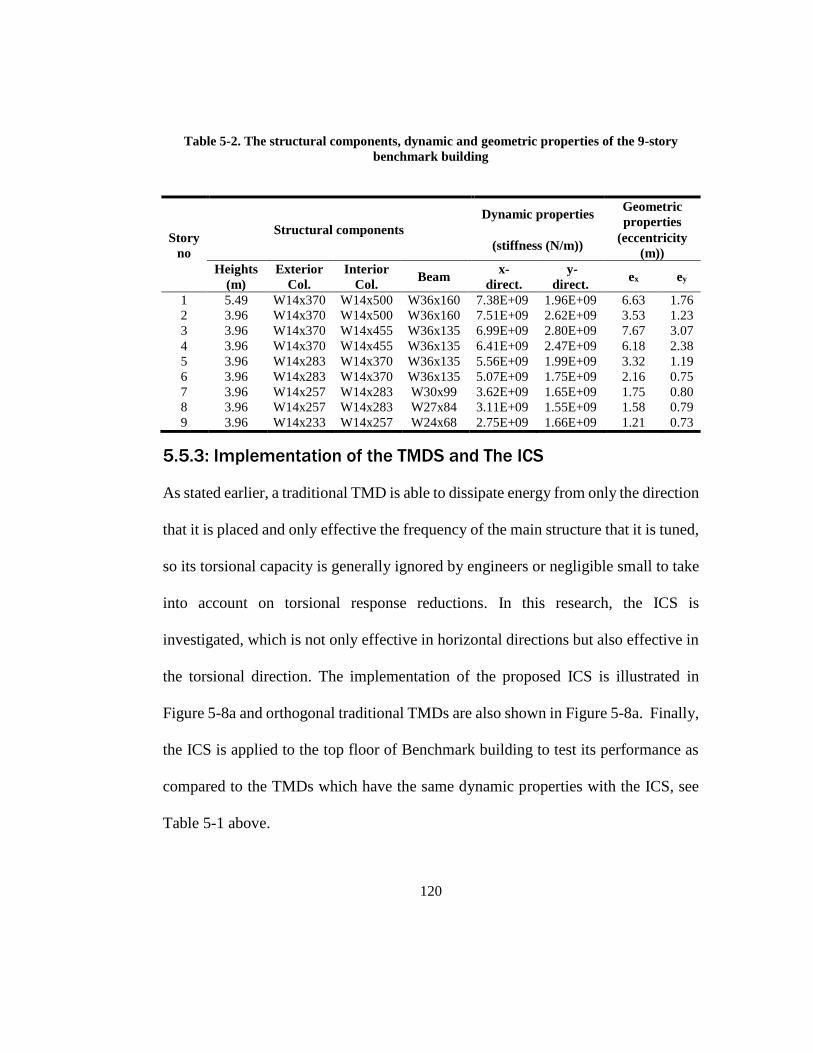
120
Table 5-2. The structural components, dynamic and geometric properties of the 9-story
benchmark building
Story
no
Structural components
Dynamic properties Geometric
properties
(stiffness (N/m)) (eccentricity
(m))
Heights
(m)
Exterior
Col.
Interior
Col. Beam
x-
direct.
y-
direct. ex ey
1 5.49 W14x370 W14x500 W36x160 7.38E+09 1.96E+09 6.63 1.76
2 3.96 W14x370 W14x500 W36x160 7.51E+09 2.62E+09 3.53 1.23
3 3.96 W14x370 W14x455 W36x135 6.99E+09 2.80E+09 7.67 3.07
4 3.96 W14x370 W14x455 W36x135 6.41E+09 2.47E+09 6.18 2.38
5 3.96 W14x283 W14x370 W36x135 5.56E+09 1.99E+09 3.32 1.19
6 3.96 W14x283 W14x370 W36x135 5.07E+09 1.75E+09 2.16 0.75
7 3.96 W14x257 W14x283 W30x99 3.62E+09 1.65E+09 1.75 0.80
8 3.96 W14x257 W14x283 W27x84 3.11E+09 1.55E+09 1.58 0.79
9 3.96 W14x233 W14x257 W24x68 2.75E+09 1.66E+09 1.21 0.73
5.5.3: Implementation of the TMDS and The ICS
As stated earlier, a traditional TMD is able to dissipate energy from only the direction
that it is placed and only effective the frequency of the main structure that it is tuned,
so its torsional capacity is generally ignored by engineers or negligible small to take
into account on torsional response reductions. In this research, the ICS is
investigated, which is not only effective in horizontal directions but also effective in
the torsional direction. The implementation of the proposed ICS is illustrated in
Figure 5-8a and orthogonal traditional TMDs are also shown in Figure 5-8a. Finally,
the ICS is applied to the top floor of Benchmark building to test its performance as
compared to the TMDs which have the same dynamic properties with the ICS, see
Table 5-1 above.

121
(a) (b)
Figure 5-8. A schematic representative of (a) the ICS and (b) TMDs at the top floor of the
Benchmark building
5.5.4: Cross Frame System
In order to mitigate not only lateral vibrations but also twisting of the structure, there
are three cross frames placements into Benchmark 9-story steel structure’s MRFs are
pre-determined by the consideration of eliminating eccentricity between CM and CR
of each floor, see Figure 5-9a and see Figure 5-9b.

122
(a) (b)
Figure 5-9. Different placements of the x-bracing system in moment resisting frames (MRFs):
(a) in the plan view and (b) A-A elevation view of Benchmark building for Case 1
As seen in see Figure 5-98, the placements of Case 1 in the plan view is illustrated
in section a and its crosponding A-A elevation views are provided in section b. Cross
frames (CFs) are placed from ground level to the top floor without any discontinuityy
in the determined frames. For this reason, for Case 2 and Case 3, there are only plan
views of the placement of cross frames provided, see Figure 5-10a and Figure 5-10b.
In addition, the section properties of Benchmark building structural components and
used braced frames for each floor are tabulated in Table 5-3. For the cross frame
placements, HSS section is selected with different section properties for each floor.
Assuming that each cross frame strut are connected to the mainframe as a pin
connection and its damping ratio are taken by 100% increase as compared the
Benchmark structure.
Ø

123
(a) (b)
Figure 5-10. X-bracing placement in the plan view of the Benchmark building for (a) Case 2
and (b) Case 3
Table 5-3. The Benchmark building structural components and steel sections used in the
braced frames
Story
no
Heights
(m)
Exterior
Column
Interior
Column Beam Brace
1 5.49 W14x370 W14x500 W36x160 HSS 14x14x7/8
2 3.96 W14x370 W14x500 W36x160 HSS 14x14x7/8
3 3.96 W14x370 W14x455 W36x135 HSS 12x12x5/8
4 3.96 W14x370 W14x455 W36x135 HSS 12x12x5/8
5 3.96 W14x283 W14x370 W36x135 HSS 12x12x5/8
6 3.96 W14x283 W14x370 W36x135 HSS 12x12x5/8
7 3.96 W14x257 W14x283 W30x99 HSS 10x10x5/8
8 3.96 W14x257 W14x283 W27x84 HSS 10x10x5/8
9 3.96 W14x233 W14x257 W24x68 HSS 8x8x1/2
In this research, three different placements of the x-bracing system, (Case 1, Case 2
and Case 3) will be taken into account of seismic analysis, and the most effective
placement will be selected to compare with the proposed ICS.

124
Table 5-4. Calculated eccentricities in the x- and y- directions for the bare Benchmark
building and its application with respect to Case 1, Case 2 and Case 3
The bare
Benchmark Case 1 Case 2 Case 3
ex (m) ey (m) ex (m) ey (m) ex (m) ey (m) ex (m) ey (m)
6.63 1.76 4.21 -2.58 2.53 -2.58 3.37 -1.01
3.53 1.23 2.58 -1.76 1.34 -1.76 1.96 -0.58
7.67 3.07 6.12 0.12 5.20 0.12 5.66 1.00
6.18 2.38 4.84 -0.52 3.86 -0.52 4.35 0.44
3.32 1.19 2.52 -1.52 1.42 -1.52 1.97 -0.45
2.16 0.75 1.60 -1.92 0.42 -1.92 1.01 -0.77
1.75 0.80 1.27 -1.64 0.01 -1.64 0.64 -0.60
1.58 0.79 1.09 -1.73 -0.31 -1.73 0.39 -0.65
1.21 0.73 0.92 -1.11 -0.20 -1.11 0.36 -0.31
Table 5-5. The geometric property and the contributions of the used cross frame systems into
MRFs
Story
no Brace
Geometric property Contributions
Ac
(m)
Abr
(m)
W
(kg/m)
Lbr
(m)
rbr
(m)
Angle
(Ø)
W
(kg)
Lateral
Stiff.
(N/m)
Torsional
stiff.
(N/m)
1 HSS
14x14x7/8 0.03 3.13 20.68 2.77 10.67 30 3530.70 1.06E+09 2.18E+10
2 HSS
14x14x7/8 0.03 3.13 20.68 2.77 9.97 23 3298.93 6.95E+08 1.39E+10
3 HSS
12x12x5/8 0.02 2.70 12.90 2.39 9.97 23 2057.84 4.41E+08 8.91E+09
4 HSS
12x12x5/8 0.02 2.70 12.90 2.39 9.97 23 2057.84 4.41E+08 8.91E+09
5 HSS
12x12x5/8 0.02 2.70 12.90 2.39 9.97 23 2057.84 4.41E+08 8.91E+09
6 HSS
12x12x5/8 0.02 2.70 12.90 2.39 9.97 23 2057.84 4.41E+08 8.91E+09
7 HSS
10x10x5/8 0.01 2.26 10.55 2.01 9.97 23 1682.96 3.43E+08 7.01E+09
8 HSS
10x10x5/8 0.01 2.26 10.55 2.01 9.97 23 1682.96 3.43E+08 7.01E+09
9 HSS
8x8x1/2 0.01 1.82 6.75 1.61 9.97 23 1076.78 2.21E+08 4.56E+09

125
5.5.4.3: Determining the Best Placement of CFs
After time history analyses are made under three selected real saved earthquake
ground motions, the peak responses of the placements of the cross frame compared
with one another including the bare Benchmark building. The results show that all
three cross frame placements are successfully surpassed the lateral vibrations and
there are slightly different for the peak response of the cross frame placements,
however, for torsional vibration control, only Case 3 is significantly reduced for both
tuning (El Centro and detuning (Loma Prieta and Kocaeli) cases, see Table 5-6.
Therefore, Case 3 is determined and selected for comparison purpose to test the
performance of the proposed control system (ICS).
Table 5-6. Peak response of the case structures under bidirectional loadings
Structure
El Centro Loma Prieta Kocaeli
Peak response Peak response Peak response
x-
direc.
y-
direc.
θ-
direc.
x-
direc.
y-
direc.
θ-
direc.
x-
direc.
y-
direc.
θ-
direc.
The Bare
Benchmark 8.242 10.658 0.117 4.384 17.102 0.143 6.292 13.188 0.194
Case 1 6.850 7.468 0.132 3.675 16.827 0.129 5.806 10.378 0.160
Case 2 6.851 7.463 0.130 3.668 16.854 0.080 5.812 10.399 0.146
Case 3 6.872 7.458 0.080 3.677 16.851 0.071 5.823 10.391 0.133
5.5.5: Ground Motion Selections
There are a lot of strong earthquakes has been occurred in the last century. In order
to test the influence of the ground motion characteristics on the proposed control
system, in this study, some of the most devastating and strong real-life earthquake

126
data were acquired from the database (“CEE 221: Structural Analysis IΙ” n.d.). The
dynamic responses of the system were evaluated under N-S and W-E components of
the real earthquake excitations of El Centro in 1940 from the station of Imperial
Valley Irrigation District, Loma Prieta in 1989 from the station of Channel 1 and
Channel 3 and Kocaeli earthquake in 1999 from the station of the general director of
meteorology of Duzce District, see Table 5-7. The accelerations vs time data are
illustrated in Figure 5-11.
Table 5-7. The selected real-saved earthquakes characteristics
Earthquake
input Recording station
PGA (Peak Ground
Acceleration) Domin
ant
direct. N-S comp.
(m/s2)
W-E comp.
(m/s2) El Centro Imperial Valley Irrigation District in 1940 3.417 2.101 N-S (x)
Loma Prieta Oakland Outer Harbor Wharf Channel 1
and Channel 3 in 1989 2.155 2.704
Nearly
both
Kocaeli The general director of meteorology of
Duzce District in 1999 2.197 3.543 W-E (y)
(a)

127
(b)
(c)
Figure 5-11. The N-S and E-W components of the saved real-life earthquake data: (a) El
Centro; (b) Loma Prieta; (c) Kocaeli earthquake
5.6: Simulation Results and Discussion
The SAC Benchmark 9-story steel structure was picked, and the analyses were
conducted on the Benchmark building by retrofitting it with the two Tuned Mass
Dampers (TMDs) in two orthogonal directions and Integrated Control System (ICS)
as shown in Figure 5-8 and with Cross Frames (CFs), see Figure 5-9 and Figure 5-10.
In order to test the performance of the proposed ICS under the bidirectional loading
case, the two TMDs -which have the same dynamic properties with ICS- were placed

128
in two orthogonal directions and the best placement (Case 3) of Cross Frames (CFs)
was selected. The dynamic analysis results for the Benchmark building and its
respective application with the TMDs and the ICS and the CFs were obtained and
compared with each other.
While tuning TMDs to the first two translational directions (7.706 rad/s and 12.868
rad/s), the ICS were tuned to the first two translational and rotational directions to
the fundamental frequency (7.706 rad/s, 12.868 rad/s, and 20.880 rad/s) of the
Benchmark building. The first five modal frequencies of the model structures are
tabulated in Table 5-8. As understood from the Table 5-8, whereas the contribution
of the CFs placement into the lateral bearing system of the Benchmark building
increases overall of the natural frequencies, for instance, the first mode is increased
by 12% (from 7.71 to 8.7), the TMDs and ICS control decreases over all modes.
Table 5-8. The first five modal frequencies of the structures
Modal
frequency
(rad/s)
Benchmark
building
Benchmark
building
with CFS
Benchmark
building with
TMDs
Benchmark
building
with ICS
1st mode 7.71 8.70 6.37 6.57
2nd mode 12.87 13.43 8.74 9.03
3rd mode 20.88 23.55 10.52 10.59
4th mode 26.19 26.27 14.71 14.79
5th mode 33.25 34.87 21.01 18.86

129
The frequency responses (transfer functions), which are independent of the
characteristics of the earthquake inputs, were selected to test the effectiveness of the
proposed ICS in the seismic response control of the structures. The amplitudes of the
top floor x- and y-translational and rotational (coupling due to eccentricity)
frequency responses, respectively, are shown in from Figure 5-12 to Figure 5-15.
It is observed that the second mode dominates the x-response when the building is
subjected to x-directional ground excitation as seen in Figure 5-12, while the first
mode controls y-response when it is subjected to y-directional ground excitation, see
Figure 5-12. Therefore, the ICS and TMDs were designed to control the 2nd vibration
mode of the Benchmark building for the first TMD, placed in the x-direction and
control the 1st vibration mode for the second TMD, applied in the y-direction. The
properties of the ICS and TMDs are computed and shown in Table 5-1.

130
Figure 5-12. Top floor displacement transfer functions for the Benchmark building and its
application with cross frames, the TMDs and the ICS in the x-translational direction (x9)
Figure 5-13. Top floor displacement transfer functions for models in the y-translational
direction (y9)

131
Figure 5-14. Top floor displacement transfer functions for xθ9-coupling direction
Figure 5-15. Top floor displacement transfer functions for yθ9-coupling direction

132
As seen in from Figure 5-12 to Figure 5-15., the amplitude of the frequency response
of the Benchmark building with the ICS are substantially reduced not only in
translational directions, but also especially in rotational (coupling) directions
compared to the cases where the Benchmark building is only equipped with the
individual TMDs in orthogonal directions and CFs placements. Thus, the
effectiveness of the proposed ICS for simultaneously reducing the x-and y-
translational and the rotational seismic responses of the elastic two-way eccentric
building was validated.
Table 5-9. The peak and RMS displacement response of the Benchmark building with the
cross frames, TMDs and ICS applications
Type of structures
Displacements on the top floor
Earthquake Peak resp. (cm) or (10-
3rad)
RMS resp. (cm) or
(10-3rad) input
x- y- θ- x- y- θ-
El Centro
Benchmark building 8.25 10.66 0.117 2.03 3.27 0.032
Benchmark building with the
TMDs 6.52 7.56 0.090 1.23 1.49 0.021
Benchmark building with the
ICS 5.16 6.11 0.063 1.01 1.20 0.017
Benchmark building with
cross frames 6.87 7.46 0.080 1.64 1.87 0.024
Loma Prieta
Benchmark building 4.39 17.10 0.143 1.03 5.32 0.035
Benchmark building with the
TMDs 4.07 13.05 0.115 0.74 2.08 0.018
Benchmark building with the
ICS 3.47 12.47 0.091 0.61 2.04 0.013
Benchmark building with
cross frames 3.68 16.85 0.071 0.69 3.72 0.015
Kocaeli
Benchmark building 6.29 13.19 0.194 1.61 4.09 0.033
Benchmark building with the
TMDs 6.12 12.20 0.159 1.02 2.80 0.021
Benchmark building with the
ICS 5.25 10.44 0.143 0.85 1.92 0.018
Benchmark building with
cross frames 5.82 10.39 0.133 1.15 2.35 0.025

133
To perform response history analyses for the structure with the TMDs and the ICS
and the CFs placement, the analytical models need to be accurately constructed and
coded in the structural analytical program package. Therefore, the time history
simulations were performed in Matlab & Simulink, and the results were obtained and
saved for evaluation purpose.
As expected from the results presented in Table 5-9 that the bare Benchmark building
experiences the highest peak amplitude for x- and y-translational and θ-rotational
direction at the top floor when respectively subjected to bidirectional El Centro,
Loma Prieta and Kocaeli bidirectional ground motions. The table also shows the
comparison of the peak and the Root Mean Square (RMS) results, which is used to
measure the intensity of vibration, to evaluate accumulative structural response for
each of the structures. Overall, the performance of the ICS for response reductions
in three directions is substantially improved as compared to the performance of the
orthogonal TMDs and the CFs placements. However, the CFs placements have better
performance when the structure is subjected to especially detuning loadings which
are Loma Prieta and Kocaeli earthquake. The is because of the fact that the
performance of TMD systems depends on the characteristic of the input earthquake
excitation. Overall, the CFs placements are so effective in controlling torsional
response as compared to the TMDs, however, the ICS gives the best responses

134
reductions not only lateral but also torsional directions. By this new configuration of
ICS, the structure becomes more robust to earthquake input characteristics.
Figure 5-16. The peak response reduction percentage for the structures under El Centro (El),
Loma Prieta (LP) and Kocaeli (Koc) earthquakes
Figure 5-17. The RMS response reduction percentage for the structures under El Centro (El),
Loma Prieta (LP) and Kocaeli (Koc) earthquakes

135
It indicates the peak and RMS response reduction in x-, y- and θ-directions for the
building with the TMDs and the ICS and the CFs placements comparing the bare
Benchmark building under the real saved bidirectional ground motions which are El
Centro, Loma Prieta, and Kocaeli earthquake. It is seen from Figure 5-12 and Figure
5-12, the ICS has significantly suppressed the magnitude of the peak and RMS
displacements in the three directions simultaneously as compared to the TMDs and
the CFs placements. It is important to note that the CFs is more efficient to control
the peak response of the structure, however, in RMS response reduction the ICS has
the best performance.
Figure 5-18. Maximum inter-story drift ratio of the structures when subjected to bidirectional
ground excitations of El Centro

136
Figure 5-19. Maximum inter-story drift ratio of the structures when subjected to bidirectional
ground excitations of Loma Prieta
Figure 5-20. Maximum inter-story drift ratio of the structures when subjected to bidirectional
ground excitations of Kocaeli

137
The inter-story drift ratio is a useful response quantity for structural (earthquake)
engineers and an indicator of structural performance, especially for high-rise
buildings. The inter-story drift ratios in the x- and y-directions can be reduced overall
of structures by strengthening the Benchmark building respectively with the Cross
Frames (CFs) placements, the TMDs and the ICS for El Centro, Loma Prieta, and
Kocaeli earthquake. It is noteworthy that the ICS successfully improves the inter-
story drift ratios performance in the translational directions as compared to the CFs
and the TMDs, see Figure 5-18, Figure 5-19, and Figure 5-20.
In developing an energy-based design approach and assessing the damage potential
of structures, it is useful to learn the distribution of earthquake input energy (Eir)
among other energy components: kinetic (Ekr), elastic strain (Ea), and damping (Ed)
(Khashaee et al. 2003). The energy components of the Benchmark building and its
corresponding application with the CFs placements, the TMDs, and the ICS are,
therefore, respectively illustrated in from Figure 5-21to Figure 5-32 for bidirectional
earthquake excitation of El Centro, Loma Prieta, and Kocaeli. The energy
components are also tabulated in Table 5-10.

138
Figure 5-21. The total energy of the bare Benchmark building when subjected to bidirectional
ground excitations of El Centro, 1940
Figure 5-22. The total energy of the Benchmark building with TMDs when subjected to
bidirectional ground excitations of El Centro, 1940

139
Figure 5-23. The total energy of the Benchmark building with ICS when subjected to
bidirectional ground excitations of El Centro, 1940
Figure 5-24. The total energy of the Benchmark building with cross frames (CFs) when
subjected to bidirectional ground excitations of El Centro, 1940

140
Figure 5-25. The total energy of the bare Benchmark building when subjected to bidirectional
ground excitations of Loma Prieta, 1989
Figure 5-26. The total energy of the Benchmark building with TMDs when subjected to
bidirectional ground excitations of Loma Prieta, 1989

141
Figure 5-27. The total energy of the Benchmark building with ICS when subjected to
bidirectional ground excitations of Loma Prieta, 1989
Figure 5-28. The total energy of the Benchmark building with Cross Frames (CFs) when
subjected to bidirectional ground excitations of Loma Prieta, 1989

142
Figure 5-29. The total energy of the bare Benchmark building when subjected to bidirectional
ground excitations of Kocaeli, 1999
Figure 5-30. The total energy of the Benchmark building with TMDs when subjected to
bidirectional ground excitations of Kocaeli, 1999

143
Figure 5-31. The total energy of the Benchmark building with ICS when subjected to
bidirectional ground excitations of Kocaeli, 1999
Figure 5-32. The total energy of the Benchmark building with Cross Frames (CFs) when
subjected to bidirectional ground excitations of Kocaeli, 1999

144
The input energy (Eir) to a structure is a critical measure for structural performance
during an earthquake, and it depends proportional to the relationship between relative
velocity and the ground acceleration (Takewaki 2004). The Benchmark building has
the maximum input energy with 8980 kN.m as well as it's kinetic energy is the
maximum with 38.3 kN.m, while the CFs has the minimum input and kinetic energy
because the Benchmark bare building undergoes the fastest relative velocity among
the others under bidirectional El Centro earthquake excitations. For the Loma Prieta
earthquake, the Benchmark building still has the maximum input energy with 9629
kN.m, while its application with the CFs has the lowest input energy (5292 kN.m).
However, the input energy of the structure with the ICS (8575 kN.m) is larger than
with TMDs (6813 kN.m). This is because the structure with the ICS has relatively
bigger relative velocity as compared to the model with TMDs. Furthermore, under
the bidirectional excitations of Kocaeli earthquake, while the maximum input energy
(10400 kN.m) belongs to the structure with TMDs, the CFs placement has the
minimum energy (3870 kN.m), see Table 5-10. This is due to the fact that the
earthquake input is dominant in the y- translational direction and this can cause
detuning effects for the Loma Prieta and Kocaeli earthquake bidirectional loading
case. That is why the input energy increases, instead of decreasing relative velocity
comparing to the Benchmark building.

145
It is a well-known fact that the earthquake is arbitrary and unpredictable shaking of
the ground, so the Benchmark building and its respective application with the CFs
placement, the TMDs and ICS might be exposed to x-dominant or y- dominant or
both or θ-dominant excitations. In addition to this fact, the effectiveness of TMDs is
dependent upon the characteristics of the input ground motions. Therefore, the tuning
design was made and kept it the same for any loading cases for the first and the
second TMD. The first was placed in the x-direction which is controlled by 2nd mode
and the second is applied in the y-direction controlled by 1st mode of the Benchmark
structure. This design assumption might lead the control systems to experience
detuning effects in case of the dominant direction of the bidirectional loading case,
as seen in Loma Prieta and Kocaeli earthquake.

146
Table 5-10. The total energy of the structures
Earth.
input Type of structures
Total energy
Kinetic
energy
Damping
energy
Strain
energy
Input
energy
(Ekr)(kN.m) (Ed)(kN.m) (Ea)(kN.m) (Eir)(kN.m)
El
Centro
Benchmark building 38.3 5760 3180 8980
Benchmark building with the
TMDs 32.3 7360 1470 8860
Benchmark building with the
ICS 21 6460 1220 7700
Benchmark building with CFs 12.9 3303 2072 5388
Loma
Prieta
Benchmark building 36.7 6724 2869 9629
Benchmark building with the
TMDs 6.5 5950 853 6810
Benchmark building with the
ICS 2.5 7600 970 8570
Benchmark building with CFs 2.3 3815 1475 5292
Kocae
li
Benchmark building 5.4 5380 2650 8030
Benchmark building with the
TMDs 6.3 9022 1369 10400
Benchmark building with the
ICS 2.85 7010 1070 8080
Benchmark building with CFs 10.4 2560 1300 3870
The strain energy is another indicator to test structural performance, and it has a
strong relationship to the structural damages. The bearing systems of a structure;
columns and beams have capacities that can dissipate energy safely. If those
capacities are exceeded, structural damages could be the outcome under earthquakes.
There are gradually decreased in the overall strain by implementing, in acceding
order, of the Benchmark building, the TMD and the ICS on the building under El
Centro and Kocaeli earthquakes, except Loma Prieta, see Table 5-10. This is because
the relative velocity is more dominant to determine the strain energy quantity than
the relative displacement under the Loma Prieta earthquake. The CFs placement has

147
the second lowest strain energy for three loading cases because the placement does
not change the structure dynamic a lot like the TMDs or the ICS systems, it has a big
effect on the increase of the dynamic capacity. In conclusion, using the CFs
placement and the TMDs, and the ICS as a control system on the Benchmark building
increases the strain energy reduction as compared to the bare structure even in the
detuning case like Loma Prieta and Kocaeli earthquakes, but the ICS performance is
superior to others.
Table 5-11. Performance evaluation of the structures
Earthquake
input Type of structures
Performance evaluation
J1 J2 J3
x-
direc.
y-
direc.
x-
direc.
y-
direc.
x-
direc.
y-
direc.
El Centro
Benchmark building - - - - - -
Benchmark building
with the TMDs 0.811 0.711 0.671 0.739 0.720 0.749
Benchmark building
with the ICS 0.659 0.624 0.537 0.690 0.687 0.733
Benchmark building
with CFs 0.883 0.727 0.737 0.777 0.855 0.893
Loma Prieta
Benchmark building - - - - - -
Benchmark building
with the TMDs 0.917 0.757 0.940 0.753 0.658 0.876
Benchmark building
with the ICS 0.803 0.735 0.784 0.747 0.637 0.907
Benchmark building
with CFs 0.832 0.932 0.860 1.001 0.825 1.105
Kocaeli
Benchmark building - - - - - -
Benchmark building
with the TMDs 0.967 0.932 0.948 0.956 0.987 1.055
Benchmark building
with the ICS 0.851 0.794 0.837 0.756 0.984 0.925
Benchmark building
with CFs 0.937 0.798 0.915 0.781 0.990 0.987
148
Table 5-10 shows overall performance evaluation for the control systems; the CFs
placement, the TMDs, and ICS by comparing to the bare Benchmark building. The
notations (J1, J2, and J3) represent performance evaluation, in order, peak drift ratio,
peak acceleration, and peak base shear. There is a substantial reduction for both the
tuning case (El Centro earthquake) and the detuning case (Loma Prieta and Kocaeli
earthquakes). For both tuning and detuning loading case, the values of the peak
responses (J1-J3), are less than one for most of the cases, except that the peak base
shear of the TMDs and the CFs placement in y-direction under respectively Kocaeli
and Loma Prieta earthquakes are slightly higher than the uncontrolled case. Thus, for
this earthquake, the Benchmark building controlled by orthogonal TMDs in x- and
y-direction is negatively affected by detuning effect due to the earthquake input
direction, so it is not as effective as by the ICS for especially detuning cases. All
values with detuning effects are slightly less or greater than the uncontrolled
structure. Under detuning circumstances, overall the ICS performs better than the
TMDs and the CFs placement.
5.7: Summary and Observation
The purpose of this paper was to examine and investigate the performance of the
proposed Integrated Control System (ICS) when subjected to selected bidirectional
ground motions which lead either to tuning effects or to detuning effects.
Additionally, the Benchmark building is controlled by two traditional Tuned Mass

149
Dampers (TMDs), which are respectively applied in the x- and y-direction, for
verifying the effectiveness of the ICS. The following conclusions were pointed out
from the numerical results:
1. The contribution of the CFs placement into the moment resisting frames of
the Benchmark building increases overall of the natural frequencies, for
instance, the first mode is increased by 12%, whereas the TMDs and ICS
control decreases over all modes.
2. There is a substantial reduction of the amplitudes of the frequency response
validated the effectiveness of the ICS in controlling the seismic responses for
two-way eccentric elastic buildings.
3. The CFs placement is so effective especially in controlling torsional response
as compared to the TMDs, however, the ICS gives the best responses
reductions not only lateral but also torsional directions by the new
configuration of ICS. Thus, the structure becomes more robust with the ICS
to earthquake input characteristics.
4. Unlike traditional TMDs placed in two orthogonal directions, the ICS is more
comprehended to control not only two orthogonal (x- and y-) directions, but
also effectively control rotational (θ-) direction. By means of the proposed
system configuration, the structures first-three dominants modes can
150
effectively be controlled by the ICS regardless of any external energy
sources.
5. The tuning design of the ICS is flexible since it depends on design parameters
such as the initial lengths, the linear/torsional dampers, and springs
coefficients, the mass ratio, and the location of the ICS. The ICS is, therefore,
highly capable of enhancing the control capacity of the structure conveniently
in multi-directions. With the help of the flexible design of ICS, the torsional
response is substantially reduced.
6. The ICS is also more robust in restricting the inter-story drift ratio as
compared with TMDs. It sufficiently mitigates the RMS and peak
displacement on the top floor of the Benchmark building. Thus, the ICS has
a better performance than the TMDs and the CFs placement in terms of
response reductions.
7. The strain energy (Ea) has a strong relationship with the damage level of the
structural components. Despite the detuning effect of the proposed ICS for
two-way eccentric buildings, the results show that it can significantly reduce
the strain energy demands. Thus, the ICS is also effective in reducing the
potential seismic damage to two-way asymmetric-plan buildings under
bidirectional ground excitations.

151
8. According to the performance evaluation criteria, there are substantial
reductions for both the tuning case (El Centro) and the detuning case (Loma
Prieta and Kocaeli earthquakes). For both cases, the performance indexes are
overall less than the bare Benchmark building and its respective application
with the TMDs. Therefore, the effectiveness of ICS performance is verified.

152
Chapter 6 Active Integrated Control System (AICS) under
Bidirectional Loading Case
6.1: Introduction
One of the effective active energy absorbers is the active tuned mass dampers
(ATMDs) which are accepted by structural engineers to substantially reduce
structural response when the structure is subjected to seismic loads. However, they
may not be always a comprehensive way in reducing structural responses especially
for high-rise buildings with irregularity in plan and elevation, where the building is
exposed to a significant amount of excessive torsion can be caused by lateral
vibrations due to those irregularities during a strong earthquake. Therefore in this
chapter, the new Active Integrated Control System (AICS) configuration, which is
for effectively surpassing the torsional motion as well as the lateral translational
vibrations, is introduced.
While two actuators, which are fixed to each orthogonal directions, are used to apply
the control forces to the ATMDs, the AICS has the same actuators with a bearing
system which allows the system to dissipate undesirable vibration in two directions
as well as torsional direction. For both systems (ATMDs and AICS), the optimal
forces are generated by the actuators which are driven by a linear quadratic regulator

153
(LQR) controller. To show the performance of the AICS, the new configuration of
the AICS was applied to the Benchmark 9-story steel building subjected to selected
earthquakes and compared with the performance of the conventional ATMDs.
6.2: Optimum Vibration Control by the AICS
6.2.1: Model Overview and Configuration
The active tuned mass dampers (TMDs) system has two masses, md1 and md2, that
are connected with appropriate damper and spring in two orthogonal directions. They
are only effective in the direction that they are placed and tuned, namely, not useful
for controlling in torsional motion. There are two linear actuators, which apply the
controlling forces in two orthogonal directions, are attached to the TMDs at the one
side and another side is fixed to the floor as seen in Figure 6-1.
The composition of the passive ICS explained in section 5.2, is strengthened by the
same dynamic properties of the actuators with ATMDs stated above. These actuators
can move by the help of the global bearing system which allows the linear actuator
to control torsional motion with this design configuration. The structural design
configuration of the AICS is shown in Figure 6-2.

154
Figure 6-1. Configurations of the active tuned mass dampers (ATMDs) in two orthogonal
direction
Figure 6-2. Configurations of the active integrated control system (AICS) with two linear
actuators in two orthogonal directions
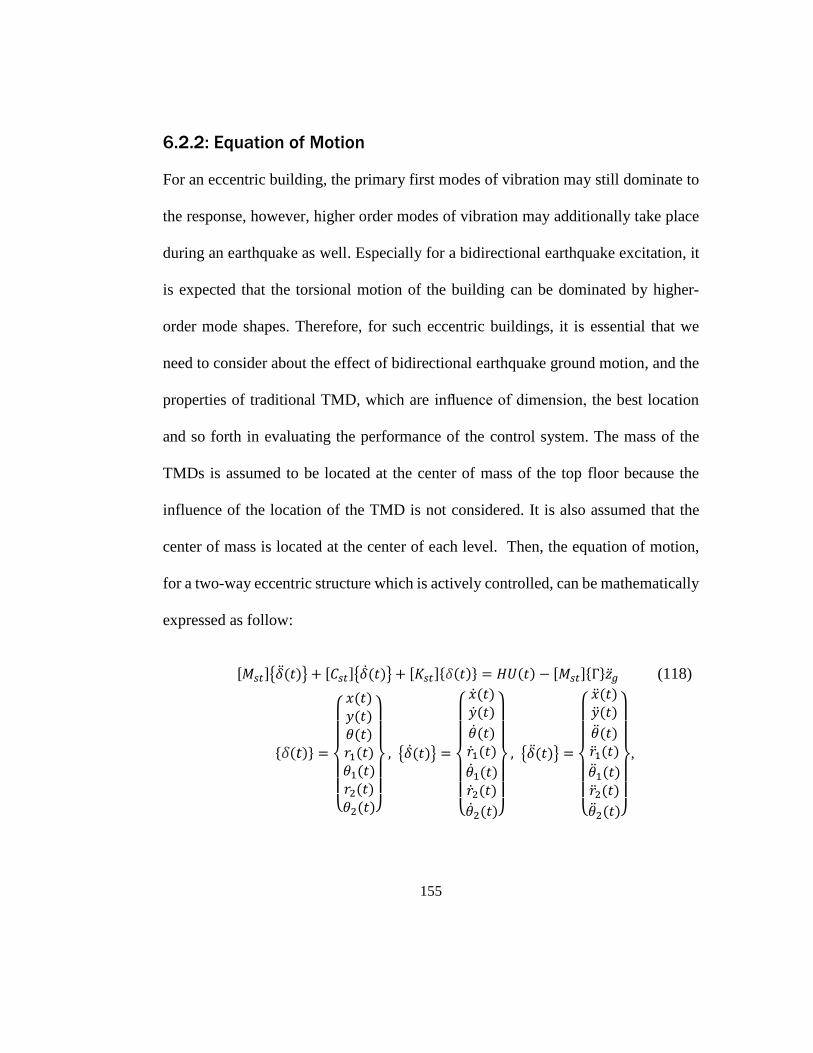
155
6.2.2: Equation of Motion
For an eccentric building, the primary first modes of vibration may still dominate to
the response, however, higher order modes of vibration may additionally take place
during an earthquake as well. Especially for a bidirectional earthquake excitation, it
is expected that the torsional motion of the building can be dominated by higher-
order mode shapes. Therefore, for such eccentric buildings, it is essential that we
need to consider about the effect of bidirectional earthquake ground motion, and the
properties of traditional TMD, which are influence of dimension, the best location
and so forth in evaluating the performance of the control system. The mass of the
TMDs is assumed to be located at the center of mass of the top floor because the
influence of the location of the TMD is not considered. It is also assumed that the
center of mass is located at the center of each level. Then, the equation of motion,
for a two-way eccentric structure which is actively controlled, can be mathematically
expressed as follow:
[𝑀𝑠𝑡]{��(𝑡)} + [𝐶𝑠𝑡]{��(𝑡)} + [𝐾𝑠𝑡]{𝛿(𝑡)} = 𝐻𝑈(𝑡) − [𝑀𝑠𝑡]{Γ}��𝑔 (118)
{𝛿(𝑡)} =
{
𝑥(𝑡)𝑦(𝑡)𝜃(𝑡)𝑟1(𝑡)𝜃1(𝑡)𝑟2(𝑡)𝜃2(𝑡)}
, {��(𝑡)} =
{
��(𝑡)��(𝑡)
��(𝑡)��1(𝑡)
��1(𝑡)
��2(𝑡)
��2(𝑡)}
, {��(𝑡)} =
{
��(𝑡)��(𝑡)
��(𝑡)��1(𝑡)
��1(𝑡)
��2(𝑡)
��2(𝑡)}
,
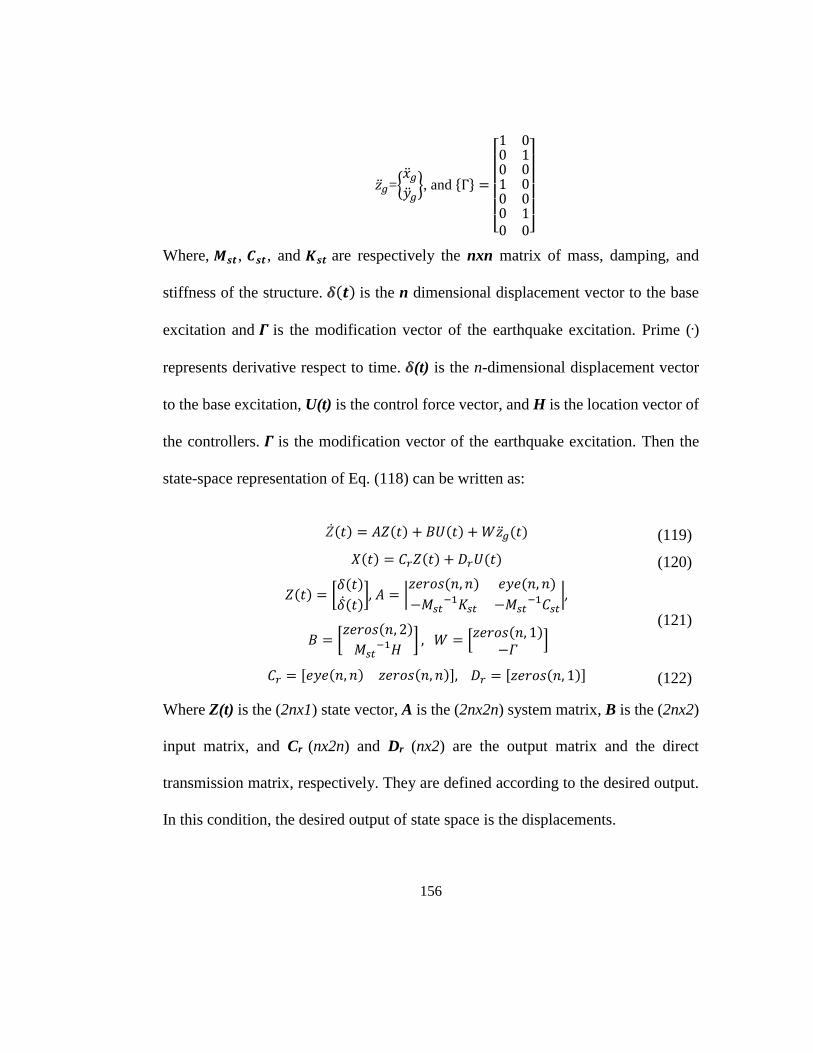
156
��𝑔={��𝑔��𝑔}, and {Γ} =
[ 1001000
0100010]
Where, 𝑴𝒔𝒕 , 𝑪𝒔𝒕 , and 𝑲𝒔𝒕 are respectively the nxn matrix of mass, damping, and
stiffness of the structure. 𝜹(𝒕) is the n dimensional displacement vector to the base
excitation and 𝜞 is the modification vector of the earthquake excitation. Prime (.)
represents derivative respect to time. 𝜹(t) is the n-dimensional displacement vector
to the base excitation, U(t) is the control force vector, and H is the location vector of
the controllers. 𝜞 is the modification vector of the earthquake excitation. Then the
state-space representation of Eq. (118) can be written as:
��(𝑡) = 𝐴𝑍(𝑡) + 𝐵𝑈(𝑡) +𝑊��𝑔(𝑡) (119)
𝑋(𝑡) = 𝐶𝑟𝑍(𝑡) + 𝐷𝑟𝑈(𝑡) (120)
𝑍(𝑡) = [
𝛿(𝑡)
��(𝑡)], 𝐴 = |
𝑧𝑒𝑟𝑜𝑠(𝑛, 𝑛) 𝑒𝑦𝑒(𝑛, 𝑛)
−𝑀𝑠𝑡−1𝐾𝑠𝑡 −𝑀𝑠𝑡
−1𝐶𝑠𝑡|,
𝐵 = [𝑧𝑒𝑟𝑜𝑠(𝑛, 2)
𝑀𝑠𝑡−1𝐻
] , 𝑊 = [𝑧𝑒𝑟𝑜𝑠(𝑛, 1)
−𝛤]
(121)
𝐶𝑟 = [𝑒𝑦𝑒(𝑛, 𝑛) 𝑧𝑒𝑟𝑜𝑠(𝑛, 𝑛)], 𝐷𝑟 = [𝑧𝑒𝑟𝑜𝑠(𝑛, 1)] (122)
Where Z(t) is the (2nx1) state vector, A is the (2nx2n) system matrix, B is the (2nx2)
input matrix, and Cr (nx2n) and Dr (nx2) are the output matrix and the direct
transmission matrix, respectively. They are defined according to the desired output.
In this condition, the desired output of state space is the displacements.

157
6.2.3: Design Optimization Procedure
The optimum parameters which are a mass ratio, tuning natural frequency ratio and
damping ratio for the traditional TMD and the ICS systems, for minimizing the top
floor displacement, can be obtained using the modified Den Hartog equations given
in Table 6-1. While the optimum design parameters for the traditional TMD is
obtained by using the equations, which are basically developed without considering
the eccentricities under unidirectional earthquake excitation, the eccentricity and
torsional effects are taken account into the design of the ICS under bidirectional
earthquake excitation, which is selected and stated in section 5.5.5. The equation and
design procedure are given and explain in section 5.4.
Table 6-1. The first three fundamental frequencies of the main structure and design properties
of the TMDs and the ICS (previously given in Table 5-1)
Main
structure
TMD design properties in orthogonal directions
L1 kd1 cd1 L2 kd2 cd2
wx (rad/sec) (m) (kN/mm) (kN.s/mm) (m) (kN/mm) (kN.s/mm)
12.87 10 66.67 1.57 10 23.91 0.94
wy (rad/sec) ICS design properties in torsional direction
7.71 L1+r1
m
ax kq1 cq1 L2+r2
max kq2 cq2
wθ (rad/sec) (m) (kN.mm/ra
d)
(kN.mm.s/ra
d) (m)
(kN.mm/
rad)
(kN.mm.s/ra
d)
20.88 10.18 1.90E+10 2.02E+08 10.20 1.91E+1
0 2.03E+08
6.2.4: Control Theory
In this chapter, the general cost function (J) for the ATMDs and ICS with the
appropriate size of Q and R can be given as

158
𝐽 = ∫ [𝑍(𝑡)𝑇𝑄
∞
0
𝑍(𝑡) + 𝑈(𝑡)𝑇𝑅𝑈(𝑡)]𝑑𝑡 (123)
𝑄 = 𝑁𝑇𝑁 ∈ ℝ2𝑛𝑥2𝑛 (124)
𝑅 ∈ ℝ𝑚𝑥𝑚 (125)
In which, Q is equal to eye(2n, 2n) matrix with the selection of the elements of
Q(9,9)=90 and Q(18,18)=90 and R is 10-4. eye(m). Excluding the earthquake base
excitation, Riccati closed loop control (the control vector) U(t) is given by
𝑈(𝑡) = −𝐺𝑍(𝑡) (126)
𝐺 = 𝑅−1𝐵𝑇𝐾 (127)
Substituting Eq. (127) into Eq. (119), the closed loop of the actively controlled
structure becomes:
��(𝑡) = (𝐴 − 𝐵𝐺)𝑍(𝑡) +𝑊��𝑔(𝑡) (128)
Now, the controller design is ready to control the actuator.
6.3: Simulation Results and Discussion
In the previous chapter, passive Integrated Control System (ICS) and design
procedure were explained and its performance was compared with two conventional
TMDs, which are placed in two orthogonal directions and have the same dynamic
properties for lateral vibration control. The ICS had significant improvements in
response reductions especially in the torsional direction as comparing to TMDs under
bidirectional loading cases.

159
In here, there are two translational actuators that are applied to the new configuration
of the proposed control system as seen in Figure 6-1and Figure 6-2. The actuators
provide translation external energy into two directions for the active tuned mass
dampers (ATMDs) while they can generate the energy in the translational and
torsional direction with the help of global bearing system for the active integrated
control system (AICS). The analysis is made and the peak and RMS responses of the
ATMDs and AICS are obtained and tabulated in Table 6-2.
Table 6-2. The responses of the structure and its application with ATMDs and AICS
Earthquake
input Type of structures
Displacements on the top floor
Peak resp. (cm) or
(10-3rad)
RMS resp. (cm) or
(10-3rad)
x y θ x y θ
El Centro
Benchmark building 8.24 10.66 0.117 2.03 3.27 0.0322
Benchmark building
with the ATMDs 3.81 4.96 0.060 0.74 0.83 0.0184
Benchmark building
with the AICS 3.70 4.79 0.056 0.72 0.79 0.0142
Loma Prieta
Benchmark building 4.38 17.10 0.143 1.03 5.32 0.0353
Benchmark building
with the ATMDs 3.05 7.90 0.100 0.50 1.25 0.0173
Benchmark building
with the AICS 2.97 7.45 0.076 0.49 1.20 0.0127
Kocaeli
Benchmark building 6.29 13.19 0.194 1.61 4.09 0.0330
Benchmark building
with the ATMDs 3.85 6.61 0.109 0.66 1.24 0.0175
Benchmark building
with the AICS 3.73 6.32 0.095 0.64 1.18 0.0137
As it is understood from Table 6-2, the active control strategy significantly improves
the system response reduction capacity. In addition to this, it increases the safety and

160
stability of the structure by eliminating detuning effects, caused by the earthquake
input characteristics, which the passive control strategies are inactive are. Therefore,
the active control strategy can significantly improve the structural performance,
however, it has also some disadvantageous, for instance; it may need a huge amount
of external energy and additional control stuff like sensors, computers so forth.
Table 6-3. Comparison the performance of the ATMDs to the AICS
Earthquake
Displacements on the top floor
Peak resp. percentage (%) RMS resp. percentage (%)
x y θ x y θ
Elcentro 2.9 3.5 6.5 2.4 4.5 22.8
Loma Prieta 2.5 5.7 24.1 2.5 4.6 26.6
Kocaeli 3.0 4.4 12.7 2.5 5.3 21.7
The overall performance of AICS is substantially improved as compared to the
ATMDs. In the peak and RMS response reduction, there is approximately 3%
increase in the x-direction and about a 6% increase in the y-direction. It is also
important to note that there is significant improvement by nearly 20% for in the
torsional direction.
161
6.4: Summary and Observation
A new structural control approach is introduced in designing the active tuned mass
dampers (ATMDs) for torsionally irregular buildings. Two actuators, which are
driven by the linear quadratic regulator (LQR), are used to apply the control forces
to the TMDs and ICS system in two directions. To test the performance of the
proposed system configuration, the final design was applied to the Benchmark
structure which is a two-way eccentric building subjected to bidirectional three
historical earthquakes. Results show that the proposed ICS is more effective as
compared to two orthogonal TMDs. Further, the AICS exhibits more robust and
higher reliability under different ground accelerations in two directions than
conventional ones (ATMDs).

162
Chapter 7 Conclusions and Future Study
7.1: Summary
In this dissertation, there are various control systems have been commonly used as a
traditional approach and been proposed so far as an innovative approach to protecting
torsional irregular buildings (TIBs) from the risk of the failure due to torsional
irregularity under uni or bidirectional earthquake loading cases. Also, an integrated
control system (ICS) and its design framework, by which more reliable and effective
as compared to conventional ones for plan-irregular structures can be obtained, is
proposed and developed.
The effectiveness of various control systems is investigated under unidirectional
earthquake loading without considering lateral torsional coupling effects. In order
to perform the effectiveness of these systems, a six-story Reinforced Concrete (RC)
building was picked and strengthened by respectively a passive (TMD), an active
tuned mass damper (ATMD) and the masonry infill-wall, which are generally used
for the purpose of architectural design in residential reinforced concrete buildings
and generally neglected in the seismic analysis. By comparing the results obtained
from these various control systems, the symmetrical placement of infill wall in plan
significantly affected building behavior and its performance is better than passive

163
tuned mass damper (TMD) with 5% of mass ratio to the main structure. The
performance of the TMD and ATMD can be improved by increasing its dynamic
characteristics, however, it is not always possible. Therefore, the infill wall can be a
good traditional control system as an alternative to TMD in mid-rise buildings. The
infill wall should also be taken into account in determining and evaluating the seismic
performances of the buildings in order to obtain more accurate and realistic results.
It is also noteworthy that the properties of infill walls should be defined as accurately
as possible in structural analyses.
The performance of the proposed Integrated Control System (ICS) is to examine and
investigate when subjected to selected bidirectional ground motions which lead
either to tuning effects or to detuning effects. Additionally, the Benchmark building
is strengthened by the placement of Cross Frames (CFs) into MRFs, two traditional
Tuned Mass Dampers (TMDs), which are respectively applied in the x- and y-
direction, for verifying the effectiveness of the ICS. Unlike traditional TMDs placed
in two orthogonal directions, the ICS is more comprehended to control not only two
orthogonal (x- and y-) directions, but also effectively control rotational (θ-) direction.
Furthermore, the CFs has a better performance in controlling torsional motion and
its performance is not affected by earthquake input characteristics such as x-
dominant or y-dominant or nearly both excitations, but the TMDs is more successful
in lateral response reductions. By means of the proposed system configuration, the

164
structures first-three dominants modes can effectively be controlled by the ICS
regardless of any external energy sources. The ICS is, therefore, highly capable of
enhancing the control capacity of the structure conveniently in multi-directions. By
means of the flexible design of ICS, the torsional response is substantially reduced.
According to the performance evaluation criteria of ICS, there are substantial
reductions for both the tuning case (El Centro earthquake) and the detuning case
(Loma Prieta and Kocaeli earthquakes). For both cases, the performance indexes are
overall less than the bare Benchmark building and its respective application with the
CFs and the TMDs. That means that ICS can improve the structural robustness and
safety by eliminating the effect of earthquake input characteristics in addition to
conventional ones. Therefore, the effectiveness of ICS performance is verified.
The application of the integrated control system framework is extended into an active
control strategy. Firstly, two actuators, which are driven by the linear quadratic
regulator (LQR), are used to apply the desired control forces to the active TMDs and
ICS system in two directions. Secondly, to test the performance of the AICS, the final
design is applied to the Benchmark building subjected to bidirectional three historical
earthquakes and the numerical analysis is made. It is applied as a passive (ICS) and
active control system (AICS) respectively on TIBs for earthquake response
reduction. To show that Passive and Active Integrated Control Systems are as a
structural control strategy comparable to conventional Passive and Active Tuned
165
Mass Dampers (TMDs or ATMDs), theoretical studies are conducted. Finally, the
seismic performance is discussed by comparing it with the ATMDs.
It summarizes the research presented in this dissertation and provides
recommendations and future studies on the structural control system for seismic
protection of buildings.
7.2: Future study
There are some ideas and recommendations for future studies can be stated as
follows:
The present study was conducted with a nine-story Benchmark steel building.
Further research can be analyzed with a varying number of the story in
reinforced concrete or steel structures, which have a variation of the
eccentricity in the plan.
In this research, the ICS was performed under bidirectional three historical
earthquake loads. Actually, the real earthquake ground motion has also a
rotational component. Thus, the ICS performance can be investigated under
two orthogonal and one rotational component which can be generated from
two orthogonal components. The loading scenario represents a more realistic
earthquake action and its effect on structures.

166
In this research, the structure and all other components which are used in the
analysis were assumed that they are in the elastic range, in reality not. For
that reason, to test the performance of the ICS, inelastic time history analysis
can be made for future study.
In order to increase the effectiveness of the ICS, the multi-integrated control
system (MICS) can be conducted. In addition, the best placement in the plan
or the level of structure can be investigated to increase its performance.
A significant amount of research has been done on how best to design the
tuned mass dampers in the passive control of structures under dynamic
excitation such as strong winds and earthquakes. In this research, the design
formulas for TMD was used, proposed by Abubakar and Farid 2009, without
the consideration of torsional coupling effects. Therefore, the new design
formulas are needed with a consideration of the torsional motion for the
torsional effective control system.
While the ICS is just only one possibility of the new configuration of tuned
mass damper systems with some additional components and arrangements,
which can effectively control lateral and torsional motions during an
earthquake, in future, it can be improved or modified by some additional
extension in order to comprehend the system safety.

167
References
Aaron Samuel Brown. 2000. “Multi-Objective Civil Structural Control Incorporating Neural
Networks.” University of Califonia at Santa Barbara. https://doi.org/UMI Number
3013206.
Abe, H, and Masato. 1998. “Tuned Liquid Damper (TLD) with High Performance Fluids.”
Proc.of 2^<nd> World Conf.on Struct.Contl. 1: 131–38.
https://ci.nii.ac.jp/naid/10004966837/.
Abé, M., and T. Igusa. 1995. “Tuned Mass Dampers for Structures with Closely Spaced
Natural Frequencies.” Earthquake Engineering & Structural Dynamics 24 (2): 247–
61. https://doi.org/10.1002/eqe.4290240209.
Abé, Masato, and Yozo Fujino. 1994. “Dynamic Characterization of Multiple Tuned Mass
Dampers and Some Design Formulas.” Earthquake Engineering & Structural
Dynamics 23 (8): 813–35. https://doi.org/10.1002/eqe.4290230802.
Abubakar, I. M., and B. J.M. Farid. 2009. “Generalized Den Hartog Tuned Mass Damper
System for Control of Vibrations in Structures.” WIT Transactions on the Built
Environment 104: 185–93. https://doi.org/10.2495/ERES090171.
Akyurek, Osman. 2014. “Betonarme Bina Performansina Dolgu Duvarlarin Etkisi (The
Effects of Infill Walls in RC Building Performance).” Suleyman Demirel Univertsity.

168
Akyurek, Osman, Hamide Tekeli, and Fuat Demir. 2018. “Plandaki Dolgu Duvar
Yerleşiminin Bina Performansı Üzerindeki Etkisi (The Effects of Infill Walls Located
in Plan on Buildings Performance).” International Journal of Engineering Research
and Development 30 (August): 42–55. https://doi.org/10.29137/umagd.419660.
Amini, Fereidoun, NKhanmohammadi K. Hazaveh, and AAbdolahi A. Rad. 2013. “Wavelet
PSO-Based LQR Algorithm for Optimal Structural Control Using Active Tuned Mass
Dampers.” Computer-Aided Civil and Infrastructure Engineering 28 (7): 542–57.
https://doi.org/10.1111/mice.12017.
Arfiadi, Y. 2000. “Optimal Passive and Active Control Mechanisms for Seismically Excited
Buildings.” University Of Wollongong. http://ro.uow.edu.au/theses/1836/.
Arslan, M. H., and H. H. Korkmaz. 2007. “What Is to Be Learned from Damage and Failure
of Reinforced Concrete Structures during Recent Earthquakes in Turkey?” Engineering
Failure Analysis 14 (1): 1–22. https://doi.org/10.1016/j.engfailanal.2006.01.003.
Asai, Takehiko. 2014. “Structural Control Strategies for Earthquake Response Reduction Of
Buildings.” University of Illinois at Urbana-Champaign.
Asai, Takehiko, and Billie F Spencer. 2015. “Structural Control Strategies for Earthquake
Response Reduction of Buildings.” University of Illinois at Urbana-Champaign.
169
Basu, Dhiman, Michael C. Constantinou, and Andrew S. Whittaker. 2014. “An Equivalent
Accidental Eccentricity to Account for the Effects of Torsional Ground Motion on
Structures.” Engineering Structures 69 (June): 1–11.
https://doi.org/10.1016/j.engstruct.2014.02.038.
Basu, Dhiman, and Sandesh Giri. 2015. “Accidental Eccentricity in Multistory Buildings
Due to Torsional Ground Motion.” Bulletin of Earthquake Engineering 13 (12): 3779–
3808. https://doi.org/10.1007/s10518-015-9788-0.
Basu, Dhiman, Andrew S. Whittaker, and Michael C. Constantinou. 2012. “Characterizing
the Rotational Components of Earthquake Ground Motion.”
Behrooz, Majid, Xiaojie Wang, and Faramarz Gordaninejad. 2014. “Modeling of a New
Semi-Active/Passive Magnetorheological Elastomer Isolator.” Smart Materials and
Structures 23 (4): 045013. https://doi.org/10.1088/0964-1726/23/4/045013.
Bhaskararao, A. V., and R. S. Jangid. 2006. “Seismic Analysis of Structures Connected with
Friction Dampers.” Engineering Structures 28 (5): 690–703.
https://doi.org/10.1016/j.engstruct.2005.09.020.
Bitaraf, M. 2011. “Enhancing the Structural Performance with Active and Semi-Active
Devices Using Adaptive Control Strategy.” Texas A&M University.
http://repositories.tdl.org/tdl-ir/handle/1969.1/ETD-TAMU-2011-05-9159.

170
Cao, H., and Q. S. Li. 2004. “New Control Strategies for Active Tuned Mass Damper
Systems.” Computers and Structures 82 (27): 2341–50.
https://doi.org/10.1016/j.compstruc.2004.05.010.
Cao, Yenan, George P. Mavroeidis, Kristel C. Meza-Fajardo, and Apostolos S.
Papageorgiou. 2017. “Accidental Eccentricity in Symmetric Buildings Due to Wave
Passage Effects Arising from Near-Fault Pulse-like Ground Motions.” Earthquake
Engineering and Structural Dynamics 46 (13): 2185–2207.
https://doi.org/10.1002/eqe.2901.
“CEE 221: Structural Analysis IΙ.” n.d. Accessed October 9, 2018.
http://www.eng.ucy.ac.cy/petros/Earthquakes/earthquakes.htm.
Chandler, A. M., and G. L. Hutchinson. 1986. “Torsional Coupling Effects in the Earthquake
Response of Asymmetric Buildings.” Engineering Structures 8 (4): 222–36.
https://doi.org/10.1016/0141-0296(86)90030-1.
Chang, JCH, and TT Soong. 1980. “Structural Control Using Active Tuned Mass Dampers.”
Journal of the Engineering Mechanics Division 106 (6): 1091–98.
http://cedb.asce.org/cgi/WWWdisplay.cgi?9890.
Chen, Chui-Hsin, Jiun-Wei Lai, and Stephen A. Mahin. 2004. “Seismic Performance
Assessment of Concentrically Braced Frames.” The 13 World Conference on
Earthquake Engineering, 2004. https://doi.org/10.1061/(ASCE)ST.1943-
541X.0002276.

171
Chopra, Anil K. 2000. Dynamics of Structures: Theory and Applications to Earthquake
Engineering. Earthquake Spectra. Vol. 23. Englewood Cliffs, N.J. : Prentice Hall.
https://doi.org/10.1193/1.1586188.
Cimellaro, G. P., T. Giovine, and D. Lopez-Garcia. 2014. “Bidirectional Pushover Analysis
of Irregular Structures.” Journal of Structural Engineering 140 (9): 04014059.
https://doi.org/10.1061/(ASCE)ST.1943-541X.0001032.
“Civil, Structural and Architectural Engineering Testing Capabilities 4/11.” 7AD. 7AD.
http://www.mts.com/cs/groups/public/documents/library/dev_002186.pdf.
Clough, R.W., and J. Penzien. 1995. Dynamics of Structures. Physical Review C - Nuclear
Physics. Vol. 78. https://doi.org/10.1103/PhysRevC.78.014905.
Colwell, Shane, and Biswajit Basu. 2009. “Tuned Liquid Column Dampers in Offshore
Wind Turbines for Structural Control.” Engineering Structures 31 (2): 358–68.
https://doi.org/10.1016/j.engstruct.2008.09.001.
Constantinou, M., Tt Soong, and Gf Dargush. 1998. “Passive Energy Dissipation Systems
for Structural Design and Retrofit.” Multidisciplinary Center for Earthquake
Engineering Research, 320.
http://mceer.buffalo.edu/publications/catalog/reports/Passive-Energy-Dissipation-
Systems-for-Structural-Design-and-Retrofit-MCEER-98-MN01.html.

172
Constantinou, Michael C, and Panos Tsopelas. 1993. “Fluid Viscous Dampers in Application
of Seismic Energy Dissipation and Seismic Isolation Structural Control View Project
Seismic Protection of Structures through Passive Control View Project.”
https://www.researchgate.net/publication/267818935.
Crewe, Adam. 1998. “Passive Energy Dissipation Systems in Structural Engineering.”
Structural Safety 20 (2): 197–98. https://doi.org/10.1016/S0167-4730(97)00034-9.
Crisafulli, Francisco, Agust\’\in Reboredo, and Gonzalo Torrisi. 2004. “Consideration of
Torsional Effects in the Displacement Control of Ductile Buildings.” In 13th World
Conference on Earthquake Engineering, Vancouver, BC, Canada, Paper.
Damjan, Marusic, and Peter Fajfar. 2005. “On the Inelastic Seismic Response of Asymmetric
Buildings under Bi-Axial Excitation.” Earthquake Engineering and Structural
Dynamics 34 (8): 943–63. https://doi.org/10.1002/eqe.463.
Demir, Duygu Dönmez. 2010. “Torsional Irregularity Effects of Local Site Classes in
Multiple Storey Structures.” Int J Res Rev Appl Sci, 258–62.
https://www.researchgate.net/publication/47446997.
Desu, Nagendra Babu, S. K. Deb, and Anjan Dutta. 2006. “Coupled Tuned Mass Dampers
for Control of Coupled Vibrations in Asymmetric Buildings.” Structural Control and
Health Monitoring 13 (5): 897–916. https://doi.org/10.1002/stc.64.

173
Dolšek, Matjaž, and Peter Fajfar. 2008. “The Effect of Masonry Infills on the Seismic
Response of a Four Storey Reinforced Concrete Frame-a Probabilistic Assessment.”
Engineering Structures 30 (11): 3186–92.
https://doi.org/10.1016/j.engstruct.2008.04.031.
Dyke, SJ and Spencer Jr, BF. 1996. “State of the Art of Structural Control.” 2nd
International Workshop on Structural Control 129 (July): 163--173.
https://doi.org/10.1061/(ASCE)0733-9445(2003)129:7(845).
Dyke, S.J., and B.F. Spencer. 1997. “A Comparison of Semi-Active Control Strategies for
the MR Damper.” In Proceedings Intelligent Information Systems. IIS’97, 580–84.
IEEE Comput. Soc. https://doi.org/10.1109/IIS.1997.645424.
Emrah Erduran, and Keri L. Ryan. 2010. “Effects of Torsion on the Behavior of Peripheral
Steel-Braced Frame Systems.” Earthquake Engineering and Structural Dynamics 40
(2027): 491–507. https://doi.org/10.1002/eqe.
Erkus, Baris, and Erik A. Johnson. 2007. “Investigation of Dissipativity for Semiactive
Control of the Base Isolated Benchmark Building With Mr Dampers.” In
Electrorheological Fluids and Magnetorheological Suspensions, 512–18. WORLD
SCIENTIFIC. https://doi.org/10.1142/9789812771209_0071.
F Sakai, S Takaeda, Tamaki T. 1989. “Tuned Liquid Column Damper-New Type Device for
Suppression of Building Vibrations.” In: Proceedings of International Conference on
Highrise Buildings., 926–31. https://doi.org/10.1007/s10997-014-9289-6.
174
Federal Emergency Management Agency (FEMA). 2000. “FEMA 355F - State of the Art
Report on Performance Prediction and Evaluation of Steel Moment-Frame Buildings.”
Fema-355F 1: 1–367.
FEMA 750. 2009. “NEHRP (National Earthquake Hazards Reduction Program)
Recommended Seismic Provisions for New Buildings and Other Structures (FEMA P-
750), 2009 Edition.” www.bssconline.org.
Feng, MQ, and M Shinozuka. 1990. “Use of a Variable Damper for Hybrid Control of Bridge
Response under Earthquake.” In U.S. National Workshop on Structural Control
Research, 107–12. USC Publication. https://ci.nii.ac.jp/naid/10006922731/.
Fisco, N. R., and H. Adeli. 2011. “Smart Structures: Part I - Active and Semi-Active
Control.” Scientia Iranica 18 (3 A): 275–84.
https://doi.org/10.1016/j.scient.2011.05.034.
Francisco Crisafulli, Agustín Reboredo and Gonzalo Torrisi. 2004. “Consideration of
Torsional Effects in the Displacement Control of Ductile Buildings.” 13th World
Conference on Earthquake Engineering, 2004.
Friedman, Anthony, Shirley J. Dyke, Brian Phillips, Ryan Ahn, Baiping Dong, Yunbyeong
Chae, Nestor Castaneda, et al. 2015. “Large-Scale Real-Time Hybrid Simulation for
Evaluation of Advanced Damping System Performance.” Journal of Structural
Engineering 141 (6): 04014150. https://doi.org/10.1061/(ASCE)ST.1943-
541X.0001093.

175
Gill, Deepika, Said Elias, Andreas Steinbrecher, Christian Schröder, and Vasant Matsagar.
2017a. “Robustness of Multi-Mode Control Using Tuned Mass Dampers for
Seismically Excited Structures.” Bulletin of Earthquake Engineering 15 (12): 5579–
5603. https://doi.org/10.1007/s10518-017-0187-6.
Gokdemir, H, H Ozbasaran, M Dogan, E Unluoglu, and U Albayrak. 2013. “Effects of
Torsional Irregularity to Structures during Earthquakes.” Engineering Failure Analysis
35: 713–17. https://doi.org/10.1016/j.engfailanal.2013.06.028.
Guclu, Rahmi, and Hakan Yazici. 2008. “Vibration Control of a Structure with ATMD
against Earthquake Using Fuzzy Logic Controllers.” Journal of Sound and Vibration
318 (1–2): 36–49. https://doi.org/10.1016/j.jsv.2008.03.058.
Gutierrez Soto, Mariantonieta, and Hojjat Adeli. 2013. “Tuned Mass Dampers.” Archives of
Computational Methods in Engineering 20 (4): 419–31.
https://doi.org/10.1007/s11831-013-9091-7.
Hao, Hong, and Jordan Ip. 2013. “Torsional Responses of Building Structures to Earthquake
Loadings Defined in AS1170.4-2007.” In Australian Earthquake Engineering Society
2013 Conference, Nov. 15-17, Tasmania. https://aees.org.au/wp-
content/uploads/2015/06/11-Hao-Hong-Torsional.pdf.
Hartog, J.P. Den. 1956. “Mechanical Vibration.” McGraw-Hill Book Company, Inc., New
York, NY,.

176
Hartog, J P D E N. 1985. Mechanical Vibrations.
https://books.google.com/books?hl=en&lr=&id=IshIAwAAQBAJ&oi=fnd&pg=PP1
&dq=Den+Hartog,+Jacob+Pieter.+Mechanical+vibrations.+Courier+Corporation,+19
85.&ots=E6c1sCA6zj&sig=5MWy-8EqGgXugryVp_Zio6S4GqY.
Hashemi, Alidad, and Khalid M. Mosalam. 2007. “Seismic Evaluation of Reinforced
Concrete Buildings Including Effects of Masonry Infill Walls.” Seismic Evaluation of
Reinforced Concrete Buildings Including Effects of Masonry Infill Walls.
http://peer.berkeley.edu/publications/peer_reports/reports_2007/webR_PEER7100_H
ASHEMI_mosalam.pdf.
He, Haoxiang, Wentao Wang, and Honggang Xu. 2017. “Multidimensional Seismic Control
by Tuned Mass Damper with Poles and Torsional Pendulums.” Shock and Vibration
2017: 1–14. https://doi.org/10.1155/2017/5834760.
Hejal, Reem, and Anil K. Chopra. 1989. “Earthquake Response of Torsionally Coupled,
Frame Buildings.” Journal of Structural Engineering. Vol. 115.
https://doi.org/10.1061/(ASCE)0733-9445(1989)115:4(834).
Helwig, Todd, Michael D Engelhardt, and Karl H Frank. 2012. “Comparison of the Stiffness
Properties for Various Cross Frame Members and Connections Comparison of the
Stiffness Properties for Various Cross Frame Members and Connections,” no. January.

177
Hernández, J, and O López. 2000. “Influence of Bidirectional Seismic Motion On the
Response of Asymmetric Buildings.” Proc. 12th World Conference on Earthquake
Engineering, Auckland, New Zealand. Vol. Paper No.
https://www.researchgate.net/publication/266893910.
Housner, George W, Lawrence A Bergman, T Kf Caughey, Anastassios G Chassiakos,
Richard O Claus, Sami F Masri, Robert E Skelton, T T Soong, B F Spencer, and James
T P Yao. 1997. “Structural Control: Past, Present, and Future.” Journal of Engineering
Mechanics 123 (9): 897–971.
Huang, Shieh-Kung, and Chin-Hsiung Loh. 2017. “Control of Equipment Isolation System
Using Wavelet-Based Hybrid Sliding Mode Control.” In , edited by Jerome P. Lynch,
10168:1016832. International Society for Optics and Photonics.
https://doi.org/10.1117/12.2257882.
Huo, Linsheng, Gangbing Song, Hongnan Li, and Karolos Grigoriadis. 2008. “Hinf Robust
Control Design of Active Structural Vibration Suppression Using an Active Mass
Damper.” Smart Materials and Structures 17 (1): 015021.
https://doi.org/10.1088/0964-1726/17/01/015021.

178
I. M. Abubakar & B. J. M. Farid. 2012. Seismic Control Systems: Design and Performance
Assessment. Edited by S. Syngellakis. Vol. 2012. Bostan: WITPRES.
https://books.google.com/books?hl=en&lr=&id=WDHu3xWC96QC&oi=fnd&pg=P
A185&dq=Abubakar,+I.+M.,+and+B.+J.+M.+Farid.+Generalized+Den+Hartog+tune
d+mass+damper+system+for+control+of+vibrations+in+structures.+London:+WIT+
Press,+2013.&ots=On8NCFKH9S&sig=M3ca65JiF.
Igusa, T., and K. Xu. 1994. “Vibration Control Using Multiple Tuned Mass Dampers.”
Journal of Sound and Vibration 175 (4): 491–503.
https://doi.org/10.1006/jsvi.1994.1341.
Inaudi, J., F. López‐Almansa, J. M. Kelly, and J. Rodellar. 1992. “Predictive Control of
Base‐isolated Structures.” Earthquake Engineering & Structural Dynamics 21 (6):
471–82. https://doi.org/10.1002/eqe.4290210602.
Jangid, R. S. 1995a. “Dynamic Characteristics of Structures with Multiple Tuned Mass
Dampers.” Structural Engineering and Mechanics 3 (5): 497–509.
https://doi.org/10.12989/sem.1995.3.5.497.
Jangid, R. S., and T. K. Datta. 1997. “Performance of Multiple Tuned Mass Dampers for
Torsionally Coupled System.” Earthquake Engineering and Structural Dynamics 26
(3): 307–17. https://doi.org/10.1002/(SICI)1096-9845(199703)26:3<307::AID-
EQE639>3.0.CO;2-8.

179
Jiang, Bo Jiang Bo, Xinjiang Wei Xinjiang Wei, and Yanying Guo Yanying Guo. 2010.
“Liner Quadratic Optimal Control in Active Control of Structural Vibration Systems.”
Control and Decision Conference (CCDC), 2010 Chinese, no. 2: 3546–51.
https://doi.org/10.1109/CCDC.2010.5498552.
Kan, Christopher L., and Anil K. Chopra. 1977. “Elastic Earthquake Analysis of Torsionally
Coupled Multistorey Buildings.” Earthquake Engineering & Structural Dynamics 5
(4): 395–412. https://doi.org/10.1002/eqe.4290050406.
Kareem, Ahsan. 1990. “Reduction of Wind Induced Motion Utilizing a Tuned Sloshing
Damper.” Journal of Wind Engineering and Industrial Aerodynamics 36 (PART 2):
725–37. https://doi.org/10.1016/0167-6105(90)90070-S.
Kelly, J. M., G. Leitmann, and A. G. Soldatos. 1987. “Robust Control of Base-Isolated
Structures under Earthquake Excitation.” Journal of Optimization Theory and
Applications 53 (2): 159–80. https://doi.org/10.1007/BF00939213.
Kelly, James M. 1999. “The Role of Damping in Seismic Isolation.” Earthquake
Engineering and Structural Dynamics 28 (1): 3–20.
https://doi.org/10.1002/(SICI)1096-9845(199901)28:1<3::AID-EQE801>3.0.CO;2-
D.
Kelly, James Marshall. 1993. “Earthquake-Resistant Design with Rubber.”
https://doi.org/10.1007/978-1-4471-3359-9.

180
Khashaee, Payam, Bijan Mohraz, Fahim Sadek, H.S. Lew, and John L. Gross. 2003.
“Distribution of Earthquake Input Energy in Structures.” Gaithersburg, MD 20899.
Kim, Hongjin, and Hojjat Adeli. 2005. “Hybrid Control of Smart Structures Using a Novel
Wavelet-Based Algorithm.” Computer-Aided Civil and Infrastructure Engineering 20
(1): 7–22. https://doi.org/10.1111/j.1467-8667.2005.00373.x.
Kim, Young, Ki-pyo You, Jang-youl You, Sun-young Paek, and Byung-hee Nam. 2013.
“LQR Control of Along-Wind Responses of a Tall Building Using Active Tuned Mass
Damper.” The 2016 World Congress on Advances in Civil , Environmental, and
Materials Research, 2013. https://doi.org/10.4028/www.scientific.net/AMM.421.767.
Koçak, Ali, and M. Kasιm Yιldιrιm. 2011. “Effects of Infill Wall Ratio on the Period of
Reinforced Concrete Framed Buildings.” Advances in Structural Engineering 14 (5):
731–43. https://doi.org/10.1260/1369-4332.14.5.731.
Koh, C. G., S. Mahatma, and C. M. Wang. 1995. “Reduction of Structural Vibrations by
Multiple-Mode Liquid Dampers.” Engineering Structures 17 (2): 122–28.
https://doi.org/10.1016/0141-0296(95)92643-M.
Kumar, A, BS Poonama, and VK Sehgalc. 2007. “Active Vibration Control of Structures
Against Earthquakes Using Modern Control Theory.” ASIAN JOURNAL OF CIVIL …
3 (2007): 283–99. www.SID.ir.

181
Lavan, Oren. 2017a. “Multi-Objective Optimal Design of Tuned Mass Dampers.” Structural
Control and Health Monitoring 24 (11): e2008. https://doi.org/10.1002/stc.2008.
Li, Chunxiang. 2000a. “Performance of Multiple Tuned Mass Dampers for Attenuating
Undesirable Oscillations of Structures under the Ground Acceleration.” Earthquake
Engineering and Structural Dynamics 29 (9): 1405–21. https://doi.org/10.1002/1096-
9845(200009)29:9<1405::AID-EQE976>3.0.CO;2-4.
Li, Chunxiang, and Weilian Qu. 2006. “Optimum Properties of Multiple Tuned Mass
Dampers for Reduction of Translational and Torsional Response of Structures Subject
to Ground Acceleration.” Engineering Structures 28 (4): 472–94.
https://doi.org/10.1016/j.engstruct.2005.09.003.
Li, Hong Nan, Ying Jia, and Su Yan Wang. 2004. “Theoretical and Experimental Studies on
Reduction for Multi-Modal Seismic Responses of High-Rise Structures by Tuned
Liquid Dampers.” JVC/Journal of Vibration and Control 10 (7): 1041–56.
https://doi.org/10.1177/1077546304036921.
Li, Q. S., Y. Q. Xiao, J. Y. Fu, and Z. N. Li. 2007. “Full-Scale Measurements of Wind Effects
on the Jin Mao Building.” Journal of Wind Engineering and Industrial Aerodynamics
95 (6): 445–66. https://doi.org/10.1016/j.jweia.2006.09.002.
Lin, Chi Chang, Jin Min Ueng, and Teng Ching Huang. 2000. “Seismic Response Reduction
of Irregular Buildings Using Passive Tuned Mass Dampers.” Engineering Structures
22 (5): 513–24. https://doi.org/10.1016/S0141-0296(98)00054-6.

182
Lin, Jui Liang, Keh Chyuan Tsai, and Yi Jer Yu. 2010. “Coupled Tuned Mass Dampers for
the Seismic Control of Asymmetric-Plan Buildings.” Earthquake Spectra 26 (3): 749–
78. https://doi.org/10.1193/1.3435347.
Lu, X. L., and H. J. Jiang. 2011. “Research and Practice of Response Control for Tall
Buildings in Mainland China.” Procedia Engineering 14: 73–83.
https://doi.org/10.1016/j.proeng.2011.07.008.
Lu, Xilin, Peizhen Li, Xianqun Guo, Weixing Shi, and Jie Liu. 2014. “Vibration Control
Using ATMD and Site Measurements on the Shanghai World Financial Center Tower.”
Structural Design of Tall and Special Buildings 23 (2): 105–23.
https://doi.org/10.1002/tal.1027.
Luca, Septimiu-George, and Cristian Pastia. 2009. Case Study of Variable Orifice Damper
for Seismic Protection of Structures, LV Buletinul Institutului Politehnic Din Iasi 1–8.
Luo, N, J Rodellar, R Villamizar, and J Vehi. 2003. “Robust Control Law for a Friction-
Based Semiactive Controller of a Two-Span Bridge.” In Smart Structures and
Materials 2003: Smart Systems and Nondestructive Evaluation for Civil
Infrastructures, 5057:524–34. https://doi.org/10.1117/12.482706.

183
Luo, Ningsu, Rodolfo Villamizar, Villamizar Vehí, and Shirley Dyke. 2006. “Semiactive
Backstepping Control for Vibration Attenuation in Structures Equipped with
Magnetorheological Actuato.” In Proceedings of the IEEE International Conference
on Control Applications, 1091–96. https://doi.org/10.1109/CACSD-CCA-
ISIC.2006.4776796.
Magliulo, Gennaro, and Roberto Ramasco. 2007. “Seismic Response of Three-Dimensional
r/c Multi-Storey Frame Building under Uni- and Bi-Directional Input Ground Motion.”
Earthquake Engineering and Structural Dynamics 36 (12): 1641–57.
https://doi.org/10.1002/eqe.709.
McClamroch, N Harris, and Henri P Gavin. 1995. “Electrorheological Dampers and Semi-
Active Structural Control.” In Proceedings of the 34th Conference on Decision &
Control, 1:3528–33. IEEE. https://doi.org/Doi 10.1126/Science.1178530.
Mitchell, Ryan, Yeesock Kim, Tahar El-Korchi, and Young Jin Cha. 2013. “Wavelet-Neuro-
Fuzzy Control of Hybrid Building-Active Tuned Mass Damper System under Seismic
Excitations.” JVC/Journal of Vibration and Control 19 (12): 1881–94.
https://doi.org/10.1177/1077546312450730.
Moon, Do So. 2012. “Integrated Seismic Assessment and Design Of Plan-Irregular
Structures.” University of Illinois at Urbana-Champaign.

184
Nigdeli, S. Melih, and M. Hasan Boduroǧlu. 2013. “Active Tendon Control of Torsionally
Irregular Structures under Near-Fault Ground Motion Excitation.” Computer-Aided
Civil and Infrastructure Engineering 28 (9): 718–36.
https://doi.org/10.1111/mice.12046.
Nishimura, Isao, Toshikazu Yamada, Mitsuo Sakamoto, and Takuji Kobori. 1998. “Control
Performance of Active-Passive Composite Tuned Mass Damper.” Smart Materials and
Structures 7 (5): 637–53. https://doi.org/10.1088/0964-1726/7/5/008.
Nishitani, Akira, and Yutaka Inoue. 2001. “Overview of the Application of
Active/Semiactive Control to Building Structures in Japan.” Earthquake Engineering
and Structural Dynamics 30 (11): 1565–74. https://doi.org/10.1002/eqe.81.
Ohtori, Y., R. E. Christenson, B. F. Spencer, and S. J. Dyke. 2004. “Benchmark Control
Problems for Seismically Excited Nonlinear Buildings.” Journal of Engineering
Mechanics 130 (4): 366–85. https://doi.org/10.1061/(ASCE)0733-
9399(2004)130:4(366).
Oliveira, Fernando, Miguel Ayala Botto, Paulo Morais, and Afzal Suleman. 2018. “Semi-
Active Structural Vibration Control of Base-Isolated Buildings Using
Magnetorheological Dampers.” Journal of Low Frequency Noise Vibration and Active
Control 37 (3): 565–76. https://doi.org/10.1177/1461348417725959.

185
Özmen, Günay, Konuralp Girgin, and Yavuz Durgun. 2014. “Torsional Irregularity in Multi-
Story Structures.” International Journal of Advanced Structural Engineering 6 (4):
121–31. https://doi.org/10.1007/s40091-014-0070-5.
Pall, A., S. Vezina, P. Proulx, and R. Pall. 1993. “Friction-Dampers for Seismic Control of
Canadian Space Agency Headquarters.” Earthquake Spectra 9 (3): 547–57.
https://doi.org/10.1193/1.1585729.
Pansare, A. P., and R. S. Jangid. 2003a. “Tuned Mass Dampers for Torsionally Coupled
Systems.” Wind and Structures, An International Journal 6 (1): 23–40.
https://doi.org/10.12989/was.2003.6.1.023.
Pansare, A P, and R S Jangid. 2003b. “Tuned Mass Dampers for Torsionally Coupled
Systems.” Wind and Structures, An International Journal 6 (1): 23–40.
Park, Jaewook, and Dorothy Reed. 2001. “Analysis of Uniformly and Linearly Distributed
Mass Dampers under Harmonic and Earthquake Excitation.” Engineering Structures
23 (7): 802–14. https://doi.org/10.1016/S0141-0296(00)00095-X.
Pujol, S., and D. Fick. 2010. “The Test of a Full-Scale Three-Story RC Structure with
Masonry Infill Walls.” Engineering Structures 32 (10): 3112–21.
https://doi.org/10.1016/j.engstruct.2010.05.030.
Rahman, MdMizanur. 2008. The Use of Tuned Liquid Dampers to Enhance the Seismic
Performance of Concrete Rigid Frame Buildings. Vol. 69.
186
Rahman, Mohammad Sabbir, Md Kamrul Hassan, Seongkyu Chang, and Dookie Kim.
2017a. “Adaptive Multiple Tuned Mass Dampers Based on Modal Parameters for
Earthquake Response Reduction in Multi-Story Buildings.” Advances in Structural
Engineering 20 (9): 1375–89. https://doi.org/10.1177/1369433216678863.
Reinhorn, A. M., and M. C. Constantinou. 1995. “Experimental and Analytical Investigation
of Seismic Retrofit of Structures with Supplemental Damping: Part. Ii Friction
Dampers.” Technical Report 95 (9).
Reinhorn, A M, T T Soong, R C Lin, Y P Wang, Y Fukao, H Abe, and M Nakai. 1989. “1:4
Scale Model Studies of Active Tendon Systems and Active Mass Dampers for
Aseismic Protection.” Report No., National Center for Earthquake Engineering
Research, State University of New York at Buffalo, Buffalo, NY, 220. c:%5CCS%5Call
refs%5Ctechnical%5CMCEER reports%5C89-0026.pdf.
Ross, Andrew S., Ashraf A. El Damatty, and Ayman M. El Ansary. 2015. “Application of
Tuned Liquid Dampers in Controlling the Torsional Vibration of High Rise Buildings.”
Wind and Structures, An International Journal 21 (5): 537–64.
https://doi.org/10.12989/was.2015.21.5.537.

187
Sadek, Fahim, Bijan Mohraz, Andrew W. Taylor, and Riley M. Chung. 1997. “A Method of
Estimating the Parameters of Tuned Mass Dampers for Seismic Applications.”
Earthquake Engineering and Structural Dynamics 26 (6): 617–35.
https://doi.org/10.1002/(SICI)1096-9845(199706)26:6<617::AID-
EQE664>3.0.CO;2-Z.
Sakamoto, M, T Kobori, T Yamada, and M Takahashi. 1994. “Practical Applications of
Active and Hybrid Response Control Systems and Their Verifications by Earthquake
and Strong Wind Observations.” In Proc. 1st World Conf. on Struct. Control, 90–99.
Samali, Bijan, and Mohammed Al-Dawod. 2003. “Performance of a Five-Storey Benchmark
Model Using an Active Tuned Mass Damper and a Fuzzy Controller.” Engineering
Structures 25 (13): 1597–1610. https://doi.org/10.1016/S0141-0296(03)00132-9.
Scholl, Roger E. 1989. “Observations of the Performance of Buildings during the 1985
Mexico Earthquake, and Structural Design Implications.” International Journal of
Mining and Geological Engineering 7 (1): 69–99.
Shafieezadeh, Abdollah. 2008a. “Application Of Structural Control For Civil Engineering
Structures.”
https://digitalcommons.usu.edu/cgi/viewcontent.cgi?referer=https://www.google.com
/&httpsredir=1&article=1141&context=etd.

188
Shetty, Kiran K, and Krishnamoorthy. 2011. “Multiple Tuned Mass Dampers for Response
Control of Multi-Storey Space Frame Structure.” Journal of Seismology and
Earthquake Engineering 13 (3–4): 167–78.
http://search.proquest.com/docview/1687372238?accountid=15300%5Cnhttp://sfx.cb
uc.cat/upc?url_ver=Z39.88-
2004&rft_val_fmt=info:ofi/fmt:kev:mtx:journal&genre=article&sid=ProQ:ProQ%3A
engineeringjournals&atitle=Multiple+Tuned+Mass+Dampers+for+Response+Control
Singh, Mahendra P., Sarbjeet Singh, and Luis M. Moreschi. 2002. “Tuned Mass Dampers
for Response Control of Torsional Buildings.” Earthquake Engineering and Structural
Dynamics 31 (4): 749–69. https://doi.org/10.1002/eqe.119.
Soong, T. T. 1988. “State-of-the-Art Review. Active Structural Control in Civil
Engineering.” Engineering Structures 10 (2): 74–84. https://doi.org/10.1016/0141-
0296(88)90033-8.
Soong, T. T., and A. M. Reinhorn. 1993. “An Overview of Active and Hybrid Structural
Control Research in the U.S.” The Structural Design of Tall Buildings 2 (3): 193–209.
https://doi.org/10.1002/tal.4320020303.
Soong, Tsu T, and Michalakis C Costantinou. 1994. Passive and Active Structural Vibration
Control in Civil Engineering. Vol. 345. Springer. https://doi.org/10.1007/978-3-7091-
3012-4.
189
Spencer, B. F., and S. Nagarajaiah. 2003. “State of the Art of Structural Control.” Journal
of Structural Engineering 129 (7): 845–56. https://doi.org/10.1061/(ASCE)0733-
9445(2003)129:7(845).
Spencer, BF, and TT Soong. 1999. “New Applications and Development of Active, Semi-
Active and Hybrid Control Techniques for Seismic and Non-Seismic Vibration in the
USA.” Proceedings of International Post-SMiRT Conference Seminar on Seismic
Isolation, Passive Energy Dissipation and Active Control of Vibration of Structures,
23–25.
Spencer Jr., B. F., R E Christenson, and S J Dyke. 1998. “Next Generation Benchmark
Control Problem for Seismically Excited Buildings.” In Second World Conference on
Structural Control, 1135–1360. http://quiver.eerc.berkeley.edu:8080/.
Stefano, Mario De, and Barbara Pintucchi. 2008. “A Review of Research on Seismic
Behaviour of Irregular Building Structures since 2002.” Bulletin of Earthquake
Engineering 6 (2): 285–308. https://doi.org/10.1007/s10518-007-9052-3.
Symans, Michael D., and Michael C. Constantinou. 1999. “Semi-Active Control Systems
for Seismic Protection of Structures: A State-of-the-Art Review.” Engineering
Structures 21 (6): 469–87. https://doi.org/10.1016/S0141-0296(97)00225-3.
Takewaki, Izuru. 2004. “Bound of Earthquake Input Energy.” Journal of Structural
Engineering 130 (September): 1289–97. https://doi.org/10.1061/ASCE0733-
94452004130:91289.
190
Tekeli, Hamide, and Asim Aydin. 2017. “An Experimental Study on the Seismic Behavior
of Infilled RC Frames with Opening.” Scientia Iranica 24 (5): 2271–82.
https://doi.org/10.24200/sci.2017.4150.
Tse, K. T., K. C. S. Kwok, P. A. Hitchcock, B. Samali, and M. F. Huang. 2007. “Vibration
Control of a Wind-Excited Benchmark Tall Building with Complex Lateral-Torsional
Modes of Vibration.” Advances in Structural Engineering 10 (3): 283–304.
https://doi.org/10.1260/136943307781422208.
Ueng, Jin Min, Chi Chang Lin, and Jer Fu Wang. 2008a. “Practical Design Issues of Tuned
Mass Dampers for Torsionally Coupled Buildings under Earthquake Loadings.”
Structural Design of Tall and Special Buildings 17 (1): 133–65.
https://doi.org/10.1002/tal.336.
Villaverde, Roberto. 1994. “Seismic Control of Structures with Damped Resonant
Appendages.” Proc, First World Conf. on Struct. Control, 1994.
http://www.taylordevices.com/Tech-Paper-archives/literature-pdf/18-
SeismicControlStructures.pdf.
Warburton, G. B. 1982. “Optimum Absorber Parameters for Various Combinations of
Response and Excitation Parameters.” Earthquake Engineering & Structural Dynamics
10 (3): 381–401. https://doi.org/10.1002/eqe.4290100304.
191
Warburton, G. B., and E. O. Ayorinde. 1980. “Optimum Absorber Parameters for Simple
Systems.” Earthquake Engineering & Structural Dynamics 8 (3): 197–217.
https://doi.org/10.1002/eqe.4290080302.
Weber, F. 2014. “Semi-Active Vibration Absorber Based on Real-Time Controlled MR
Damper.” Mechanical Systems and Signal Processing 46 (2): 272–88.
https://doi.org/10.1016/j.ymssp.2014.01.017.
Whittaker, A. S., M. Constantinou, and Christis Z Chrysostomou. 2004. “Seismic Energy
Dissipation Systems for Buildings.” Earthquake Engineering, 2004.
https://www.researchgate.net/profile/Andrew_Whittaker5/publication/272482363_Sei
smic_energy_dissipation_systems_for_buildings/links/54e5566f0cf29865c336f0fb.pd
f.
Whittaker, Andrew S., Vitelmo V. Bertero, Christopher L. Thompson, and L. Javier Alonso.
1991. “Seismic Testing of Steel Plate Energy Dissipation Devices.” Earthquake
Spectra 7 (4): 563–604. https://doi.org/10.1193/1.1585644.
Won, Adrian Y.J., José A. Pires, and Medhat A. Haroun. 1996. “Stochastic Seismic
Performance Evaluation of Tuned Liquid Column Dampers.” Earthquake Engineering
and Structural Dynamics 25 (11): 1259–74. https://doi.org/10.1002/(SICI)1096-
9845(199611)25:11<1259::AID-EQE612>3.0.CO;2-W.

192
Wong, Kevin K. F., and Rong Yang. 2002. “Earthquake Response and Energy Evaluation of
Inelastic Structures.” Journal of Engineering Mechanics 128 (3): 308–17.
https://doi.org/10.1061/(ASCE)0733-9399(2002)128:3(308).
Xiang, Ping, and Akira Nishitani. 2014. “Seismic Vibration Control of Building Structures
with Multiple Tuned Mass Damper Floors Integrated.” Earthquake Engineering and
Structural Dynamics 43 (6): 909–25. https://doi.org/10.1002/eqe.2379.
Xu, Kangming, and Takeru Igusa. 1992. “Dynamic Characteristics of Multiple Substructures
with Closely Spaced Frequencies.” Earthquake Engineering & Structural Dynamics
21 (12): 1059–70. https://doi.org/10.1002/eqe.4290211203.
Yalla, Swaroop K., Ahsan Kareem, and Jeffrey C. Kantor. 2001. “Semi-Active Tuned Liquid
Column Dampers for Vibration Control of Structures.” Engineering Structures 23 (11):
1469–79. https://doi.org/10.1016/S0141-0296(01)00047-5.
Yamaguchi, Hiroki, and Napat Harnpornchai. 1993. “Fundamental Characteristics of
Multiple Tuned Mass Dampers for Suppressing Harmonically Forced Oscillations.”
Earthquake Engineering & Structural Dynamics 22 (1): 51–62.
https://doi.org/10.1002/eqe.4290220105.
Yura, Joseph A. 2001. “Fundamentals of Beam Bracing.” Engineering Journal-American
Institute of Steel Construction 38 (1): 11–26.

193
Zapateiro, Mauricio, Hamid Reza Karimi, Ningsu Luo, Brian M. Phillips, and Billie F.
Spencer. 2009. “Semiactive Backstepping Control for Vibration Reduction in a
Structure with Magnetorheological Damper Subject to Seismic Motions.” Journal of
Intelligent Material Systems and Structures 20 (17): 2037–53.
https://doi.org/10.1177/1045389X09343024.
Zapateiro, Mauricio, Ningsu Luo, and Hamid Reza Karimi. 2008. “QFT Control for
Vibration Reduction in Structures Equipped with MR Dampers.” In Proceedings of the
American Control Conference, 5142–44. IEEE.
https://doi.org/10.1109/ACC.2008.4587310.