Embed Size (px)
Citation preview

Latent Class Analysis
Presented by Nicholas BranicUCI Stats n’ SnacksDecember 9, 2014

Presentation Overview
• What is latent class analysis?• Writing MPlus code and running LCA• Importing MPlus output into Stata• …And fixing an irritating importation problem
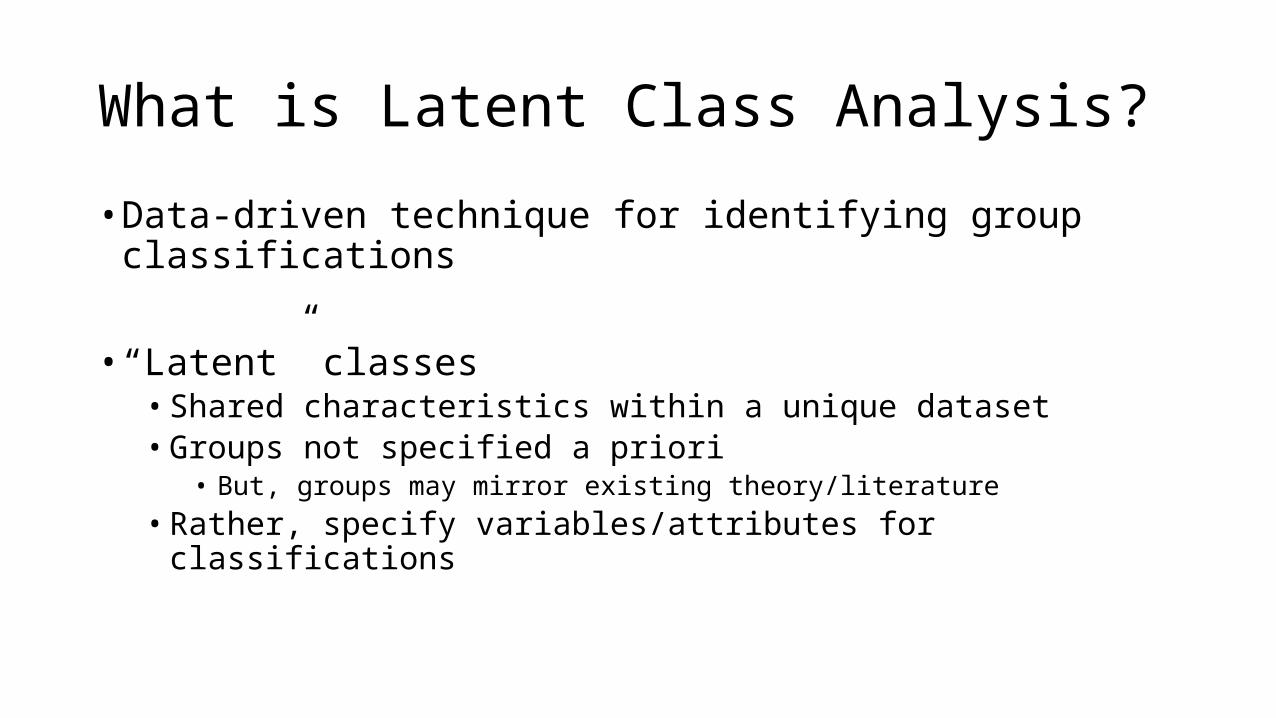
What is Latent Class Analysis?
• Data-driven technique for identifying group classifications
• “Latent” classes• Shared characteristics within a unique dataset• Groups not specified a priori
• But, groups may mirror existing theory/literature• Rather, specify variables/attributes for classifications

What is Latent Class Analysis?• Generate predicted probabilities of class membership

What is Latent Class Analysis?
• Identify class membership for cases in dataset• For example, changing home mortgage loan activity across SoCal tractsClass Tracts Percent Class Tracts Percent
17 447 11.3% 9 165 4.2%
15 435 11.0% 10 162 4.1%
12 383 9.7% 6 148 3.7%
14 372 9.4% 1 109 2.8%
11 275 7.0% 7 100 2.5%
13 273 6.9% 5 86 2.2%
16 229 5.8% 2 77 2.0%
4 205 5.2% 19 75 1.9%
8 183 4.6% 3 51 1.3%
18 173 4.4%

What is Latent Class Analysis?
• Other statistical techniques similar to LCA:• Exploratory factor analysis• Principle components analysis• Confirmatory factor analysis• K-means cluster analysis• Hot spot analysis
• …And I’m sure there are more examples

So How Can I Use It?
• Steps for using Stata and MPlus:• In Stata:
• Prepare dataset for LCA• Use “outfile” command to produce data as .txt file
• In MPlus:• Write input file to run latent class analysis• Execute the model• Produce .txt output file
• In Stata:• Import .txt output into Stata• Clean LCA results• Merge LCA results into original dataset

Preparing Your Data
• Open your full dataset• Remove any cases that feature entirely missing data• In Stata, any case that has all “.” values• A shortcut: use the “mdesc” command (downloadable .ado file)
• Sort your data – not necessary, but not a bad idea• Save out a copy of prepared data• You’ll merge the LCA results to this dataset later

Exporting Your Data• Use the “outfile” command to create a .txt form of your data
Writing LCA Code in MPlus
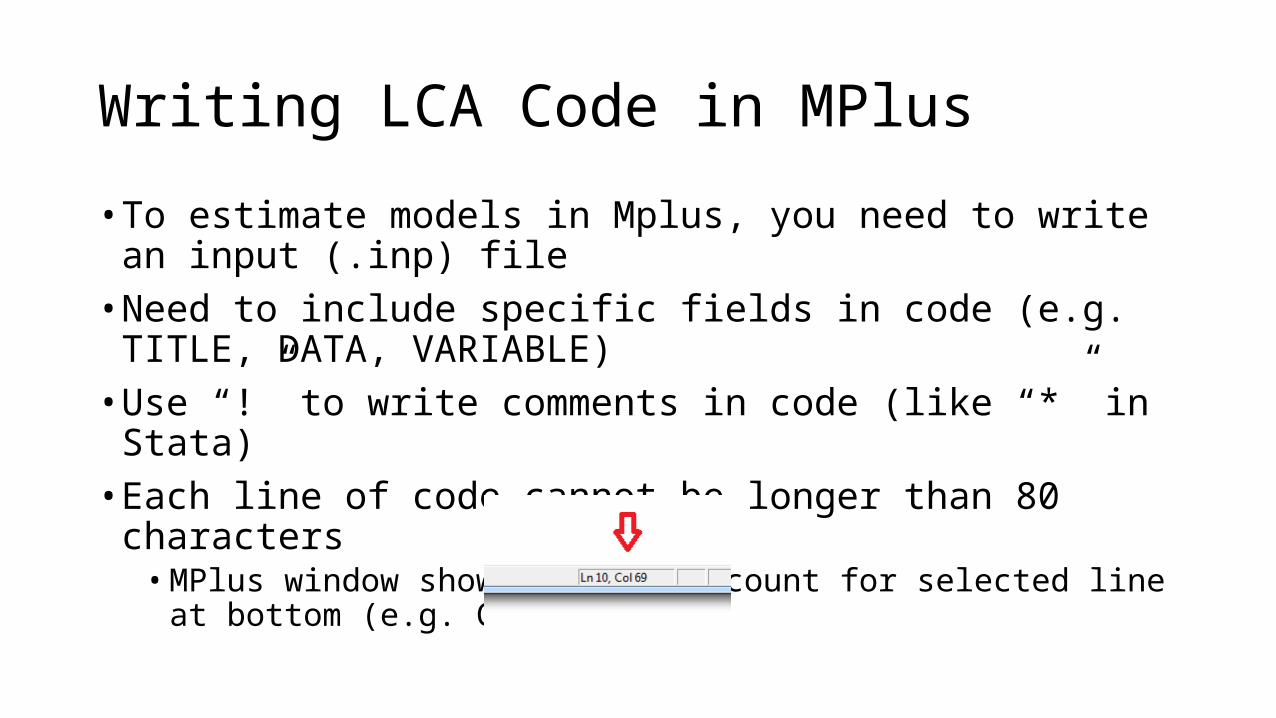
• To estimate models in Mplus, you need to write an input (.inp) file• Need to include specific fields in code (e.g. TITLE, DATA, VARIABLE)• Use “!” to write comments in code (like “*” in Stata)• Each line of code cannot be longer than 80 characters• MPlus window shows character count for selected line at bottom (e.g. Col 69)

Writing LCA Code in MPlusFirst, specify TITLE and DATA fields
Writing LCA Code in MPlus
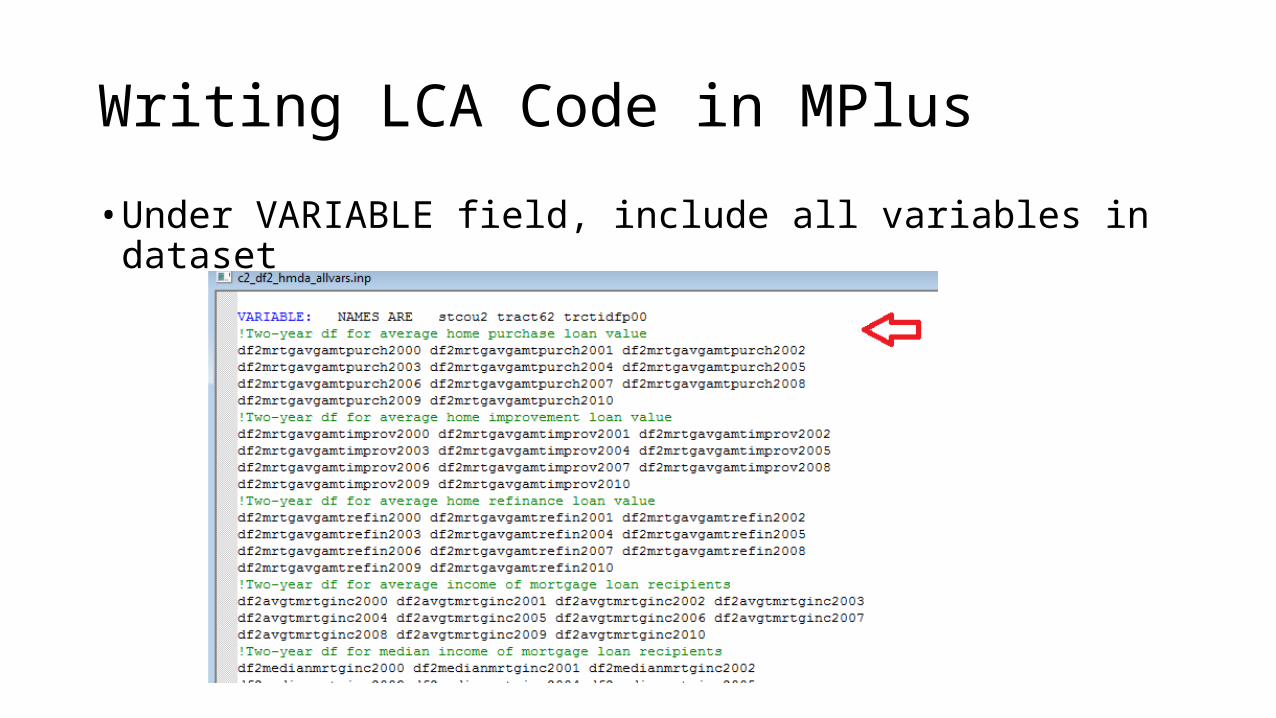
• Under VARIABLE field, include all variables in dataset

Writing LCA Code in MPlus
• Indicate MISSING ARE field (for Stata, this will be “.”)• USEVAR ARE lists the subset of variables to include in the LCA

Writing LCA Code in MPlus
• The CLASSES field indicates the number of classes to estimate

Writing LCA Code in MPlus
• ANALYSIS specifies the model you will run• TYPE = missing mixture• STARTS indicates the number of model iterations

Writing LCA Code in MPlus
• Next, specify the MODEL – four important parts

Writing LCA Code in MPlus
• For MODEL, write “%OVERALL%”

Writing LCA Code in MPlus
• The “%c#2%” part indicates the class solution• At a minimum, you will always have at least the c#2 block of code• For a three-class solution, you would repeat a “%c#3%” section, etc.

Writing LCA Code in MPlus
• Next, include all of your LCA-selected variables in two sections• The first section is enclosed in brackets [ ]

Writing LCA Code in MPlus
• The second section has the same variables but without brackets

Writing LCA Code in MPlus
• After MODEL, specify the OUTPUT field• For our purposes, use “sampstat” and “standardized”

Writing LCA Code for MPlus
• Finally, write the SAVEDATA field to kick out the LCA results• Indicates the name of the file to create (this will always be a .txt file)• Indicates what information to save out (we want “CPROBABILITIES”)

Writing LCA Code for MPlus
• Some additional notes:• You need to include “;” to denote the end of different sections of code• Read through the example input file to see all of the necessary locations

Writing LCA Code for MPlus
• Some additional notes:• Remember that you need to keep each line of code within 80 characters
• Otherwise, MPlus will cut off any code at 81 characters or beyond
• Remember that you can use “!” to include comments in your code
• All files referenced in your input file will be .txt files• The data you’re calling in (e.g. “mplus_df2_hmda_test.txt”)• The output that you save out (e.g. “df2_c2.txt”)

Running the Latent Class Analysis
• Click on the “Run” icon to begin estimation

Running the Latent Class Analysis
• MPlus will estimate your model according to the number of iterations specified in your input file (e.g. 100 iterations), each with different starting values for estimation

Running the Latent Class Analysis
• How long will estimation take?• Depends on a few factors:
• The size of your dataset• The number of included variables• The number of specified classes• The number of specified model iterations• Your computer’s processing speed and memory
• I’ve had models take 30 seconds and models that run for 60+ hours
I Ran My Model…Now What?
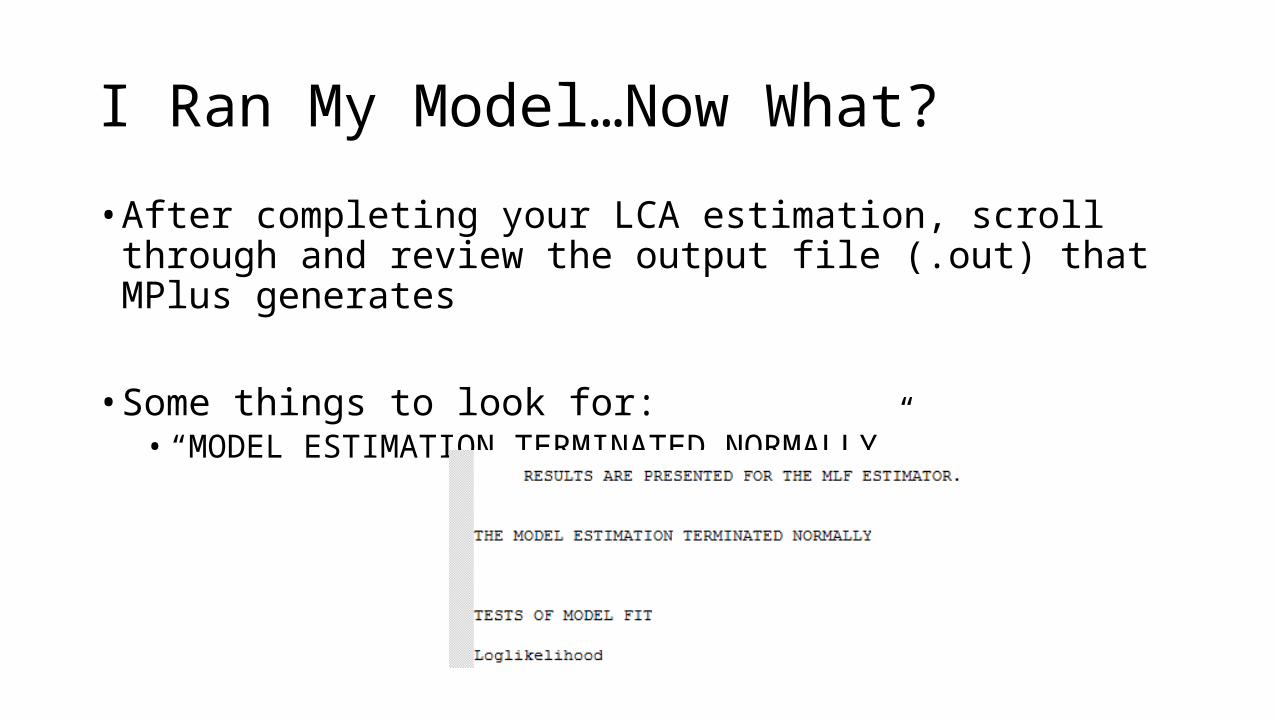
• After completing your LCA estimation, scroll through and review the output file (.out) that MPlus generates
• Some things to look for:• “MODEL ESTIMATION TERMINATED NORMALLY”

Post-Estimation Review
• Some things to look for:• Bayesian Information Criterion (BIC)
BIC is used to compare different models (e.g. a two-class versus a three-class solution) and see which provides a better fit for your data.
A lower BIC value indicates a better fit, so keep testing models until the BIC stops declining and begins to increase again

Post-Estimation Review
• Some things to look for:• The number/percent of cases that fall into each estimated class

Post-Estimation Review
• Some things to look for:• The entropy score for your model
“Entropy” values range between zero and one, where a value of one means that each class is perfectly unique from the others
You want this value to be as close to one as possible. I don’t know if there is an accepted threshold or cutoff for entropy levels that are “too low.” I also don’t know whether entropy is reported in published research as an indicator of model fit or quality.

Post-Estimation Review
• Some things to look for:• The end of the output file shows how long your model took to estimate

Post-Estimation Review
• After estimating your model, try estimating a new model with one additional class• For this example, I ran a two-class solution, so next I would specify three
classes• This way, I can find the optimal class solution for my data (by comparing BIC
values between models)

Running the Next LCA Model
• Open the two-class input file, use “Save As” to save a new three-class input file, and make just a few edits:
• Change the number of classes from (2) to (3)

Running the Next LCA Model
• Copy and paste the variable list in the MODEL field and then change the header to “%c#3%” for a three-class model
Note: you still need to keep the “%c#2%” section from before, so now you will have a c#2 section followed by a c#3 section in your input file.

Running the Next LCA Model
• Change the name of the .txt data file that MPlus will kick out

Running the Next LCA Model
• After running a three-class solution, review the output file created by MPlus -- if the BIC decreased, then create a new input file for a four-class solution and estimate this new model
• Repeat these steps until your BIC value stops decreasing and instead begins to increase – the model with the lowest BIC is your optimal solution!
Running the Next LCA Model
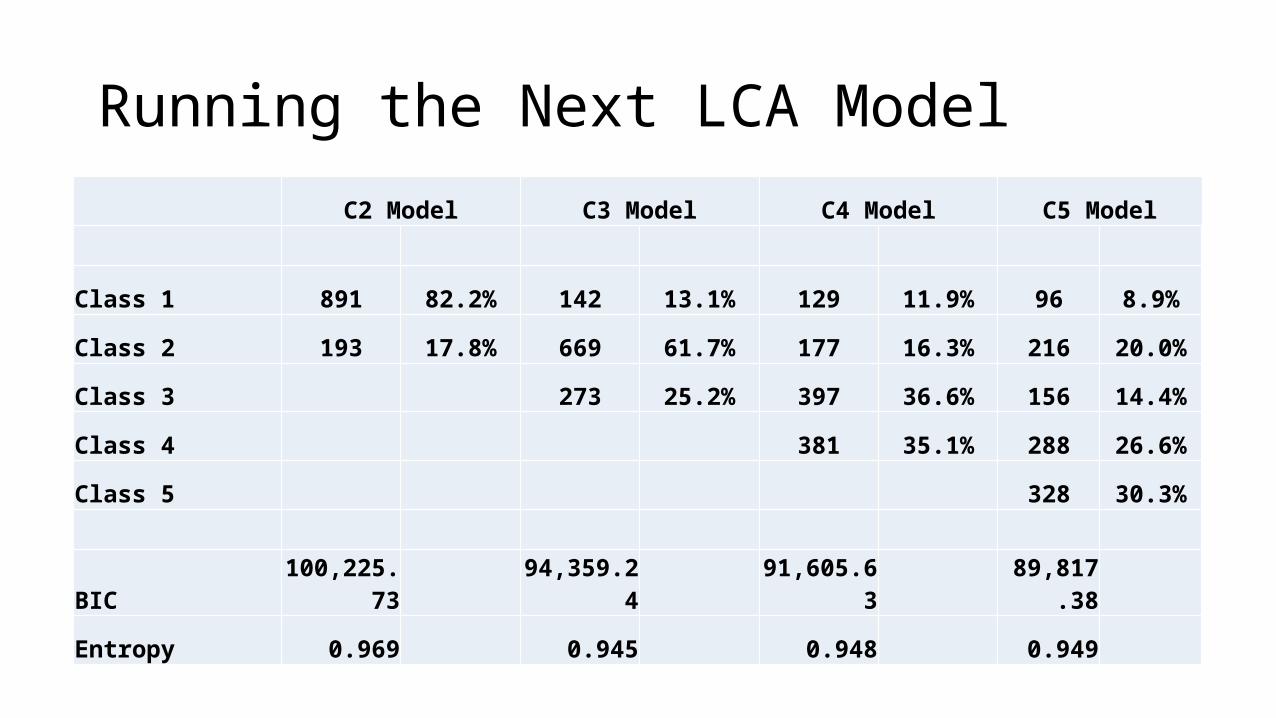
C2 Model C3 Model C4 Model C5 Model
Class 1 891 82.2% 142 13.1% 129 11.9% 96 8.9%
Class 2 193 17.8% 669 61.7% 177 16.3% 216 20.0%
Class 3 273 25.2% 397 36.6% 156 14.4%
Class 4 381 35.1% 288 26.6%
Class 5 328 30.3%
BIC 100,225.73 94,359.24 91,605.63 89,817.38
Entropy 0.969 0.945 0.948 0.949

Importing MPlus Output into Stata
• After identifying your optimal model, read your .txt LCA output back into Stata and merge into your original dataset
• My preference: use the “stcmd” commands, which call StatTransfer from within Stata• Easily convert .txt to .dta format• For example:
• inputst df2_c5.txt• outputst df2_c5.dta /y
• Alternatively, you could open the .txt file in Excel, save as a .csv file, and use the “import delimited” command in Stata


…What Just Happened?
• MPlus uses asterisks (“*”) to denote missing data in its output file• Conversely, Stata uses periods (“.”)
• These asterisks cause a number of issues in your dataset:• Turn numeric variables into strings• Cause data to “shift” columns to the left• Pull your predicted probabilities and class ID out of proper columns

The Solution? Shift the Data Back
• I wrote an .ado file for Stata that will automatically reverse the data shifting problem with MPlus LCA output
• I gave this .ado file an imaginative title:• “mpluslcafix”

Fixing Your MPlus Output
• With your MPlus output loaded into Stata, enter the following commands:
adopath + “<foldercontainingadofile>”mpluslcafix

Fixing Your MPlus Output

Fixing Your MPlus Output

Fixing Your MPlus Output
• The “mpluslcafix” command will save out a new .dta file with your corrected LCA data• Merge this new file back into your original dataset:
use <originaldataset>, clearmerge 1:1 _n using <newdataset>
• For example:
use df2_hmda_lca_test_tomerge, clearmerge 1:1 _n using df2_c5

Fixing Your MPlus Output
• Now, you can use your latent class analysis results in statistical models!
• Hooray!

Thanks for Listening!
• Please feel free to email me with questions, comments, issues:• [email protected]
• Also, please help me to “stress test” the .ado file!• Try it on different types of data• Try to break it• Let me know if you find glitches so that I can fix them