Embed Size (px)
Citation preview
Palaeogeography, Palaeoclimatology, Palaeoecology 395 (2014) 198–221
Contents lists available at ScienceDirect
Palaeogeography, Palaeoclimatology, Palaeoecology
j ourna l homepage: www.e lsev ie r .com/ locate /pa laeo
Late Barremian–early Aptian dark facies of the Subbetic (Betic Cordillera,southern Spain): Calcareous nannofossil quantitative analyses,chemostratigraphy and palaeoceanographic reconstructions
Roque Aguado a,⁎, Ginés A. de Gea b, José M. Castro b, Luis O'Dogherty c, María Luisa Quijano d,B. David A. Naafs e, Richard D. Pancost e
a Departamento de Geología and CEACTierra, Universidad de Jaén, EPS Linares, E-23700 Linares, Spainb Departamento de Geología and CEACTierra, Universidad de Jaén, Campus Las Lagunillas, E-23071 Jaén, Spainc Departamento de Ciencias de la Tierra, Universidad de Cádiz, CASEM, E-11510 Puerto Real, Spaind Departamento de Química Orgánica e Inorgánica and CEACTierra, Universidad de Jaén, Campus Las Lagunillas, E-23071 Jaén, Spaine Organic Geochemistry Unit, The Cabot Institute, School of Chemistry, University of Bristol, BS8 1TS, UK
⁎ Corresponding author. Fax: +34 953 648 622.E-mail address: [email protected] (R. Aguado).
0031-0182/$ – see front matter © 2013 Elsevier B.V. All rihttp://dx.doi.org/10.1016/j.palaeo.2013.12.031
a b s t r a c t
a r t i c l e i n f oArticle history:Received 17 July 2013Received in revised form 26 November 2013Accepted 19 December 2013Available online 30 December 2013
Keywords:Calcareous nannofossilsPlanktonic foraminiferaRadiolariaPalaeoceanographyChemostratigraphyLatest Barremian–early Aptian
In order to determine the driving mechanism behind the deposition of the Aptian dark facies in the pelagicSubbetic Basin (southern Spain), two latest Barremian–early Aptian complementary sections embracing theOceanic Anoxic Event 1a, were selected for a multidisciplinary study. Quantitative and statistical analyses of cal-careous nannofossil assemblages are complemented with planktonic foraminifera, radiolaria, and geochemicaldata (C and O isotopes and biomarkers). The results indicate that most of the latest Barremian was characterizedby oligotrophic conditions with a low nutricline and neritic influence, which were interrupted by short-lived ep-isodes of mesotrophic surface waters. In contrast, broadly meso-eutrophic surface waters with a high nutriclineand a probable development ofwater stratification are inferred formost of the early Aptian. It is suggested that anincreased runoff, as a consequence of a more humid climate in the adjacent continental area, caused this fertili-zation. Neritic dwellers, such as nannoconids and pentaliths, experienced a drastic decrease in abundance as theresult of the combined effects of a biocalcification crisis (‘nannoconid crisis’) and the deepening of the basin. Highproductivity and enhanced surface-water stratification favoured low oxygen content in the bottom waters,increasing organicmatter preservation. A reduction in surface water fertility and a shift towards generally coolerconditions occurred during the late early Aptian. It is postulated that a cooler and drier climate leads to a reduc-tion in runoff and decreased nutrient flux into the basin. The obtained results suggest that the formation of theAptian dark facies was mainly controlled by enhanced production of organic matter in the upper water columnand not enhanced preservation.
© 2013 Elsevier B.V. All rights reserved.
1. Introduction
The Cretaceous is generally considered to be characterized by agreenhouse climate state, with warm temperatures, high atmosphericCO2 concentrations, low latitudinal temperature gradients, and highsea levels (Huber et al., 1995; Wilson and Norris, 2001; Skelton,2003). This global environmental setting was related to a palaeo-geographic configuration that facilitated ocean circulation and activatedseafloor spreading, leading to high sea-level and intense volcanicoutgassing (e.g. Erba, 1994; Leckie et al., 2002; Skelton, 2003; Tejadaet al., 2009). In this context, several episodes of accelerated globalchange took place, linked to major perturbations of the global carboncycle, which have been collectively interpreted as ‘Oceanic AnoxicEvents’ (OAEs) (Schlanger and Jenkyns, 1976; Jenkyns, 1980; Arthur
ghts reserved.
et al., 1985; Jenkyns, 2010). These episodes of generalized environmen-tal change left a distinct imprint on life and the environment, both inmarine and continental settings, and have a primary record on wide-spread marine black shale deposition (see review in Föllmi, 2012).
Calcareous nannoplankton is one of the most abundant marineplanktonic groups, and changes in their assemblages reflect variationsin the thermal and trophic regime of extant and ancient marine envi-ronments (e.g. Brand, 1994; Winter et al., 1994; Herrle, 2003; Herrleand Mutterlose, 2003; Tremolada et al., 2006). Biotic signals, includingboth productivity and ecosystem changes, are also recorded by thecomposition and abundance of sedimentary organic matter, which canbe interpreted in terms of marine productivity, terrestrial vs. marinesources of organic matter, and the redox state of the ocean (i.e. Meyers,1997; Pancost et al., 2004; Quijano et al., 2012).
OAEs are characterized by large and global shifts in ocean/atmosphere δ13C values, reflecting major perturbations in the globalcarbon cycle. A common feature of OAEs is a positive excursion that
199R. Aguado et al. / Palaeogeography, Palaeoclimatology, Palaeoecology 395 (2014) 198–221
occurs in both marine and terrestrial δ13Ccarb and δ13Corg, interpretedas the result of massive deposition of isotopically light organic matter(e.g. Jenkyns, 2010). Inversely, negative δ13C excursions have been re-lated to the input of light carbon into the atmosphere–ocean systemfrom volcanic CO2 outgassing and/or methane release (Larson, 1991;Larson and Erba, 1999; Jahren et al., 2005; Méhay et al., 2009; Tejadaet al., 2009; Erba et al., 2010).
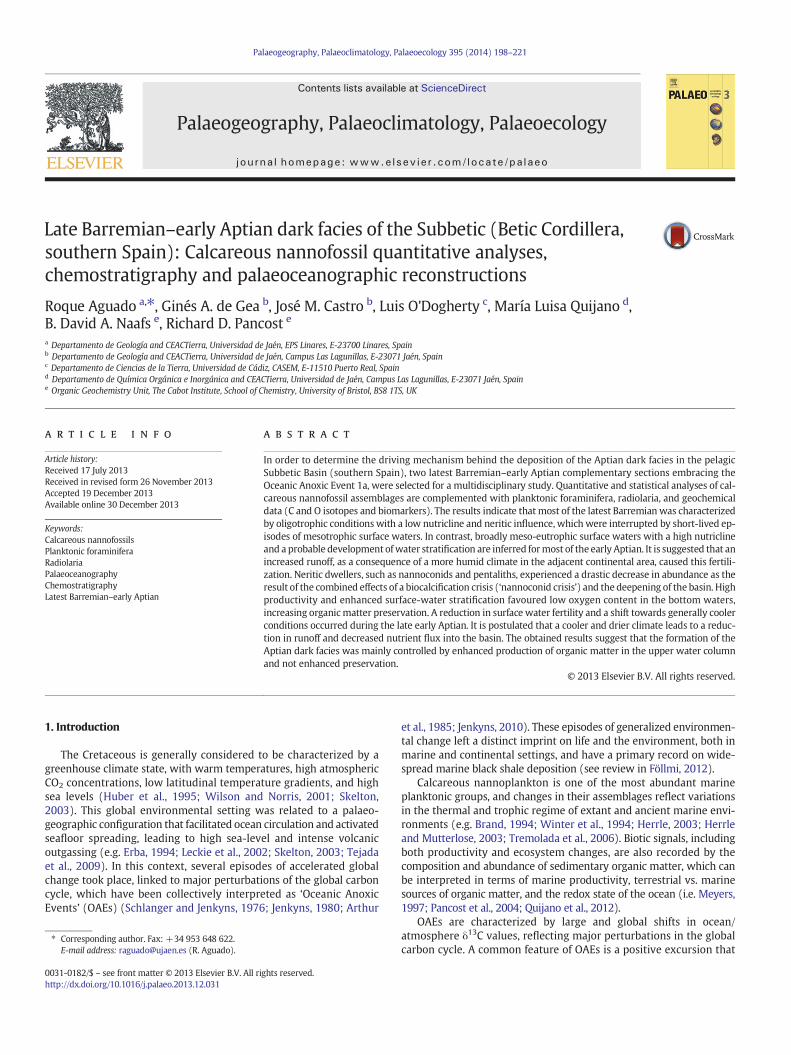
The aim of this study is to document the fluctuations in the compo-sition and abundance of nannofossil assemblages during the lateBarremian–early Aptian interval of two pelagic sections deposited inthe Southern Iberian Palaeomargin (SIPM) (Fig. 1a), in order to recon-struct environmental changes during this time interval. The sectionsstudied embrace two major global events: the Early Aptian OceanicAnoxic Event 1a (OAE 1a), which has been characterized bywidespreadblack shale deposition (Jenkyns, 2010), and the ‘nannoconid crisis’,which represents a major biotic turnover (Erba, 1994; Aguado et al.,1999; Herrle and Mutterlose, 2003). We used previously definednannofossil-derived indices to determine variations in surface watertemperature and productivity (Herrle, 2003; Tremolada et al., 2006;Tiraboschi et al., 2009; Herrle et al., 2010), which have been slightlymodified to accommodate the fossil assemblages present in the studiedmaterial. In order to integrate and complement the nannofossil results,a study about the variations in the abundance and distribution of plank-tonic foraminifera, radiolaria, and biomarkers was carried out.
2. Location, palaeogeography and stratigraphy
The La Frontera sections are located in the central part of the BeticCordillera, some 30 km south of Jaén (Fig. 1b,c,d), and belong to the
Subbetic chaotic complexand triassic materials
Prebetic Subbetic
Tertiary
JAÉN
Martos
Campillode Arenas
N10 km
37o33’
Iberia
Africa
Eurasia
SIPM
Pelagic basins
Exposed land
LA FRONTERA
Shallow seas and platforms
America
SIPM Southern Iberian Palaeomargin
c
a
Intermediate Domain
Fig. 1. Location of the studied Sections. a) Early Aptian palaeogeographic reconstruction showinin the central part of the Betic Cordillera, southern Spain. c) Geologic location. d) Detailed locationear the A-44 road.
Subbetic Zone, which was deposited in the pelagic areas of the SIPMduring the Mesozoic (Fig. 1a). During the Early Cretaceous this regionunderwent extensional tectonics associatedwith the seafloor spreadingof the North Atlantic in a transform continental margin setting (Vera,2004). Active listric faults triggered block tilting and favoured bothgradual and abrupt lateral changes in facies and in the subsidence rate(Vera, 2004). The La Frontera successions were deposited on a pelagictrough surrounded by swells to the north and south, where pelagicmarls, marlstones, black shales and radiolarian marls were depositedduring the Barremian–Aptian interval (de Gea et al., 2008). A palaeo-latitude of 20°–25° N has been inferred for the Aptian position ofthese sections (e.g. Masse et al., 1993) (Fig. 1a).
The stratigraphy of the Barremian–Aptian of the La Frontera sections ischaracterized by a pelagic rhythmite succession of the Carretero Forma-tion (Barremian) and the dark marls, radiolaritic claystones and greenmarls of the Carbonero Formation (early Aptian). Two sections havebeen studied at the La Frontera area (XF andXF1 in Fig. 2). TheXF1 sectionis the most complete and has a total thickness of about 42 m: the basal3 m are composed of alternating grey marls and marly limestones ofthe uppermost part of the Carretero Formation (upper Barremian), andthe upper 39 m consists of a succession made mostly of marls andradiolaritic claystones, which belongs to the lower Aptian Carbonero For-mation. The XF is a complementary section located some 50 m south ofthe previous and embraces the upper part of the Carretero Formation(11 m) and the lower part of the Carbonero Formation (10 m).
The sections have been divided into five lithological units for descrip-tive purposes. Lithological unit A corresponds to the greymarls andmarlylimestones of the Carretero Formation, which is better exposed in sectionXF (11 m thick), whereas in section XF1 only the uppermost part of this
XF
XF1
A-44
200 km
IberianMassif
Pyrenees
Basque-Cantabrian Basin
Madrid
Tertiary basins
Studied sections
Alpine chains
Variscan belt
b
d
g the location of La Frontera sections inwestern Tethys. b) Location of La Frontera sectionsn of XF (37° 35′ 34.22″N; 3° 36′ 15″W) and XF1 (37° 35′ 35.50″N; 3° 36′ 13″W) sections

0
2
4
6
8
10
12
14
16
18
20
22
24
26
28
30
32
34
36
38
δ13Ccarb δ18Ocarb
δ13Ccorg Abundance
(nannof./g sed. x 10 )8 Evenness
Preservation S. richness Shannon index
δ18Ocarb Preservation
Key to lithology
Marl
Marly limestone
Black marl
Laminated radiolaritic claystone
Dark grey laminated marl
Carbonaceous woody fragments
Green marl
Radiolaritic claystone
0
2
4
6
8
10
12
14
16
18
20
P M G 0 20 40 60 0 1 2 3-1 0 1 2 3 4 -3.5 -3.0 -2.5 -2.0
C1
C2
C2
C5
C6
C7
C8
C4
C4
C3
C3
XF section
XF1 section
C
D
E
B
A
A
B
CUn-zoned
Bioevents
F. oblongusG. aptiensis*
H. irregularis,N. truittii
H. irregularis,N. truittiiP. excelsa* G. duboisi*
R. angustus
P. excelsa* G. duboisi*
R. angustus
R. planus
S. achylosus
L. cabri*
C. rothii
C. rothii
E. floralis, E. apertiorL. cabri*
Nannoconidcrisis event
Nannoconidcrisis event
0 1 2 3
0∑ C27-C29 Steranes
(ng/g TOC)
0.2 0.4 0.6 0.8
Pristane + Phytane(ng/g TOC)
Biomarkers
-1 0 1 2 3 4
-28 -26 -24 -22 -20 -18
-3.5 -3.0 -2.5 -2.0
-3.5 -3.0 -2.5 -2.0
0 20 40 60 0 1 2 3
0.4 0.8
P M G 0.4 0.8-28 -26 -24 -22 -20 -18 -3.5 -3.0 -2.5 -2.0
P M G
P M G 400 800 1200
400 800 1200
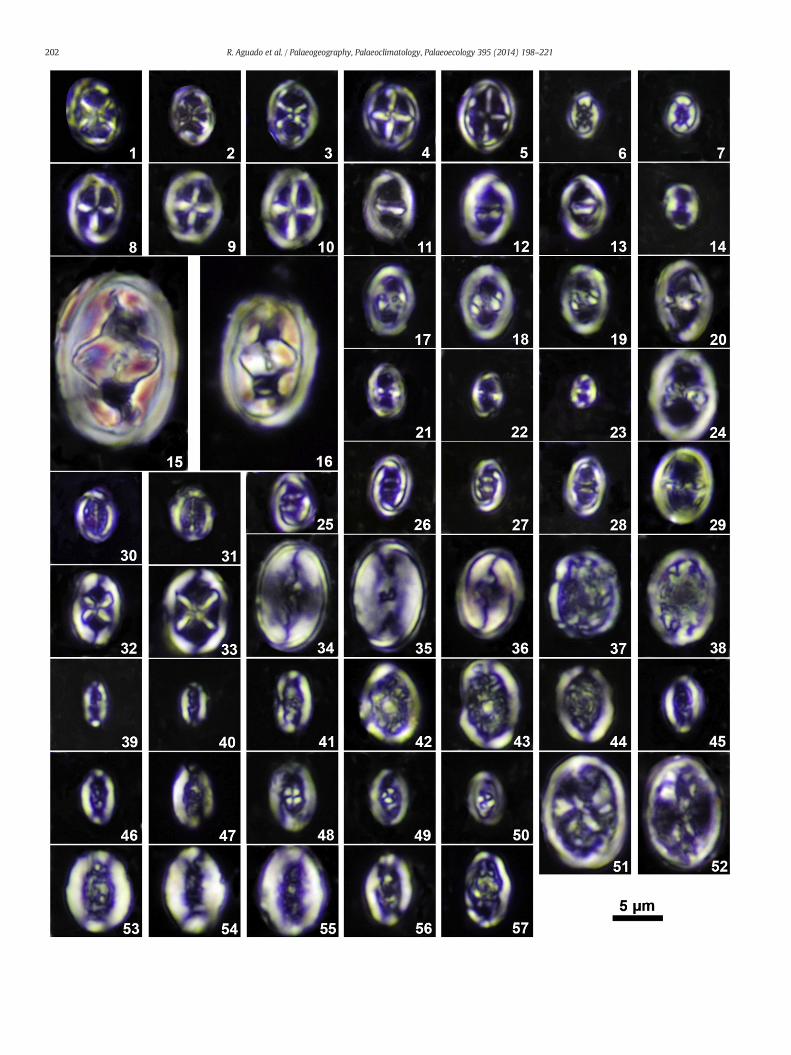
Fig. 2. Lithologic columns with differentiated units (A–E), calcareous nannofossil, planktonic foraminifer and radiolarian biostratigraphies and stable isotopes geochemistry (δ13Corg, δ13Ccarb and δ18Ocarb curves) for the XF (bottom) and XF1 (top)sections. TheMenegatti et al. (1998) intervals are indicated in the carbon-isotope curves. Calcareous nannofossil zones are after Roth (1978) and Bralower et al. (1995). Planktonic foraminiferal zones are afterMoullade (1966), Caron (1985), Aguadoet al. (1992, 1999), Verga (2004) and Coccioni et al. (2007). Radiolarian zones are after O'Dogherty (1994). Nannofossil preservation (P = poor, M = moderate, G = good), absolute abundance (nannofossils/gram of sediment × 108), species rich-ness, Shannon index and evenness curves for the studied interval. The most relevant biostratigraphical nannofossil and planktonic foraminiferal (marked with asterisks) events are also indicated. True first and last occurrences of taxa are marked inblack colour. First/last records of taxa in the sections are marked in grey. The vertical grey lines at the right side of the figure indicate the presence and fluctuations in abundance (width) of planktonic foraminifera with elongated chambers. Con-centrations of selected biomarkers from section XF1 are illustrated (see text for explanation). The shaded bands correspond to the negative carbon isotope excursion (CIE) and OAE1a interval.
200R.A
guadoetal./Palaeogeography,Palaeoclim
atology,Palaeoecology395
(2014)198
–221

201R. Aguado et al. / Palaeogeography, Palaeoclimatology, Palaeoecology 395 (2014) 198–221
unit (3 m) crops out. The Carbonero Formation comprises units B to E.Lithological unit B is 8 m thick in the XF complementary section, whereit embraces a succession of 5.5 m of black marls, followed by a level ofdark grey laminated marls (1 m thick), and ends with 2 m of blackmarls with a nodular marly limestone bed intercalated. In the main sec-tion (XF1) unit B is thinner because of the lack of carbonates in the equiv-alent upper part of this unit in section XF. It is composed of 3.5 m of blackmarls with a nodular marly limestone bed intercalated. Unit C has beendefined as the interval of radiolaritic claystoneswhich, in spite of its prox-imity, has different stratigraphic extent in the sections studied (2 m cropout in section XF, 6.5 m thick in XF1 section). This unit contains carbona-ceous fragments of landwoodymaterial (Fig. 2), and presents laminationin a 0.8 m thick level locatedwithin its upper part. The laminated levels inboth sections are stratigraphically equivalent. Unit D is only exposed inthe section XF1, and it is made of 14 m of black marls with a level ofnodular marlstones in its lower part. Unit E crops out in the section XF1,and it is made of 14 m of green marls with a thin marlstone level in itsbase. TOC values (measured in XF1 section) range between 0.5% and 3%(average 1.1%), with the higher values recorded within lithological unitC (Quijano et al., 2012).
3. Materials and methods
In total 109 samples (28 from XF section and 81 from XF1 section)were collected from the Carretero and Carbonero formations. Samplespacing was uneven, closer in the dark facies and looser near the baseand top of the investigated interval, and fluctuates between 2.5 m and5 cm (average 52 cm). Fractions of each of these samples were usedfor calcareous nannofossil, planktonic foraminiferal and radiolarian in-vestigations and for carbon and oxygen-isotope stratigraphy.
3.1. Calcareous nannofossils
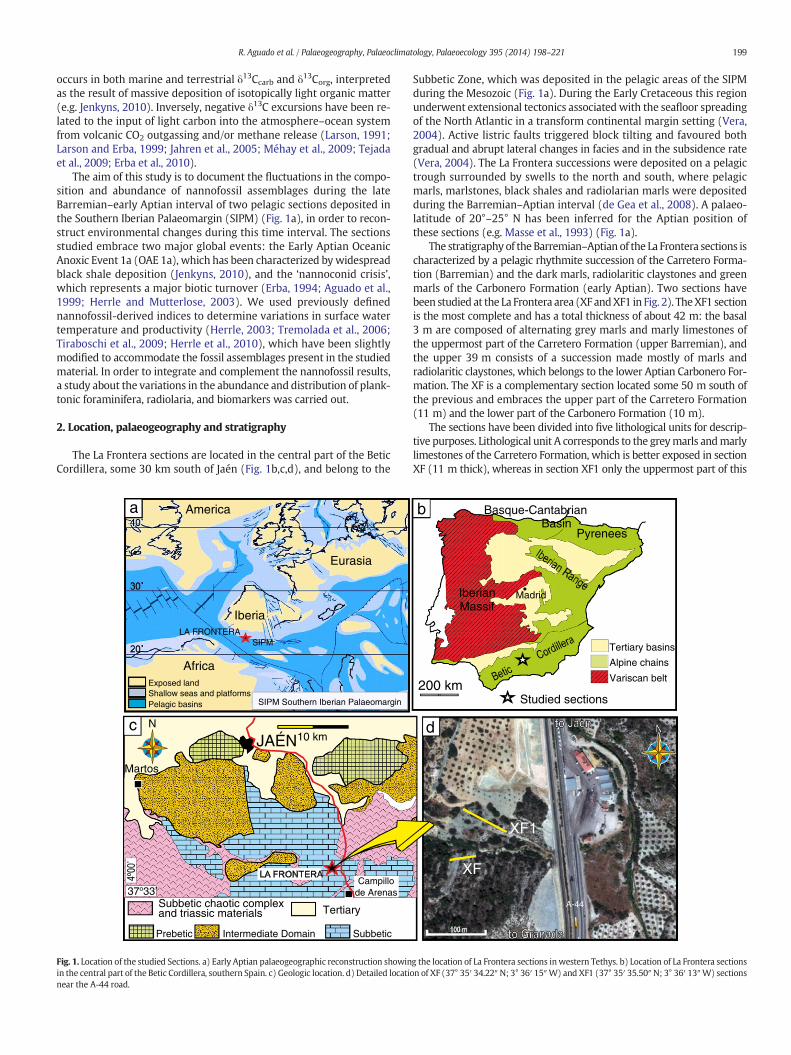
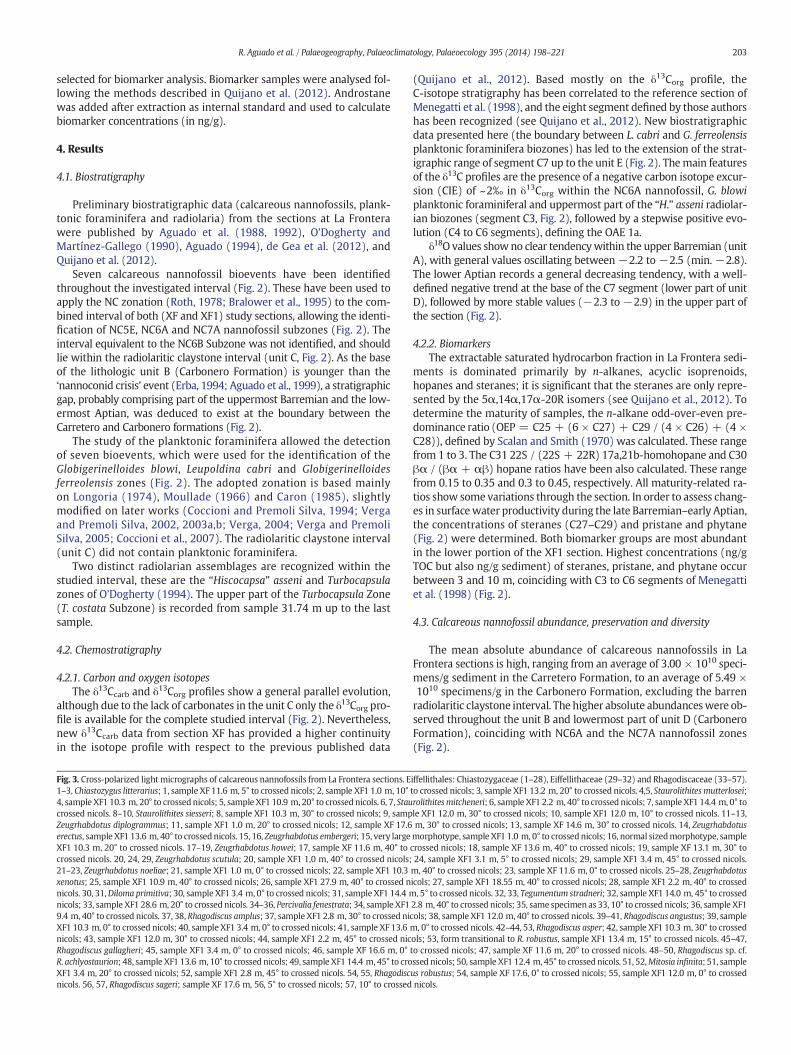
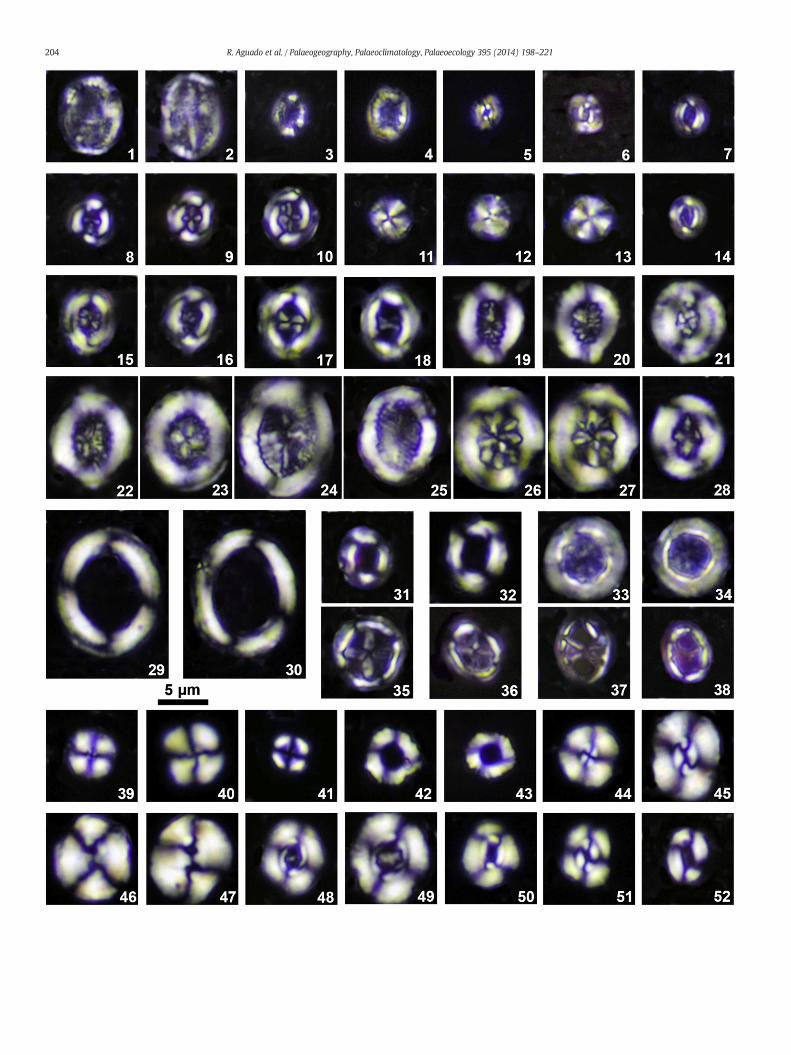
Smear slides of all the collected samples were prepared followingthe decantation method described in Geisen et al. (1999) and were ex-amined using a polarizing light microscope Olympus BHSP at 1200×magnification. Potential carbonate dissolution was checked by the ex-amination of simple smear slides of unprocessed sample material. Thesmear slides from samples in the unit C in section XF1 (21)were devoidof calcareous nannofossils (Fig. 2). In the remaining 88 samples (28from XF section and 60 from XF1 section), at least 400 determinablenannofossil specimens (average 556)were counted in each slide to per-form an analysis of the assemblage composition. Only in one sample (XF5.2 m) a minor number of nannofossil specimens (318) were counted.In addition, smear-slide investigation was extended to complete 200fields of view along a longitudinal traverse in order to report the pres-ence of rare taxa. The taxonomic framework used (Figs. 3–5 andAppendix A) is based in Perch-Nielsen (1985), Aguado et al. (1997),Bown (1998, 2005), Kennedy et al. (2000), Tremolada and Erba(2002) and Herrle and Mutterlose (2003). All coccoliths with morethan half of the specimens preserved were included in the counts. ForMicrantholithus, the amount of clearly identified isolated elements wasdivided by 5 and also included in the counts. From these data, the abso-lute (nannofossils per gram of rock; Geisen et al., 1999) and relative (%of single taxa relative to the total assemblage) abundances werecalculated.
Nannofossil preservation was evaluated using the visual criteriaintroduced by Roth and Thierstein (1972) and Roth (1983). Foreach sample, diversity was determined using the parameters ofspecies richness, heterogeneity (Shannon Index) and evenness.The Shannon Index (Shannon and Weaver, 1949) and evennesswere calculated using the Past v2.16 software (Hammer et al.,2001). High values of these stand for highly diverse assemblageswhereas low values represent less diverse assemblages dominatedby one species only.
For the quantitative analyses, among the 75 taxa identified, somewere grouped at a generic level, such as Assipetra spp., Micrantholithusspp., Nannoconus spp., and Retecapsa spp. Other groupings include theWatznaueria barnesiae (W. barnesiae and W. fossacincta), Rhagodiscusasper (R. amplus, R. asper, R. robustus and R. sageri), small Zeugrhabdotus(Z. erectus, Z. noeliae and Z. howei) and Eprolithus floralis (E. apertior,E. floralis and the related Radiolithus planus) groups. Crucibiscutum hayiand Seribiscutum sp. cf. S. gaultensis were also grouped (S. gaultensis gr.)owing to their presumed cool-water affinity. After these groupings,only those taxa having a mean relative abundance higher than 1% wereselected for statistical analysis, and include Assipetra ssp., Biscutumconstans, Cretarhabdus conicus, Discorhabdus ignotus, Helenea chiastia,Lithraphidites carniolensis, Nannoconus spp., R. asper gr., Rotelapilluslaffittei, W. barnesiae gr. and the small Zeugrhabdotus gr. However, therare taxa Cyclagelosphaera margerelii, Diazomatolithus lehmanii, Hayesitesirregularis, Staurolithites siesseri, and the groups Micrantholithus spp.,S. gaultensis gr., E. floralis gr. and Retecapsa spp. were also consideredbecause of their presumed palaeoecological significance (Herrle, 2003;Lees et al., 2005, 2006; Tremolada et al., 2006; Tiraboschi et al., 2009;Herrle et al., 2010; Bottini and Mutterlose, 2012).
Statistical procedures were applied to the data set containingpercentage abundances of the selected taxa. The software Systatv13.1 was used for the calculation of basic statistics (Table 1), corre-lation matrix (Table 2) and for multivariate factor analysis (Table 3).As multivariate factor analysis, the principal components analysis(PCA) R-mode with varimax rotation was chosen. PCA was appliedto the data matrix to determine the relationships between samplesand percentages of selected taxa by reducing a large number of var-iables to a few components (factors). The relationships among indi-vidual taxa within each component are represented by factorloadings. The use of this methodology applied to palaeoclimaticand palaeoceanographic reconstructions yields a clearer signalthan the evaluation of single-species abundances (Herrle et al.,2003; Aguado et al., 2008; Tiraboschi et al., 2009). For the investiga-tion of the relationships between the different taxa, factor loadingsbetween ±0.4 and ±0.5 were assigned to ‘associated taxa’ and fac-tor loadings greater than ±0.5 to ‘dominant taxa’ (Malmgren andHaq, 1982).
3.2. Planktonic foraminifera and radiolaria
Fractions of the same samples investigated for their calcareousnannofossil content were used for foraminiferal and radiolarian analy-sis. In addition, 21 samples from the unit C in section XF1 were proc-essed for radiolarian investigation. Each sample (200 g dry weight)was treatedwith diluted H2O2 to remove the organicmatter, and subse-quently washed through sieves. The residue was separated into threefractions (N200 μm, N100–200 μm and N50–100 μm), dried in anoven at 50 °C, and finally investigated using an Olympus SZX16stereoscopic microscope.
For planktonic foraminifera, the taxonomic classification used isbased on Moullade et al. (2002), and Verga and Premoli Silva (2002,2003a,b, 2005). Radiolarian species identification and age assignmentsare chiefly based on recent taxonomic studies and Mid-CretaceousTethyan biostratigraphic zonation based on Unitary Associations andproposed by the InterRad Working Group radiolarian catalogue (Jud,1994; O'Dogherty, 1994; Baumgartner et al., 1995). Generic nameshave been updated according to the recent systematic revision ofO'Dogherty et al. (2009).
3.3. Oxygen and carbon isotopes and biomarkers
Oxygen and carbon stable isotope data from section XF1 are previ-ously published (Quijano et al., 2012). A set of 25 additional samplesfrom section XF was analysed for δ13Ccarb δ18O and δ13Corg, followingthe same procedures. A total of 30 samples from section XF1 were
202 R. Aguado et al. / Palaeogeography, Palaeoclimatology, Palaeoecology 395 (2014) 198–221
203R. Aguado et al. / Palaeogeography, Palaeoclimatology, Palaeoecology 395 (2014) 198–221
selected for biomarker analysis. Biomarker samples were analysed fol-lowing the methods described in Quijano et al. (2012). Androstanewas added after extraction as internal standard and used to calculatebiomarker concentrations (in ng/g).
4. Results
4.1. Biostratigraphy
Preliminary biostratigraphic data (calcareous nannofossils, plank-tonic foraminifera and radiolaria) from the sections at La Fronterawere published by Aguado et al. (1988, 1992), O'Dogherty andMartínez-Gallego (1990), Aguado (1994), de Gea et al. (2012), andQuijano et al. (2012).
Seven calcareous nannofossil bioevents have been identifiedthroughout the investigated interval (Fig. 2). These have been used toapply the NC zonation (Roth, 1978; Bralower et al., 1995) to the com-bined interval of both (XF and XF1) study sections, allowing the identi-fication of NC5E, NC6A and NC7A nannofossil subzones (Fig. 2). Theinterval equivalent to the NC6B Subzone was not identified, and shouldlie within the radiolaritic claystone interval (unit C, Fig. 2). As the baseof the lithologic unit B (Carbonero Formation) is younger than the‘nannoconid crisis’ event (Erba, 1994; Aguado et al., 1999), a stratigraphicgap, probably comprising part of the uppermost Barremian and the low-ermost Aptian, was deduced to exist at the boundary between theCarretero and Carbonero formations (Fig. 2).
The study of the planktonic foraminifera allowed the detectionof seven bioevents, which were used for the identification of theGlobigerinelloides blowi, Leupoldina cabri and Globigerinelloidesferreolensis zones (Fig. 2). The adopted zonation is based mainlyon Longoria (1974), Moullade (1966) and Caron (1985), slightlymodified on later works (Coccioni and Premoli Silva, 1994; Vergaand Premoli Silva, 2002, 2003a,b; Verga, 2004; Verga and PremoliSilva, 2005; Coccioni et al., 2007). The radiolaritic claystone interval(unit C) did not contain planktonic foraminifera.
Two distinct radiolarian assemblages are recognized within thestudied interval, these are the “Hiscocapsa” asseni and Turbocapsulazones of O'Dogherty (1994). The upper part of the Turbocapsula Zone(T. costata Subzone) is recorded from sample 31.74 m up to the lastsample.
4.2. Chemostratigraphy
4.2.1. Carbon and oxygen isotopesThe δ13Ccarb and δ13Corg profiles show a general parallel evolution,
although due to the lack of carbonates in the unit C only the δ13Corg pro-file is available for the complete studied interval (Fig. 2). Nevertheless,new δ13Ccarb data from section XF has provided a higher continuityin the isotope profile with respect to the previous published data
Fig. 3. Cross-polarized light micrographs of calcareous nannofossils from La Frontera sections. E1–3, Chiastozygus litterarius; 1, sample XF 11.6 m, 5° to crossed nicols; 2, sample XF1 1.0 m, 10°4, sample XF1 10.3 m, 20° to crossednicols; 5, sample XF1 10.9 m, 20° to crossednicols. 6, 7, Staucrossed nicols. 8–10, Staurolithites siesseri; 8, sample XF1 10.3 m, 30° to crossed nicols; 9, sampZeugrhabdotus diplogrammus; 11, sample XF1 1.0 m, 20° to crossed nicols; 12, sample XF 17.6erectus, sample XF1 13.6 m, 40° to crossednicols. 15, 16, Zeugrhabdotus embergeri; 15, very largeXF1 10.3 m, 20° to crossed nicols. 17–19, Zeugrhabdotus howei; 17, sample XF 11.6 m, 40° tocrossed nicols. 20, 24, 29, Zeugrhabdotus scutula; 20, sample XF1 1,0 m, 40° to crossed nicols;21–23, Zeugrhabdotus noeliae; 21, sample XF1 1.0 m, 0° to crossed nicols; 22, sample XF1 10.3xenotus; 25, sample XF1 10.9 m, 40° to crossed nicols; 26, sample XF1 27.9 m, 40° to crossed nnicols. 30, 31,Diloma primitiva; 30, sample XF1 3.4 m, 0° to crossed nicols; 31, sample XF1 14.4 mnicols; 33, sample XF1 28.6 m, 20° to crossed nicols. 34–36, Percivalia fenestrata; 34, sample XF19.4 m, 40° to crossed nicols. 37, 38, Rhagodiscus amplus; 37, sample XF1 2.8 m, 30° to crossed nicXF1 10.3 m, 0° to crossed nicols; 40, sample XF1 3.4 m, 0° to crossed nicols; 41, sample XF 13.6nicols; 43, sample XF1 12.0 m, 30° to crossed nicols; 44, sample XF1 2.2 m, 45° to crossed nicRhagodiscus gallagheri; 45, sample XF1 3.4 m, 0° to crossed nicols; 46, sample XF 16.6 m, 0°R. achlyostaurion; 48, sample XF1 13.6 m, 10° to crossed nicols; 49, sampleXF1 14.4 m, 45° to croXF1 3.4 m, 20° to crossed nicols; 52, sample XF1 2.8 m, 45° to crossed nicols. 54, 55, Rhagodiscnicols. 56, 57, Rhagodiscus sageri; sample XF 17.6 m, 56, 5° to crossed nicols; 57, 10° to crossed
(Quijano et al., 2012). Based mostly on the δ13Corg profile, theC-isotope stratigraphy has been correlated to the reference section ofMenegatti et al. (1998), and the eight segment defined by those authorshas been recognized (see Quijano et al., 2012). New biostratigraphicdata presented here (the boundary between L. cabri and G. ferreolensisplanktonic foraminifera biozones) has led to the extension of the strat-igraphic range of segment C7 up to the unit E (Fig. 2). Themain featuresof the δ13C profiles are the presence of a negative carbon isotope excur-sion (CIE) of ~2‰ in δ13Corg within the NC6A nannofossil, G. blowiplanktonic foraminiferal and uppermost part of the “H.” asseni radiolar-ian biozones (segment C3, Fig. 2), followed by a stepwise positive evo-lution (C4 to C6 segments), defining the OAE 1a.
δ18O values showno clear tendencywithin the upper Barremian (unitA), with general values oscillating between −2.2 to −2.5 (min. −2.8).The lower Aptian records a general decreasing tendency, with a well-defined negative trend at the base of the C7 segment (lower part of unitD), followed by more stable values (−2.3 to −2.9) in the upper part ofthe section (Fig. 2).
4.2.2. BiomarkersThe extractable saturated hydrocarbon fraction in La Frontera sedi-
ments is dominated primarily by n-alkanes, acyclic isoprenoids,hopanes and steranes; it is significant that the steranes are only repre-sented by the 5α,14α,17α-20R isomers (see Quijano et al., 2012). Todetermine the maturity of samples, the n-alkane odd-over-even pre-dominance ratio (OEP = C25 + (6 × C27) + C29 / (4 × C26) + (4 ×C28)), defined by Scalan and Smith (1970) was calculated. These rangefrom 1 to 3. The C31 22S / (22S + 22R) 17a,21b-homohopane and C30βα / (βα + αβ) hopane ratios have been also calculated. These rangefrom 0.15 to 0.35 and 0.3 to 0.45, respectively. All maturity-related ra-tios show some variations through the section. In order to assess chang-es in surfacewater productivity during the late Barremian–early Aptian,the concentrations of steranes (C27–C29) and pristane and phytane(Fig. 2) were determined. Both biomarker groups are most abundantin the lower portion of the XF1 section. Highest concentrations (ng/gTOC but also ng/g sediment) of steranes, pristane, and phytane occurbetween 3 and 10 m, coinciding with C3 to C6 segments of Menegattiet al. (1998) (Fig. 2).
4.3. Calcareous nannofossil abundance, preservation and diversity
The mean absolute abundance of calcareous nannofossils in LaFrontera sections is high, ranging from an average of 3.00 × 10¹⁰ speci-mens/g sediment in the Carretero Formation, to an average of 5.49 ×10¹⁰ specimens/g in the Carbonero Formation, excluding the barrenradiolaritic claystone interval. The higher absolute abundanceswere ob-served throughout the unit B and lowermost part of unit D (CarboneroFormation), coinciding with NC6A and the NC7A nannofossil zones(Fig. 2).
iffellithales: Chiastozygaceae (1–28), Eiffellithaceae (29–32) and Rhagodiscaceae (33–57).to crossed nicols; 3, sample XF1 13.2 m, 20° to crossed nicols. 4,5, Staurolithites mutterlosei;rolithitesmitcheneri; 6, sample XF1 2.2 m, 40° to crossed nicols; 7, sample XF1 14.4 m, 0° tole XF1 12.0 m, 30° to crossed nicols; 10, sample XF1 12.0 m, 10° to crossed nicols. 11–13,m, 30° to crossed nicols; 13, sample XF 14.6 m, 30° to crossed nicols. 14, Zeugrhabdotusmorphotype, sample XF1 1.0 m, 0° to crossednicols; 16, normal sizedmorphotype, samplecrossed nicols; 18, sample XF 13.6 m, 40° to crossed nicols; 19, sample XF 13.1 m, 30° to24, sample XF1 3.1 m, 5° to crossed nicols; 29, sample XF1 3.4 m, 45° to crossed nicols.m, 40° to crossed nicols; 23, sample XF 11.6 m, 0° to crossed nicols. 25–28, Zeugrhabdotusicols; 27, sample XF1 18.55 m, 40° to crossed nicols; 28, sample XF1 2.2 m, 40° to crossed, 5° to crossed nicols. 32, 33, Tegumentum stradneri; 32, sample XF1 14.0 m, 45° to crossed
2.8 m, 40° to crossed nicols; 35, same specimen as 33, 10° to crossed nicols; 36, sample XF1ols; 38, sample XF1 12.0 m, 40° to crossed nicols. 39–41, Rhagodiscus angustus; 39, samplem, 0° to crossed nicols. 42–44, 53, Rhagodiscus asper; 42, sample XF1 10.3 m, 30° to crossedols; 53, form transitional to R. robustus, sample XF1 13.4 m, 15° to crossed nicols. 45–47,to crossed nicols; 47, sample XF 11.6 m, 20° to crossed nicols. 48–50, Rhagodiscus sp. cf.ssed nicols; 50, sample XF1 12.4 m, 45° to crossednicols. 51, 52,Mitosia infinita; 51, sampleus robustus; 54, sample XF 17.6, 0° to crossed nicols; 55, sample XF1 12.0 m, 0° to crossednicols.
204 R. Aguado et al. / Palaeogeography, Palaeoclimatology, Palaeoecology 395 (2014) 198–221

205R. Aguado et al. / Palaeogeography, Palaeoclimatology, Palaeoecology 395 (2014) 198–221
One of themost common problems in the study of nannofossils is todetermine what extent the assemblages reflect a real ecological signalor the result of a diagenetic overprint. The genusWatznaueria (especial-lyW. barnesiae) is considered to be a good indicator of alteration in theCretaceous assemblages (Roth and Bowdler, 1981; Thierstein, 1981;Roth and Krumbach, 1986; Thierstein and Roth, 1991). Cretaceousnannofossil assemblages containing more than 40% (Roth andKrumbach, 1986) or 70% (Williams and Bralower, 1995) ofWatznaueriaare considered as heavily altered. In addition, such heavily altered as-semblages are also distinguished because dissolution/overgrowth hasselectively eliminated small, fragile and delicate taxa. Although calcare-ous nannofossil assemblages of La Frontera sections contain moderateto high (average 40.99%, minimum 22.11%, maximum 66.37%) percent-ages of W. barnesiae gr., dissolution-susceptible taxa such as Biscutum,Crucibiscutum, Seribiscutum, Discorhabdus and small Zeugrhabdotus gr.(Thierstein, 1980), are relatively abundant (Table 1). This suggests thatthe fluctuations in the abundance of W. barnesiae gr., together withthose observed in other taxamainly record original palaeoenvironmentalsignals.
In addition, high proportions of Watznaueria should characterizepoorly preserved calcareous nannofossil assemblages, with reducedcoccolith abundances. However, the correlation coefficients of thepercentage abundances of W. barnesiae gr. with respect to both simplediversity (r2 = 0.01; n = 88) and total nannofossil abundances (r2 =0.02; n = 88) are very low for the studied interval (Fig. 6). This lackof correlation, along with the overall good preservation (Fig. 2), indi-cates that the calcareous nannofossil assemblages have not been signif-icantly altered by diagenetic processes. In addition, the low fluctuationof diversity indices such as species richness, heterogeneity (ShannonIndex), and evenness reflects the low variation in the degree of preser-vation of calcareous nannofossils (Fig. 2).
4.4. Calcareous nannofossil assemblages
A total of 75 nannofossil species were identified in the XF and XF1sections (see Appendix A). The descriptive statistics of selectednannofossil taxa are synthesized in Table 1. Only two taxa,Watznaueriabarnesiae gr. and small Zeugrhabdotus gr. exceed a mean frequency of10%. W. barnesiae gr. is the dominant taxon, comprising 22.11% and66.37% (mean 40.99%) of the total assemblage. The small Zeugrhabdotusshow abundances comprised between 1.34% and 27.29% (mean13.36%). Three taxa (R. asper, D. ignotus and L. carniolensis) showfrequencies between 5% and 10%. A group of six taxa includingB. constans, Assipetra ssp., Nannoconus spp., H. chiastia, C. conicus andR. laffittei has frequencies between 1% and 5%. The taxaMicrantholithusspp. (0.95%), S. gaultensis gr. (0.94%) and S. siesseri (0.93%) have averageabundances very close to 1%, while H. irregularis (0.78%), C. margerelii(0.68%), Retecapsa spp. (0.35%), E. floralis gr. (0.60%) and D. lehmanii(0.25%) show very low abundances throughout the study interval. Theselected nannofossil taxa account for 94.14% in average with respectto the total assemblage in the data set.
Fig. 4. Cross-polarized light micrographs of calcareous nannofossils from La Frontera sections.and Tubodiscaceae (29–32); Stephanolithiales: Stephanolithiaceae (33–38); Watznaueriales:crossed nicols; 2, sample XF1 3.4 m, 0° to crossed nicols. 3, 4, Hemipodorhabdus gorkae; 3, saBiscutum constans; 5, sample XF 12.6 m, 40° to crossed nicols; 6, sample XF1 11.2 m, 15° to cross14, sample XF1 12.0 m, 35° to crossed nicols. 8–10, Crucibiscutum hayi; 8, sample XF 1.5 m, 30°crossed nicols. 11–13,Discorhabdus ignotus; 11, sample XF1 2.2 m; 12, 1, sample XF1 12.0 m. 1515, 20° to crossed nicols; 17, sample XF1 28.6 m, 40° to crossed nicols; 18, same specimen as 17,20, same specimenas 19, 40° to crossed nicols. 21, 28,Helenea chiastia; 21, sampleXF1 12.0 m, 022, sampleXF1 11.2 m, 40° to crossed nicols; 23, sampleXF1 12.0 m, 40° to crossed nicols. 24, 25to crossed nicols. 26, 27, Retecapsa angustiforata; sample XF 13.1 m; 26, 45° to crossed nicols; 23.4 m; 29, 10° to crossed nicols; 30, 0° to crossed nicols. 31, 32, Tubodiscus burnettiae; 31, sampRotelapillus laffittei; 33, sample XF1 13.6 m; 34, sample XF 13.6 m. 35, 36, Stoverius achylosus;crossed nicols. 37, 38, Stoverius acutus; 37, sample XF1 3.1 m, 45° to crossed nicols; 38, samp2.2 m; 40, sample XF 14.6 m. 41, Cyclagelosphaera rotaclypeata, sample XF1 28.6 m. 42, 43, Diabarnesiae; 44, sampleXF1 10.3 m, 20° to crossednicols; 45, sampleXF13.6 m, 0° to crossed nicol28.6 m, 0° to crossed nicols. 48, 49, Watznaueria britannica; 48, sample XF1 3.4 m, 20° to crosssample XF1 10.3 m, 30° to crossed nicols; 51, sample XF1 10.3 m; 0° to crossed nicols. 52, Wat
Fluctuations in the absolute abundance of W. barnesiae gr. and vari-ations of the absolute nannofossil abundance are positively correlated.In most cases, increases in the percentage abundance of W. barnesiaegr. coincide with a decrease in the absolute abundance of the othertaxa, although no significant increases of its absolute abundance are ob-served (e.g. XF1 section, interval 18–22 m, Fig. 7).
High abundances of small Zeugrhabdotus gr., B. constans andD. ignotus characterize most of the Carbonero Formation, especiallyaround the OAE 1a interval, and are less abundant in the underlyingCarretero Formation (Fig. 7). L. carniolensis shows some abundancepeaks synchronized with small Zeugrhabdotus gr., B. constans andD. ignotus (Fig. 7). Peaks in the abundance of Seribiscutum sp. cf.S. gaultensis (the dominant species within the S. gaultensis gr.) were re-corded at sample XF1 12.0 m and in the interval between 27.2 m andthe top of the XF1 section. These peaks appear to be synchronizedwith those of small Zeugrhabdotus gr. (Fig. 7). C. hayi is very rare al-though present throughout the interval studied.
Abundance percentages of R. asper are high throughout theCarretero and lower part of the Carbonero Formation, and decrease inthe upper part of the Carbonero Formation. An inverse behaviour canbe observed for the percentage abundances of S. siesseri and R. asper(Fig. 8). H. irregularis is especially abundant throughout the uppermostpart of the Carbonero Formation, above the OAE 1a interval, showingsome abundance peaks that synchronize with S. siesseri and E. floralisgr. (Fig. 8). D. lehmanii and C. margerelii are both rare, especiallythroughout the upper part of the Carbonero Formation (NC7A Zone).They display peaks in their percentage abundances within the lower-most part of the Carbonero Formation (unit B, NC6A Zone), after theonset of the ‘nannoconid crisis’ event and preceding the OAE 1a interval(Fig. 8).
Nannoconus spp. is abundant throughout the Carretero Forma-tion (average 14.27%) and very rare in the overlying Carbonero For-mation (average 0.85%) (Fig. 7). The low abundances of Nannoconusspp. in the Carbonero Formation indicate that its base was depositedafter the onset of the ‘nannoconid crisis’ event (Erba, 1994; Aguadoet al., 1999; Herrle and Mutterlose, 2003). Micrantholithus spp. is com-mon (average 6%) throughout the Carretero Formation and very rare(0.37%) throughout NC6A and NC7A nannofossil zones in the CarboneroFormation (Fig. 7). In the Carretero Formation, its relative (and absolute)abundance peaks are synchronized with those of Nannoconus ssp. andopposed to those of small Zeugrhabdotus gr., B. constans and D. ignotus(Fig. 7). Assipetra spp. shows a conspicuous increase in abundance inthe lower Aptian, especially throughout the interval (10–26 m in theXF1 section) following the OAE 1a within the Carbonero Formation(Fig. 7).
H. chiastia is more abundant throughout the Carbonero Formationand shows some relative abundance peaks that are opposed to highabundances of R. asper gr. while synchronizing with some abundancepeaks of H. irregularis and S. siesseri (Fig. 8). Also, H. chiastia correlateswith high abundances of W. barnesiae gr. and shows relative and abso-lute abundance peaks that are opposed to small Zeugrhabdotus gr.,
Podorhabdales: Axopodorhabdaceae (1–4), Biscutaceae (5–14), Cretarhabdaceae (15–28)Watznaueriaceae (39–52). 1, 2, Axopodorhabdus dietzmannii; 1, sample XF1 2.2 m, 5° tomple XF1 10.3 m; 40° to crossed nicols; 4, sample XF1 3.4 m, 30° to crossed nicols; 5, 6,ed nicols. 7, 14, Seribiscutum sp. cf. S. gaultensis; 7, sample XF1 3.4 m, 40° to crossed nicols;to crossed nicols; 9, sample XF 1.5 m, 20° to crossed nicols; 10, sample XF 11.6 m, 20° to–18, Flabellites oblongus; 15, sample XF1 2.2 m, 40° to crossed nicols; 16, same specimen as0° to crossed nicols. 19, 20, Retecapsa crenulata; sample XF1 3.4 m; 19, 0° to crossed nicols;° to crossednicols; 28, sampleXF1 13.6 m, 0° to crossednicols. 22, 23, Cretarhabdus conicus;, Cretarhabdus striatus; 24, sample XF1 3.4 m, 0° to crossed nicols; 25, sample XF 15.1 m, 0°7, same specimen as 26, 0° to crossed nicols. 29, 30,Manivitella pemmatoidea; sample XF1le XF1 12.0 m, 30° to crossed nicols; 32, sample XF1 28.6 m, 40° to crossed nicols. 33, 34,35, sample XF1 29.2 m, 0° to crossed nicols; 36, oblique view, sample XF1 25.2 m, 0° tole XF1 12.0 m, 40° to crossed nicols. 39, 40, Cyclagelosphaera margerelii; 39, sample XF1zomatolithus lehmanii; 42, sample XF1 28.6 m; 43, sample XF 16.6 m. 44, 45, Watznauerias; 46, 47,Watznaueria biporta; 46, sample XF1 13.6 m, 30° to crossed nicols; 47, sample XF1ed nicols; 49, sample XF 17.1 m, 20° to crossed nicols. 50, 51, Watznaueria fossacincta; 50,znaueria ovata, sample XF1 12.0 m, 0° to crossed nicols.

206 R. Aguado et al. / Palaeogeography, Palaeoclimatology, Palaeoecology 395 (2014) 198–221

Table 1Descriptive statistics of selected nannofossil taxa investigated in 88 samples. Only the interval corresponding to total range of each taxawas considered in the calculations forH. irregularis(79 samples) and E. floralis gr. (48 samples).
Taxa Mean Median Minimun Maximun SD Sd. error Skewness Kurtosis
W. barnesiae gr. 40.99 41.19 22.11 66.37 8.22 0.88 0.43 0.53Small Zeugrhabdotus gr. 13.36 13.75 1.34 27.29 5.82 0.62 0.12 −0.15R. asper gr. 8.56 8.48 3.03 13.96 2.39 0.26 0.05 −0.58D. ignotus 7.30 6.67 0.23 16.23 3.41 0.36 0.28 −0.05L. carniolensis 5.76 5.49 2.43 10.74 1.93 0.21 0.66 0.06B. ellipticum 3.29 3.00 0.00 10.71 2.06 0.22 0.91 1.11Assipetra ssp. 2.34 2.01 0.23 8.08 1.52 0.16 1.31 2.34Nannoconus ssp. 2.22 0.48 0.00 28.30 5.14 0.55 3.55 13.05H. chiastia 2.13 2.00 0.28 8.30 1.13 0.12 2.13 9.58C. conicus 1.56 1.45 0.21 6.17 0.86 0.09 1.98 8.61R. laffittei 1.16 0.88 0.16 5.99 0.85 0.09 2.49 10.68Micrantholithus ssp. 0.95 0.30 0.00 15.09 2.43 0.26 4.84 24.76S. gaultensis gr. 0.94 0.67 0.00 4.21 0.82 0.09 1.48 2.51S. siesseri 0.93 0.86 0.16 2.64 0.56 0.06 0.66 −0.10H. irregularis 0.78 0.57 0.00 3.21 0.66 0.07 1.35 1.78C. margerelii 0.68 0.00 0.00 6.34 1.02 0.11 2.51 10.08E. floralis gr. 0.60 0.47 0.15 1.91 0.44 0.06 1.57 2.30Retecapsa ssp. 0.35 0.33 0.00 1.15 0.22 0.02 0.88 1.21D. lehmanii 0.25 0.18 0.00 1.67 0.32 0.03 2.10 5.22
SD, standard deviation; Sd. Error, standard error.
207R. Aguado et al. / Palaeogeography, Palaeoclimatology, Palaeoecology 395 (2014) 198–221
B. constans and D. ignotus (Figs. 7, 8). R. laffittei also shows higher abso-lute and relative abundances throughout the Carbonero Formation thanthroughout the Carretero Formation. Abundance peaks of this taxon arecommon within the interval postdating the OAE 1a, and some of themare synchronized with those of the S. siesseri and E. floralis gr. Thesepeaks are also opposed to those displayed by R. asper gr. (Fig. 8).
No consistent variations in the abundance of Retecapsa ssp. andC. conicus were found, although globally they show some absolute andrelative abundance peaks throughout the unit B, within the intervaljust preceding the OAE 1a (Fig. 8).
4.5. Latest Barremian–early Aptian trends in fertility and temperature
Pearson's correlation matrix, displaying highly significant pairingsfor the most abundant taxa described in the previous section, is givenin Table 2. Positive high values in a pairing indicate similar affinitiesfor the paired taxa, whereas high negative pairings suggest opposing re-lationships.W. barnesiae gr. shows high negative correlationswith smallZeugrhabdotus gr., B. constans, D. ignotus and S. gaultensis gr., whichthemselves are positively paired. R. asper gr. is positively paired withC. margerelii and D. lehmanii, and these show negative correlationswith H. irregularis, E. floralis gr., S. siesseri and small Zeugrhabdotus gr.,which, in turn are themselves positively paired. A very high positive cor-relation is also showed between Nannoconus spp. and Micrantholithusspp., which also show negative pairings withmost of the other taxa, es-pecially with small Zeugrhabdotus gr.,D. ignotus and B. constans, but alsowith H. irregularis, E. floralis gr., S. gaultensis gr. and S. siesseri.
Multivariate factor analysis (PCA, R-mode with varimax rotation)was applied to percentage abundances of the selected taxa. Three signif-icant factors (components) were extracted, representing 50.95% of thetotal variance. The relationships among individual taxa within each
Fig. 5. Cross-polarized light micrographs of calcareous nannofossils from La Frontera seBraarudosphaeraceae (5–10), Eoconusphaeraceae (11–13), Microrhabdulaceae (14–16), Nannople XF 11.6 m; 2, sample XF1 9.4 m. 3, 4, Owenia partita, sample XF 17.1 m, 0° to crossedMicrantholithus obtusus; 7, sample XF1 10.3 m; 8, sample XF 17.6 m. 9, 10, Micrantholithus steXF1 3.4 m, 0° to crossed nicols; 12, same specimen as 11, 30° to crossed nicols; 13, sample XFto crossed nicols; 15, same specimen as 14, 45° to crossed nicols; 16, sample XF1 10.9 m, 45°18, sample XF1 12.2 m. 19, 20, Assipetra infracretacea ssp. larssonii; 19, sample XF1 1.0 m; 2011.8 m; 22, sample XF1 12.0 m; 31, very large specimen, sample XF1 11.2 m; 32, very large specXF1 10.3 m; 24, sample XF1 2.8 m. 25–29, Polycostella? prossii; 25, sample XF1 13.6 m, 0° to crosnicols; 28, same specimen as 27, 45° to crossed nicols; 29, sample XF1 12.8 m, 0° to crossed nico37, sample XF1 26.6 m. 32,Nannoconus steinmannii, sample XF 13.1 m, 40° to crossed nicols. 33,sample XF1 10.0 m; 35, sample XF1 12.0 m. 39–41, 44, 45 Hayesites irregularis; 39, sample XF1Radiolithus planus; 42, sample XF1 12.2 m; 43, sample XF1 12.0 m. 46, 47, Palaeomicula maltica
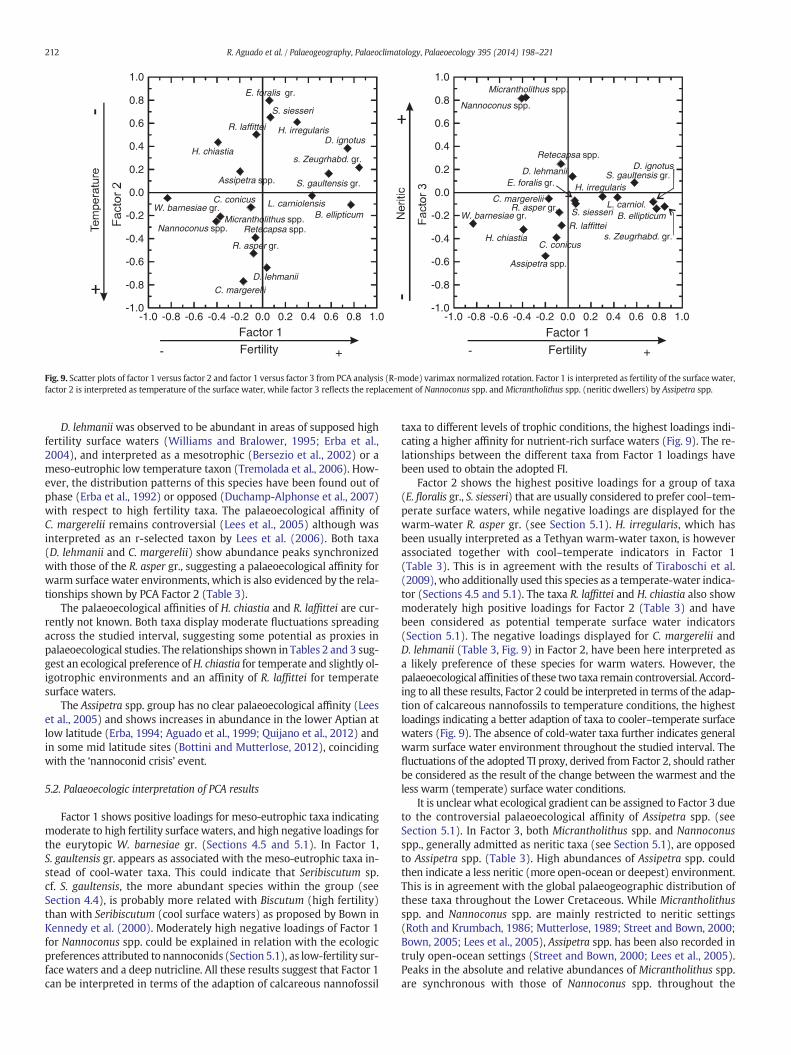
component are represented by factor loadings and are given inTable 3. Factor 1 represents 19.63% of the total variance and shows thehighest positive loadings for small Zeugrhabdotus gr., B. constans,D. ignotus, S. gaultensis gr. (dominant taxa), and L. carniolensis (associat-ed taxon) and the highest negative loadings forW. barnesiae gr. (domi-nant taxon) and Nannoconus spp. (associated taxon) (Table 3, Fig. 9).Factor 2, representing 19.56% of the total variance in the dataset,shows the highest positive loadings for E. floralis gr., S. siesseri,H. irregularis, R. laffittei (dominant taxa) and H. chiastia (associatedtaxon). Negative loadings, as dominant taxa, are displayed forC. margerelii, D. lehmanii and R. asper gr. (Table 3, Fig. 9). Factor 3 repre-sents a lower proportion (11.77%) of the total variance and has highlypositive loadings with Micrantholithus spp. and Nannoconus spp. andnegative loadings with Assipetra spp. as dominant taxa (Table 3, Fig. 9).
Palaeoecological indices of fertility and temperature based on calcar-eous nannofossil relative abundances have been calculated. The fertilityindex (FI) of Tremolada et al. (2006) and the modified temperatureindex (MTI) of Tiraboschi et al. (2009) were adopted because they arethe best suited according to the composition of the analysed calcareousnannofossil assemblages. These indexes have been partly modified ac-cording to the results obtained from the application of PCA statisticalprocedure to our dataset. According with the positive and negativeloadings given in this study by Factor 1 to the different taxa (Table 3)FI was modified by adding S. gaultensis gr. and replacing D. lehmanii byL. carniolensis. FI was then calculated as follows:
FI ¼ ½ðsmall Zeugrhabdotus gr:þ B: constansþ D:ignotus
þS:gaultensis gr:þ L:carniolensisÞ=ðsmall Zeugrhabdotus gr:þB:constansþ D:ignotusþ L:carniolensisþW:barnesiae gr:þNannoconus spp:Þ� � 100:
ctions. Heterococcoliths incertae sedis (1, 2), Holococcoliths (3, 4) and Nannoliths:conaceae (32, 33), Polycyclolithaceae (17–31, 34–47). 1, 2,Haqius circumradiatus; 1, sam-nicols. 5, 6, Micrantholithus hoschulzii; 5, sample XF1 3.1 m; 6, sample XF 2.0 m. 7, 8,llatus; 9, sample XF1 0.1 m; 10, sample XF 14.6 m. 11–13, Conusphaera rothii; 11, sample1 2.8 m, 0° to crossed nicols. 14–16, Lithraphidites carniolensis; 14, sample XF1 2.2 m, 0°to crossed nicols. 17, 18, Assipetra infracretacea ssp. infracretacea; 17, sample XF1 10.3 m;, sample XF 13.1 m. 21, 22, 31, 38, Assipetra terebrodentaria ssp. youngii; 21, sample XF1imen, sample XF1 13.6 m. 23, 24, Assipetra terebrodentaria ssp. terebrodentaria; 23, samplesed nicols; 26, sample XF1 13.4 m, 0° to crossed nicols; 27, sample XF1 2.8 m, 0° to crossedls. 30, 36, 37, Eprolithus floralis; 30, sample XF1 26.6 m, side view; 36, sample XF1 16.55 m;Nannoconus bucheri, sample XF 13.1 m, 45° to crossed nicols. 34, 35, Eprolithus apertior; 34,11.6 m; 40, sample XF1 9.4 m; 41, 44 sample XF1 2.2 m; 45, sample XF1 13.2 m. 42, 43,; 46, sample XF1 3.4 m, 0° to crossed nicols; 47, sample XF 19.2 m, 0° to crossed nicols.

Table 2Pearson's correlation matrix of selected taxa in 88 samples.
Ass
ipet
ra s
sp.
B. e
llipt
icum
C. c
onic
us
C. m
arge
relii
D. i
gnot
us
D. l
ehm
anii
E. fl
oral
is g
r.
H. i
rreg
ular
is
H. c
hias
tia
L. c
arni
olen
sis
Mic
rant
h. s
pp.
Nan
noc.
spp
.
R. a
spe
r gr
.
Rete
caps
a sp
p.
R. la
ffitt
ei
S. g
ault
ensi
s gr
.
S. s
iess
eri
s. Z
eugr
habd
. gr.
Assipetra ssp. 1.00
B. ellipticum 0.07 1.00
C. conicus 0.04 -0.06 1.00
C. margerelii -0.17 -0.07 0.08 1.00
D. ignotus -0.06 0.50 -0.17 -0.39 1.00
D. lehmanii -0.31 0.05 0.09 0.48 -0.14 1.00
E. floralis gr. 0.17 -0.03 -0.05 -0.50 0.38 -0.42 1.00
H. irregularis -0.11 0.10 0.06 -0.39 0.47 -0.27 0.44 1.00
H. chiastia 0.18 -0.29 0.01 -0.28 -0.06 -0.26 0.21 0.16 1.00
L. carniolensis -0.03 0.27 0.05 -0.09 0.16 -0.14 0.07 0.00 -0.20 1.00
Micranth. spp. -0.26 -0.31 -0.19 0.18 -0.46 0.22 -0.24 -0.30 -0.22 -0.13 1.00
Nannoc. spp. -0.28 -0.35 -0.18 0.18 -0.47 0.25 -0.27 -0.36 -0.23 -0.11 0.92 1.00
R. asper gr. -0.01 -0.19 -0.07 0.36 -0.21 0.29 -0.32 -0.40 -0.06 0.15 0.02 0.06 1.00
Retecapsa spp. -0.17 -0.05 0.04 0.24 -0.24 0.14 -0.39 -0.25 -0.22 -0.10 0.20 0.27 0.01 1.00
R. laffittei 0.44 -0.03 0.00 -0.34 0.19 -0.34 0.44 0.24 0.19 0.11 -0.20 -0.24 -0.10 -0.27 1.00
S. gaultensis gr. -0.22 0.21 -0.20 -0.29 0.52 -0.12 0.08 0.17 -0.04 0.16 -0.24 -0.28 -0.04 -0.07 0.00 1.00
S. siesseri 0.02 -0.07 0.04 -0.44 0.21 -0.34 0.57 0.35 0.27 0.07 -0.29 -0.31 -0.26 -0.18 0.15 0.08 1.00
s. Zeugrhabd. gr. 0.62 -0.04 -0.31 0.60 -0.14 0.18 0.39 -0.19 0.21 -0.46 -0.53 -0.25 -0.09 0.02 0.44 0.29 1.00
W. barnesiae gr. 0.12 -0.62 0.12 0.21 -0.58 -0.03 -0.10 -0.22 0.34 -0.46 -0.02 0.02 -0.04 0.07 -0.06 -0.41 -0.06 -0.70
Significant at the level of 99% 0.63
Significant at the level of 95% -0.37
Significant at the level of 90% 0.44
-0.06
208 R. Aguado et al. / Palaeogeography, Palaeoclimatology, Palaeoecology 395 (2014) 198–221
Z. embergeri, Z. diplogrammus and M. pemmatoidea were excludedfrom the applied temperature index (TI) as they are very rare in LaFrontera sections. Following the relationships between different taxa
Table 3Results of the PCAwith varimax normalized rotation and extraction of three factors. Asso-ciated and dominant taxa, showing high positive or negative loadings, are in bold.
PCA varimax Factor 1 Factor 2 Factor 3
Assipetra ssp. −0.20 0.18 −0.55B. ellipticum 0.77 −0.11 −0.14C. conicus −0.10 −0.13 −0.39C. margerelii −0.17 −0.77 −0.05D. ignotus 0.74 0.38 −0.08D. lehmanii 0.04 −0.65 0.14E. floralis gr. 0.06 0.80 −0.07H. irregularis 0.30 0.61 −0.04H. chiastia −0.39 0.44 −0.32L. carniolensis 0.43 −0.03 −0.04Micrantholithus spp. −0.37 −0.21 0.82Nannoconus spp. −0.41 −0.25 0.82R. asper gr. −0.08 −0.53 −0.17Retecapsa spp. −0.06 −0.39 0.25R. laffittei −0.06 0.50 −0.29S. gaultensis gr. 0.58 0.16 0.09S. siesseri 0.07 0.65 −0.10Small Zeugrhabdotus gr. 0.85 0.22 −0.12W. barnesiae gr. −0.83 −0.05 −0.27Variance (%) 19.63 19.56 11.77
derived from Factor 2 (Table 3), R. laffittei, H. chiastia, C. margerelii, andD. lehmaniiwere added for the calculation of our TI as follows:
TI ¼ ½ðE: floralis gr:þ S: siesseriþ H: irregularisþ R: laffittei
þH: chiastiaÞ=ðE: floralis gr:þ S: siesseriþ H: irregularis
þR: laffitteiþ H: chiastiaþ R: asper gr:þ C: margerelii
þD: lehmaniiÞ� � 100:
Stratigraphic variations of δ13Ccarb, δ13Corg and δ18Obulk values arecompared with fertility and temperature nannofossil-derived indicesin Fig. 10. The fertility and temperature indices (FI, TI) adopted in thisstudy, together with the nutrient and temperature indices (NI, TI) ofHerrle et al. (2003) and the modified indices (MNI, MTI) of Tiraboschiet al., 2009 are also shown. The adopted fertility index gives resultsthat are nearly identical to the NI and MNI. The curve representing thevalues of the adopted temperature index is very similar to the MTI pro-file, and shows only minor differences with respect to the TI curve.
Fertility, as measured by FI, NI or MNI, is lower throughout theCarretero Formation than throughout the Carbonero Formation(Fig. 10). Higher values of the fertility indices characterize a wide seg-ment encompassing the CIE and OAE 1a intervals. A conspicuous dropin fertility is observed in section XF1 coinciding with the upper part ofthe unit D (17.9–225.5 m). After this drop, high fertility valuesinterrupted by two short intervals (24.2–24.9 m and 29.2–30.1 m)characterize the unit E (Fig. 10). Temperature nannofossil-derivedindices suggest moderate variations throughout the studied interval.The uppermost Barremian and lowermost Aptian, including the CIEand the lower part of the OAE 1a interval, is warmwhile the uppermost

20
30
40
50
60
70
30 40 50 60 0 3 6 9 12
20
30
40
50
60
70
Simple diversity Total abundance (ind./g. sed. x 1010)
r 2
n = 88r 2= 0.01 = 0.02n = 88
Fig. 6. Scatter plots showing relationships betweenW. barnesiae gr. percentages, total coccolith abundance (nannofossils/gram sediment), and simple diversity in La Frontera sections.
209R. Aguado et al. / Palaeogeography, Palaeoclimatology, Palaeoecology 395 (2014) 198–221
lower Aptian (units D and E) is characterized by temperate–cooler tem-peratures (Fig. 10). Although there are some differences depending ofthe chosen temperature index, a sharp cooling episode is recordedthroughout the upper part of the unit D and the base of the unit E.Also remarkable are the fluctuations observed in the different tempera-ture indices throughout the uppermost lower Aptian (lower part of unitD, Fig. 10) in section XF1.
5. Discussion
5.1. Calcareous nannofossil palaeoecology
The distribution and fluctuations of calcareous nannofossil assem-blages are controlled by palaeoenvironmental factors, such as nutrientavailability, temperature and salinity of surface waters (e.g., Brand,1994;Winter et al., 1994; Ziveri et al., 2004). A few palaeoenvironmentalindices have been identified in mid-Cretaceous calcareous nannofossilassemblages and are used to outline palaeoceanographic conditions (e.g.Mutterlose et al., 2005; Tiraboschi et al., 2009). Most of these indices arecoincident with the taxa selected for statistical analysis, and are brieflydiscussed below.
Due to its inverse correlation tomeso-eutrophic taxa,W. barnesiae isusually associated with warm and oligotrophic surface waters linked tolow-productivity settings, (e.g. Roth and Krumbach, 1986; Herrle, 2003;Tremolada et al., 2006; Tiraboschi et al., 2009; Bottini and Mutterlose,2012). Lees et al. (2005) have questioned the use of W. barnesiae as anoligotrophic taxon arguing that the commonly-observed negative cor-relation of W. barnesiae with relative abundances of meso-eutrophictaxa may, in some instances, simply reflect a closed sum effect. Wethink that this is the case for the results obtained from La Frontera sec-tions (see Section 4.4). W. barnesiae is then regarded as a robust eury-topic taxon, able to adapt to fluctuating environmental conditionsmore efficiently than other species (Mutterlose, 1991; Street andBown, 2000; Browning and Watkins, 2008). Watznaueria percentageabundance may be used as a measure of the success of other speciesrather than as a direct response to an environmental signal.
The small taxa Zeugrhabdotus gr., B. constans and D. ignotus areinterpreted as moderate to high fertility indicators, being more abun-dant in meso-eutrophic surface waters (e.g. Roth and Bowdler, 1981;Herrle et al., 2003; Tremolada et al., 2006; Browning and Watkins,2008; Tiraboschi et al., 2009; Herrle et al., 2010; Pauly et al., 2012). As-semblages rich in small Zeugrhabdotus gr. and B. constans are typical forcontinental margins with intense upwelling of cold water rich in nutri-ents (Roth and Bowdler, 1981) or shallow epicontinental seaswith highcontinental nutrient runoff and/or storm mixing (Street and Bown,2000; Herrle, 2003; Kessels et al., 2003).
R. asper has been usually interpreted as a warm-water specieswhereas E. floralis gr., and S. siesseri (=S. stradneri of some authors)
are considered to prefer cool surface waters (Roth and Krumbach,1986; Mutterlose, 1987, 1989; Tiraboschi et al., 2009; Bottini andMutterlose, 2012). Seribiscutum and Crucibiscutum are usually alsointerpreted as cool surface water taxa (Mutterlose and Kessels, 2000;Street and Bown, 2000; Bown, 2005; Pauly et al., 2012). Moderate tohigh abundances of L. carniolensis have been proposed to be character-istic of oceanic assemblages (Thierstein, 1976; Roth and Krumbach,1986; Bown, 2005), or to be indicative of moderate fertility and warmwaters (Premoli Silva et al., 1989).
Nannoconids were abundant mainly in the marginal basins of thecircum-western Tethys (Thierstein, 1976), including the proto-Atlanticand Caribbean areas, and theywere nearly absent frommost of the oce-anic (Roth, 1973; Bown, 1992; Mutterlose, 1992; Street and Bown,2000; Bown, 2005) and cool (Mutterlose and Wise, 1990; Pauly et al.,2012) water environments. They flourished in warm low-latitude,shelfal, detrital-free, possibly stratified waters with arid hinterlands,and are usually found in association with braarudosphaerids (Rothand Krumbach, 1986; Mutterlose, 1989; Street and Bown, 2000). Allthese ecological features are pointing to oligotrophic surfacewater envi-ronments in which salinity and water column transparency may alsohave been significant controls (Herrle, 2003; Bown, 2005; Lees et al.,2005; Mutterlose and Bottini, 2013). Erba (1994) suggested thatnannoconids were adapted to thrive in the dimly light of the deep pho-tic zone, but under nutrient rich conditions. If this is true, the variationsin nannoconid abundance should be related to the nutricline depth: adecrease in Nannoconus spp. indicates a shallow nutricline due to highsurface water fertility, and vice versa (Erba, 1994, 2004; Tremoladaet al., 2006; Browning and Watkins, 2008). The fact that water columntransparency may well have been important for the nannoconids tothrive, lends support to the deep photic-zone ecology. Nannoconidsare here interpreted as neritic, deep photic zone dwellers proliferatingin clear and oligotrophic surface waters.
Micrantholithus spp. are interpreted to be marginal or neritic taxa,similar to nannoconids but over a broader latitudinal range (Roth,1994; Street and Bown, 2000; Bown, 2005). As nannoconids, they arealso scarce or absent in oceanic settings with the exception of someshallow-water oceanic platforms and guyots (Bown, 2005). Based onits similarities with the extant Braarudosphaera bigelowii, probably theecology of Micrantholithus spp. is related to neritic factors such as re-duced salinity and/or enhanced nutrient content (Roth and Bowdler,1981; Street and Bown, 2000; Bown, 2005; Quijano et al., 2012).
H. irregularis has been sometimes considered as a warm-watertaxon (Thierstein, 1976; Bown, 2005) because of their predominant-ly low-latitude biogeographic distribution. However, Tiraboschi et al.(2009) used this species as a temperate-water indicator in the calcu-lation of a modified temperature index. The relationships shown inTables 2 and 3 suggest an ecological preference of this species fortemperate waters.

B. ellipticum0 5 10
40 80
llam gr.s Zeugrh.0 10 20
100 200
D. ignotus0 5 10 15
80 160
L. carniolensis0 4 8
50 100
W. barnesiae gr.0 20 40 60
200 400
Nannoconus spp.0 10 20
80 160
Micranthol. spp.0 5 10 15
80 160
Assipetra spp.0 4 8
80 160
S. gaultensis gr.0 2 4
15 30
0 5 10
40 80
0 10 20
100 200
0 5 10 15
80 160
0 4 8
50 100
0 20 40 60
200 400
0 10 20
80 160
0 5 10 15
80 160
0 4 8
80 160
0 2 4
15 30
0
2
4
6
8
10
12
14
16
18
20
22
24
26
28
30
32
34
36
38
-1 0 1 2 3 4
-28 -26 -24 -22 -20 -18
0
2
4
6
8
10
12
14
16
18
20
-1 0 1 2 3 4
-28 -26 -24 -22 -20 -18
δ13Ccarb
δ13Ccorg B. ellipticum gr.small Zeugrh. D. ignotus L. carniolensis W. barnesiae gr. Nannoconus spp. Micranthol. spp. Assipetra spp.S. gaultensis gr.
XF section
XF1 section
Relative abundance (%)
Absolute abundance(nannofossils/g. sediment x 10 )
8
C
D
E
B
A
A
B
CUn-zoned
Fig. 7. Fluctuations of selected calcareous nannoplankton taxa throughout the XF and XF1 sections. Absolute abundances (as individuals/gram of sediment × 108) are represented in the top X-axes, while relative percentage abundances are repre-sented in the bottom X-axes. Lithology and biostratigraphy are as in Fig. 2.
210R.A
guadoetal./Palaeogeography,Palaeoclim
atology,Palaeoecology395
(2014)198
–221

E. floralis gr.0 1 2
10 20 30
0
2
4
6
8
10
12
14
16
18
20
22
24
26
28
30
32
34
36
38
-1 0 1 2 3 4
-28 -26 -24 -22 -20 -18δ13Ccorg
0 1 2 3
10 20 30
0 2 4 6
20 40
0 1 2 3
10 20 30
0 4 8 12
50 100
8.04.00
6 12
0 2 4 6
40 80
2.16.00
5 10 15
0 3 6 9
20 40 60
S. siesseri0 1 2 3
10 20 30
S. siesseri
R. laffittei0 2 4 6
20 40
R. laffittei
H. irregularis0 1 2 3
10 20 30
H. irregularis
R. asper0 4 8 12
50 100
R. asper
Retecapsa spp.0 0.4 0.8
6 12
Retecapsa spp.
C. margerelii0 2 4 6
40 80
C. margerelii
D. lehmanii2.16.00
5 10 15
D. lehmanii
H. chiastia0 3 6 9
20 40 60
δ13Ccarb
0
2
4
6
8
10
12
14
16
18
20
-1 0 1 2 3 4
-28 -26 -24 -22 -20 -18
E. floralis gr.H. chiastia
XF section
XF1 section
Relative abundance (%)
Absolute abundance(nannofossils/g. sediment x 10 )
8
C
D
E
B
A
A
B
CUn-zoned
Fig. 8. Fluctuations of selected calcareous nannoplankton taxa throughout the study interval in XF and XF1 sections. Absolute abundances (as individuals/gram of sediment × 108) are represented in the top X-axes, while relative percentage abun-dances are represented in the bottom X-axes. Lithology and biostratigraphy are as in Fig. 2.
211R.A
guadoetal./Palaeogeography,Palaeoclim
atology,Palaeoecology395
(2014)198
–221
-1.0 -0.8 -0.6 -0.4 -0.2 0.0 0.2 0.4 0.6 0.8 1.0-1.0
-0.8
-0.6
-0.4
-0.2
0.0
0.2
0.4
0.6
0.8
1.0
-1.0 -0.8 -0.6 -0.4 -0.2 0.0 0.2 0.4 0.6 0.8 1.0-1.0
-0.8
-0.6
-0.4
-0.2
0.0
0.2
0.4
0.6
0.8
1.0
Factor 1Fertility Fertility
Factor 1
+ +- -
s. Zeugrhabd. gr.
s. Zeugrhabd. gr.
B. ellipticum B. ellipticum
D. ignotus
D. ignotus
R. laffittei
R. laffitteiRetecapsa spp.
Retecapsa spp.
Micrantholithus spp.
Micrantholithus spp.
Nannoconus spp.
Nannoconus spp.
H. irregularis
H. irregularis
S. siesseri
S. siesseri
H. chiastia
H. chiastia
C. conicus
C. conicus
D. lehmanii
D. lehmanii
C. margerelii
C. margerelii
R. asper gr.
R. asper gr.
E. foralis gr.
E. foralis gr.
W. barnesiae gr.W. barnesiae gr.
Assipetra spp.
Assipetra spp.
L. carniolensis L. carniol.
S. gaultensis gr.S. gaultensis gr.
Fig. 9. Scatter plots of factor 1 versus factor 2 and factor 1 versus factor 3 from PCA analysis (R-mode) varimax normalized rotation. Factor 1 is interpreted as fertility of the surface water,factor 2 is interpreted as temperature of the surface water, while factor 3 reflects the replacement of Nannoconus spp. and Micrantholithus spp. (neritic dwellers) by Assipetra spp.
212 R. Aguado et al. / Palaeogeography, Palaeoclimatology, Palaeoecology 395 (2014) 198–221
D. lehmanii was observed to be abundant in areas of supposed highfertility surface waters (Williams and Bralower, 1995; Erba et al.,2004), and interpreted as a mesotrophic (Bersezio et al., 2002) or ameso-eutrophic low temperature taxon (Tremolada et al., 2006). How-ever, the distribution patterns of this species have been found out ofphase (Erba et al., 1992) or opposed (Duchamp-Alphonse et al., 2007)with respect to high fertility taxa. The palaeoecological affinity ofC. margerelii remains controversial (Lees et al., 2005) although wasinterpreted as an r-selected taxon by Lees et al. (2006). Both taxa(D. lehmanii and C. margerelii) show abundance peaks synchronizedwith those of the R. asper gr., suggesting a palaeoecological affinity forwarm surface water environments, which is also evidenced by the rela-tionships shown by PCA Factor 2 (Table 3).
The palaeoecological affinities of H. chiastia and R. laffittei are cur-rently not known. Both taxa display moderate fluctuations spreadingacross the studied interval, suggesting some potential as proxies inpalaeoecological studies. The relationships shown in Tables 2 and 3 sug-gest an ecological preference ofH. chiastia for temperate and slightly ol-igotrophic environments and an affinity of R. laffittei for temperatesurface waters.
The Assipetra spp. group has no clear palaeoecological affinity (Leeset al., 2005) and shows increases in abundance in the lower Aptian atlow latitude (Erba, 1994; Aguado et al., 1999; Quijano et al., 2012) andin some mid latitude sites (Bottini and Mutterlose, 2012), coincidingwith the ‘nannoconid crisis’ event.
5.2. Palaeoecologic interpretation of PCA results
Factor 1 shows positive loadings for meso-eutrophic taxa indicatingmoderate to high fertility surfacewaters, and high negative loadings forthe eurytopic W. barnesiae gr. (Sections 4.5 and 5.1). In Factor 1,S. gaultensis gr. appears as associated with the meso-eutrophic taxa in-stead of cool-water taxa. This could indicate that Seribiscutum sp.cf. S. gaultensis, the more abundant species within the group (seeSection 4.4), is probably more related with Biscutum (high fertility)than with Seribiscutum (cool surface waters) as proposed by Bown inKennedy et al. (2000). Moderately high negative loadings of Factor 1for Nannoconus spp. could be explained in relation with the ecologicpreferences attributed to nannoconids (Section 5.1), as low-fertility sur-face waters and a deep nutricline. All these results suggest that Factor 1can be interpreted in terms of the adaption of calcareous nannofossil
taxa to different levels of trophic conditions, the highest loadings indi-cating a higher affinity for nutrient-rich surface waters (Fig. 9). The re-lationships between the different taxa from Factor 1 loadings havebeen used to obtain the adopted FI.
Factor 2 shows the highest positive loadings for a group of taxa(E. floralis gr., S. siesseri) that are usually considered to prefer cool–tem-perate surface waters, while negative loadings are displayed for thewarm-water R. asper gr. (see Section 5.1). H. irregularis, which hasbeen usually interpreted as a Tethyan warm-water taxon, is howeverassociated together with cool–temperate indicators in Factor 1(Table 3). This is in agreement with the results of Tiraboschi et al.(2009), who additionally used this species as a temperate-water indica-tor (Sections 4.5 and 5.1). The taxa R. laffittei and H. chiastia also showmoderately high positive loadings for Factor 2 (Table 3) and havebeen considered as potential temperate surface water indicators(Section 5.1). The negative loadings displayed for C. margerelii andD. lehmanii (Table 3, Fig. 9) in Factor 2, have been here interpreted asa likely preference of these species for warm waters. However, thepalaeoecological affinities of these two taxa remain controversial. Accord-ing to all these results, Factor 2 could be interpreted in terms of the adap-tion of calcareous nannofossils to temperature conditions, the highestloadings indicating a better adaption of taxa to cooler–temperate surfacewaters (Fig. 9). The absence of cold-water taxa further indicates generalwarm surface water environment throughout the studied interval. Thefluctuations of the adopted TI proxy, derived from Factor 2, should ratherbe considered as the result of the change between the warmest and theless warm (temperate) surface water conditions.
It is unclear what ecological gradient can be assigned to Factor 3 dueto the controversial palaeoecological affinity of Assipetra spp. (seeSection 5.1). In Factor 3, both Micrantholithus spp. and Nannoconusspp., generally admitted as neritic taxa (see Section 5.1), are opposedto Assipetra spp. (Table 3). High abundances of Assipetra spp. couldthen indicate a less neritic (more open-ocean or deepest) environment.This is in agreement with the global palaeogeographic distribution ofthese taxa throughout the Lower Cretaceous. While Micrantholithusspp. and Nannoconus spp. are mainly restricted to neritic settings(Roth and Krumbach, 1986; Mutterlose, 1989; Street and Bown, 2000;Bown, 2005; Lees et al., 2005), Assipetra spp. has been also recorded intruly open-ocean settings (Street and Bown, 2000; Lees et al., 2005).Peaks in the absolute and relative abundances of Micrantholithus spp.are synchronous with those of Nannoconus spp. throughout the

δ13Ccorg
δ13Ccarb δ18ObulkXF section
XF1 section
FI (this work) NI MNI TI (this work) TI MTI
0 20 40 60 0 20 40
0
2
4
6
8
10
12
14
16
18
20
22
24
26
28
30
32
34
36
38
-1 0 1 2 3 4
-1 0 1 2 3 4
-28 -26 -24 -22 -20 -18
-28 -26 -24 -22 -20 -18
0 20 40 60 0 20 40 60 0 20 40 60 0 20 40 60
0 20 400 20 40
0 20 40
0 20 40
60
0 20 40 60
0 20 40 60
0 20 40 60
0 20 40 60
0 20 40 60
0 20 40 60
0 20 40 60
0 20 40 60
0 20 40 60
0 20 40 60
0 20 40 60
0 20 40 60
0 20 40 60
0 20 40 60
-3.5 -3.0 -2.5 -2.0
-3.5 -3.0 -2.5 -2.0
-3.5 -3.0 -2.5 -2.0
-3.5 -3.0 -2.5 -2.0
0
2
4
6
8
10
12
14
16
18
20
Low fertility High fertility Temperate Warm Cooler Warmer
C
D
E
B
A
A
B
CUn-zoned
erutarepmeTytilitreF looChgiH mraWwoL
Fig. 10. Fluctuations of the fertility index (FI) and temperature index (TI) throughout the study interval. Comparisons with the nutrient index (NI) and temperature index (TI) of Herrle et al.(2003) and modified nutrient index (MNI) and modified temperature index (MTI) of Tiraboschi et al. (2009). Lithology and biostratigraphy are as in Fig. 2. Stable isotope data and fertility/nutrient and temperature indexes have been smoothed using the adjacent averaging method and a moving window of three points. The deduced trends in fertility and temperature areindicated at the right side.
213R. Aguado et al. / Palaeogeography, Palaeoclimatology, Palaeoecology 395 (2014) 198–221
Carretero Formation, and both taxa dramatically decrease in abundancethroughout the Carbonero Formation (Fig. 7). This prominent decreasein the absolute and relative abundance of Micrantholithus spp. in thelower Aptian cannot be easily explained by only invoking the usuallyproposed mechanisms implied in the ‘nannoconid crisis’ event asshallowing of the nutricline (Erba, 1994) and/or a pCO2-inducedbiocalcification crisis (Weissert and Erba, 2004; Erba et al., 2010, 2011).
During the early Aptian, there was a generalized platform drowningepisode coupled with a rapid rise in relative sea level (Weissert et al.,1998; Castro et al., 2008, 2012; Föllmi, 2012; Graziano, 2013) in theTethyan realm that affected most of the neritic environments. In shelfalenvironments, this platform drowning episode could have triggeredthe reduction of habitats for neritic dwellers (Nannoconus spp.,Micrantholithus spp.) favouring its replacement by more oceanic taxalike Assipetra spp. In consequence, the apparent replacement ofnannoconids by Assipetra during the ‘nannoconid crisis’ event (Leeset al., 2005) could, at least in part, be related with the widespreadearly Aptian platform drowning episode. Considering all the above, acandidate interpretation for Factor 3 is related with the depth of theenvironment and the increase of distality, and it could be used as an in-dicator for neritic conditions.
5.3. Other signals around the OAE 1a
5.3.1. Planktonic foraminiferaHigher abundances of planktonic foraminifera with radially elongat-
ed chambers have been recorded coinciding with the deposition of
organic-rich layers during OAEs (Magniez-Jannin, 1998; Aguado et al.,1999; Verga and Premoli Silva, 2005; Coccioni et al., 2006, 2007). In LaFrontera, the onset of the record of scarce planktonic foraminiferashowing chamber elongation coincides with the base of the CarboneroFormation. Subsequently, a marked increase of planktonic foraminiferawith trochospiral (Praehedbergella), planispiral (Globigerinelloides), andmixed (Leupoldina) elongated chambers is recorded just above the unitC and extends throughout the lowermost part of the unit D (Fig. 2). Thisincrease in abundance anddiversity of formswith “clavate”morphologyprobably initiated within the unit C and coincided with the OAE 1ainterval. A drop in the abundance and diversity of planktonic foraminif-eral assemblages, mainly affecting to “clavate” forms, was recordedthroughout the upper part of the unit D and lower part of the unit E(Fig. 2). After this drop, planktonic foraminifera with elongated cham-bers fluctuate in abundance, becoming occasionally common through-out the upper part of the unit E.
Chamber elongation has been interpreted as an adaptation to low ox-ygen conditions in the upperwater column andmay represent amorpho-logical response of planktonic foraminifera to improve oxygen exchangewith the seawater in dysoxic/anoxic environments. Nevertheless, the de-velopment of elongated chambers could have represented an ecologicaladvantage in eutrophic environments. Apart from oxygen content andnutrients, other ecological factors such as temperature fluctuations, salin-ity, trace elements or type of food are also invoked as controlling the com-position of planktonic foraminiferal assemblages and their evolutionduring the OAEs (Coccioni et al., 2004, 2006). New evidences suggestthat the episodic radiations of forms with elongated chambers were also

214 R. Aguado et al. / Palaeogeography, Palaeoclimatology, Palaeoecology 395 (2014) 198–221
related with other palaeoenvironmental factors such as increased upperwater column stratification, high productivity, enhanced seasonality orenvironmental stress (Coccioni et al., 2004, 2006). A size reduction ofplanktonic foraminifera was also recorded throughout the unit B in bothstudied sections. Similar reductions in the size of taxa have been linkedto environmental stress conditions such as greenhouse warming, anoxicor dysoxic waters, and restricted circulation (MacLeod et al., 2000;Coccioni and Luciani, 2004; Keller and Abramovich, 2009).
5.3.2. RadiolariaA very distinct feature observed throughout the B–D units is the re-
cord of a high radiolarians/planktonic foraminiferal ratio (r/pf),reaching maximum values within the unit C and strongly decreasingat the end of unit E, were planktonic foraminifera become dominant.In modern oceans, increased opal content in sediments is linked tohigher fertility in surface waters, showing the r/pf ratios' highest valuesin regions of most intense upwelling systems (Diester-Haass, 1977).Also, carbonate dissolution is higher at the time of intense surface pro-ductivity. In this sense, the dissolution index of planktonic foraminiferaalso reaches highest values duringmost intensive episodes of upwelling(Caulet et al., 1992). The CaCO3 content recorded in dark–light laminat-ed deposits of upwelling regions also shows major dissolution in darkcycles, probably influenced largely by the supply of oxidizable organicmatter to the sea bottom (Diester-Haass et al., 1986).
The radiolarian assemblages observed fromB–C units are dominatedby multicyrtid, cryptocephalic and cryptothoracic nassellarians, be-longing to families Williriedellidae (Williriedellum, Crymptaphorella,Holocryptocanium), Archaeodictyomitridae (Archaeodictyomitra,Thanarla) and Xitidae (Xitus, Praexitus). Similar nassellarian-dominatedassemblages were found to be abundant within the Selli and BonarelliLevels in sections from the Northern Apennines and Southern Alps, andwere interpreted as Cretaceous deep-dwelling polycystine forms, whichbloomed during high-productivity events (Premoli Silva et al., 1999;Musavu-Moussavou et al., 2007).
Other general characteristic of La Frontera is the predominance ofnassellarians over spumellarians in both, species abundance and speciesdiversity. Some Mesozoic studies have emphasized the paleoenviron-mental meaning of the spumellarians/nassellarians (S/N) abundanceratio as a function of the bathymetry. A depth-related bimodal distribu-tion is found inwell-documentedMesozoic examples,with spumellariansprevailing in intermediate water depths, and nassellarians being moreabundant in shallow- and deep-water deposits (Empson-Morin, 1984;Kiessling, 1996; Zügel et al., 1998; Gorican et al., 2003). However, envi-ronments with oxygen-depleted intermediate waters are characterizedby high S/N ratios with dominance of spongy cold-water forms, as itwas recognized in organic-rich sediments around the Cenomanian/Turonian boundary (Kuhnt et al., 1986). Considering all these aspectsone could conclude that the assemblages recorded at La Frontera aremore characteristic of deep- than intermediate-water deposits.
The high proportion of deep-dwelling species (multicyrtid, crypto-cephalic and cryptothoracic nassellarians) during the OAE1a and thevery low S/N abundance ratios observed at La Frontera is interpretedas a response to the high productivity of the upper mixed layer whichtriggers these siliceous blooms. In modern oceans, deep-dwellers aremore dominant below highly productive regions as they feed directlyfrom shallow productive water-masses (Casey et al., 1979a,b; Casey,1993). Therefore, these deep-dwelling radiolarians may have beenfavoured in periods of eutrophic conditions and high flux of organicmatter towards the seafloor which caused an enhancement of deep-water radiolarian diversity and number in the sediment.
The accumulation of siliceous skeletons (mainly radiolarians, andsome spicule debris) and their presence as the dominant biotic ele-ments from interval B–D is a strong evidence of high fertility in surfacewaters during the early Aptian. The preservation of siliceous skeletons isenhanced in the sedimentary record during periods of greater surfacewater productivity andnet accumulation of silica at the seafloor because
the oceans are undersaturatedwith respect to silica. Therefore, the pres-ervation of significant amounts of radiolarians in ancient sediments isindicative of high biologic productivity (Berger, 1970; Diester-Haass,1978).
5.3.3. BiomarkersBiomarker ratios (OEP, C31 22S/(22S + 22R), 17a,21b-homohopane
and C30 βα/(βα + αβ) hopane ratios), along with the sterane distri-butions all indicate relatively low thermal maturity (Seifert andMoldowan, 1986; Zumberge, 1987; Peters et al., 2005) although thevariations through the section suggest changes in organicmatter inputs,as has also been noted by van Breugel et al. (2007).
C27–C29 steranes are the diagenetic product of steroids, predomi-nantly produced by (algal) eukaryotes (Schwark and Empt, 2006 andreferences therein). Pristane and phytane are generally considered toderive from phytol (e.g. Powell and McKirdy, 1973; but see Ten Havenet al., 1987), under relatively oxidising and reducing conditions, respec-tively (Didyk et al., 1978). Phytol is an integral part of chlorophyll-a, es-sential for photosynthesis, and the most abundant isoprenoid in thebiosphere (Rontani and Volkman, 2003). The abundance of these bio-markers is interpreted to reflect an increase in surface water productiv-ity in the Subbetic Zone in southern Spain during C3 to C6 segments ofMenegatti et al. (1998) (Fig. 2).
Clear biomarker evidence for anoxia is lacking in all samples —
gammacerane and isorenieratane (and derivatives) were not detected,and the pristane/phytane ratio should be applied cautiously in sedi-ments of such low thermal maturity (Peters et al., 2005). A lack of pro-found water column anoxia is corroborated by the lack of high totalorganic carbon (TOC) content at section XF1 (values between 0.4 and2 wt.%), although it is noted that sedimentological features are consis-tent with sedimentary anoxia during black shale deposition.
5.4. Palaeoceanographic reconstruction of the late Barremian–early Aptianinterval in the Subbetic
The nannofossil-derived FI indicates general relatively low-fertilitysurface water conditions during the uppermost Barremian (Fig. 10). Inaddition, moderate to high abundances of Nannoconus spp. andMicrantholithus spp. suggest influence of neritic conditions. The temper-ature of the surface waters, according with nannofossil indexes (TI,MTI), was broadly warm, with no significant variations. These resultsdiffer from those suggested by the δ18Obulk curve, which shows moder-ate fluctuations and average higher values throughout the uppermostBarremian, when comparedwith the lower Aptian. Both, sedimentolog-ical evidences and calcareous nannofossil preservation indicate thatδ18Obulk values could be slightly altered throughout the studied intervalof the Carretero Formation. Calcareous nannofossil assemblages suggestbroadly oligotrophic surface waters in a neritic environment, adjacentto hinterlands where warm and dry climatic conditions prevailed asthe most probable scenario for the sedimentation of the CarreteroFormation (Fig. 11a). Under these dry climatic conditions with a weakrunoff, scarce nutrients reached La Frontera area, where calcareousnannofossil assemblages containing moderate to high proportions ofnannoconids developed. The high proportions of nannoconids indicatethat the nutricline was probably located near the lower part of the pho-tic zone during most of this interval. A rather similar scenario has beendepicted for the deposition of the upper Barremian chalks of the NorthSea area (Mutterlose and Bottini, 2013), where endemic nannoconidswere the dominant taxa. Episodically, some samples of the CarreteroFormation (XF 3.65 m, XF 6.7 m) contain higher proportions of meso-eutrophic taxa and lower abundances of nannoconids. These assemblagesare interpreted as the result of short-lived episodes of mesotrophic sur-face waters, probably linked to somewhat more humid climatic condi-tions in the adjacent hinterlands (Fig. 11b).
Tectonics and sea-level changeswere themain processes involved inthe development of the stratigraphic gap at the boundary between the
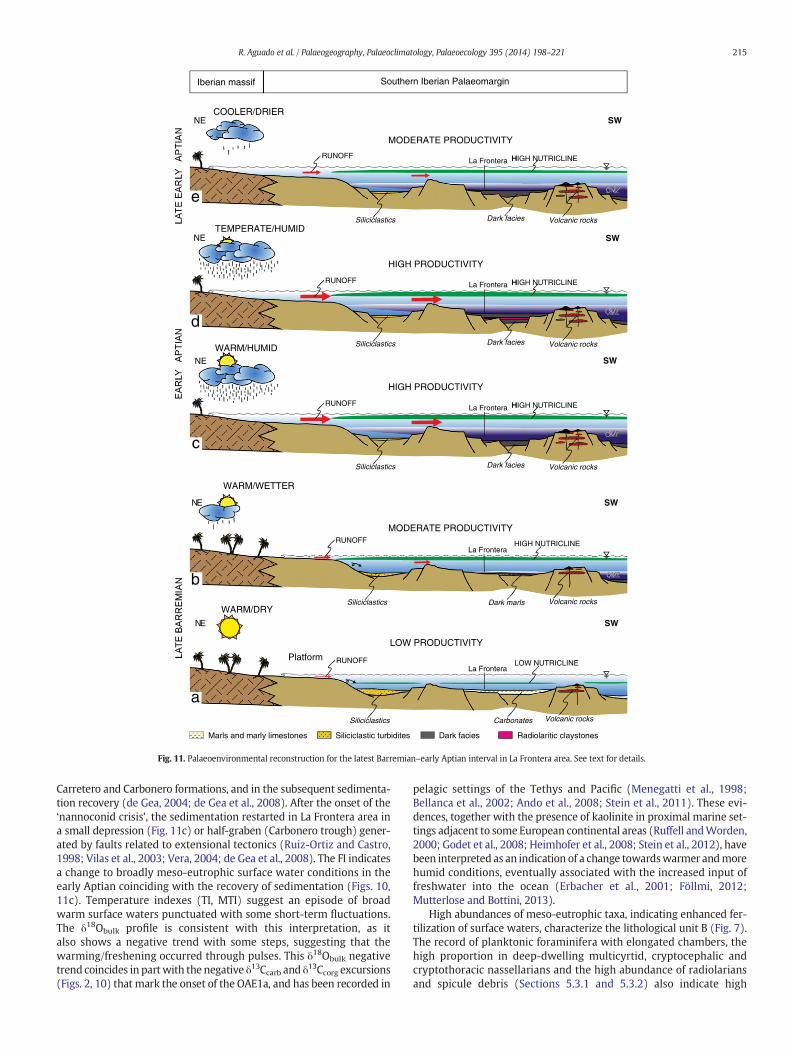
RUNOFF HHIGH NUTRICLINE
HIGH PRODUCTIVITY
WARM/HUMID
Siliciclastics Dark facies
NE SW
La Frontera
Volcanic rocks
c
MODERATE PRODUCTIVITY
WARM/WETTER
SWEN
Iberian massif Southern Iberian Palaeomargin
RUNOFF HIGH NUTRICLINEH
MODERATE PRODUCTIVITY
COOLER/DRIER
Siliciclastics Dark facies
SWNE
La Frontera
Volcanic rocks
e
Volcanic rocks
RUNOFF HHIGH NUTRICLINE
HIGH PRODUCTIVITY
TEMPERATE/HUMID
Siliciclastics Dark facies
SW
La Frontera
d
NE
senotsyalccitiraloidaRsetidibrutcitsalciciliS seicafkraDsenotsemilylramdnaslraM
SWEN
La FronteraLOW NUTRICLINERUNOFFPlatform
LOW PRODUCTIVITY
WARM/DRY
CarbonatesSiliciclastics Volcanic rocks
a
RUNOFF HIGH NUTRICLINELa Frontera
Siliciclastics Dark marls Volcanic rocks
b
Fig. 11. Palaeoenvironmental reconstruction for the latest Barremian–early Aptian interval in La Frontera area. See text for details.
215R. Aguado et al. / Palaeogeography, Palaeoclimatology, Palaeoecology 395 (2014) 198–221
Carretero and Carbonero formations, and in the subsequent sedimenta-tion recovery (de Gea, 2004; de Gea et al., 2008). After the onset of the‘nannoconid crisis’, the sedimentation restarted in La Frontera area ina small depression (Fig. 11c) or half-graben (Carbonero trough) gener-ated by faults related to extensional tectonics (Ruiz-Ortiz and Castro,1998; Vilas et al., 2003; Vera, 2004; de Gea et al., 2008). The FI indicatesa change to broadly meso-eutrophic surface water conditions in theearly Aptian coinciding with the recovery of sedimentation (Figs. 10,11c). Temperature indexes (TI, MTI) suggest an episode of broadwarm surface waters punctuated with some short-term fluctuations.The δ18Obulk profile is consistent with this interpretation, as italso shows a negative trend with some steps, suggesting that thewarming/freshening occurred through pulses. This δ18Obulk negativetrend coincides in partwith the negative δ13Ccarb and δ13Ccorg excursions(Figs. 2, 10) that mark the onset of the OAE1a, and has been recorded in
pelagic settings of the Tethys and Pacific (Menegatti et al., 1998;Bellanca et al., 2002; Ando et al., 2008; Stein et al., 2011). These evi-dences, together with the presence of kaolinite in proximal marine set-tings adjacent to some European continental areas (Ruffell andWorden,2000; Godet et al., 2008; Heimhofer et al., 2008; Stein et al., 2012), havebeen interpreted as an indication of a change towardswarmer andmorehumid conditions, eventually associated with the increased input offreshwater into the ocean (Erbacher et al., 2001; Föllmi, 2012;Mutterlose and Bottini, 2013).
High abundances of meso-eutrophic taxa, indicating enhanced fer-tilization of surface waters, characterize the lithological unit B (Fig. 7).The record of planktonic foraminifera with elongated chambers, thehigh proportion in deep-dwelling multicyrtid, cryptocephalic andcryptothoracic nassellarians and the high abundance of radiolariansand spicule debris (Sections 5.3.1 and 5.3.2) also indicate high

216 R. Aguado et al. / Palaeogeography, Palaeoclimatology, Palaeoecology 395 (2014) 198–221
productivity, surface water stratification and a dysoxic environment.The biomarker associations also indicate a clear increase in marine pro-ductivity during the beginning of the early Aptian. It is suggested thatincreasing runoff conditions, as response to more humid climate in ad-jacent continental area, caused this fertilization. In La Frontera area, thearrival of nutrients from runoff was probably favoured by the onset of asecond-order transgressive phase (Haq et al., 1987; Vilas et al., 1993;Castro et al., 2008) that deepened the pelagic swell of the ExternalSubbetic (Fig. 11c). Aside from a pCO2-induced biocalcification crisis(Erba et al., 2010), lower photic zone dwellers as nannoconids were af-fected by the shallowing of the nutricline related with thiseutrophication of surface waters. The deepening of the Subbetic Basinin La Frontera area during the deposition of the Carbonero Formationis also sustained by the recorded decrease in the abundances of neritictaxa (Fig. 7). In addition, this deepening probably affected to nanno-conids, locally contributing to the development of a more pronounced‘nannoconid crisis’ event (Section 5.2). Both nannoconids and especiallyMicrantholithus spp. are slightly more abundant in coeval sediments atmore neritic environment settings (shallow carbonate ramp) as ob-served in the Cau section (Aguado et al., 1999; Quijano et al., 2012).
The unit C (Fig. 2) is devoid of carbonates and calcareousmicrofossils(Figs. 2, 7, 8). A similar absence of carbonatewas reported from its coun-terpart Livello Selli in the Northern Apennines (Coccioni et al., 1987,1992; O'Dogherty, 1994). Nevertheless, both radiolarian and bio-markers indicate a highest marine productivity during the depositionof this lithologic unit. An intriguing feature of this interval is that itsbase is slightly diachronouswhen comparing both sections, being youn-ger in XF section, where its lower limit is located above the CIE. In XF1section, its thickness nearly coincides with the extent of the OAE1a,and includes the CIE in its lower part. Some carbonaceous fragmentsof land woody material (Fig. 2) were found in the upper part of thisunit in the XF1 section, suggesting enhanced runoff in the adjacent hin-terlands and dispersal of nutrients in La Frontera area. Radiolariansshow very low S/N abundance ratios for this interval, and assemblagesare dominated by multicyrtid, cryptocephalic and cryptothoracicnassellarians suggesting nutrient-rich surface waters (Section 5.3.2).Erba et al. (2010, 2011) documented deepwater oceanic acidificationfrom the study of the Selli Level in the Cismon core, which induced ashallowing of the lysocline up to near the photic zone, and shoaling ofthe calcite compensation depth (CCD). At present, we do not haveenough data to elucidate which caused the carbonate loss in the unit Cof La Frontera sections. Further investigations are needed to know ifthis was the result of severe dissolution at the sediment/water interface,induced by a shallowing of the calcite lysocline/CCD, or related withearly diagenetic transformations in the organic matter or both.
Fertility indices (FI, NI, MNI) continue indicating meso-eutrophicsurface water conditions throughout the lower part of the unit D(Fig. 10), whereas biomarker data show a drop in themarine productiv-ity. The planktonic foraminifera with elongated chambers show aremarkable increase in the same interval (Section 5.3.1), while a lowradiolarian S/N abundance ratio and a high proportion of siliceous skel-etons (Section 5.3.2), all suggest eutrophic conditions, anoxic–dysoxicenvironment and surface water stratification. Temperature nannofossil-derived indices (TI, MTI) indicate a change to broadly more temperatebut fluctuating (unstable) climatic conditions. The δ18Obulk values displaysomefluctuations but no clear trend throughout this interval, with the ex-ceptionof a short negative excursion (XF113 mtoXF114.5 m) that couldbe interpreted in relation to a short warming pulse and/or a freshening ofsurface-waters. It is suggested that strong runoff, as a consequence of atemperate and humid climate in the adjacent hinterlands, caused surfacewater fertilization during the deposition of the lower part of the unit D(Fig. 11d). In turn, this could significantly reduce the deep-water forma-tion and the enhancement of surface-water stratification. Both mecha-nisms favoured the oxygen consumption in the bottom waters, whichin turn increased the preservation potential of the organic matter. Thisscenario is rather similar to the model proposed by Föllmi (2012) for
reinforced greenhouse conditions, with the formation of larger humid cli-mate belts and an irregular distribution of heat. The continued second-order transgressive phase that deepened the pelagic swell of the ExternalSubbetic probably favoured the arrival of nutrients to La Frontera area,where organic-rich sediments were deposited under anoxic/dysoxic con-ditions in the Carbonero trough (Fig. 11d).
A decrease in the values of FI (Fig. 10) characterizes the upper part ofthe unit D and the base of the unit E. This drop also partially correlateswith negative δ13Ccarb and δ13Ccorg excursions while temperaturenannofossil-derived indices (especially the MTI and our TI) indicate ashift towards broadly cooler conditions. All these suggest that a shifttowards a cooler and drier climate in the hinterlands adjacent to LaFrontera area leds to the reduction of runoff which led to the decreasein the transfer of nutrients and freshwater into the sea (Fig. 11e). Thisscenario is supported by the decrease in absolute and relative abun-dances of meso-eutrophic calcareous nannofossil taxa (Fig. 7) andplanktonic foraminifera with “clavate” morphology and is interpretedas an episode linked to more oligotrophic surface water conditions,which is in agreementwith the biomarker data. Nannoconids do not re-cover throughout this interval, andMicrantholithus spp. is nearly absent,which suggests a relatively deep environment in La Frontera area. Thisepisodemarked the endof theprevious period of reinforced greenhouseconditions.
Finally, themid and upper part of the unit E is characterized by fluc-tuating values of FI, with a general trend towards the recovery (Fig. 10).The nannofossil-derived temperature indices also fluctuate withinbroadly cool-temperate conditions. A fluctuating recovery was also ob-served in planktonic foraminifera with elongated chambers. Short-termminor increases in productivity are also indicated by the biomarker data(Fig. 2). This suggests that alternating episodes between cooler-drierand warmer-humid climatic conditions were established. These short-term oscillating conditions probably exerted a significant control onrunoff and indirectly in the transfer of freshwater and nutrients intothe sea. Surface-water stratification probably decreased, at least duringshort-lived intervals, causing a slightly better mixing and oxygenationin mid and bottomwaters. These conditions are reflected in the litholo-gy, by the sedimentation of green marls instead of black marls (Fig. 2).
6. Conclusions
Quantitative analyses of the calcareous nannofossil assemblagesfrom La Frontera sections reveal variations in abundance and composi-tion around the OAE 1a. The abundance and distribution of dissolution-susceptible taxa indicates that diagenetic overprint did not significantlymodify the original nannofloral patterns. Statistical analyses of nanno-fossil assemblages indicate that more than 50% of the total variance isrelatedwithpalaeoceanographic factors, being fertility and temperatureof surface waters the most significant.
Calcareous nannofossil assemblages and fertility (FI) and tempera-ture (TI) ratios suggest generally oligotrophic surface waters in a neriticenvironment, adjacent to hinterlands where warm and dry climaticconditions predominate, as the most probable scenario for the latestBarremian. This general scenario was punctuated by short-lived epi-sodes of mesotrophic surface waters, probably linked to intervals ofsomewhat more humid climatic conditions and slightly strengthenedrunoff.
The deposition of the dark marls and radiolaritic clays of theCarbonero Formation during the early Aptian postdated the onset ofthe ‘nannoconid crisis’ event. Calcareous nannofossils, planktonic forami-nifera, and radiolarian assemblages indicate enhanced fertilization of sur-face waters. Biomarkers reveal a high marine productivity during OAE 1a,whereas evidences for strong and persistent anoxia are absent.We suggestthat an increased runoff, consequence of amore humid climate, caused thisfertilization. An early Aptian deepening of the Subbetic Basin probablyfavoured the arrival of nutrients to La Frontera area. Increasing humidityduring the sedimentation of the dark marls and radiolaritic clays could
217R. Aguado et al. / Palaeogeography, Palaeoclimatology, Palaeoecology 395 (2014) 198–221
lead to a decrease in the deep-water formation and probably an enhance-ment of surface-water stratification. Both mechanisms favoured the oxy-gen consumption in the bottom waters, which in turn increased thepreservation potential of the organic matter. TI indicates broadly warm totemperate climatic conditions for most of the early Aptian.
A decrease in the values of FI linked to a slightly cooler episode, andan abundance decrease of planktonic foraminifera with elongatedchambers, occurred in the upper part of the lower Aptian. This isinterpreted as a shift towards cooler and drier climate conditions, lead-ing to a runoff reduction and the subsequent decrease in the transfer ofnutrients and freshwater into the sea.
Highly fluctuating FI and TI ratios, and the oscillating recovery in theabundance of planktonic foraminifera with elongated chambers, sug-gest unstable climatic conditions near the end of the early Aptian.Surface-water stratification probably decreased, at least during short-lived intervals, causing a slightly better mixing and oxygenation inmid and bottom waters.
A dramatic reduction in the abundance of deep dweller taxa(‘nannoconid crisis’) predates the OAE1a that likely indicates increasingtrophic levels and a rising nutricline as is further supported by the highabundance of fertility-related taxa. High CO2 levels and increasing pri-mary productivity probably triggered a shift in abundance from largenannoliths such as nannoconids to small sized r-selected coccolithsthat overall record a biocalcification crisis at the onset and during theearly Aptian carbon-isotope perturbation.
Dysoxic–anoxic conditions during the early Aptian were probablythe result of the combined effects of global and local factors. Thesustained high productivity caused by surface water fertilization wasthe result of increased runoff linked to a more humid climate. The pres-ervation of the organic matter in the sediments was the result of a highproductivity joined to the peculiar physiography and tectonic evolutionof the Carbonero trough, which favoured its accumulation and burialdue to a restricted water circulation and a high subsidence rate.
Our results suggest that the formationof the lower Aptiandark faciesin the Subbetic Basin was mainly controlled by enhanced production oforganic matter in the upper water column, which prevailed over in-creased preservation of organic matter at the sea floor.
Acknowledgements
The authorswish to thankA. Carrillo for her helpwith the processingof micropalaeontological samples. This work is a contribution of the re-search projects CGL2009-10329, CGL2011-23759 and CGL2011-24546(Spanish Ministry of Science and Technology), “Episodios de CambioClimático Global” (Instituto de Estudios Giennenses) and RNM-200(Junta de Andalucía). C. Lowson is acknowledged for the biomarkeranalyses. F. Surlyk and two anonymous reviewers improved the manu-script by their useful suggestions.
Appendix A. Taxonomic index
Calcareous nannofossils observed in this study or cited in the text.Species are listed in alphabetical order. Authors and date of the originaldescription and, when necessary, emendation or remarks are provided.See Perch-Nielsen (1985), Aguado et al. (1997), Bown (1998, 2005),Kennedy et al. (2000), Tremolada and Erba (2002) and Herrle andMutterlose (2003), for full information regarding taxonomy andauthorships.
Species observed in this study.Assipetra infracretacea (Thierstein, 1973) Roth, 1973 ssp.
infracretaceaAssipetra infracretacea (Thierstein, 1973) Roth, 1973 ssp. larssonii
Tremolada and Erba, 2002Assipetra terebrodentaria (Applegate et al., in Covington and Wise,
1987) Rutledge and Bergen in Bergen, 1994 ssp. terebrodentaria
Assipetra terebrodentaria (Applegate et al., in Covington and Wise,1987) Rutledge and Bergen in Bergen, 1994 ssp. youngii Tremoladaand Erba, 2002
Axopodorhabdus dietzmannii (Reinhardt, 1965) Wind andWise, 1983Biscutum constans (Górka, 1957) Black in Black and Barnes, 1959Chiastozygus litterarius (Górka, 1957) Manivit, 1971Conusphaera rothii (Thierstein, 1971) Jakubowski, 1986Cretarhabdus conicus Bramlette and Martini 1964Cretarhabdus striatus (Stradner, 1963) Black, 1973Crucibiscutum hayi (Black, 1973) Jakubowski, 1986Cyclagelosphaera margerelii Noël, 1965Cyclagelosphaera rotaclypeata Bukry, 1969Diazomatolithus lehmanii Noël, 1965Diloma primitiva (Worsley, 1971) Wind and Cepek, 1979Discorhabdus ignotus (Górka 1957) Perch-Nielsen, 1968Eprolithus apertior Black, 1973Eprolithus floralis (Stradner, 1962) Stover, 1966Flabellites oblongus (Bukry, 1969) Crux in Crux et al., 1982Grantarhabdus coronadventis (Reinhardt, 1966) Grün in Grün and
Allemann, 1975Haqius circumradiatus (Stover, 1966) Roth, 1978Hayesites irregularis (Thierstein in Roth and Thierstein, 1972)
Applegate et al. in Covington and Wise, 1987Helenea chiastiaWorsley, 1971Hemipodorhabdus gorkae (Reinhardt, 1969) Grün in Grün and
Allemann, 1975Lithraphidites carniolensis Deflandre, 1963Manivitella pemmatoidea (Deflandre, 1965) Thierstein, 1971, emend.
Black, 1973Micrantholithus hoschulzii (Reinhardt, 1966) Thierstein, 1971Micrantholithus obtusus Stradner, 1963Micrantholithus stellatus Aguado, 1997Mitosia infinita Worsley, 1971Nannoconus bucheri Brönnimann, 1955Nannoconus circularis Déres and Achéritéguy, 1980Nannoconus steinmannii Kamptner, 1931Nannoconus truittii Brönnimann, 1955Owenia partita (Varol, in Al-Rifaiy et al., 1990) Bown, in Kennedy et al.,
2000Palaeomicula maltica (Worsley, 1971) Varol and Jakubowski, 1989Percivalia fenestrata (Worsley, 1971) Wise, 1983Polycostella? prossii Herrle and Mutterlose, 2003Radiolithus planus Stover, 1966Retecapsa angustiforata Black, 1971Retecapsa schizobrachiata (Gartner, 1968) Grün in Grün and
Allemann, 1975Retecapsa crenulata (Bramlette andMartini, 1964) Grün inGrün and
Allemann, 1975Rhagodiscus amplus Bown, 2005Rhagodiscus angustus (Stradner, 1963) Reinhardt, 1971Rhagodiscus asper (Stradner, 1963) Reinhardt, 1967Rhagodiscus gallagheri Rutledge and Bown, 1996Rhagodiscus robustus Bown, 2005Rhagodiscus sageri Bown, 2005Rhagodiscus sp. cf. R. achlyostaurion (Hill, 1976) Doeven 1983Forms of Rhagodiscus similar to R. achlyostaurion in having a brightly
birefringent spine base in the central area. They differ from typicalR. achlyostaurion in that the diameter of the birefringent spine is smallerand included in (not completely filling) the central area. The peripheryof the spine never reaches the central area margin.
Rotelapillus laffittei (Noël, 1957) Noël, 1973Seribiscutum sp. cf. S. gaultensis Mutterlose, 1992Forms of Seribiscutum similar to S. gaultensis in size and structure, but
showing a slightlywider central area partially closedbyplatelike elements.Staurolithites mitcheneri (Applegate and Bergen, 1988) Rutledge and
Bown, 1998

218 R. Aguado et al. / Palaeogeography, Palaeoclimatology, Palaeoecology 395 (2014) 198–221
Staurolithites mutterlosei Crux, 1989Staurolithites siesseri Bown in Kennedy et al., 2000Stoverius achylosus (Stover, 1966) Perch-Nielsen, 1986Stoverius acutus (Thierstein, inRoth and Thierstein, 1972) comb. nov.Basyonim:Corollithion acutum Thierstein, 1972, p. 438, pl. 2,figs. 1–9
(1=holotype). Roth, P.H. and Thierstein, H.R., 1972. Calcareous nanno-plankton: Leg 14 of the Deep Sea Drilling Project, in: Hayes, D.E., Pimm,A.C., et al. (Eds.), Initial Reports of the Deep Sea Drilling Project. U. S.Government PrintingOffice,Washington, pp. 421–485. Remarks: This spe-cies has a low, narrow, elliptical rim and a wide central area spanned bylow angle diagonal cross bars. The rim is bicyclic when viewed in cross-polarized light microscopy. As the genus Corollithion Stradner, 1961 con-tains mainly forms with polygonal outline, this form is better placed inthe genus Stoverius Perch-Nielsen, 1986 (circular to elliptical outline).S. acutus is rare in the investigated samples, and was first recorded withinthe NC6 zone. The FO of S. achylosuswas recorded within NC7A subzone.So, we speculate that S. acutus could be the ancestor of S. achylosus.
Stradnerlithus geometricus (Górka, 1957) Bown and Cooper, 1989Tegumentum stradneri Thierstein in Roth and Thierstein, 1972Tetrapodorhabdus decorus (Deflandre in Deflandre and Fert, 1954)
Wind and Wise inWise and Wind, 1977Tranolithus gabalus Stover, 1966, emend. Köthe, 1981Tubodiscus burnettiae Bown in Kennedy et al., 2000Watznaueria barnesiae (Black in Black and Barnes, 1959) Perch-
Nielsen, 1968Watznaueria biporta Bukry, 1969Watznaueria britannica (Stradner, 1963) Reinhardt, 1964Watznaueria fossacincta (Black, 1971) Bown inBownandCooper, 1989Watznaueria ovata Bukry, 1969Zeugrhabdotus diplogrammus (Deflandre in Deflandre and Fert,
1954) Burnett in Gale et al., 1996Zeugrhabdotus embergeri (Noël, 1958) Perch-Nielsen, 1984 (forms
greater than 15 μm)Zeugrhabdotus embergeri (Noël, 1958) Perch-Nielsen, 1984 (forms
15 μm or lower)Zeugrhabdotus erectus (Deflandre in Deflandre and Fert, 1954)
Reinhardt, 1965Zeugrhabdotus howei Bown in Kennedy et al., 2000Zeugrhabdotus noeliae Rood et al., 1971Zeugrhabdotus scutula (Bergen, 1994) Rutledge and Bown, 1996Zeugrhabdotus trivectis Bergen, 1994Zeugrhabdotus xenotus (Stover, 1966) Burnett in Gale et al., 1996Calcareous nannofossil species cited in the text.Braarudosphaera bigelowii (Gran and Braarud, 1935) Deflandre, 1947Alphabetic taxonomic list including the names of planktonic forami-
nifera and radiolaria cited in text and figures.Planktonic foraminifera:Globigerinelloides blowi (Blow, 1959)Globigerinelloides ferreolensisMoullade, 1961Leupoldina cabri (Sigal, 1952)Radiolaria:“Hiscocapsa” asseni (Tan, 1927)Turbocapsula costata (Wu, 1986)
Appendix B. Supplementary data
Supplementary data to this article can be found online at http://dx.doi.org/10.1016/j.palaeo.2013.12.031.
References
Aguado, R., 1994. Nannofósiles del Cretácico de la Cordillera Bética. Bioestratigrafía. Ph.D.Thesis University of Granada, Granada (413 pp.).
Aguado, R., Company, M., Martín-Pérez, J.A., Martínez-Gallego, J., O'Dogherty, L., Sandoval,J., 1988. Bioestratigrafía integrada del Barremiense–Aptiense del sector de Campillode Arenas (Subbético Medio). Ejemplo de aplicación al análisis de cuencas. II
Congreso Geológico de España. Simposio: Nuevas tendencias en el análisis decuencas. Instituto Geológico y Minero de España, Granada, pp. 195–204.
Aguado, R., Company, M., O'Dogherty, L., Sandoval, J., Tavera, J.M., 1992. Biostratigraphicanalysis of the pelagic Barremian/Aptian in the Betic Cordillera (Southern Spain). Pre-liminary data. Cretac. Res. 13, 445–452.
Aguado, R., Company, M., Sandoval, J., Tavera, J.M., 1997. Biostratigraphic events at theBarremian/Aptian boundary in the Betic Cordillera (southern Spain). Cretac. Res.18, 309–329.
Aguado, R., Castro, J.M., Company, M., de Gea, G.A., 1999. Aptian bioevents— an integratedbiostratigraphic analysis of the Almadich Formation, Inner Prebetic Domain, SE Spain.Cretac. Res. 20, 663–683.
Aguado, R., O'Dogherty, L., Sandoval, J., 2008. Fertility changes in surface waters duringthe Aalenian (mid Jurassic) of the Western Tethys as revealed by calcareousnannofossils and carbon-cycle perturbations. Mar. Micropaleontol. 68, 268–285.
Ando, A., Kaiho, K., Kawahata, H., Kakegawa, T., 2008. Timing and magnitude of EarlyAptian extremewarming: unraveling primary δ18O variation in indurated pelagic car-bonates at Deep Sea Drilling Project Site 463, central Pacific Ocean. Palaeogeogr.Palaeoclimatol. Palaeoecol. 260, 463–476.
Arthur, M.A., Dean, W.E., Schlanger, S.O., 1985. Variations in the global carbon cycle dur-ing the Cretaceous related to climate, volcanism, and changes in atmospheric CO2. In:Sundquist, E.T.S., Broecker, W.S. (Eds.), The Carbon Cycle and Atmospheric CO2: Nat-ural Variations Archean to the Present. Geophys. Monogr, 32, pp. 504–529.
Baumgartner, P.O., O'Dogherty, L., Goričan, Š., Urquhart, E., Pillevuit, A., De Wever, P.,1995. Middle Jurassic to Lower Cretaceous Radiolaria of Tethys: occurrences, system-atics, biochronology. Mém. Géol. (Lausanne) 23, 1–1172.
Bellanca, A., Erba, E., Neri, R., Premoli Silva, I., Sprovieri, M., Tremolada, F., Verga, D.,2002. Palaeoceanographic significance of the Tethyan ‘Livello Selli’ (Early Aptian)from the Hybla Formation, northwestern Sicily: biostratigraphy and high-resolution chemostratigraphic records. Palaeogeogr. Palaeoclimatol. Palaeoecol.185, 175–196.
Berger, W.H., 1970. Biogenous deep-sea sediments: fractionation by deep-sea circulation.Geol. Soc. Am. Bull. 81, 1385–1401.
Bersezio, R., Erba, E., Gorza, M., Riva, A., 2002. Berriasian–Aptian black shales of the Maiolicaformation (Lombardian Basin, Southern Alps, Northern Italy): local to global events.Palaeogeogr. Palaeoclimatol. Palaeoecol. 180, 253–275.
Bottini, C., Mutterlose, J., 2012. Integrated stratigraphy of Early Aptian black shales in theBoreal Realm: calcareous nannofossil and stable isotope evidence for global and re-gional processes. Newsl. Stratigr. 45, 115–137.
Bown, P.R., 1992. New calcareous nannofossil taxa from the Jurassic/Cretaceous boundaryinterval of Sites 765 and 261, Argo Abyssal Plain. In: Gradstein, F.M., Ludden, J.N., et al.(Eds.), Proceedings of the Ocean Drilling Program, Scientific Results, College Station,Texas, pp. 369–379.
Bown, P.R., 1998. Calcareous nannofossil biostratigraphy. British MicropalaeontologicalSociety Publication SeriesChapman and Hall, London (314 pp.).
Bown, P.R., 2005. Early to mid-Cretaceous calcareous nannoplankton from the NorthwestPacific Ocean, Leg 198, Shatsky Rise. In: Bralower, T.J., Premoli Silva, I., Malone, M.J.(Eds.), Proceedings of the Ocean Drilling Project Scientific Results, pp. 1–82.
Bralower, T.J., Leckie, R.M., Sliter, W.V., Thierstein, H.R., 1995. An integrated Cretaceousmicrofossil biostratigraphy. In: Berggren, W.A., Kent, D.V., Aubry, M.-P., Hardenbol,J. (Eds.), Geochronology, Time Scales and Global Stratigraphic Correlation. TheSociety of Economic Paleontologists and Mineralogists Special Publication, 54,pp. 65–79.
Brand, L.E., 1994. Physiological ecology of marine coccolithophores. In: Winter, A.,Siesser, W.G. (Eds.), Coccolithophores. Cambridge University Press, Cambridge,UK, pp. 39–49.
Browning, E.L., Watkins, D.K., 2008. Elevated primary productivity of calcareous nanno-plankton associated with ocean anoxic event 1b during the Aptian/Albian transition(Early Cretaceous). Paleoceanography 23 (PA2213). http://dx.doi.org/10.1029/2007PA001413.
Caron, M., 1985. Cretaceous planktic foraminifera. In: Bolli, H.M., Saunders, J.B., Perch-Nielsen, K. (Eds.), Plankton Stratigraphy. Cambridge University Press, Cambridge,pp. 17–86.
Casey, R.E., 1993. Radiolaria. In: Lipps, J.H. (Ed.), Fossil Prokaryotes and Protists. BlackwellScientific Publications, Oxford, pp. 249–284.
Casey, R.E., Spaw, J.M., Kunze, F., Reynolds, R., Duis, T., McMillen, K., Pratt, D., Anderson, V.,1979a. Radiolarian ecology and the development of the radiolarian component inHolocene sediments, Gulf of Mexico and adjacent seas with potential paleontologicalapplications. Trans. Gulf Coast Assoc. Geol. Soc. 29, 228–237.
Casey, R.E., Gust, L., Leavesley, A., Williams, D., Reynolds, R., Duis, T., Spaw, J.M., 1979b.Ecological niches of radiolarians, planktonic foraminiferans and pteropods inferredfrom studies on living forms in the Gulf of Mexico and adjacent waters. Transactionsof the Gulf Coast Association of Geological Societies, 29, pp. 216–223.
Castro, J.M., de Gea, G.A., Ruiz-Ortiz, P.A., Nieto, L.M., 2008. Development of carbonateplatforms on an extensional (rifted) margin. The Valanginian–Albian record of thePrebetic of Alicante (SE Spain). Cretac. Res. 29, 848–860.
Castro, J.M., de Gea, G.A., Ruiz-Ortiz, P.A., Quijano, M.L., Pancost, R.D., Jiménez de Cisneros,C., Caballero, E., 2012. Stratigraphy and geochemistry of an Early Aptian carbonateplatform: interactions between relative sea level and environmental changes(Prebetic Zone, Spain). Geophys. Res. Abstr. 14 (EGU2012–6217–1).
Caulet, J.P., Venec-Peyre, M.-T., Vergnaud-Grazzini, C., Nigrini, C., 1992. Variation of SouthSomalian upwelling during the last 160 ka: radiolarian and foraminifera records incore MD 85674. In: Summerhayes, C.P., Prell, W.L., Emeis, K.C. (Eds.), Upwelling Sys-tems: Evolution Since the Early Miocene. Geological Society of London, special Publi-cation, London, pp. 379–389.
Coccioni, R., Luciani, V., 2004. Planktonic foraminifera and environmental changes acrossthe Bonarelli Event (OAE2, latest Cenomanian) in its type area: a high resolution
219R. Aguado et al. / Palaeogeography, Palaeoclimatology, Palaeoecology 395 (2014) 198–221
study from the Tethyan reference Bottaccione section (Gubbio, central Italy).J. Foraminifer. Res. 34, 109–129.
Coccioni, R., Premoli Silva, I., 1994. Planktonic foraminifera from the Lower Cretaceous ofRio Argos sections (southern Spain) and biostratigraphic implications. Cretac. Res. 15,645–687.
Coccioni, A., Nesci, O., Tramontana, M., Wezel, C.F., Moretti, E., 1987. Descrizione di unlivello-guida “Radiolaritico-bituminoso ittiolitico” alla base delle Marne a Fucoidinell'Appennino umbro-marchigiano. Boll. Soc. Geol. Ital. 106, 183–192.
Coccioni, R., Erba, E., Premoli Silva, I., 1992. Barremian–Aptian calcareous plankton bio-stratigraphy from the Gorgo a Cerbara (Marche, central Italy) and implications forplankton evolution. Cretac. Res. 13, 517–537.
Coccioni, R., Marsili, A., Venturati, A., 2004. Chamber elongation in Early Cretaceous plank-tonic foraminifera: a case study from the Lower Hauterivian–Lower Aptian Río Argossucession (southern Spain). In: Coccioni, R., Galeotti, S., Lirer, F. (Eds.), Proceedings ofthe First Italian Meeting on Environmental Micropaleontology. Grzybowbski Founda-tion, Urbino, Italy, pp. 37–47.
Coccioni, R., Luciani, V., Marsili, A., 2006. Cretaceous oceanic anoxic events and radially elon-gated chambered planktonic foraminifera: paleoecological and paleoceanographic im-plications. Palaeogeogr. Palaeoclimatol. Palaeoecol. 235, 66–92.
Coccioni, R., Premoli Silva, I., Marsili, A., Verga, D., 2007. First radiation of Cretaceousplanktonic foraminifera with radially elongate chambers at Angles (SoutheasternFrance) and biostratigraphic implications. Rev. Micropaleontol. 50, 215–224.
de Gea, G.A., 2004. Bioestratigrafía y eventos del Cretácico Inferior en las Zonas Externasde la Cordillera Bética. Ph.D. Thesis Servicio de Publicaciones de la Universidad deJaén, Jaén (658 pp.).
de Gea, G.A., Aguado, R., Castro, J.M., Molina, J.M., O'Dogherty, L., Ruiz Ortiz, P.A., 2008.Lower Aptian Subbetic organic-rich facies, radiolarites and associated deposits: thelocal expression of Oceanic Anoxic Event 1a (Carbonero Formation, southernSpain). Cretac. Res. 29, 861–870.
de Gea, G.A., Aguado, R., Castro, J.M., Quijano, M.L., Pancost, R.D., 2012. Bioestratigrafía ygeoquímica de alta resolución del Evento Anóxico Oceánico del Aptiense inferior(OAE1a) en el Subbético de Jaén: sección de La Frontera. Geotemas 13, 69.
Didyk, B.M., Simoneit, B.R.T., Brassell, S.C., Eglinton, G., 1978. Organic geochemical indica-tors of palaeoenvironmental conditions of sedimentation. Nature 272, 216–222.http://dx.doi.org/10.1038/272216a0.
Diester-Haass, L., 1977. Radiolarian/planktonic foraminiferal ratios in a coastal upwellingregion. J. Foraminifer. Res. 7, 26–33.
Diester-Haass, L., 1978. Sediments as indicators of upwelling. In: Bole, R., Tomczak, M.(Eds.), Upwelling Ecosystems. Springer, Berlin, pp. 261–281.
Diester-Haass, L., Meyers, P.A., Rothe, P., 1986. Light–dark cycles in opal-rich sedimentsnear the Plio-Pleistocene boundary, DSDP Site 532, Walvis Ridge continental terrace.Mar. Geol. 73, 1–23.
Duchamp-Alphonse, S., Gardin, S., Fiet, N., Bartolini, A., Blamart, D., Pagel, M., 2007. Fertil-ization of the northwestern Tethys (Vocontian basin, SE France) during Valanginiancarbon isotope perturbation: evidence from calcareous nannofossils and trace ele-ment data. Palaeogeogr. Palaeoclimatol. Palaeoecol. 243, 132–151.
Empson-Morin, K.M., 1984. Depth and latitude distribution of Radiolaria in Campa-nian (Late Cretaceous) tropical and subtropical oceans. Micropaleontology 30,87–115.
Erba, E., 1994. Nannofossils and superplumes: the Early Aptian “nannoconid crisis”.Paleoceanography 9, 483–501.
Erba, E., 2004. Calcareous nannofossils and Mesozoic oceanic anoxic events. Mar.Micropaleontol. 52, 85–106.
Erba, E., Castradori, D., Guasti, G., Ripepe, M., 1992. Calcareous nannofossils andMilankovitch cycles: the example of the Albian Gault Clay Formation (southernEngland). Palaeogeogr. Palaeoclimatol. Palaeoecol. 93, 47–69.
Erba, E., Bartolini, A., Larson, R.L., 2004. Valanginian Weissert oceanic anoxic event. Geol-ogy 32, 149–152.
Erba, E., Bottini, C., Weissert, H.J., Keller, C.E., 2010. Calcareous nannoplankton re-sponse to surface-water acidification around Oceanic Anoxic Event 1a. Science329, 428–432.
Erba, E., Bottini, C., Weissert, H., Keller, C.E., 2011. Response to comment on “CalcareousNannoplankton Response to Surface-Water Acidification Around Oceanic AnoxicEvent 1a”. Science 332, 175-c.
Erbacher, J., Huber, B.T., Norris, R.D., Markey, M., 2001. Increased thermohaline stratifica-tion as a possible cause for an ocean anoxic event in the Cretaceous Period. Nature409, 325–327.
Föllmi, K.B., 2012. Early Cretaceous life, climate and anoxia. Cretac. Res. 35, 230–257.Geisen, M., Bollmann, J., Herrle, J.O., Mutterlose, J., Young, J.R., 1999. Calibration of the ran-
dom settling technique for calculation of absolute abundances of calcareous nanno-plankton. Micropaleontology 45, 437–442.
Godet, A., Bodin, S., Adatte, T., Föllmi, K.B., 2008. Platform-induced clay-mineral fraction-ation along a northern Tethyan basin-platform transect: implications for the interpre-tation of Early Cretaceous climate change (Late Hauterivian-Early Aptian). Cretac.Res. 29, 830–847.
Gorican, S., Smuc, A., Baumgartner, P.O., 2003. Toarcian Radiolaria from Mt. Mangart(Slovenian–Italian border) and their paleoecological implications. Mar. Micropaleontol.49, 275–301.
Graziano, R., 2013. Sedimentology, biostratigraphy and event stratigraphy of theEarly Aptian Oceanic Anoxic Event (OAE1A) in the Apulia Carbonate PlatformMargin–Ionian Basin System (Gargano Promontory, southern Italy). Cretac.Res. 39, 78–111.
Hammer, Ø., Harper, D.A.T., Ryan, P.D., 2001. PAST: Paleontological Statistics softwarepackage for education and data analysis. Palaeontol. Electron. 4, 9.
Haq, B.U., Hardenbol, J., Vail, P.R., 1987. Chronology of fluctuating sea levels since the Tri-assic. Science 235, 1156–1167.
Heimhofer, U., Adatte, T., Hochuli, P.A., Burla, S., Weissert, H., 2008. Coastal sedimentsfrom the Algarve: low-latitude climate archive for the Aptian–Albian. Int. J. EarthSci. (Geol. Rundsch.) 97, 785–797.
Herrle, J.O., 2003. Reconstructing nutricline dynamics of mid-Cretaceous oceans: evidencefrom calcareous nannofossils from the Niveau Paquier black shale (SE France). Mar.Micropaleontol. 47, 307–321.
Herrle, J.O., Mutterlose, J., 2003. Calcareous nannofossils from the Aptian–Lower Albian ofsoutheast France: palaeoecological and biostratigraphic implications. Cretac. Res. 24,1–22.
Herrle, J.O., Pross, J., Friedrich, O., Kößler, P., Hemleben, C., 2003. Forcing mechanisms formid-Cretaceous black shale formation: evidence from the Upper Aptian and LowerAlbian of the Vocontian Basin (SE France). Palaeogeogr. Palaeoclimatol. Palaeoecol.190, 399–426.
Herrle, J.O., Kößler, P., Bollmann, J., 2010. Palaeoceanographic differences of early LateAptian black shale events in the Vocontian Basin (SE France). Palaeogeogr.Palaeoclimatol. Palaeoecol. 297, 367–376.
Huber, B.T., Hodell, D.A., Hamilton, C.P., 1995. Middle–Late Cretaceous climate of thesouthern high latitudes: stable isotopic evidence for minimal equator-to-pole ther-mal gradients. Geol. Soc. Am. Bull. 107, 1164–1191.
Jahren, A.H., Conrad, C.P., Crystal Arens, N., Mora, G., Lithgow-Bertelloni, C., 2005. A platetectonicmechanism formethane hydrate release along subduction zones. Earth Plan-et. Sci. Lett. 236, 691–704.
Jenkyns, H.C., 1980. Cretaceous anoxic events: from continents to oceans. J. Geol. Soc.Lond. 137, 171–188.
Jenkyns, H.C., 2010. Geochemistry of oceanic anoxic events. Geochem. Geophys. Geosyst.11, Q03004. http://dx.doi.org/10.1029/2009GC002788.
Jud, R., 1994. Biochronology and systematics of Early Cretaceous Radiolarian of theWest-ern Tethys. Mém. Géol. (Lausanne) 19, 1–147.
Keller, G., Abramovich, S., 2009. Lilliput effect in LateMaastrichtian planktic foraminifera: re-sponse to environmental stress. Palaeogeogr. Palaeoclimatol. Palaeoecol. 284, 47–62.
Kennedy, W.J., Gale, A.S., Bown, P.R., Caron, M., Davey, R.J., Gröcke, D.R., Wray, D.S., 2000.Integrated stratigraphy across the Aptian–Albian boundary in the Marnes Bleues, atthe Col de Pré-Guittard, Arnayon (Drôme), and at Tartonne (Alpes-de-Haute-Provence), France: a candidate Global Boundary Stratotype Section and BoundaryPoint for the base of the Albian Stage. Cretac. Res. 21, 591–720.
Kessels, K., Mutterlose, J., Ruffell, A., 2003. Calcareous nannofossils from Late Jurassic sed-iments of the Volga Basin (Russian Platform): evidence for productivity-controlledblack shale deposition. Int. J. Earth Sci. (Geol. Rundsch.) 92, 743–757.
Kiessling, W., 1996. Facies characterisation of Mid-Mesozoic deep-water sediments byquantitative analysis of siliceous microfaunas. Facies 35, 237–274.
Kuhnt, W., Thurow, J., Wiedman, J., Herbin, J.P., 1986. Oceanic anoxic conditions aroundthe Cenomanian/Turonian boundary and the response of the biota. SCOPE/UNEPSonderband, 60. Mitteilungen der Geologisches und Paläontologisches InstitutUniversität Hamburg 205–246.
Larson, R.L., 1991. Latest pulse of the Earth: evidence for a mid-Cretaceous super plume.Geology 19, 547–550.
Larson, R.L., Erba, E., 1999. Onset of the mid-Cretaceous greenhouse in the Barremian–Aptian: igneous events and the biological, sedimentary and geochemical responses.Paleoceanography 14, 663–678.
Leckie, R.M., Bralower, T.J., Cashman, R., 2002. Oceanic anoxic events and plankton evolution:biotic response to tectonic forcing during the mid-Cretaceous. Paleoceanography 17.http://dx.doi.org/10.1029/2001PA000623.
Lees, J.A., Bown, P.R., Mattioli, E., 2005. Problems with proxies? Cautionary tales of calcar-eous nannofossil paleoenvironmental indicators. Micropaleontology 51, 333–343.
Lees, J.A., Bown, P.R., Young, J.R., 2006. Photic zone palaeoenvironments of the KimmeridgeClay Formation (Upper Jurassic, UK) suggested by calcareous nannoplanktonpalaeoecology. Palaeogeogr. Palaeoclimatol. Palaeoecol. 235, 110–134.
Longoria, J.F., 1974. Stratigraphic, morphologic and taxonomic studies of Aptian plankton-ic foraminifera. Rev. Esp. Micropaleontol. 1–150 (Número Extraordinario).
MacLeod, N., Ortiz, N., Fefferman, N., Clyde, W., Schulter, C., MacLean, J., 2000. Phenotypicresponse of foraminifera to episodes of global environmental change. In: Culver, S.J.,Rawson, P. (Eds.), Biotic Response to Global Environmental Change: The Last 145 -
Million Years. Cambridge University Press, Cambridge, pp. 51–78.Magniez-Jannin, F., 1998. L'élongation des loges chez les foraminiféres planctoniques du
Crétacé Inférieur: une adaptation á la sous-oxygénation des eaux? C. R. Acad. Sci.Paris Sci. Terre Planètes 326, 207–213.
Malmgren, B.A., Haq, B.U., 1982. Assesment of quantitative techniques in paleobiogeography.Mar. Micropaleontol. 7, 213–236.
Masse, J.P., Bellion, Y., Benkhelil, J., Boulin, J., Cornee, J.J., Dercourt, J., Guiraud, R., Mascle,G., Poisson, A., Ricou, L.E., Sandulescu, M., 1993. Lower Aptian palaeoenvironments114–112 Ma. In: Dercourt, J., et al. (Eds.), Atlas Tethys Palaeoenvironmental Maps.Maps Beceip-Franlab, Rueil-Malmaison.
Méhay, S., Keller, C.E., Bernasconi, S.M., Weissert, H., Erba, E., Bottini, C., Hochuli, P.A.,2009. A volcanic CO2 pulse triggered the Cretaceous Oceanic Anoxic Event 1a and abiocalcification crisis. Geology 37, 819–822.
Menegatti, A.P., Weissert, H., Brown, R.S., Tyson, R.V., Farrimond, P., Strasser, A., Caron, M.,1998. High-resolution δ13C stratigraphy through the Early Aptian “Livello Selli” of theAlpine Tethys. Paleoceanography 13, 530–545.
Meyers, P.A., 1997. Organic geochemical proxies of paleoceanographic, paleolimnologic,and paleoclimatic processes. Org. Geochem. 27, 213–250.
Moullade, M., 1966. Étude stratigraphique et micropaléontologique du CrétacéInfériur de la “FosseVocontienne”. Documents des Laboratoires de Géologie deLyon, 15 1–369.
Moullade, M., Bellier, J.P., Tronchetti, G., 2002. Hierarchy of criteria, evolutionary process-es and taxonomic simplification in the classification of Lower Cretaceous planktonicforaminifera. Cretac. Res. 23, 111–148.

220 R. Aguado et al. / Palaeogeography, Palaeoclimatology, Palaeoecology 395 (2014) 198–221
Musavu-Moussavou, B., Danelian, T., Baudin, F., Coccioni, R., Frohlich, F., 2007. The Radio-larian biotic response during OAE2. A high-resolution study across the Bonarelli levelat Bottaccione (Gubbio, Italy). Rev. Micropaleontol. 50, 253–287.
Mutterlose, J., 1987. Calcareous nannofossils and belemnites as warmwater indicatorsfrom the NW-German Middle Aptian. Geol. Jahrb. A96, 293–313.
Mutterlose, J., 1989. Temperature-controlled migration of calcareous nannofloras in thenorth-west European Aptian. In: Crux, J.A., Heck, S.E.V. (Eds.), Nannofossils andtheir applications. Ellis Horwood Ltd., Chichester, pp. 122–142.
Mutterlose, J., 1991. Das Verteilungs- undMigrationsmuster des kalkigen Nannoplanktons inder borealen Unter-Kreide (Valangin-Apt) NW-Deutschlands. Palaeontographica B221,27–152.
Mutterlose, J., 1992. Lower Cretaceous nannofossil biostratigraphy off northwesternAustralia (Leg 123). In: Gradstein, F.M., Ludden, J.N., et al. (Eds.), Proceedingsof the Ocean Drilling Program Scientific Results, College Station, Texas,pp. 343–368.
Mutterlose, J., Bottini, C., 2013. Early Cretaceous chalks from the North Sea givingevidence for global change. Nat. Commun. 4, 1686. http://dx.doi.org/10.1038/ncomms2698.
Mutterlose, J., Kessels, K., 2000. Early Cretaceous calcareous nannofossils from highlatitudes: implications for palaeobiogeography and palaeoclimate. Palaeogeogr.Palaeoclimatol. Palaeoecol. 160, 347–372.
Mutterlose, J., Wise Jr., S.W., 1990. Lower Cretaceous calcareous nannofossil biostra-tigraphy of ODP Leg 113 holes 692B and 693A, continental slope off EastAntarctica, Weddell Sea. In: Barker, P.F., Kennett, J.P., et al. (Eds.), Proceedingsof the Ocean Drilling Program Scientific Results, College Station, Texas,pp. 325–351.
Mutterlose, J., Bornemann, A., Herrle, J.O., 2005. Mesozoic calcareous nannofossils — stateof the art. Paläontol. Z. 79, 113–133.
O'Dogherty, L., 1994. Biochronology and paleontology of mid-Cretaceous radiolariansfrom Northern Apennines (Italy) and Betic Cordillera (Spain). Mém. Géol. (Lausanne)21, 1–415.
O'Dogherty, L., Martínez-Gallego, J., 1990. Radiolarios del Cretácico Inferior (Barremense–Albense) en el sector de Campillo de Arenas (Subbético Medio). Acta Salmanticensia68, 263–275.
O'Dogherty, L., Carter, E.S., Dumitrica, P., Goričan, Š., De Wever, P., Bandini, A.N.,Baumgartner, P.O., Matsuoka, A., 2009. Catalogue of Mesozoic radiolarian genera;Part 2, Jurassic–Cretaceous. Geodiversitas 31 (2), 271–356.
Pancost, R.D., Crawford, N., Magness, S., Turner, A., Jenkyns, H.C., Maxwell, J.R., 2004.Further evidence for the development of photic-zone euxinic conditions duringMesozoic oceanic anoxic events. J. Geol. Soc. Lond. 161, 353–364.
Pauly, S., Mutterlose, J., Alsen, P., 2012. Early Cretaceous palaeoceanography of the Greenland–Norwegian Seaway evidenced by calcareous nannofossils. Mar. Micropaleontol. 90–91,72–85.
Perch-Nielsen, K., 1985. Mesozoic calcareous nannofossils. In: Bolli, H.M., Saunders, J.B.,Perch-Nielsen, K. (Eds.), Plankton stratigraphy. Cambridge University Press,Cambridge, pp. 329–426.
Peters, K., Walters, C.C., Moldowan, J., 2005. The Biomarker Guide, 2nd ed. Cambridge Uni-versity Press, Cambridge, U.K.
Powell, T.G., McKirdy, D.M., 1973. Relationship between ratio of pristane to phytane,crude oil composition and geological environment in Australia. Nature 243,37–39.
Premoli Silva, I., Erba, E., Tornaghi, M.E., 1989. Paleonvironmental signals and changes insurface fertility inmid Cretaceous Corg-rich pelagic facies of the fucoid marls (centralItaly). Geobios 22, 225–236.
Premoli Silva, I., Erba, E., Salvini, G., Locatelli, C., Verga, D., 1999. Biotic changes in Creta-ceous oceanic anoxic events of the Tethys. J. Foraminifer. Res. 29, 352–370.
Quijano, M.L., Castro, J.M., Pancost, R.D., de Gea, G.A., Najarro, M., Aguado, R., Rosales, I.,Martín-Chivelet, J., 2012. Organic geochemistry, stable isotopes, and facies analysisof the Early Aptian OAE — new records from Spain (Western Tethys). Palaeogeogr.Palaeoclimatol. Palaeoecol. 365–366, 276–293.
Rontani, J.-F., Volkman, J.K., 2003. Phytol degradation products as biogeochemical tracersin aquatic environments. Org. Geochem. 34, 1–35. http://dx.doi.org/10.1016/S0146-6380(02)00185-7.
Roth, P.H., 1973. Calcareous nannofossils— Leg 17, Deep Sea Drilling Project. In: Winterer,E.L., Ewing, J.L., et al. (Eds.), Initial Reports of the Deep Sea Drilling Project. U. S. Gov-ernment Printing Office, Washington, pp. 695–795.
Roth, P.H., 1978. Cretaceous nannoplankton biostratigraphy and oceanography of the north-western Atlantic ocean. In: Benson,W.E., Sheridan, R.E., et al. (Eds.), Initial Reports of theDeep Sea Drilling Project. U. S. Government Printing Office, Washington, pp. 731–759.
Roth, P.H., 1983. Jurassic and Lower Cretaceous calcareous nannofossils in the westernnorth Atlantic (Site 534): biostratigraphy, preservation, and some observations onbiogeography and paleoceanography. In: Sheridan, R.E., Gradstein, F.M., et al. (Eds.),Initial Reports of the Deep Sea Drilling Project. U. S. Government Printing Office,Washington, pp. 587–621.
Roth, P.H., 1994. Distribution of coccoliths in oceanic sediments. In: Winter, A.,Siesser, W.G. (Eds.), Coccolithophores. Cambridge University Press, Cambridge,pp. 199–218.
Roth, P.H., Bowdler, J.L., 1981. Middle Cretaceous nannoplankton biogeography of theAtlantic ocean. SEPM Spec. Publ. 32, 517–546.
Roth, P.H., Krumbach, K.R., 1986. Middle Cretaceous calcareous nannofossil biogeographyand preservation in the Atlantic and Indian oceans: implications for paleoceanography.Mar. Micropaleontol. 10, 235–266.
Roth, P.H., Thierstein, H.R., 1972. Calcareous nannoplankton: Leg 14 of the Deep SeaDrilling Project. In: Hayes, D.E., Pimm, A.C., et al. (Eds.), Initial Reports of theDeep Sea Drilling Project. U. S. Government Printing Office, Washington,pp. 421–485.
Ruffell, A., Worden, R., 2000. Paleoclimate analysis using spectral gamma-ray data fromthe Aptian (Cretaceous) of southern England and southern France. Palaeogeogr.Palaeoclimatol. Palaeoecol. 155, 265–283.
Ruiz-Ortiz, P.A., Castro, J.M., 1998. Carbonate depositional sequences in shallow to pelagicplatform deposits. Aptian. Prebetic of Alicante (SE Spain). Bull. Soc. Geol. Fr. 169, 21–33.
Scalan, R.S., Smith, J.E., 1970. An improved measure of the odd-even predominance in thenormal alkanes of sediment extracts and petroleum. Geochim. Cosmochim. Acta 34,611–620.
Schlanger, S.O., Jenkyns, H.C., 1976. Cretaceous oceanic anoxic events: causes and conse-quences. Geol. Mijnb. 55, 179–184.
Schwark, L., Empt, P., 2006. Sterane biomarkers as indicators of palaeozoic algal evolutionand extinction events. Palaeogeogr. Palaeoclimatol. Palaeoecol. 240 (1–2), 225–236.http://dx.doi.org/10.1016/j.palaeo.2006.03.050.
Seifert, W.K., Moldowan, J.M., 1986. Use of biological markers in petroleum exploration.In: Johns, R.B. (Ed.), Methods in Geochemistry and Geophysics, vol. 24. Elsevier,Amsterdam, pp. 261–290.
Shannon, C.E., Weaver, W., 1949. TheMathematical Theory of Communication. Universityof Illinois Press, Urbana, Illinois (125 pp.).
Skelton, P.W. (Ed.), 2003. The CretaceousWorld. The Open University, Milton Keynes, andCambridge University Press, Cambridge (360 pp.).
Stein, M., Föllmi, K.B., Westermann, S., Godet, A., Adatte, T., Matera, V., Fleitmann, D.,Berner, Z., 2011. Progressive palaeoenvironmental change during the LateBarremian–Early Aptian as prelude to Oceanic Anoxic Event 1a: evidence from theGorgo a Cerbara section (Umbria – Marche basin, central Italy). Palaeogeogr.Palaeoclimatol. Palaeoecol. 302, 396–406.
Stein, M., Westermann, S., Adatte, T., Matera, V., Fleitmann, D., Spangenberg, J., Föllmi,K.B., 2012. Late Barremian–Early Aptian palaeoenvironmental change: the Cassis-LaBédoule section, southeast France. Cretac. Res. 37, 209–222.
Street, C., Bown, P.R., 2000. Palaeobiogeography of Early Cretaceous (Berriasian–Barremian) calcareous nannoplankton. Mar. Micropaleontol. 39, 265–291.
Tejada, M.L., Suzuki, K., Kuroda, J., Coccioni, R., Mahoney, J.J., Ohkouchi, N., Sakamoto, N.,Tatsumi, Y., 2009. Ontong Java Plateau eruption as a trigger for the early Aptianoceanic anoxic event. Geology 37, 855–858. http://dx.doi.org/10.1130/G25763A.
Ten Haven, H.L., de Leeuw, J.W., Rullköter, J., Sinninghe Damsté, J.S., 1987. Restricted util-ity of the pristane/phytane ratio as a palaeoenvironmental indicator. Nature 330,641–643.
Thierstein, H.R., 1976. Mesozoic calcareous nannoplankton biostratigraphy of marine sed-iments. Mar. Micropaleontol. 1, 325–362.
Thierstein, H.R., 1980. Selective dissolution of Late Cretaceous and earliest Tertiary calcar-eous nannofossils: experimental evidence. Cretac. Res. 2, 165–176.
Thierstein, H.R., 1981. Late Cretaceous nannoplankton and the change at the Cretaceous –Tertiary boundary. SEPM Spec. Publ. 32, 355–394.
Thierstein, H.R., Roth, P.H., 1991. Stable isotopic and carbonate cyclicity in Lower Creta-ceous deep-sea sediments: dominance of diagenetic effects. Mar. Geol. 97, 1–34.
Tiraboschi, D., Erba, E., Jenkyns, H.C., 2009. Origin of rhythmic Albian black shales(Piobbico core, central Italy): calcareous nannofossil quantitative and statisticalanalyses and paleoceanographic reconstructions. Paleoceanography 24, 1–21.
Tremolada, F., Erba, E., 2002. Morphometric analyses of Aptian Assipetra infracretacea andRucinolithus terebrodentarius nannoliths: implications for taxonomy, biostratigraphyand palaeoceanography. Mar. Micropaleontol. 44, 77–92.
Tremolada, F., Erba, E., Bralower, T.J., 2006. Late Barremian to Early Aptian calcareousnannofossil paleoceanography and paleoecology from the Ocean Drilling ProgramHole 641C (Galicia Margin). Cretac. Res. 27, 887–897.
van Breugel, Y., Schouten, S., Tsikos, H., Erba, E., Price, G.D., Sinninghe Damsté, J.S., 2007.Synchronous negative carbon isotope shifts in marine and terrestrial biomarkers atthe onset of the early Aptian oceanic anoxic event 1a: evidence for the release of13C-depleted carbon into the atmosphere. Paleoceanography 22, PA1210. http://dx.doi.org/10.1029/2006pa001341.
Vera, J.A., 2004. Cordillera Bética y Baleares. In: Vera, J.A. (Ed.), Geología de España.Sociedad Geológica de España e Instituto Geológico y Minero de España, Madrid,pp. 345–464.
Verga, D., 2004. The first evolutionary radiation of planktonic foraminifera in theValanginian–Aptian interval: taxonomical, biostratigraphical and paleoecologicalimplications. PhD Thesis, University of Milano, Italy (unpublished).
Verga, D., Premoli Silva, I., 2002. Early Cretaceous planktonic foraminifera from theTethys: the genus Leupoldina. Cretac. Res. 23, 189–212.
Verga, D., Premoli Silva, I., 2003a. Early Cretaceous planktonic foraminifera from theTethys, the small, few-chambered representatives of the genus Globigerinelloides.Cretac. Res. 24, 305–334.
Verga, D., Premoli Silva, I., 2003b. Early Cretaceous planktonic foraminifera from theTethys. The large, many-chambered representatives of the genus Globigerinelloides.Cretac. Res. 24, 661–690.
Verga, D., Premoli Silva, I., 2005. Early Cretaceous planktonic foraminifera from theTethys: the Upper Aptian, planispiral morphotypes with elongate chambers. Cretac.Res. 26, 239–259.
Vilas, L., Masse, J.P., Arias, C., 1993. Aptian mixed terrigenous and carbonate platformsfrom Iberic and Prebetic Regions, Spain. In: Simo, J.A.T., Scott, R.W., Masse, J.P.(Eds.), Cretaceous Carbonate Platforms. AAPG Mem, 56, pp. 243–253.
Vilas, L., Martín-Chivelet, J., Arias, C., 2003. Integration of subsidence and sequence strat-igraphic analyses in the Cretaceous carbonate platforms of the Prebetic (Jumilla–Yecla Region), Spain. Palaeogeogr. Palaeoclimatol. Palaeoecol. 200, 107–129.
Weissert, H., Erba, E., 2004. Volcanism, CO2 and palaeoclimate: a Late Jurassic–EarlyCretaceous carbon and oxygen isotope record. J. Geol. Soc. Lond. 161, 1–8.
Weissert, H., Lini, A., Föllmi, K.B., Kuhn, O., 1998. Correlation of Early Cretaceous carbonisotope stratigraphy and platform drowning events: a possible link? Palaeogeogr.Palaeoclimatol. Palaeoecol. 137, 189–203.

221R. Aguado et al. / Palaeogeography, Palaeoclimatology, Palaeoecology 395 (2014) 198–221
Williams, J.R., Bralower, T.J., 1995. Nannofossil assemblages, fine fraction stable isotopes,and palaeoceanography of the Valanginian–Barremian (Early Cretaceous) North SeaBasin. Paleoceanography 10, 815–839.
Wilson, P.A., Norris, R.D., 2001. Warm tropical ocean surface and global anoxia during themid-Cretaceous period. Nature 412, 425–428.
Winter, A., Jordan, R.W., Roth, P.H., 1994. Biogeography of living coccolithophores, inocean waters. In: Winter, A., Siesser, W.G. (Eds.), Coccolithophores. Cambridge Uni-versity Press, Cambridge, UK, pp. 161–177.
Ziveri, P., Baumann, K.-H., Böckel, B., Bollmann, J., Young, J.R., 2004. Biogeography ofselected Holocene coccoliths in the Atlantic Ocean. In: Young, J.R., Thierstein, H.R.(Eds.), Coccolithophores — From Molecular Processes to Global Impact. Springer-Verlag, pp. 403–428.
Zügel, P., Riegraf,W., Schweigert, G., Dietl, G., 1998. Radiolaria from theNusplingen Lithograph-ic Limestone (Late Kimmeridgian, SW Germany). Stuttg. Beitr. Naturkunde B 268, 1–43.
Zumberge, J.E., 1987. Terpenoid biomarker distributions in low maturity crude oils. Org.Geochem. 11, 479–496. http://dx.doi.org/10.1016/0146-6380(87)90004-0.