Embed Size (px)
Citation preview
Office of Strategy and Data • 710 James Robertson Parkway • Nashville, TN 37243
Tel: 615-761-6623 • tn.gov/education
Last updated: Feb. 7, 2020

Page 2 of 70
Section 1: Document Intent and Overview ............................................................................................................................. 5
1.1 Overview of the Systems .............................................................................................................................................. 5
1.2 School and District Ratings ............................................................................................................................................ 6
Section 2: Data Types and Preparations ................................................................................................................................. 8
2.1 Data Types ..................................................................................................................................................................... 8
2.1.1 Types of Test Data .................................................................................................................................................. 8
2.1.2 Types of Non-Test Data .......................................................................................................................................... 9
2.2 Historically Underserved Student Groups .................................................................................................................. 10
2.2.1 Included Student Groups ..................................................................................................................................... 10
2.2.2 Super Subgroup .................................................................................................................................................... 11
2.3 Data Definitions .......................................................................................................................................................... 11
2.3.1 Enrolled, Tested, and Valid Tests Definitions ....................................................................................................... 11
2.3.2 Enrollment and Testing Scenarios ............................................................................................................................ 12
2.3.2.1 Assessment Enrollment and Testing Scenarios ................................................................................................. 12
2.4 Data Preparations ....................................................................................................................................................... 13
2.4.2 TCAP-Alternate Assessment Data Preparations .................................................................................................. 17
2.4.3 ACT and SAT Data Preparations ........................................................................................................................... 17
2.4.4 Ready Graduate Data Preparations ..................................................................................................................... 19
2.4.5 ELPA Data Preparations ....................................................................................................................................... 20
2.4.6 TVAAS Data Preparations ..................................................................................................................................... 21
2.4.7 Graduation Data Preparations ............................................................................................................................. 21
2.4.8 Attendance Data Preparations ............................................................................................................................. 21
2.4.9 School Directory Data Preparations ..................................................................................................................... 22
Section 3: Calculation Procedures ........................................................................................................................................ 23
3.1 Participation Rates ...................................................................................................................................................... 23
3.2 Performance Level Percentages.................................................................................................................................. 23
3.3 One-Year and Three-Year Success Rates .................................................................................................................... 24
3.4 Graduation Rates ........................................................................................................................................................ 25
3.5 Ready Graduate .......................................................................................................................................................... 25
3.6 Chronically Out of School ............................................................................................................................................ 25
3.7 Annual Measurable Objective (AMO) Targets ............................................................................................................ 26
3.8 Confidence Intervals (CIs) ........................................................................................................................................... 26
Page 3 of 70
3.9 Rounding Procedures .................................................................................................................................................. 27
Section 4: School Accountability ........................................................................................................................................... 28
4.1 Background and Designations ..................................................................................................................................... 28
4.2 School Pools and Eligibility .......................................................................................................................................... 28
4.3 Student Groups and Pathways .................................................................................................................................... 28
4.4 Indicators and Weighting ............................................................................................................................................ 30
4.4.1 Achievement ........................................................................................................................................................ 31
4.4.2 Growth ................................................................................................................................................................. 31
4.4.3 Chronically Out of School ..................................................................................................................................... 31
4.4.4 Graduation Rate ................................................................................................................................................... 32
4.4.5 Ready Graduate ................................................................................................................................................... 32
4.4.6 English Language Proficiency Assessment ........................................................................................................... 33
4.5 Priority School Identification....................................................................................................................................... 34
4.5.1 Priority Exit Criteria .............................................................................................................................................. 35
4.6 Focus School Identification ......................................................................................................................................... 36
4.6.1 Targeted Support and Improvement (TSI) ........................................................................................................... 36
4.6.2 Additional Targeted Support and Improvement (ATSI) ....................................................................................... 36
4.6.3 Focus Exit Criteria ................................................................................................................................................. 37
4.7 Reward School Identification ...................................................................................................................................... 37
Section 5: District Accountability .......................................................................................................................................... 38
5.1 Indicators and Designations ........................................................................................................................................ 38
5.2 Historically Underserved Student Groups and Minimum Required Counts ............................................................... 38
5.3 Indicators and Calculation Procedures ....................................................................................................................... 39
5.3.1 Calculation Procedures ............................................................................................................................................ 39
5.3.1.1 Step 1: All Students Status .................................................................................................................................... 40
5.3.1.2 Step 2: Student Group Average ........................................................................................................................... 40
5.3.1.3 Step 3: Student Group Status ............................................................................................................................... 41
5.3.1.4 Step 4: Final District Determination ..................................................................................................................... 41
5.3.2 Grade Band Success Rate Indicators .................................................................................................................... 42
5.3.2 Chronically Out of School Indicator ..................................................................................................................... 42
5.3.3 Graduation Rate Indicator ................................................................................................................................... 43
5.3.4 English Language Proficiency Assessment (ELPA) Indicator ................................................................................ 43
Section 6: Files Delivered to Districts .................................................................................................................................... 45

Page 4 of 70
6.1 Assessment Data Files ................................................................................................................................................. 46
6.2 Accountability Files ..................................................................................................................................................... 46
6.3 Final Determination Heat Map Files ........................................................................................................................... 46
6.4 Student-Level Achievement Files ................................................................................................................................ 47
6.5 English Language Proficiency Assessment Files .......................................................................................................... 47
6.6 TVAAS Files .................................................................................................................................................................. 47
6.7 Ready Graduate Files .................................................................................................................................................. 47
6.8 AMO Files .................................................................................................................................................................... 47
6.9 Chronically Out of School Files .................................................................................................................................... 47
Appendix A: List of Acronyms .............................................................................................................................................. 48
Appendix B: Data Sources .................................................................................................................................................... 49
Appendix C: Accountability Files Purpose and Structure ...................................................................................................... 51
Appendix D: Confidence Interval Calculations ...................................................................................................................... 54
Appendix E: Percentile Rank Calculations ............................................................................................................................. 55
Appendix F: Early Postsecondary Course Codes and Exams ................................................................................................. 56

Page 5 of 70
The 2020 Accountability Protocol is a technical guide that outlines how the Tennessee Department of Education (the
department) and State Board of Education will evaluate performance of Tennessee public schools and districts for
the 2019-20 school year. This document describes the systems, outlines the data types, and specifies the
procedures used in accountability determinations. Our goal is to provide a transparent and consistent framework
for making accountability determinations. We hope schools and districts will be empowered to use their data files to
target improvement for their students.
The department makes accountability determinations both at the school and district levels. The two frameworks
are outlined and described in the subsequent sections of this document. Please note, all accountability files and
procedures go through appeals processes. For details regarding the appeals timelines, requirements, and
outcomes, please reference appeals guidance via the Tennessee Department of Education website.
Please direct any questions to [email protected].
1.1 Overview of the Systems The Tennessee school and district accountability systems take into account multiple indicators reflecting both
student performance and improvement while evaluating both all students and historically underserved student
populations as required in the Every Student Succeeds Act (ESSA) and approved by the United Stated Department of
Education. The graphics below highlight the indicators for each system and their corresponding weights. Specific
definitions and business rules of these systems are outlined in subsequent sections of this document. School
accountability consists of the following1:
1 Please note, schools not meeting minimum number counts, will have indicator weights redistributed proportionally to the
Achievement and Growth indicators.

Page 6 of 70
Additionally, district accountability evaluates six indicators weighted equally2 and averaged together through multiple pathways. Details describing the calculation procedures and applied business rules can be found in section 5.
1.2 School and District Ratings Schools receive an overall A-F rating, as well as an A-F rating for each indicator. The rating labels for the 2019-20
school year are as follows:
Schools eligible for accountability will receive an A-D rating that represents their final average of each appropriately
weighted indicator and student group. Schools receiving a rating of F are schools that were identified as Priority
status in 2018 and have not met exit criteria in the prior or most recent year. Additionally, all schools meeting
2 Please note, districts that do not meet minimum number counts will not be evaluated for those specific indicators. Indicator
weights will be redistributed equally across all remaining indicators.

Page 7 of 70
number counts as described below, and having an instructional status other than Alternative, Adult or CTE are
eligible to receive accountability3. The following table outlines school grading options for 2019-20.
A-D Rating F Rating
Schools meet number counts (n=30; ELPA-
n=10)
Meet school type requirements (i.e., no
Alternative, Adult, or CTE school)
Eligible to be named Reward school =A
Eligible for federal designation of TSI and ATSI
Identified in 2018
Identified every three years
Only schools who have not exited Priority or
CSI status
Districts have the opportunity to be designated one of the following:
Exemplary
Advancing
Satisfactory
Marginal
In Need of Improvement
Districts identified as In Need of Improvement are those with a final score in the bottom five percent of districts
state wide, even if their accountability score qualifies them for another named designation. For more details
around district accountability, please see section 5.
Additionally, districts will be evaluated on the indicators for which they meet requirements. Therefore, each
indicator is equally weighted and calculation procedures reflect that of an average of indicators.
3 Please note, schools must have both current and prior year data to determine pathways. For more information regarding this,
see section 4.
Page 8 of 70
2.1 Data Types 2.1.1 Types of Test Data 2.1.1.1 Tennessee Comprehensive Assessment Program
The Tennessee Comprehensive Assessment Program (TCAP) is the umbrella program of state assessments required
for students in grades 3-8 and for those students enrolled in end-of-course (EOC) tested subjects. The TCAP
Alternative Assessment is designed for students in grades 3-11 with significant cognitive disabilities.
Students in grades 3-8 take the TCAP achievement tests each spring.
TCAP records in grades 3-8 with subjects of math and ELA are included in accountability calculations.
If a student takes both 3-8 achievement and EOC exams for the same subject, the 3-8 TCAP record is
dropped from accountability calculations and replaced with the EOC record. Please consult section 2.4.1 for
more detailed information on data preparations.
EOC testing records include students in grades 6-12 who test in any of the following subjects during either the fall or
spring test administration:
Algebra I
Algebra II
Geometry
Integrated Math I
Integrated Math II
Integrated Math III
English I
English II
Middle school students who take an EOC exam are included in the middle school counts that correspond to that
subject.
Middle school Algebra I, Algebra II, Geometry, Integrated Math I, Integrated Math II, and Integrated Math III
records count as Math for accountability calculations.4
Middle school English I and English II records count as ELA for accountability calculations.
2.1.1.2 TCAP-Alternate Assessment
The TCAP-Alternate Assessment is designed for students with significant cognitive disabilities and is based on
alternative content standards. A student’s participation in the alternative assessment is based on the decision of his
or her Individualized Education Plan (IEP) team and must be documented in the IEP.
Students in grades 3-12 who take the TCAP-Alternate Assessment are included in accountability calculations.
All students who take the TCAP-Alternative Assessment are considered students with disabilities (SWD).
TCAP-Alternate Assessment math records in grades 9 or above are included as Algebra I or Integrated Math
I records, depending on the district’s curriculum sequence (i.e., whether the district has more Algebra or
Integrated Math records).
TCAP-Alternate Assessment ELA records in grades 9 or above are included as English II records.
4 Success rates are defined as the total number of valid tests with a performance level of on track or mastered out of the total
number of valid tests for the subjects in a given grade band. Please consult section 3.3 for more information.
Page 9 of 70
2.1.1.3 The ACT and SAT
The ACT and SAT assess students’ cumulative knowledge from grades K-12. Students gain valuable information
about their preparation for postsecondary opportunities and the workforce by taking an assessment of career and
college readiness. This data is used in the Ready Graduate indicator.
For ACT and SAT composite scores, a student’s highest score from a single administration will be used.5 The
department does not use “super scores.”
Please note that ACT and SAT data lag by one year (i.e., 2020 accountability determinations use ACT or SAT data for
the graduating class of 2019).6 Please also note that SAT scores earned on national administrations will not
automatically be included in accountability unless the student has also taken the SAT on an in-school
administration. Scores for national administrations of the SAT and ACT that are not automatically included are
eligible for inclusion by appeal.7
2.1.1.4 English Language Proficiency Assessment
All English learners (EL) take the WIDA ACCESS 2.0 exam, which assesses student progress toward English
proficiency. Students with the most severe cognitive disabilities take the WIDA Alternate ACCESS.8
2.1.1.5 Early Postsecondary Examination Data
Early postsecondary examination data assess student performance on college-level coursework and/or career
readiness. The early postsecondary test data used in accountability lag by one year (i.e., 2020 accountability will
reflect data for students who graduated with their cohort in 2019).
2.1.2 Types of Non-Test Data 2.1.2.1 Absenteeism
Absenteeism data come from extract 049 in EIS. Students with primary enrollments in grades K-12 and attendance
codes of A, U, X, or T are considered absent for accountability purposes. Please consult the EIS Extract Layouts and
Appendix F of the EIS Appendices for more information regarding attendance codes. These data are pulled from EIS
at the completion of the school year.
2.1.2.2 Graduation Rates
Final graduation rate data come from the state’s graduation cohort application. Students count in the cohort based
on the first year in which they enrolled in grade 9. Students count as graduates if they are included in the cohort
and earn an on-time regular diploma.9 The data from the cohort application reflect EIS data with school and district
edits that the department approves. Please consult the 2020 Graduation Cohort Protocol for more information.
5 A student’s highest ACT composite score includes all records in the three years including and up to June of the student’s self-
reported graduation year. 6 For the subject replacement, as detailed in section 2.4.1.4, current year ACT or SAT testing data will be used from the state
testing day. 7 More information regarding ACT and SAT appeals guidance can be accessed through the Accountability application. 8 Currently the department does not include WIDA Alternative ACCESS data because of small numbers of students and the
resulting difficulty of computing expected growth. 9 The department considers graduates “on-time” if they earn regular diplomas within four years plus a summer after first
entering grade 9.

Page 10 of 70
Graduation data lag by one year (i.e., 2020 accountability will reflect data for the cohort of students who were
expected to graduate in 2019).
2.1.2.3 Early Postsecondary Enrollment Data
Early postsecondary course enrollment information comes from the course codes and flags submitted to EIS via
extract 030. AP, CIE, DE, and IB courses are all denoted with specific course codes. SDC courses must be indicated
with both the appropriate course code and course flag. LDC courses are denoted with the course flag only. Courses
marked with the LDC flag that have a course code that corresponds to another EPSO course type (e.g., an AP course
marked with the LDC flag) will be considered as the EPSO type that corresponds to the course code rather than the
LDC flag.
2.1.2.4 Industry Certification Data
Only industry certifications that are on the department’s promoted list as of students’ cohort graduation year are
considered for the Ready Graduate indicator. Students must obtain the industry certification (either by earning the
required exam score or by completing the licensure requirements) for the certification to count toward the Ready
Graduate indicator. Industry certifications that have expired will count toward students’ total number of EPSOs
completed10. Students who earn an industry certification that is on the department’s promoted list but is
subsequently removed from the list by their cohort graduation year may be appealed to have this information
included in their Ready Graduate status. Industry certifications may count for multiple EPSOs toward students’ Ready
Graduate status, including some industry certifications which satisfy the entire Ready Graduate criteria on their own.
Please consult the promoted list for more information.
2.2 Historically Underserved Student Groups 2.2.1 Included Student Groups All students are included in the all students group. Students are assigned11 to the following historically underserved
student groups12 as applicable:
Black, Hispanic, and Native American students (BHN)
English learners (EL)13
Economically disadvantaged students (ED)
Students with disabilities (SWD)14
The following progression is applied when students have multiple indicated races or ethnicities.
10 For more information regarding Industry Certification conversions to EPSOs, please access the Industry Certification
Conversion Table. 11 This document will use the terms “historically underserved student groups” and “student groups” interchangeably. 12 Students with a test record but no corresponding demographic information in EIS will count in the all students group but not
in any historically underserved student group. 13 The assessment data file includes separate groups for EL and EL with Transitional students. In the accountability file, the EL
subgroup includes transitional students. Transitional ELs comprise T1 through T4 students. 14 Students identified with a primary disability of Functionally Delayed or Gifted are not included in the SWD student group.
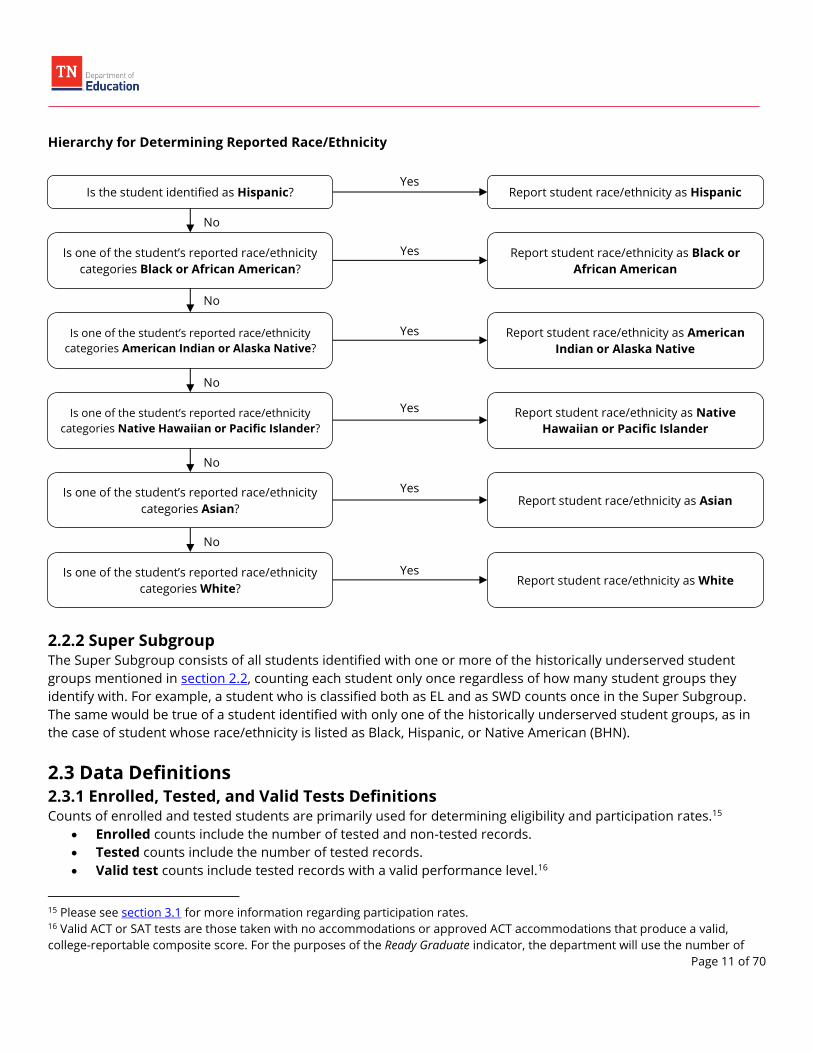
Hierarchy for Determining Reported Race/Ethnicity
Yes Is the student identified as Hispanic?
No
Is one of the student’s reported race/ethnicity
categories Black or African American?
No
Is one of the student’s reported race/ethnicity
categories American Indian or Alaska Native?
No
Is one of the student’s reported race/ethnicity
categories Native Hawaiian or Pacific Islander?
No
Is one of the student’s reported race/ethnicity
categories Asian?
No
Is one of the student’s reported race/ethnicity
categories White?
Report student race/ethnicity as Hispanic
Report student race/ethnicity as Black or
African American
Report student race/ethnicity as American
Indian or Alaska Native
Report student race/ethnicity as Native
Hawaiian or Pacific Islander
Report student race/ethnicity as Asian
Report student race/ethnicity as White
Yes
Yes
Yes
Yes
Yes
2.2.2 Super Subgroup The Super Subgroup consists of all students identified with one or more of the historically underserved student
groups mentioned in section 2.2, counting each student only once regardless of how many student groups they
identify with. For example, a student who is classified both as EL and as SWD counts once in the Super Subgroup.
The same would be true of a student identified with only one of the historically underserved student groups, as in
the case of student whose race/ethnicity is listed as Black, Hispanic, or Native American (BHN).
2.3 Data Definitions 2.3.1 Enrolled, Tested, and Valid Tests Definitions Counts of enrolled and tested students are primarily used for determining eligibility and participation rates.15
Enrolled counts include the number of tested and non-tested records.
Tested counts include the number of tested records.
Valid test counts include tested records with a valid performance level.16
15 Please see section 3.1 for more information regarding participation rates. 16 Valid ACT or SAT tests are those taken with no accommodations or approved ACT accommodations that produce a valid,
college-reportable composite score. For the purposes of the Ready Graduate indicator, the department will use the number of
Page 11 of 70
Page 12 of 70
Please note that all counts are calculated after excluded and duplicated records have been resolved. Please see
section 2.4.1.2 for more details.
Records that are marked as enrolled but not tested17 will count against participation rates. That is, these records
will be reflected in the data as follows:
For calculating the percent of students tested:
o The record will count in the numerator (number tested) as a 0, and
o The record will count in the denominator (number of enrolled students) as a 1.
For calculating the percent of students scoring on track or mastered:
o The record will not be included and will not change performance level calculations.
Records that are marked as enrolled and tested but do not have a performance level will be reflected in the data
as follows:
For calculating the percent of students tested:
o The record will count in the numerator (number tested) as a 1, and
o The record will count in the denominator (number of enrolled students) as a 1.
For calculating the percent of students scoring on track or mastered:
o The record will not be included and will not change performance level calculations.
2.3.2 Enrollment and Testing Scenarios 2.3.2.1 Assessment Enrollment and Testing Scenarios
Any student who is not enrolled in a school or district for at least 50 percent of the instructional days will not count
in success rate calculations but will count toward participation rates.18 The calculation for 50 percent enrollment is
measured by the number of days a student has attended out of the total number of instructional days. The total
number of days in the school year is pulled from EIS on the final day of the testing window. This pull applies to all
assessment data, including demographic data.19
Students who were enrolled less than 50 percent of the year in the school or district in which they tested and were
enrolled at least 50 percent in another Tennessee school or district will have their test score reassigned for success
rate calculations to the school and/or district in which they were enrolled for at least 50 percent of the year20. The
students included in the cohort to determine eligibility. The chronically out of school indicator will consider the number of
students enrolled for 50 percent of the year or more to determine eligibility. 17 Examples of when this situation might arise are detailed in the testing flag hierarchy in section 2.4.1.1. 18 Students who are enrolled for less than 50 percent of the year will count toward state-level accountability calculations and will
count for ACT/SAT and Ready Graduate performance depending on the cohort in which they appear. They will also be included in
TVAAS calculations if they meet the criteria described in the TVAAS technical manual. Please see section 2.4.6 for more
information. 19 Demographic data that are incorrect as of the end of the testing window will remain incorrect in the final accountability data.
Students whose demographic data differ across multiple school enrollments (e.g., a student is marked as homeless in one
school/district but not another, will take the demographic data of the enrollment that matches the school and district in which
they tested. 20 For instances where a student is enrolled exactly 50 percent in two schools or districts will be applied the following: Chronic
Absenteeism indicator will include the student in both schools and/or districts, where the Achievement indicator will include the
record in the school or district where the student tested.

Page 13 of 70
department will use attendance data to reassign scores in this instance.
The following table details how records are included in calculations for test participation rates and school-, district-,
and state-level accountability determinations.
Enrollment Scenario Testing Scenario
Counts in
Participation
Rate21
Counts in
School/District-
Level Performance
Counts in
State-Level
Performance
Student was not enrolled
for at least 50 percent of
the school year in any
school or district
Student was present and
tested Yes No Yes
Student was enrolled for
at least 50 percent of the
school year in a school
and/or district
Student was present and
tested in the same
school/district in which s/he
was enrolled for at least 50
percent of the year
Yes Yes Yes
Student was present and
tested in a different
school/district in which s/he
was enrolled for at least 50
percent of the year
Yes Yes22 Yes
2.4 Data Preparations The department prepares the raw data used for accountability as described below.
2.4.1.1 Testing Status and Reports of Irregularity (RI)
The department uses the test statuses (i.e., testing flags) below to exclude data from accountability calculations.
Please see section 2.4.1.2 for other general exclusions.
Test
Status Test Status Description Performance Level
Is the record
considered
enrolled?
Is the record
considered tested?
0 Not applicable (i.e., student
tested) As reported Yes Yes
1 Absent Null Yes No
2 Not enrolled Null No No
3 Not scheduled Null No No
21 A student who was present and tested will count for a district’s participation rate (that is, as a 1 in both the numerator and
denominator) whereas a student who was absent will count against a district’s participation rate (that is, as a 0 in the numerator
and a 1 in the denominator). 22 The student counts for the school and/or district in which s/he was enrolled at least half the year rather than the school and/or
district in which s/he tested.

Page 14 of 70
Test
Status Test Status Description Performance Level
Is the record
considered
enrolled?
Is the record
considered tested?
4 Medically exempt23 Null Yes Yes
5 Residential facility Null Yes Yes
6 Student tested on alternative
assessment
As reported in alternative
assessment testing file Yes
Based on data in the
alternate testing file
7 Student did not submit test Null Yes Yes
Any student not tested status other than 0 will override any Reports of Irregularity (RI) status that exists in terms of whether the record is considered enrolled and tested. The RI status codes are:
0: No RI status (i.e., student tested, received score, and is reported normally)
1: Adult potential breach of security
2: Student security breach
3: Irregular administration (e.g., wrong accommodations, calculator use)
4: Student tested incorrect grade or subject
5: Student did not participate (student refused to test)
6: Failed attemptedness
Records with an RI status other than 0 count as neither enrolled nor tested and will be invalidated and excluded
from all accountability calculations.24 Records with RI status codes of 0 are considered enrolled and tested.
2.4.1.2 Excluded, Missing, and Duplicated TCAP Data
Below are the department’s guidelines for excluding data from accountability calculations:
Records are considered homebound if they are flagged as both homeschooled and homebound.
Homebound records are excluded from school-level files. These records are included at the state and
district levels.
Homeschooled records (school number of 981) are excluded.
Juvenile Detention Center records (school number of 999) are excluded.
Individualized Education Account (IEA) records (with a school number of 982) are excluded.
Records with a district number greater than or equal to 990 (private or parochial testing records) are
excluded.
Records associated with adult high schools are excluded.25
Records associated with CTE schools are excluded, as the data should be remanded to the student’s base
school.
Records associated with alternative schools are excluded, as the data should be remanded to the student’s
sending school.
Records associated with a residential facility flag are excluded.
23 Districts must complete required medically exempt documentation. Per HIPPA, all information regarding medical exemptions
remains at the district level. The department excludes these records only for those students coded appropriately, as described in
section 2.4.1.1. 24 Note that all records tested will receive a raw score and score report from the testing vendor, but those records marked with
an RI code other than 0 will not be included in accountability calculations. 25 Please consult section 2.4.9 for more information on adult high schools.
Page 15 of 70
Records with grades of 13 are excluded.
Records with a subject of math are excluded if the student has other records with a valid performance level
and a subject of Algebra I, Algebra II, Geometry, Integrated Math I, Integrated Math II, or Integrated Math III.
Records with a subject of ELA are excluded if the student has other records with a valid performance level
and a subject of English I or English II.
Below are the department’s guidelines for handling missing data:
Records with missing race/ethnicity values are counted in the All Students group and not in any additional
historically underserved student group(s).
Records with missing school numbers are included in the district and state levels if the record has a valid
district number.26
Records with missing district numbers are included in the state level.27
Records with missing grades for EOC subjects will be included in both the assessment files and
accountability files.
Records with missing EL status count as not EL unless they appear in an English language proficiency
assessment file.
Records with missing special education status count as not SWD unless they appear in an alternative testing
file.
Records with missing economically disadvantaged status count as not ED.
Records with missing 50 percent enrollment status count as having been enrolled for at least 50 percent of
the year.
Below are the department’s guidelines for handling duplicate TCAP records:28
The hierarchy below indicates which testing record is included if a student has multiple testing records for
two different test types for the same subject area, both with non-missing performance levels.29
o TCAP-Alternate Assessment
o TCAP EOC
o TCAP Achievement30
For example, the English II TCAP-Alternate Assessment record is used when a student has
both a valid TCAP EOC record and a valid TCAP-Alternative Assessment record for English II,
assuming both records have non-missing performance levels.
Alternatively, the TCAP EOC record is used when a student has both a TCAP EOC record and
a TCAP-Alternate Assessment record if the performance level for the TCAP-Alternate
Assessment is missing and the performance level for the TCAP EOC is not missing.
26 If the school number is missing in the file (but the district number is valid), the department checks if the school name is also
missing. If the school name is not missing, the department associates the record with the appropriate school number depending
on the school name (and assuming there are not duplicate school names). 27 If the district number is missing, the department checks if the district name is also missing. 28 If a student has multiple records with discrepant demographic or test administration data (e.g., a student with two different
district numbers or who is marked as economically disadvantaged in one record but not another), the department uses the data
associated with the record that is kept according to the business rules for removing duplicate data. 29 If students have records for multiple test types, the first record from the hierarchy with a non-missing performance level is
included. 30 If students have two achievement records in the same content area in two different tested grades, the record with the absent
flag is dropped and the non-absent record is retained.

Page 16 of 70
The record with the highest performance level is included if there are multiple records for the same student,
original subject, and test type.
The record with the highest scale score is included if there are multiple records for the same student,
original subject, test type, and performance level.
The record with the most recent test date is included if there are multiple records for the same student,
original subject, test type, performance level, and scale score.
The record with a non-missing value for race/ethnicity is included if there are multiple records for the same
student, original subject, test type, performance level, scale score, and test date.
The record with a non-missing value for grade is included if there are multiple records for the same student,
original subject, test type, performance level, scale score, test date, and race/ethnicity.
If there are still duplicate records after the department applies the steps above, those duplicate records are
all included.
2.4.1.3 Modifying TCAP Student Group Data
The department modifies student group information and testing data only in the cases described below.
Students will be assigned to the Students with Disabilities (SWD) student group if they took the TCAP-
Alternate Assessment.31
Students will be assigned to the English Learner (EL) student group if they took the WIDA ACCESS
assessment.32
Recently arrived EL students who have been enrolled in a U.S. school for less than 731 days will be
considered tested, and their performance level will be modified to null for accountability files.
o Recently arrived EL students who have been enrolled in a U.S. school for less than 731 days will be
considered not tested for all subjects with missing performance levels.
o Recently arrived EL students who have been enrolled in a U.S. school for less than 731 days with
valid performance levels will be considered tested in those subjects but will have their performance
level modified to null in all subject areas for achievement indicator purposes.
The department modifies testing subjects and grades in situations where the grade is either missing or less than 9
according to the following table.
Original Subjects Original Grade Modified
Subject Modified Grade
Algebra I, Geometry, Algebra II, Integrated Math I,
Integrated Math II, Integrated Math III
Missing Do not modify 9-12
< grade 9 Math Do not modify
English I or English II Missing Do not modify 9-12
< grade 9 ELA Do not modify
2.4.1.4 Modifying TCAP Performance Levels
The department modifies performance levels in the following instances.
Modify the performance level to null if the test record has a testing status other than 0.
31 Students with records on the TCAP-Alternate Assessment who are not initially included as SWD in other data files will be
changed and included as SWD. 32 Students with records on the WIDA ACCESS assessment who are not initially included as EL in other data files will be changed
and included as EL.
Page 17 of 70
Modify the performance level to null if the record is marked as absent. The record will count as not tested.
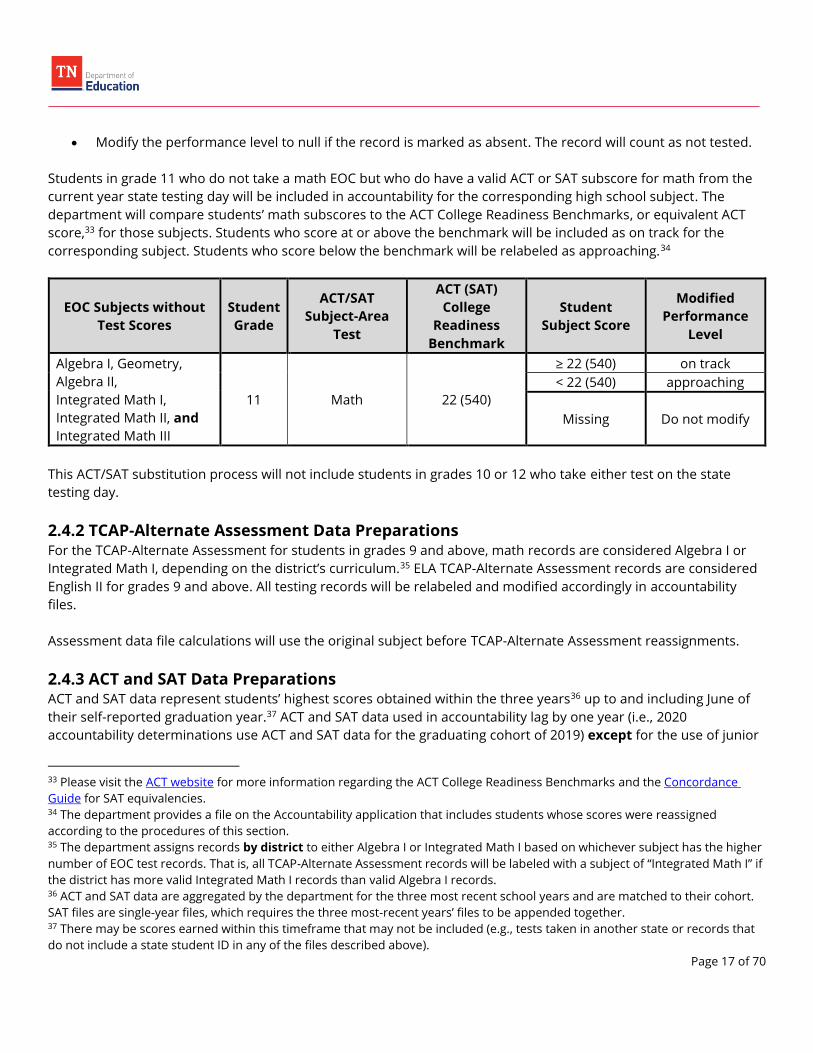
Students in grade 11 who do not take a math EOC but who do have a valid ACT or SAT subscore for math from the
current year state testing day will be included in accountability for the corresponding high school subject. The
department will compare students’ math subscores to the ACT College Readiness Benchmarks, or equivalent ACT
score,33 for those subjects. Students who score at or above the benchmark will be included as on track for the
corresponding subject. Students who score below the benchmark will be relabeled as approaching.34
EOC Subjects without
Test Scores
Student
Grade
ACT/SAT
Subject-Area
Test
ACT (SAT)
College
Readiness
Benchmark
Student
Subject Score
Modified
Performance
Level
Algebra I, Geometry,
Algebra II,
Integrated Math I,
Integrated Math II, and
Integrated Math III
11 Math 22 (540)
≥ 22 (540) on track
< 22 (540) approaching
Missing Do not modify
This ACT/SAT substitution process will not include students in grades 10 or 12 who take either test on the state
testing day.
2.4.2 TCAP-Alternate Assessment Data Preparations For the TCAP-Alternate Assessment for students in grades 9 and above, math records are considered Algebra I or
Integrated Math I, depending on the district’s curriculum.35 ELA TCAP-Alternate Assessment records are considered
English II for grades 9 and above. All testing records will be relabeled and modified accordingly in accountability
files.
Assessment data file calculations will use the original subject before TCAP-Alternate Assessment reassignments.
2.4.3 ACT and SAT Data Preparations ACT and SAT data represent students’ highest scores obtained within the three years36 up to and including June of
their self-reported graduation year.37 ACT and SAT data used in accountability lag by one year (i.e., 2020
accountability determinations use ACT and SAT data for the graduating cohort of 2019) except for the use of junior
33 Please visit the ACT website for more information regarding the ACT College Readiness Benchmarks and the Concordance
Guide for SAT equivalencies. 34 The department provides a file on the Accountability application that includes students whose scores were reassigned
according to the procedures of this section. 35 The department assigns records by district to either Algebra I or Integrated Math I based on whichever subject has the higher
number of EOC test records. That is, all TCAP-Alternate Assessment records will be labeled with a subject of “Integrated Math I” if
the district has more valid Integrated Math I records than valid Algebra I records. 36 ACT and SAT data are aggregated by the department for the three most recent school years and are matched to their cohort. SAT files are single-year files, which requires the three most-recent years’ files to be appended together. 37 There may be scores earned within this timeframe that may not be included (e.g., tests taken in another state or records that
do not include a state student ID in any of the files described above).

Page 18 of 70
day test data, as described below.
Please note, the department does not recognize super scores for these data.
2.4.3.1 Cohort Data Preparations
Below are the guidelines the department uses to prepare ACT and SAT data that include the highest available score
for graduates in the graduating cohort.
The department includes only those students who are on-time regular education diploma recipients in the
prior year’s graduating cohort.
Records containing students’ highest composite scores among the cohort file are provided by ACT. This
highest composite file includes the ACT retake file, and the two most recent state spring test day files.
o The department reconciles instances in which students have multiple records, either from a single
file or across multiple of the files above, as follows:
The record with the highest composite score is included if there are multiple records for the
same student that have different composite scores.
The record with the highest math subscore is included if there are multiple records for the
same student that have the same composite score.
The record with the highest reading38 subscore is included if there are multiple records for
the same student that have the same composite and math scores.
The record with the highest English subscore is included if there are multiple records for the
same student that have the same composite, math, and reading scores.
The record with the highest science subscore is included if there are multiple records for the
same student that have the same composite, math, reading, and English scores.
The most recent test record is included if there are multiple records for the same student
that have the same composite, math, reading, English, and science scores.
2.4.3.2 State Testing Day Data Preparations
Below are the guidelines the department uses to prepare ACT data from the current year’s state spring test day.
The department includes only those students who have a test record from the ACT or SAT junior test day
administration and do not have an EOC test record for any high school math subject.39 These business rules
apply to both all students and student groups.
The department resolves duplicate records as follows:
o The record with the highest composite score is included if there are multiple records for the same
student that have different composite scores.
o The record with the highest math subscore is included if there are multiple records for the same
student that have the same composite score.
o The record with the highest reading subscore is included if there are multiple records for the same
student that have the same composite and math scores.
o The record with the highest English subscore is included if there are multiple records for the same
student that have the same composite, math, and reading scores.
o The record with the highest science subscore is included if there are multiple records for the same
student that have the same composite, math, reading, and English scores.
38 For SAT, the department considers the critical reading score as the reading subscore. 39 High school math consists of Algebra I, Geometry, Algebra II, Integrated Math I, Integrated Math II, and Integrated Math III.

Page 19 of 70
2.4.4 Ready Graduate Data Preparations 2.4.4.2 Enrollment and Examination Verification
The following table indicates the first year all EPSO data sources were available.
EPSO Type First School Year of Available Data
Advanced Placement 2007-08
Cambridge International Examinations 2014-15
College Level Examination Program 2015-16
Dual Enrollment (as captured in P20Connect TN) 2007-08
Dual Enrollment (as captured in EIS) 2014-15
Industry Certifications 2015-16 (varies by certification)
International Baccalaureate 2014-15
Local Dual Credit 2014-15
Statewide Dual Credit 2013-14
2.4.4.2 Enrollment and Examination Verification
For EPSOs with both a course and exam component, students must complete the course and receive a valid
numeric score on the corresponding culminating challenge/final exam for their participation to be reflected in Ready
Graduate calculations.40 For EPSOs that only require a minimum exam score (i.e., CLEP - 50 and ASVAB AFQT - 31),
students must earn the minimum required score.41 Please note, these are the current minimum scores and could
be subject to change in future years.
The department uses the identifiable information about each student (name, date of birth, school, grade, etc.) to
identify the state student ID for each student using P20 Connect TN, the state’s longitudinal data system. This
identifying information is used to match enrollment and examination records.42 The department does not apply
school year or grade constraints to verify student enrollments. That is, a student who takes an early postsecondary
course in grades less than 9 or takes a course in a year other than the year in which they take the exam will still
count that EPSO toward their total (assuming they complete both the course and the exam).
Students are considered to have completed a given early postsecondary course if they were enrolled for at least 50
percent of the course. Furthermore, a student in which their most recent enrollment indicates he or she was
withdrawn from the school or district (i.e., students who have a withdrawal code and an enrollment end date) will
not count as enrolled in the course in question. Additionally, both primary and service enrollments in early
postsecondary courses are considered for the purposes of Ready Graduate calculations.
40 The only exception to this rule is that students who earn a score of 3 or higher on an AP, a C or higher on CIE AS/A level exams,
or score of 4 or higher on IB exams (HL and SL) but do not have an EIS enrollment record in the corresponding course will count
that EPSO toward their Ready Graduate status. For more information regarding CIE scoring, please access Cambridge score
guidance. 41 Industry Certifications also require a minimum examination score. These scores vary by certification and can be located with
other Industry Certification information in the department’s promoted list. 42 For students earning Statewide Dual Credit (SDC), the Early Postsecondary Data System will be used with EIS to identify
student enrollment and examination records.

Page 20 of 70
2.4.4.3 Specific Exam Requirements
Any AP exam offered by College Board, even those that are not currently aligned with approved courses by
the College System of Tennessee, are eligible to count as an EPSO. Any test with a name containing “Advanced
Placement” is considered an AP exam.
All IB exam subjects other than those titled “Theory of Knowledge” and “Reference Project” are eligible for Ready
Graduate calculations. A student is considered to have attempted an IB exam if they receive a numeric score (i.e., 1-
7) and do not have an illegal score code (i.e., result code “I”). The department will consider any non-numeric score
an invalid attempt, and the EPSO will not count toward the student’s total.43
2.4.4.4 Specific Course Enrollment Requirements
The department will not count Intervention (e.g., GO2H22, etc.) or Study Hall (G25H10) courses marked with the LDC
flag as EPSOs. Additionally, classes for students in grades less than 9 that are flagged as LDC will not be considered
in the counts of EPSOs students earn.
2.4.4.5 Resolving Duplicated Ready Graduate Data
The department follows the steps below to retain a single record per student per course:44
The record with the most recent school year of enrollment is included if there are multiple records for the
same student and course code.
The record with the most recent enrollment end date is included if there are multiple records for the same
student, course code, and school year.
The record with the most recent enrollment start date is included if there are multiple records for the same
student, course code, school year, and enrollment end date.
The record with the most recent class assignment end date is included if there are multiple records for the
same student, course code, school year, enrollment end date, and enrollment begin date.
The record with the most recent class assignment begin date is included if there are multiple records for the
same student, course code, school year, enrollment end date, enrollment begin date, and class assignment
end date.
The record with the most recent class section end date is included if there are multiple records for the same
student, course code, school year, enrollment end date, enrollment begin date, class assignment end date,
and class assignment begin date.
The record with the most recent class section begin date is included if there are multiple records for the
same student, course code, school year, enrollment end date, enrollment begin date, class assignment end
date, class assignment begin date, and class section end date.
For more information regarding the Ready Graduate indicator, please see section 3.5.
2.4.5 ELPA Data Preparations Below are the guidelines the department uses to prepare ELPA data.
The department resolves duplicate records as follows:
43 Please note that there are two types of IB courses: higher level and standard level. Both levels count the same for Ready
Graduate calculations. However, these different levels result in different amounts of awarded credits, but will count for one
EPSO. 44 To verify course codes, please reference Appendix F.

Page 21 of 70
o The record with the highest composite performance level is included if there are multiple records for
the same student that have different composite performance levels.
o The record with the highest literacy performance level is included if there are multiple records for
the same student that have the same composite performance level.
o The record with a non-missing value for race/ethnicity is included if there are multiple records for
the same student that have the same composite and literacy performance levels.
o The record with a non-missing value for grade is included if there are multiple records for the same
student that have the same race/ethnicity and composite and literacy performance levels.
Any duplicated records that remain after the department applies the steps above are included in
accountability.
The department removes records with a tested grade level that does not match the corresponding cluster.
There are seven clusters:45
o Kindergarten
o Grade 1
o Grade 2
o Grade 3
o Grades 4-5
o Grades 6-8
o Grades 9-12
2.4.6 TVAAS Data Preparations For purposes of accountability, school and district TVAAS composites include data from the following content areas:
math, and ELA. Please consult the TVAAS Technical Documentation for more information regarding TVAAS data
preparations.
2.4.7 Graduation Data Preparations Please consult the 2020 Graduation Cohort Protocol for more information regarding graduation data preparations.
Enrollment data used for dropout calculations reflect EIS data from Oct. 1. The department considers students’
most recent enrollments if students have multiple enrollments.
2.4.8 Attendance Data Preparations Attendance data are used to compute the percent of students who are chronically out of school. This requires a
count of absences and a count of instructional days enrolled for all students, which are prepared as follows.
Students who are enrolled in two schools or districts for exactly 50 percent of the school year will count for both
schools and both districts for accountability purposes. Attendance data only reflect schools and districts in which
students are primarily enrolled (i.e., type of service of “P”).
2.4.8.1 Absences
The total number of absences includes all instructional days students were enrolled for a given school or district in
which extract 049 submissions list attendance codes of A, U, X, or T. Please consult the EIS Extracts Layout and
Appendix F of the EIS Appendices for more information regarding these extracts. Districts are responsible for
45 For example, records with a tested grade of 3 and a cluster of 4 would be removed.

Page 22 of 70
submitting and verifying correct absentee codes in accordance with state attendance policies.
2.4.8.2 Instructional Days
The total number of instructional days counts all days students were enrolled in a school or district that were
classified as instructional days.46 More specifically, instructional days are those with extract 11 submissions that
contain a value of “I” for School Day Type and do not have a value of Event Type of either “SI” or “MI.” Please consult
the EIS Extracts Layout and Appendix A of the EIS Appendices for more information regarding these extracts.
2.4.9 School Directory Data Preparations Below are the guidelines the department uses to prepare SDE data to identify different types of schools.
The department identifies new schools as those that have:
o School type 0, 2, or 347
o A begin date between May 31, 2019 and Aug. 31, 201948
o No end date
The department identifies closed schools as those that have:
o School type 0, 2, or 3
o An end date between May 31, 2019 and Aug. 31, 2019
The department identifies CTE schools as those that have:
o School type 0, 2, or 3
o Instructional type 6
o Active status
o No end date
The department identifies alternative schools as those that have:
o School type 0, 2, or 3
o Instructional type 8
o Active status
o No end date
The department identifies adult schools as those that have:
o School type 0, 2, or 3
o Instructional type 9
o Active status
o No end date
The department identifies special education schools as those that have:
o School type 0, 2, or 3
o Instructional type 7
o Active status
o No end date
46 Stockpiled days are not considered in the total of instructional days. As such, some schools and districts may have
denominators of 167 instructional days. 47 School types 0, 2, and 3 refer to public, state special, and charter schools, respectively. 48 The only exception to these dates would be for schools that have been previously approved by TDOE to open midyear. This
approval must be submitted to [email protected] for review prior to June 1 of the school year to open.

Page 23 of 70
3.1 Participation Rates Participation rates are calculated for any student group with an enrolled count that equals or exceeds 30 in the
current year across all grades49. The participation rate is equal to the number of students tested divided by the
number of students enrolled and rounded to the nearest whole number.50 The following equation illustrates how
test participation rates are calculated:
Participation Rate =Number of students tested
Number of students enrolled∗ 100
Participation rates are calculated at the school, district, and state levels and for each eligible student group.51 This
calculation is rounded to the nearest whole percentage point.
Participation rates are calculated after all data transformations have been completed. That is, numbers of tested
and enrolled students are used to calculate participation rates once all testing records have been modified,
amended, and excluded in accordance with section 2.4.
3.2 Performance Level Percentages The percentage of students at a given performance level is equal to the number of valid tests at that performance
level divided by the number of valid tests at all performance levels.52
Percent mastered53 =# mastered
# valid tests∗ 100
Percent on track =# on track
# valid tests∗ 100
Percent approaching =# approaching
# valid tests∗ 100
The percent of students scoring on track or mastered is calculated by dividing the number of on track and mastered
records by the total number of valid tests.
Percent on track or mastered =# on track + # mastered
# valid tests∗ 100
Percent below is calculated during the rounding process to ensure that all percentages sum to 100. Please note that
values are rounded to the tenths place only after all calculations and comparisons have been performed.
49 ACT and SAT participation rates must meet 30 students for any student group in the given cohort. 50 ACT and SAT participation rates, which are calculated by dividing the number of on-time graduates with valid ACT or SAT tests
by the number of on-time graduates in the district, represent the only exception to this formula. The Tennessee State Board has
produced a Frequently Asked Questions that guides requirements and procedures associated with TCA 49.2.103, which includes
ACT participation. 51 More information regarding how participation rates will be evaluated can be located in section 4.4.1 and section 5.3. 52 Records with missing or null performance levels are not included in these counts. 53 EOC performance levels for math and ELA subjects are used throughout this document.
Page 24 of 70
Percent below = 100 − (percent mastered + percent on track + percent approaching)
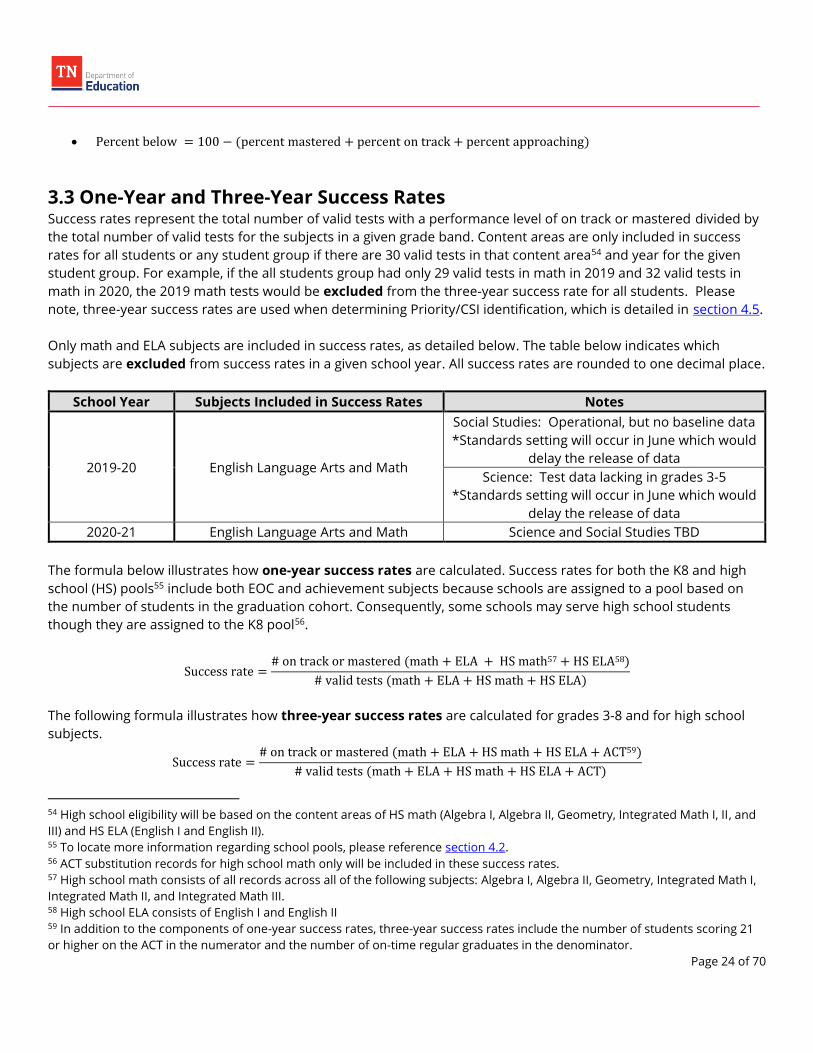
3.3 One-Year and Three-Year Success Rates Success rates represent the total number of valid tests with a performance level of on track or mastered divided by
the total number of valid tests for the subjects in a given grade band. Content areas are only included in success
rates for all students or any student group if there are 30 valid tests in that content area54 and year for the given
student group. For example, if the all students group had only 29 valid tests in math in 2019 and 32 valid tests in
math in 2020, the 2019 math tests would be excluded from the three-year success rate for all students. Please
note, three-year success rates are used when determining Priority/CSI identification, which is detailed in section 4.5.
Only math and ELA subjects are included in success rates, as detailed below. The table below indicates which
subjects are excluded from success rates in a given school year. All success rates are rounded to one decimal place.
School Year Subjects Included in Success Rates Notes
2019-20 English Language Arts and Math
Social Studies: Operational, but no baseline data
*Standards setting will occur in June which would
delay the release of data
Science: Test data lacking in grades 3-5
*Standards setting will occur in June which would
delay the release of data
2020-21 English Language Arts and Math Science and Social Studies TBD
The formula below illustrates how one-year success rates are calculated. Success rates for both the K8 and high
school (HS) pools55 include both EOC and achievement subjects because schools are assigned to a pool based on
the number of students in the graduation cohort. Consequently, some schools may serve high school students
though they are assigned to the K8 pool56.
Success rate =# on track or mastered (math + ELA + HS math57 + HS ELA58)
# valid tests (math + ELA + HS math + HS ELA)
The following formula illustrates how three-year success rates are calculated for grades 3-8 and for high school
subjects.
Success rate =# on track or mastered (math + ELA + HS math + HS ELA + ACT59)
# valid tests (math + ELA + HS math + HS ELA + ACT)
54 High school eligibility will be based on the content areas of HS math (Algebra I, Algebra II, Geometry, Integrated Math I, II, and
III) and HS ELA (English I and English II). 55 To locate more information regarding school pools, please reference section 4.2. 56 ACT substitution records for high school math only will be included in these success rates. 57 High school math consists of all records across all of the following subjects: Algebra I, Algebra II, Geometry, Integrated Math I,
Integrated Math II, and Integrated Math III. 58 High school ELA consists of English I and English II 59 In addition to the components of one-year success rates, three-year success rates include the number of students scoring 21
or higher on the ACT in the numerator and the number of on-time regular graduates in the denominator.
Page 25 of 70
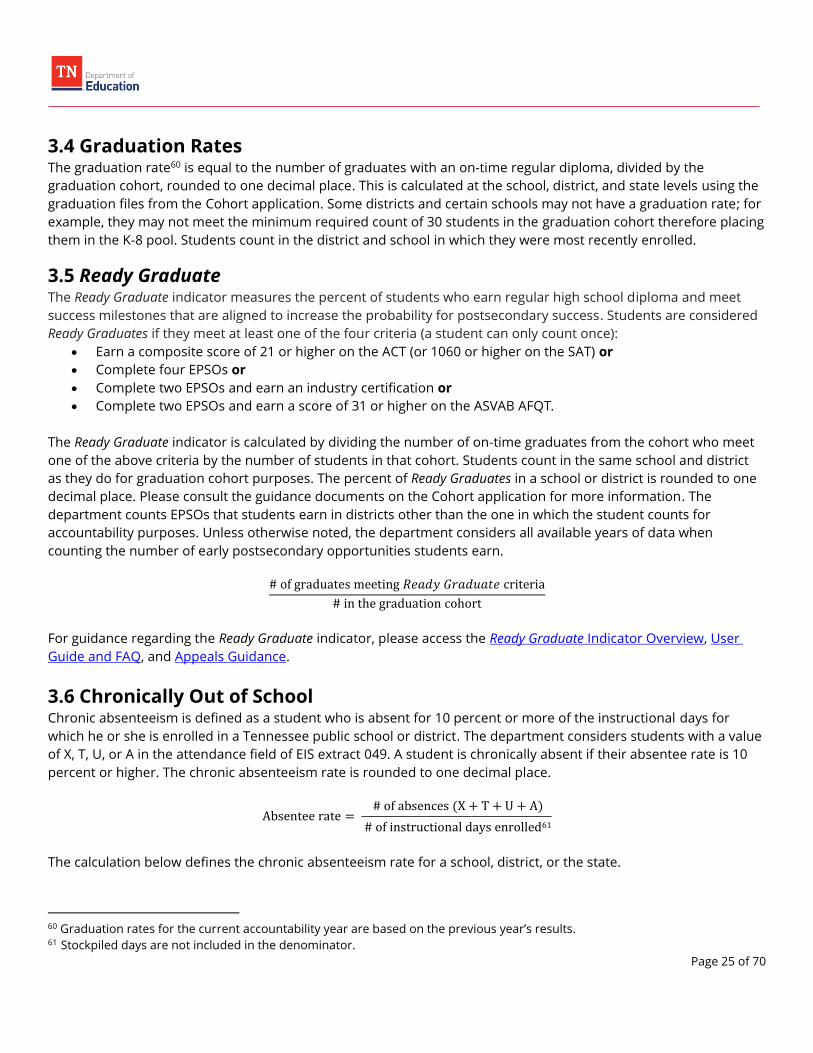
3.4 Graduation Rates The graduation rate60 is equal to the number of graduates with an on-time regular diploma, divided by the
graduation cohort, rounded to one decimal place. This is calculated at the school, district, and state levels using the
graduation files from the Cohort application. Some districts and certain schools may not have a graduation rate; for
example, they may not meet the minimum required count of 30 students in the graduation cohort therefore placing
them in the K-8 pool. Students count in the district and school in which they were most recently enrolled.
3.5 Ready Graduate The Ready Graduate indicator measures the percent of students who earn regular high school diploma and meet
success milestones that are aligned to increase the probability for postsecondary success. Students are considered
Ready Graduates if they meet at least one of the four criteria (a student can only count once):
Earn a composite score of 21 or higher on the ACT (or 1060 or higher on the SAT) or
Complete four EPSOs or
Complete two EPSOs and earn an industry certification or
Complete two EPSOs and earn a score of 31 or higher on the ASVAB AFQT.
The Ready Graduate indicator is calculated by dividing the number of on-time graduates from the cohort who meet
one of the above criteria by the number of students in that cohort. Students count in the same school and district
as they do for graduation cohort purposes. The percent of Ready Graduates in a school or district is rounded to one
decimal place. Please consult the guidance documents on the Cohort application for more information. The
department counts EPSOs that students earn in districts other than the one in which the student counts for
accountability purposes. Unless otherwise noted, the department considers all available years of data when
counting the number of early postsecondary opportunities students earn.
# of graduates meeting 𝑅𝑒𝑎𝑑𝑦 𝐺𝑟𝑎𝑑𝑢𝑎𝑡𝑒 criteria
# in the graduation cohort
For guidance regarding the Ready Graduate indicator, please access the Ready Graduate Indicator Overview, User
Guide and FAQ, and Appeals Guidance.
3.6 Chronically Out of School Chronic absenteeism is defined as a student who is absent for 10 percent or more of the instructional days for
which he or she is enrolled in a Tennessee public school or district. The department considers students with a value
of X, T, U, or A in the attendance field of EIS extract 049. A student is chronically absent if their absentee rate is 10
percent or higher. The chronic absenteeism rate is rounded to one decimal place.
Absentee rate = # of absences (X + T + U + A)
# of instructional days enrolled61
The calculation below defines the chronic absenteeism rate for a school, district, or the state.
60 Graduation rates for the current accountability year are based on the previous year’s results. 61 Stockpiled days are not included in the denominator.

Page 26 of 70
Percent chronically out of school =# of chronically absent students
# students enrolled ∗ 100
District- and school-level calculations will include only students who are enrolled for at least 50 percent of the
instructional days of the year in the district or school, respectively.
3.7 Annual Measurable Objective (AMO) Targets AMO targets are yearly targets for improving performance based on prior year results.62 School and district AMO
targets expect schools and districts to decrease by half the percentage of students whose performance does not
meet the standard over the course of eight years. Double AMO targets expect the percent of students not meeting
the standard to decrease by half in four years. AMO targets are rounded to one decimal place. The department only
sets AMO targets when a school or district has 30 or more valid tests or students in the prior year. For the 2019-20
accountability calculations, AMO targets have been calculated as described:
AMO target =100 − prior performance
8 ∗ 2+ prior performance
Double AMO target =100 − prior performance
4 ∗ 2+ prior performance
Chronically out of school AMO reduction targets subtract expected improvement from prior performance, as
outlined below.
AMO reduction target = prior performance −prior performance
8 ∗ 2
Double AMO reduction target = prior performance −prior performance
4 ∗ 2
As an example, a school with a success rate of 25 percent would calculate its AMO target and double AMO targets
as follows:
AMO target =100 − 25
8 ∗ 2+ 25 =
75
16+ 25 = 29.6875 ≈ 29.7
Double AMO target =100 − 25
4 ∗ 2+ 25 =
75
8+ 25 = 34.375 ≈ 34.4
3.8 Confidence Intervals (CIs) A confidence interval is a range of values that captures the true percentage with greater confidence. The
department calculates 95 percent confidence intervals (CI) for success rates, chronic absenteeism rates, graduation
rates, and Ready Graduate percentages only. These rates may not be equal to the true proportion of students
whose skills and knowledge correspond to a given performance level. The procedure for calculating a 95 percent
62 Targets for reducing the percent of students scoring below or the percent of students who are chronically absent are subtracted
from prior performance rather than added to it, given that the goal is to reduce these rates.

Page 27 of 70
confidence interval is such that, over many iterations, the interval will contain the true performance level
percentage in 95 percent of cases. For more details on the formula used to calculate upper and lower confidence
bounds, please see Appendix D.
A 95 percent CI means that:
If the process were repeated on multiple samples, the CI would include the true value for that metric 95
percent of the time.
A 95 percent CI does not mean that:
95 percent of the data fall within the calculated interval.
There is a 95 percent probability that the true performance level percentage falls within the calculated
interval.
3.9 Rounding Procedures Unless otherwise noted, all calculations are rounded to one decimal place at the end of all calculation steps. For
example, overall school accountability scores are rounded to the tenths place only when creating the final
average63. All values leading into the final score are neither rounded nor truncated.
63 For example, a final accountability score of 2.04 will round to 2.0 while a final accountability score of 2.05 will round to 2.1.

Page 28 of 70
4.1 Background and Designations This section details the procedures involved in calculating school accountability designations. The department
identifies Priority schools64 at least every three years and all other schools annually. A Priority school may exit
Priority status each year between identification cycles if these schools make significant progress.65
Reward schools66 are those schools that earn an overall weighted average of 3.1 or higher and are not identified as
Focus schools.
4.2 School Pools and Eligibility Schools are included in one of two pools based on graduation cohorts.
K-8 pool: Schools with fewer than 30 students in the prior year graduating cohort and 30 or more students
with valid tests in a single subject67. Subjects would include: 3-8 math, 3-8 ELA, HS math, and HS English.
HS pool:68 Schools with 30 or more students in the prior year graduating cohort.
Schools with only graduation or ACT data in the current year are included in the overall pool of schools but are not
eligible to earn designations.
Schools that are closed are included in the overall pool of schools but are not eligible to earn designations since
they are not eligible to receive interventions.
Schools with only one year of data included in the overall pool of schools but are not eligible to earn designations
since they do not have data to evaluate improvement.
Special education schools are included in the overall pool of schools but are not eligible for Priority Status.
The following schools and school types are ineligible to earn school accountability designations since data from
these schools remand to the student’s sending school:
CTE
Adult high schools
Alternative schools
4.3 Student Groups and Pathways School accountability calculations include students in applicable historically underserved student groups to ensure
64 Priority schools are sometimes referred to as “schools identified for comprehensive support and improvement.” Priority
schools also receive an overall grade of “F”. 65 Please see section 4.5.1 for more information regarding Priority exit criteria. 66 Reward schools receive an overall grade of “A”. 67 Subjects would include: 3-8 math, 3-8 ELA, HS math, HS English. 68 Schools that serve grade 12 but do not meet the minimum student count will be considered in the K-8 pool for accountability
purposes.

Page 29 of 70
all Tennessee students achieve high levels of success. The all students group includes all students. If applicable,
students are also included in the following student groups:
Black, Hispanic, and Native American students (BHN)
Economically Disadvantaged students (ED)
English Learners (EL)
Students with Disabilities (SWD)
The department will consider Super Subgroup performance for schools that do not have sufficient numbers of
students for any individual student group listed above but do have sufficient numbers of students in the Super
Subgroup.
Each overall student group indicator represents the average performance of each eligible student group for that
indicator. In other words, a school that is only eligible for the BHN and ED student groups will receive a student
group indicator score that reflects the even weight of the performance of these two student groups. Each overall
average is rounded to one decimal place.
Final indicator averages weight all students and subgroup indicator averages at 60 percent and 40 percent,
respectively. Final indicator averages are rounded to one decimal place.
Consider the example of the high school grades below.
Indicator All Students (60%) Historically Underserved
Student Groups (40%) Overall
Score/Grade Score/Grade
Achievement (30%) 3 B 3 B B (3.0)
Growth (25%) 4 A 2 C A (3.2)
Ready Graduate (20%) 1 D 3 B C (1.8)
Graduation Rate (5%) 2 C 2 C C (2.0)
Chronically Out of School (10%) 3 B 3 B B (3.0)
English Language Proficiency (10%) 3 B 3 B B (3.0)
Overall School Grade (100%) B (2.8)
Final grades weight all students and subgroup grades at 60 percent and 40 percent, respectively. Final grades are
rounded to the one decimal place. Schools receive final grade69s based on the points scale below70:
A: 3.1–4.0
B: 2.1–3.0
C: 1.1–2.0
D: 0.0–1.0
69 Please note, schools receiving a school grade of “F” will be those identified as Priority. See section 4.5 for more information
regarding Priority School Identification. 70 Schools receiving a Focus designation will be limited to a letter grade of “B-“ or lesser values, including those schools with
scores greater than 3.1. See section 4.6 for more information.

Page 30 of 70
4.4 Indicators and Weighting The following table details the indicators included in school accountability. The weights will be used to compute a
weighted average for Reward school identification and other federal identifications as described in section 4.6.
Indicator Definition Measure for All Students and Student Groups Weight
Achievement
Progress toward on track or
mastered
Absolute performance or AMO targets (set to
increase the percent of students scoring on track
or mastered)
K-8: 45%
HS: 30%
Growth
Progress toward approaching,
on track, or mastered
TVAAS (student-level growth measure across
achievement continuum)
K-8: 35%
HS: 25%
Ready
Graduate
Percent of students who
graduate and meet Ready
Graduate criteria71
Absolute performance or AMO targets (set to
increase the percent of Ready Graduates)
K-8: NA
HS: 20%
Graduation
Rate
Percent of students in the
graduation cohort that
graduate on time with a
regular diploma
Absolute performance or AMO targets (set to
increase the graduation rate)
K-8: NA
HS: 5%
Chronically
Out of School
Chronic absenteeism,
including out-of-school
suspension
Absolute performance or AMO targets (set to
decrease the percent of chronically absent
students)
K-8: 10%
HS: 10%
English
Language
Proficiency
Assessment72
Performance on WIDA ACCESS The percent of students meeting growth
standards
K-8: 10%
HS: 10%73
Student groups with at least 30 valid records are included in accountability calculations, with the exception of the
ELPA indicator, which uses a minimum n-size of 10 valid records and the Growth indicator (TVAAS) which student
counts vary by model74. The Super Subgroup75 will be used when schools are ineligible for all indicators for each of
the four student groups listed above, assuming the school has enough valid records for the Super Subgroup for at
least one indicator.
Schools only receive scores for indicators in which they have sufficient data for all pathways. For example, a high
school with at least 30 students in the graduation cohort that has a graduation rate but lacks AMO targets would
not receive a score for the graduation rate indicator.
The 10 percent weight for the English Language Proficiency Assessment (ELPA) indicator is redistributed evenly
between the achievement and growth indicators for schools that do not have at least 10 valid tests. Weighting is
71 For more information regarding Ready Graduate criteria, please reference section 3.5. 72 The ELPA indicator uses a minimum n-size of 10 valid tests whereas all other indicators require a minimum n-size of 30. 73 The 10 percent weight is redistributed to the achievement and growth indicators equally for schools in either school pool who
do not meet the minimum n-size for the ELPA indicator. 74 Please reference the TVAAS technical manual for additional business rules used in the growth metric. 75 Please see section 2.2.2 for more information on the Super Subgroup.
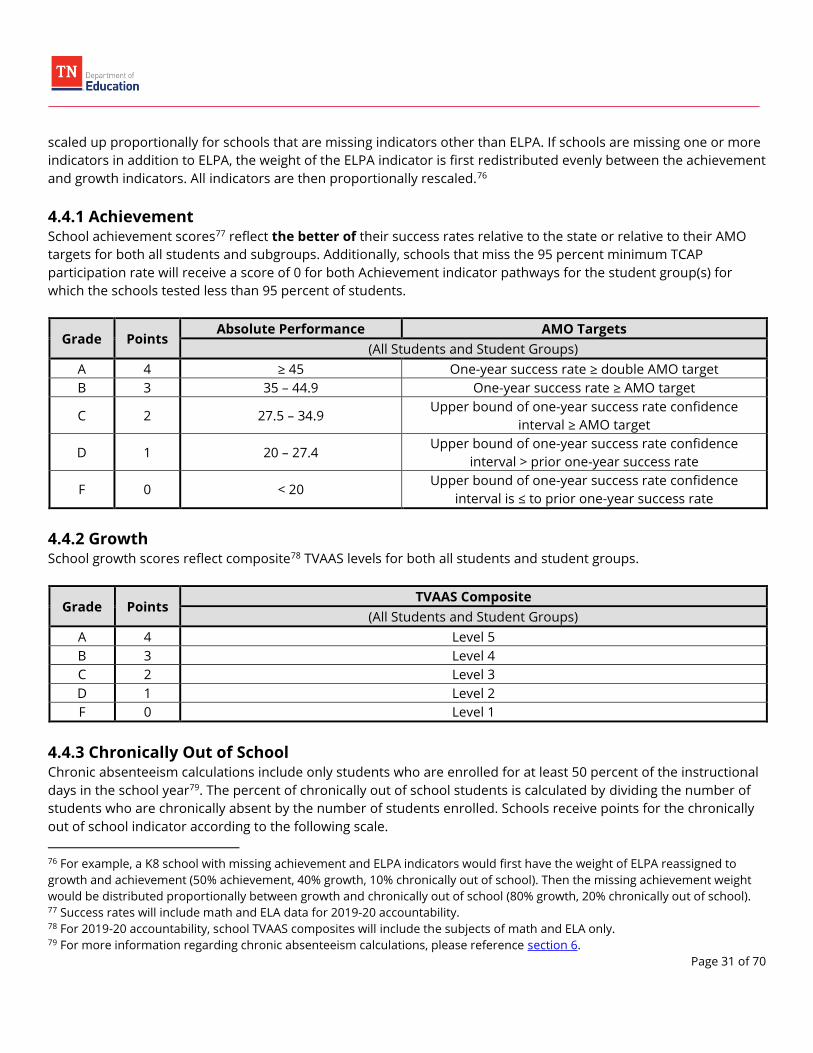
Page 31 of 70
scaled up proportionally for schools that are missing indicators other than ELPA. If schools are missing one or more
indicators in addition to ELPA, the weight of the ELPA indicator is first redistributed evenly between the achievement
and growth indicators. All indicators are then proportionally rescaled.76
4.4.1 Achievement School achievement scores77 reflect the better of their success rates relative to the state or relative to their AMO
targets for both all students and subgroups. Additionally, schools that miss the 95 percent minimum TCAP
participation rate will receive a score of 0 for both Achievement indicator pathways for the student group(s) for
which the schools tested less than 95 percent of students.
Grade Points Absolute Performance AMO Targets
(All Students and Student Groups)
A 4 ≥ 45 One-year success rate ≥ double AMO target
B 3 35 – 44.9 One-year success rate ≥ AMO target
C 2 27.5 – 34.9 Upper bound of one-year success rate confidence
interval ≥ AMO target
D 1 20 – 27.4 Upper bound of one-year success rate confidence
interval > prior one-year success rate
F 0 < 20 Upper bound of one-year success rate confidence
interval is ≤ to prior one-year success rate
4.4.2 Growth School growth scores reflect composite78 TVAAS levels for both all students and student groups.
Grade Points TVAAS Composite
(All Students and Student Groups)
A 4 Level 5
B 3 Level 4
C 2 Level 3
D 1 Level 2
F 0 Level 1
4.4.3 Chronically Out of School Chronic absenteeism calculations include only students who are enrolled for at least 50 percent of the instructional
days in the school year79. The percent of chronically out of school students is calculated by dividing the number of
students who are chronically absent by the number of students enrolled. Schools receive points for the chronically
out of school indicator according to the following scale.
76 For example, a K8 school with missing achievement and ELPA indicators would first have the weight of ELPA reassigned to
growth and achievement (50% achievement, 40% growth, 10% chronically out of school). Then the missing achievement weight
would be distributed proportionally between growth and chronically out of school (80% growth, 20% chronically out of school). 77 Success rates will include math and ELA data for 2019-20 accountability. 78 For 2019-20 accountability, school TVAAS composites will include the subjects of math and ELA only. 79 For more information regarding chronic absenteeism calculations, please reference section 6.

Page 32 of 70
Grade Points
K8 Absolute
Performance
HS Absolute
Performance AMO Targets
(All Students and Student Groups)
A 4 ≤ 6 ≤ 10 Percent of chronically absent students ≤
double AMO target
B 3 6.1 – 9 10.1 – 14 Percent of chronically absent students ≤ AMO
target
C 2 9.1 – 13 14.1 – 20
Lower bound of confidence interval of
percent of chronically absent students ≤ AMO
target
D 1 13.1 – 20 20.1 – 30
Lower bound of confidence interval of
percent of chronically absent students < prior
year percent of chronically absent students
F 0 > 20 > 30
Lower bound of confidence interval of
percent of chronically absent students ≥ prior
year percent of chronically absent students
4.4.4 Graduation Rate Graduation rates reflect the percent of students in a given cohort who graduate with a regular diploma within four
years and a summer of starting grade 9. Only schools in the high school pool receive points for the graduation rate
indicator according to the following scale.
Grade Points Absolute Performance AMO Targets
(All Students and Student Groups)
A 4 ≥ 95 Graduation rate ≥ double AMO target
B 3 90 – 94.9 Graduation rate ≥ AMO target
C 2 80 – 89.9 Upper bound of confidence interval of graduation rate ≥
AMO target
D 1 67 – 79.9 Upper bound of confidence interval of graduation rate >
prior graduation rate
F 0 < 67 Upper bound of confidence interval of graduation rate is
≤ prior year graduation rate
4.4.5 Ready Graduate The Ready Graduate indicator is calculated by dividing the number of on-time graduates from the cohort who meet
at least one of the Ready Graduate criteria by the number of students in that cohort. Only schools in the high school
pool receive points for the Ready Graduate indicator according to the following scale.

Page 33 of 70
Grade Points Absolute Performance AMO Targets
(All Students and Student Groups)
A 4 ≥ 40 Percent of Ready Graduates ≥ double AMO target
B 3 30 – 39.9 Percent of Ready Graduates ≥ AMO target
C 2 25 – 29.9 Upper bound of percent of Ready Graduates confidence
interval ≥ AMO target
D 1 16 – 24.9 Upper bound of percent of Ready Graduates > prior
percent of Ready Graduates
F 0 < 16 Upper bound of percent of Ready Graduates is ≤ prior
percent of Ready Graduates
Additionally, schools that miss the 95 percent minimum participation rate for ACT/SAT will receive a score of 0 for
both pathways of the Ready Graduate indicator for the student group(s) for which the schools tested less than 95
percent of graduates.
4.4.6 English Language Proficiency Assessment Schools are eligible for the ELPA indicator if at least 10 students have valid composite performance levels in both
the current and prior year. The ELPA indicator reflects the percent of students meeting the growth standard.
Growth standards are differentiated based on students’ prior-year composite performance according to the table
below.80
Prior Year Score Range Growth Standard
1.0–1.4 1.3
1.5–1.9 0.7
2.0–2.4 0.8
2.5–2.9 0.7
3.0–3.4 0.4
3.5–3.9 0.5
4.0–4.4 0.4
4.5-4.9 0.2
Students are considered to have met the growth standard if the difference between their current year and prior
year composite performance levels is greater than or equal to the corresponding growth standard based on their
prior year composite performance level81. Alternatively, students who miss the growth standard in the most recent
year but meet a combined two-year growth standard will also count as having met the growth standard. The
department will also consider students to have met the growth standard if they meet the reclassification criteria in
the most recent year, regardless of whether their year-over-year growth meets the standard for their prior
composite score.82
80 These growth standards represent the 60th percentile of growth performance for each given score band. 81 Students meeting WIDA Access exit criteria are included as “meeting the growth standard.” Starting in 2019-20 the criteria for
exiting is a composite of 4.4 and literacy performance level of 4.2. 82 Students with a valid composite performance level in only the most recent year will not count as having met the growth
standard.
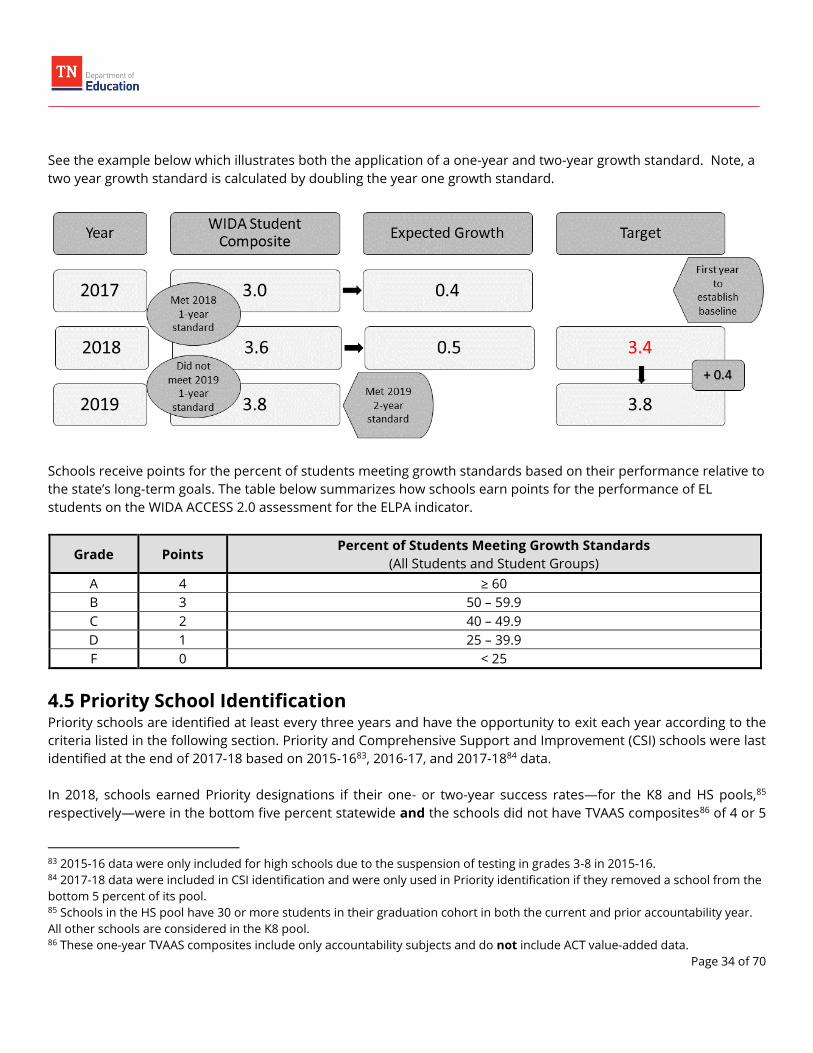
Page 34 of 70
See the example below which illustrates both the application of a one-year and two-year growth standard. Note, a
two year growth standard is calculated by doubling the year one growth standard.
Schools receive points for the percent of students meeting growth standards based on their performance relative to
the state’s long-term goals. The table below summarizes how schools earn points for the performance of EL
students on the WIDA ACCESS 2.0 assessment for the ELPA indicator.
Grade Points Percent of Students Meeting Growth Standards
(All Students and Student Groups)
A 4 ≥ 60
B 3 50 – 59.9
C 2 40 – 49.9
D 1 25 – 39.9
F 0 < 25
4.5 Priority School Identification Priority schools are identified at least every three years and have the opportunity to exit each year according to the
criteria listed in the following section. Priority and Comprehensive Support and Improvement (CSI) schools were last
identified at the end of 2017-18 based on 2015-1683, 2016-17, and 2017-1884 data.
In 2018, schools earned Priority designations if their one- or two-year success rates—for the K8 and HS pools,85
respectively—were in the bottom five percent statewide and the schools did not have TVAAS composites86 of 4 or 5
83 2015-16 data were only included for high schools due to the suspension of testing in grades 3-8 in 2015-16. 84 2017-18 data were included in CSI identification and were only used in Priority identification if they removed a school from the
bottom 5 percent of its pool. 85 Schools in the HS pool have 30 or more students in their graduation cohort in both the current and prior accountability year.
All other schools are considered in the K8 pool. 86 These one-year TVAAS composites include only accountability subjects and do not include ACT value-added data.
Page 35 of 70
in both 2016-17 and 2017-1887 for all subjects. These success rates included 2015-16 and 2016-17 data for schools in
the HS pool and 2016-17 data only for schools in the K8 pool. Schools with graduation rates less than 67 percent were
also designated as Priority schools.
After the 2020-21 school year, the department will identify Priority and CSI schools as the lowest-performing five
percent of schools in terms of three-year success rates88 in each school pool. Furthermore, any school with a
graduation rate less than 67 percent will earn Priority status.89 Schools in the bottom five percent that earn a score
of A or B for the All Students group on all indicators90 for which they are eligible based on the absolute performance
pathway will not be identified as Priority schools.
Additionally, the Every Student Succeeds Act requires that Focus schools91 that remain identified for the same
subgroup(s) for multiple years become Priority schools. More specifically, schools that are identified for Additional
Targeted Support and Improvement (ATSI) in two consecutive cycles will become Priority schools. For example,
schools that are identified during the 2020-21 and 2023-24 ATSI identification cycles will earn Priority status, which
will take effect during the 2024-25 school year. Focus schools that are identified for multiple student groups must exit
Focus status for each identified group at least once within the three-year cycle to avoid Priority identification.
4.5.1 Priority Exit Criteria Schools may exit Priority or CSI status annually by meeting one92 of the following exit criteria:
The school’s one-year success rate for the all students group exceeds the 10th percentile in the state in both
of the two most recent years;
The school’s one-year success rate for the all students group exceeds the 15th percentile in the state in the
most recent year;
The school earns a TVAAS level of 4 or 5 in all accountability subjects/content area composites
(Literacy/Numeracy) for both of the two most recent years;
If it was identified for graduating less than 67 percent of its students, the school can exit by graduating at
least 67 percent of its students in both of the two most recent years.
If it was identified for consistently underperforming student groups (i.e., Focus), the school can exit by
meeting or exceeding success rate AMO targets for each student group for which the school was
identified.93 A school identified for multiple subgroups may exit for individual subgroups by meeting AMO
87 The federal Every Student Succeeds Act (ESSA) required the department to include 2017-18 data to identify the bottom 5
percent of schools for “Comprehensive Support and Improvement” (CSI). For more information regarding CSI and ATSI
identifications, please access the Accountability User Guide. 88 These three-year success rates will include data from 2018-19, 2019-20, and 2020-21 and math and ELA subjects, including
ACT/SAT substitution. In addition, three-year TVAAS composites will be utilized for these identifications. 89 Based on a lagged, one-year graduation rate for all students in schools with at least 30 students in the graduation cohort in
that year (i.e., the 2020-21 Priority list will include schools with all students graduation rates from 2020 of less than 67 percent,
assuming those schools have less than 30 students in the cohort). 90 Except the Achievement indicator, which is included by way of success rates. 91 For more information regarding Focus school identifications, please reference section 4.6. 92 Please note, schools identified for more than one criteria must meet criteria for the areas in which identified to exit. (i.e., a
school identified for both success rate and graduation rate must meet one of the first three bullets and the fourth bullet to be
considered meeting exit criteria). 93 The department does not use confidence intervals when determining whether Priority schools that are identified for
consistently underperforming subgroups have met AMO targets.

Page 36 of 70
targets for that given group. A school need not meet AMO targets for all subgroups in all years to exit.
However, a school must meet targets for all identified subgroups in at least one of the years between
identification.
Additionally, schools may exit Priority status every three years by not appearing on the subsequent Priority list.
4.6 Focus School Identification Focus schools have one or more significantly and/or consistently underperforming subgroup(s). The final grades of
Focus schools will be indicated with a minus sign (e.g., a school with an overall grade of C that is identified as a Focus
school will have a reported grade of C-).94 Please note, schools receiving a Focus designation may not earn a letter
grade higher than a “B-“. This includes schools with overall accountability scores greater than 3.1.
Focus school identification includes two categories of federal school designations: Targeted Support and
Improvement (TSI) and Additional Targeted Support and Improvement (ATSI). Both groups of schools are considered
Focus schools. Focus schools that earn a designation based on the same historically underserved student group(s)
for three consecutive identification cycles will earn a Priority designation starting in 2020-21. Federal law requires the
department to identify TSI and ATSI schools for all four accountability subgroups95 and for six individual racial and
ethnic groups.96 These schools are identified based on different timelines and methodologies, as outlined below.
4.6.1 Targeted Support and Improvement (TSI) The department identifies TSI schools each year. Schools are eligible97 for TSI identification if they have one or more
student groups whose overall accountability score includes data from all indicators.98 Schools whose overall
accountability scores for a given student group are in the bottom five percent for that student group will be identified
as TSI schools. For example, a school in which Economically Disadvantaged (ED) students perform in the bottom five
percent of all eligible ED student groups will be identified as TSI for its ED student group.
4.6.2 Additional Targeted Support and Improvement (ATSI) The department identifies ATSI schools every three years. The Every Student Succeeds Act defines ATSI schools as
those in which “any subgroup of students, on its own, would lead to identification” as a Priority school.99 Only schools
identified as TSI based on the most recent TSI list will be eligible for ATSI identification.100 TSI schools whose student
94 With the exception of schools that earn a grade of D. These will not be labeled with a minus sign. 95 Accountability subgroups include Black/Hispanic/Native American students, Economically Disadvantaged students, English
Learners, and Students with Disabilities. 96 These individual racial and ethnic groups are Hispanic/Latino, Black or African American, American Indian or Alaska Native,
Native Hawaiian or Pacific Islander, Asian, and White. 97 Please note, a school that is identified for Comprehensive Support and Improvement (CSI) may not also be identified as
Targeted Support and Improvement (TSI) 98 Schools must be eligible for all indicators in their pool other than ELPA (and Graduation Rate and Ready Graduate for K8
schools) to be eligible for TSI identification. 99 See Sec.1111 [20 U.S.C. 6311](d)(1)(2)(C). 100 The department will calculate the TSI list before determining the ATSI school list. For example, the TSI list generated at the
end of the 2019-20 school year, which will be based on 2019-20 data, will determine which schools are eligible for ATSI
identification in 2020-21.

Page 37 of 70
group success rates101 are less than or equal to the maximum success rate of any Priority school in their pool102 will
be identified as ATSI if they do not also have a score of A or B for each indicator for which that student group is eligible.
4.6.3 Focus Exit Criteria TSI schools are identified annually and may only exit if they are not identified as TSI schools in the following year. ATSI
schools that meet the minimum required number of students in the year of identification but not in subsequent years
will retain their ATSI status. Such schools will automatically exit during the next identification cycle if they still do not
met required minimum student counts. Schools that continue to meet the minimum required number of students in
the next identification cycle will be eligible for ATSI identification and exit.
Schools may exit ATSI status annually by meeting one of the following exit criteria:
The school’s one-year success rate for each student group for which it was identified exceeds the “all
students” 10th percentile in the state in both of the two most recent years;
The school’s one-year success rate for each student group for which it was identified exceeds the “all
students” 15th percentile in the state in the most recent year;
The school earns a TVAAS level of 4 or 5 in all accountability subjects/content area composites
(Literacy/Numeracy) for both of the two most recent years for each student group for which it was
identified; or
If it was identified for graduating less than 67 percent of its students, the school can exit by graduating at
least 67 percent of its students for each subgroup for which it was identified in both of the two most recent
years
Additionally, schools may exit ATSI status every three years by not appearing on the subsequent ATSI list.
4.7 Reward School Identification Schools earn Reward status based on the most recent year of data103. Schools earn Reward status if they earn an
overall weighted average of 3.1 or higher and are not identified as Priority or Focus schools. Reward schools earn an
overall grade of “A”.
101 These success rates will include the same subjects and multiple years of data that are included in the Priority school success
rates to which they are compared, with the exception of the 2019-20 identification, which will use data from the 2017-18, 2018-
19, and 2019-20 school years. In addition, three-year TVAAS composites will be utilized for these identifications. 102 Based on the Priority list identified that same year. For the 2019-20 school year, the department will use the success rates
from the 2017-18 identification because the department will not newly identify Priority schools in the 2019-20 school year. 103 The Graduation Rate and Ready Graduate indicators are lagged measures by one year; therefore the most recent year of data
for these two indicators will be used in the subsequent year.

Page 38 of 70
This section outlines the data sources and procedures used in district accountability calculations.
5.1 Indicators and Designations The following indicators104 are included in district accountability:
Grades 3–5 success rate
Grades 6–8 success rate
Grades 9–12 success rate
Grades K–12 chronically out of school
Grades K–12 English Language Proficiency Assessment (ELPA)
Graduation rate
District performance across these indicators earns one of five possible determinations:
Exemplary
Advancing
Satisfactory
Marginal
In need of improvement
5.2 Historically Underserved Student Groups and Minimum Required Counts Students are included in applicable student groups to ensure all Tennessee students achieve high levels of success.
All students are included in the all students group. If applicable, students are also included in the following
historically underserved student groups:
Super Subgroup105
Black, Hispanic, and Native American students (BHN)
Economically Disadvantaged students (ED)
English Learners106 (EL)
Students with Disabilities (SWD)
Student groups are included in accountability calculations for the success rate indicator if there are at least 30 valid
tests in a given content area in the current and prior year.107 Student groups are included in accountability
calculations for the ELPA indicator if there are at least 30 students with valid composite and literacy performance
levels in the current and prior year. Student groups with at least 30 students in grades K through 12 who are
enrolled for at least 50 percent of instructional days are included for the chronically out of school indicator. Student
groups with at least 30 students in the graduation cohort are included for the graduation rate indicator.
Districts will only receive scores for the indicators for which they have sufficient data for both the AMO and
104 For the success rate indicators, the subjects will include math and ELA data for 2019-20 accountability. 105 The Super Subgroup includes all records that identify at least one of the historically underserved student groups listed. Please
consult section 2.3.2 for more information. 106 English Learners include Transition 1-4 students. 107 Valid tests are those test records for which a performance level can be assigned.

Page 39 of 70
absolute performance pathways.108
Records with a blank or unknown race/ethnicity will be assigned to the all students group, even if, for example, the
student is Black, Hispanic, or Native American and would otherwise be assigned to the BHN student group. The
same is true for records that do not accurately reflect students’ status as Economically Disadvantaged (ED) students,
English Learners (EL), and Students with Disabilities (SWD). This highlights the importance of ensuring accurate
student data at the district and school levels before the final day of the testing window.
5.3 Indicators and Calculation Procedures 5.3.1 Calculation Procedures Districts are evaluated on 6 indicators:
3-5 Success Rate
6-8 Success Rate
9-12 success Rate
Chronically Out of School
Graduation Rate
English Language Proficiency Assessment (ELPA)
Districts earn between 0 and 4 points for each goal and indicator for which they are eligible109. District performance
goals and definitions are outlined below:
District Performance Goal Definition
Absolute Performance Percent of students that meet the defined criteria (i.e., the percent of students
who graduate)
AMO Target Yearly targets for improving performance based on prior year results
Value-Added Value a district adds and how that compares to the performance of other districts
in the state
Overall indicator scores average the number of points a district receives for the value-added performance goal
averaged with the best of their absolute performance and AMO targets. For example, a district with an AMO
pathway score of 2, an absolute performance pathway score of 3, and a value-added pathway score of 4 will receive
a final score of 3.5 which reflects the best of absolute and AMO performance (3) averaged with the value-added
score (4).
This process is conducted for all students group first, then repeated for each historically underserved student
group. Final indicator averages weight all students and subgroup indicator averages at 60 percent and 40 percent,
respectively. Final indicator averages are rounded to one decimal place.
For each step identified with a status (all students, student groups, and final district), determination scales will
108 Districts may receive scores for indicators in which they do not have sufficient data for a value-added score so long as they
have sufficient data for both the AMO and absolute performance pathways. 109 All indicators are weighted evenly. Meaning, if a district served only K-8 students, their determination will be based off 5
indicators averaged together.

Page 40 of 70
follow as such:
Scores greater than or equal to 3.1 will be labeled exemplary110.
Scores greater than or equal to 2.1 but less than 3.1 will be labeled advancing.
Scores greater than or equal to 1.1 but less than 2.1 will be labeled satisfactory.
Scores less than 1.1 will be labeled marginal.
Consider the example of the district below.
5.3.1.1 Step 1: All Students Status
Average the value-added score with the higher of the Absolute proficiency and the AMO. Then average all overall
scores.
Indicator Absolute
Proficiency AMO Targets Value-Added
Overall Score
3-5 Success Rate 2 1 2 2
6-8 Success Rate 0 2 0 1
9-12 Success Rate 3 1 3 3
Chronically Out of
School 1 2 0 1
Graduation Rate 2 4 2 3
English Language
Proficiency 3 4 4 4
All Students Status 2.33
Advancing
5.3.1.2 Step 2: Student Group Average
Average the value-added score with the higher of the Absolute proficiency and the AMO. Then average all overall
scores for each of the 4 historically underserved student groups.
Indicator Absolute
Proficiency AMO Targets Value-Added
Overall Score
3-5 Success Rate 1 1 4 2.5
6-8 Success Rate 3 1 2 2.5
9-12 Success Rate 2 0 2 2
Chronically Out of
School 3 1 0 1.5
Graduation Rate 4 1 1 2.5
English Language
Proficiency 1 2 3 2.5
BHN Average 2.25
110 Districts in which all schools are identified as Reward, may also be labeled as Exemplary in the event that the district’s overall
score is not greater than or equal to 3.1.
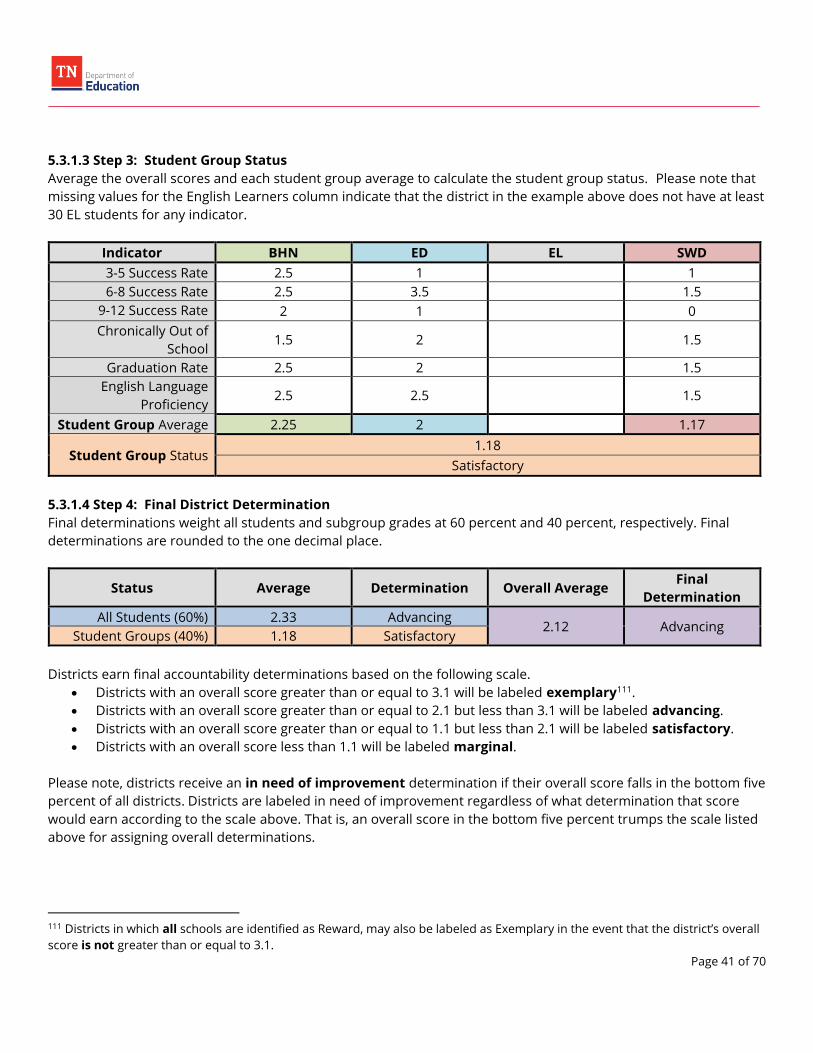
Page 41 of 70
5.3.1.3 Step 3: Student Group Status
Average the overall scores and each student group average to calculate the student group status. Please note that
missing values for the English Learners column indicate that the district in the example above does not have at least
30 EL students for any indicator.
Indicator BHN ED EL SWD
3-5 Success Rate 2.5 1 1
6-8 Success Rate 2.5 3.5 1.5
9-12 Success Rate 2 1 0
Chronically Out of
School 1.5 2 1.5
Graduation Rate 2.5 2 1.5
English Language
Proficiency 2.5 2.5 1.5
Student Group Average 2.25 2 1.17
Student Group Status 1.18
Satisfactory
5.3.1.4 Step 4: Final District Determination
Final determinations weight all students and subgroup grades at 60 percent and 40 percent, respectively. Final
determinations are rounded to the one decimal place.
Status Average Determination Overall Average Final
Determination
All Students (60%) 2.33 Advancing 2.12 Advancing
Student Groups (40%) 1.18 Satisfactory
Districts earn final accountability determinations based on the following scale.
Districts with an overall score greater than or equal to 3.1 will be labeled exemplary111.
Districts with an overall score greater than or equal to 2.1 but less than 3.1 will be labeled advancing.
Districts with an overall score greater than or equal to 1.1 but less than 2.1 will be labeled satisfactory.
Districts with an overall score less than 1.1 will be labeled marginal.
Please note, districts receive an in need of improvement determination if their overall score falls in the bottom five
percent of all districts. Districts are labeled in need of improvement regardless of what determination that score
would earn according to the scale above. That is, an overall score in the bottom five percent trumps the scale listed
above for assigning overall determinations.
111 Districts in which all schools are identified as Reward, may also be labeled as Exemplary in the event that the district’s overall
score is not greater than or equal to 3.1.

Page 42 of 70
5.3.2 Grade Band Success Rate Indicators The Grade Band (3-5, 6-8, 9-12) Success Rate Indicators aim to evaluate districts on their assessment performance
both in terms of student proficiency and growth. Districts will be measured across three pathways, Absolute
performance which identifies the percent of students scoring on track or mastered on the TCAP assessment, AMO
targets, and growth as measured by the composite112 TVAAS levels:113
Points Absolute Performance AMO Value-Added
(All Students and Historically Underserved Student Groups)
4 ≥ 45 Success rate ≥ double AMO target.114 TVAAS level 5 composite
3 35 - 44.9 Success rate ≥ AMO target TVAAS level 4 composite
2 27.5 - 34.9 Upper bound of success rate CI ≥ AMO
target TVAAS level 3 composite
1 20 - 27.4 Upper bound of success rate CI > prior
year success rate TVAAS level 2 composite
0 < 20 Upper bound of success rate CI ≤ prior
year success rate. TVAAS level 1 composite
Additionally, districts that miss the 95 percent minimum TCAP participation rate will receive a score of 0 for all
pathways of the success rate indicator(s) for which they test fewer than 95 percent of the student group and grade
band.
5.3.2 Chronically Out of School Indicator The Chronically Out of School indicator observes students in K-12 identified as chronically absent, as defined in
section 3.6 both in terms of current rate and improvement. Districts will be measured across three pathways:
absolute performance, which will represent the percent of students who are chronically absent, AMO targets, and
the value-added measure which calculates the percent of students who were chronically absent in the prior year
and are not chronically absent in the current year as compared to statewide performance.
Points Absolute Performance AMO Value-Added
(All Students and Historically Underserved Student Groups)
4 ≤ 8 Absenteeism rate ≤ double AMO target top quintile of statewide
performance
3 8 - 11.5 Absenteeism rate ≤ AMO target fourth quintile of statewide
performance
2 11.6 - 16.5 Lower bound of absenteeism CI ≤ AMO
target
third quintile of statewide
performance
1 16.6 - 25 Lower bound of absenteeism CI < Prior
year absenteeism rate
second quintile of statewide
performance
112 For 2019-20 accountability, district TVAAS composites will include the subjects of math and ELA only. 113 TVAAS composites for grades 3-5 will include the better score between composites that include early grades and those that
do not. 114 Please see section 3.7 for more details about AMO target and double AMO target calculations.

Page 43 of 70
Points Absolute Performance AMO Value-Added
(All Students and Historically Underserved Student Groups)
0 > 25 Lower bound of absenteeism CI ≥ prior
year absenteeism rate
bottom quintile of statewide
performance
Districts receive points for each eligible success rate content area for the AMO goal by comparing performance to
AMO targets using the following scale:
5.3.3 Graduation Rate Indicator The Graduation Rate indicator aims to evaluate districts on post-secondary readiness both through graduation rate
and Ready Graduate criteria. Districts will be measured across three pathways: absolute performance, which will
represent the percent of graduates, graduation rate AMO targets, and the value-added measure which calculates
the difference in the district’s percent of Ready Graduates115 to the prior year as compared to statewide
performance.
Points Absolute Performance AMO Value-Added
(All Students and Historically Underserved Student Groups)
4 ≥ 95 Graduation rate ≥ double AMO target top quintile of statewide
performance
3 90 – 94.9 Graduation rate ≥ AMO target fourth quintile of statewide
performance
2 80 - 89.9 Upper bound of graduation rate CI ≥
AMO target.
third quintile of statewide
performance
1 67 – 79.9 Upper bound of graduation rate CI >
prior year graduation rate
second quintile of statewide
performance
0 < 67 Upper bound of graduation rate CI ≤
prior year graduation rate
bottom quintile of statewide
performance
Additionally, districts that miss the 95 percent minimum participation rate for ACT/SAT will receive a score of 0 for
all pathways of the graduation rate indicator for the student group(s) for which the district tested less than 95
percent of graduates.
5.3.4 English Language Proficiency Assessment (ELPA) Indicator The ELPA indictor observes K-12 students’ progress toward language acquisition as performed on WIDA ACCESS.
Districts will be measured across three pathways: absolute performance, which will represent the percent of
students meeting growth standards116, AMO targets, and the value-added goal which calculated the change in the
percent of transitional EL students who score on track or mastered in ELA content areas.
Points Absolute Performance AMO Value-Added
4 ≥ 60 Percent of students meeting growth
standards ≥ double AMO target.
top quintile of statewide
performance
115 Please refer to section 3.5 for more information on ready graduates. 116 Students meeting WIDA Access exit criteria are included as “meeting the growth standard.”
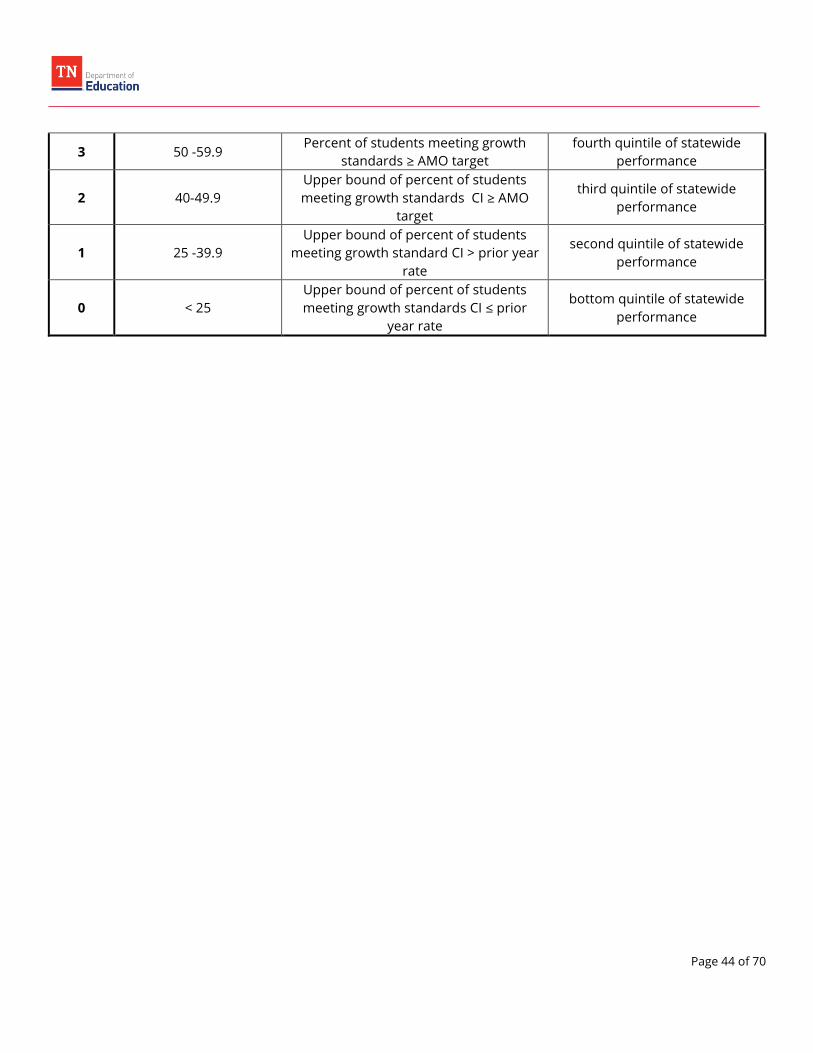
Page 44 of 70
3 50 -59.9 Percent of students meeting growth
standards ≥ AMO target
fourth quintile of statewide
performance
2 40-49.9
Upper bound of percent of students
meeting growth standards CI ≥ AMO
target
third quintile of statewide
performance
1 25 -39.9
Upper bound of percent of students
meeting growth standard CI > prior year
rate
second quintile of statewide
performance
0 < 25
Upper bound of percent of students
meeting growth standards CI ≤ prior
year rate
bottom quintile of statewide
performance

Page 45 of 70
Districts can access the files described in this section from the Accountability application once accountability
determinations are complete. These files include:
TVAAS Files
o TVAAS District Evaluation Composites
o TVAAS School Evaluation Composites
o TVAAS Teacher Evaluation Composites
o TVAAS District Subject-Level Data
o TVAAS School Subject-Level Data
o TVAAS Teacher Subject-Level Data
o TVAAS Student-Level Growth
Student-Level Files
o Student-Level Achievement File
o ACT/SAT Spring Test Day Substitution Student-Level File
District Accountability Files
o District Assessment Data File
o District Accountability Data File
o District Heat Map File
School Accountability Files
o School Assessment Data File
o School Accountability Data File
o School Accountability List File
o School Heat Maps File
English Language Proficiency Assessment Files
o ACCESS District-Level File
o ACCESS School-Level File
o ACCESS Student-Level File
College Entrance Exams Files
o ACT/SAT Graduate Highest Score District-Level File
o ACT/SAT Graduate Highest Score School-Level File
o ACT/SAT Graduate Highest Score Student-Level File
o ACT Retake District-Level File
o ACT Retake School-Level File
o ACT Retake Student-Level File
AMO Files
o District-Level AMO Targets
o School-Level AMO Targets
Chronic Absenteeism Files
o Chronic Absenteeism District-Level File
o Chronic Absenteeism School-Level File
o Chronic Absenteeism Student-Level File
Ready Graduate Files
o Ready Graduate District-Level File
o Ready Graduate School-Level File

Page 46 of 70
o Ready Graduate Student-Level File
Second Grade Assessment Files
o Student-Level File
o School-Level File
o District-Level File
Appendix B lists all accountability files, including a description of each. File layouts are available on the
Accountability application.
6.1 Assessment Data Files Assessment data files display the counts and percentages for each test, grade, subject, and student group. This
includes results that do not factor into accountability calculations. Please note that the counts and percentages
listed in this file detail the results before subject reassignment or ACT substitution rules are applied. Assessment
data files are created for the school, system, and state levels and contain data for up to the three most recent years.
6.2 Accountability Files Accountability files display only the counts and percentages for each grade band, indicator, and student group
included in accountability calculations. These files are created for the school, system, and state levels and contain
data for the two most recent years.
6.3 Final Determination Heat Map Files The final determination district heat map files outline how the district determination was calculated and includes
the following information:
Achievement Pathway
o Displays the breakdown of how all students performed on each indicator and pathway
Student Group Performance
o Displays the breakdown of how individual student groups performed on each indicator and pathway
Final Determination
o Provides final determination status and summarizes each component of the accountability model
Individual Student Groups
o Displays the performance of each student group for each indicator and pathway before the data are
aggregated in the historically underserved student groups pathway
The final school heat map files outline how the school grade was calculated and consists of the following
information:
Achievement indicator
o Displays the breakdown of how the all students and student groups performed on each pathway
Growth indicator
o Displays the breakdown of how the all students and student groups performed on TVAAS
Chronically Out of School indicator
o Displays the breakdown of how the all students and student groups performed on each pathway
English Language Proficiency Assessment indicator
o Displays the breakdown of how the all students and student groups performed on the WIDA ACCESS
exam relative to growth expectations

Page 47 of 70
Graduation Rate indicator (high school only)
o Displays the breakdown of how the all students and student groups performed on each pathway
Ready Graduate indicator (high school only)
o Displays the breakdown of how the all students and student groups performed on each pathway
Final determination
o Provides final grade and summarizes each component of the accountability model
6.4 Student-Level Achievement Files Student-level files contain the scores that are used in accountability determinations for all students, including
scores from the alternate assessment. The student-level files also outline which records changed due to
accountability procedures, such as students whose scores were reassigned using the ACT/SAT sub-score
substitution rules.117
6.5 English Language Proficiency Assessment Files English Language Proficiency Assessment (ELPA) files detail the performance and progress of English learners on
the WIDA ACCESS exam.
6.6 TVAAS Files TVAAS files list composite and subject-level performance at the district, school, and teacher levels and a student-
level growth file.
6.7 Ready Graduate Files Ready Graduate files display the counts and percentages of students who count in accountability calculations as
meeting college and career readiness.
6.8 AMO Files AMO files outline district- and school-level performance targets.
6.9 Chronically Out of School Files Chronically out of school files display counts and percentages of students who count in accountability calculations
as chronically out of school. The student-level file includes absenteeism rates for all students, regardless of whether
they are included in accountability.
117 See section 2.4.1.4 for more details.

Page 48 of 70
Term Definition
ACT American College Testing
AMOs Annual Measurable Objectives
AP Advanced Placement
ASVAB AFQT Armed Services Vocational Aptitude Battery (ASVAB) Armed Forces Qualifying Test (AFQT)
ATSI Additional Targeted Support and Improvement
BHN Black, Hispanic, Native American student group
CIE Cambridge International Examinations
CLEP College Level Examination Program
CSI Comprehensive Support and Improvement
CTE Career Technical Education Schools
DE Dual Enrollment
ED Economically Disadvantaged student group
EIS Education Information System
EL English Learner student group
ELA English language arts
ELPA English language proficiency assessment
EOC End of Course
EPSO Early postsecondary opportunity
ESSA Every Student Succeeds Act (most recent reauthorization of the Elementary and Secondary
Education Act)
FD Functionally Delayed
FTTT First Time Test Taker
IC Industry Certification
IB International Baccalaureate
LDC Local Dual Credit
LEP Limited English Proficiency
LTEL Long-term English learner
RAEL Recently arrived English learner
RI Reports of Irregularity
SAT Scholastic Aptitude Test
SDC Statewide Dual Credit
SIS Student Information System
SWD Students with Disabilities student group
TCAP Tennessee Comprehensive Assessment Program

Page 49 of 70
The department integrates the following data sources containing achievement, enrollment, and demographic data
for accountability calculations.
TCAP achievement data (grades 3-8) come in one file from NCS Pearson Inc. (Pearson)
EOC data (grades 9-12) for fall and spring administrations come in two files from Pearson.
TCAP-Alternative Assessment data come in two files at the end of the academic year.
o One file contains data for ELA and math data for grades 3-11 and comes from the Multi-State
Alternate Assessment (MSAA).
o The other file contains data for science and social studies for grades 3-11 and comes from Pearson.
English Language Proficiency Assessment (ELPA) data come in two files from WIDA at the end of the
academic year.
o One file contains ACCESS data.
o The other file contains Alternate ACCESS data.
TVAAS data come in multiple files. This includes a student-level growth file and teacher-, school-, and
district-level data from SAS.
Graduation cohort data come from the department’s graduation cohort application, which is fed by the
Education Information System (EIS).
Attendance, enrollment, and school calendar data come from EIS and reflect the extracts districts send from
their student information systems (SIS).
Ready Graduate data come from a variety of sources. These sources include testing vendors (e.g., ACT,
College Board, etc.), the Department of Defense, and course code and enrollment information118 from EIS.
o ACT testing data come in four files from ACT.
One file contains data for the spring state testing day from the current year.119
One file contains data for the spring state testing day from the previous year.
The third file includes students’ highest scores in the three years leading up to June of their
self-identified graduation year.
The fourth file contains data from the senior retake day from the current year.
o SAT data come in a single file from the College Board, which includes records from the current year
from both in-school and national day administrations.
o Early postsecondary opportunity course data come from course codes and flags submitted to EIS
through a district’s SIS. EPSO course data include:
Advanced Placement (AP) courses
Cambridge International Examination (CIE) courses
Dual enrollment (DE) courses
International Baccalaureate (IB) courses
Local Dual Credit (LDC) courses
Statewide Dual Credit (SDC) courses
o EPSO examination data include:
AP data, which come from College Board each summer and include test scores from the
previous academic year.
118 A list of early postsecondary course codes can be located in Appendix E. Additionally, a list of industry certification details can
be found on the department’s promoted list. 119 State testing day data from the current year are used for ACT/SAT substitution. Please see section 2.5.1.4 for more details.

Page 50 of 70
CIE data, which are provided on an annual basis from Cambridge International Education.
College Level Examination Program (CLEP) data, which the department receives in one file
from College Board.
International Baccalaureate (IB) data, which come from an annual list of students who
attempt either IB assessments or earn an IB diploma as part of the International
Baccalaureate program.
Statewide Dual Credit (SDC) assessment data, which come from the Early Postsecondary
data system (EPS) and reflect the results of the Online Challenge Exam.
Industry Certification (IC) data, which come from various vendors. Please consult the
department’s promoted list for more information on IC data sources.
A file listing the following types of schools comes from School Directory (SDE).120
o New schools
o Closed schools
o Career and technical education (CTE) schools
o Alternative schools
o Adult schools
o Special education schools
These files contain all records included in accountability calculations. These files may contain other data not used in
accountability.
120 Records from alternative schools will be remanded back to the most recent traditional school in which the student was
enrolled if that school is in the same district as the alternative school at which the student tested. Students will be considered
enrolled for 50 percent of the year if the number of instructional days for which they are enrolled across both the traditional and
alternative school is at least half the greater number of instructional days between the traditional or alternative school. The
department will also contact districts if no prior enrollment in a traditional school can be found.
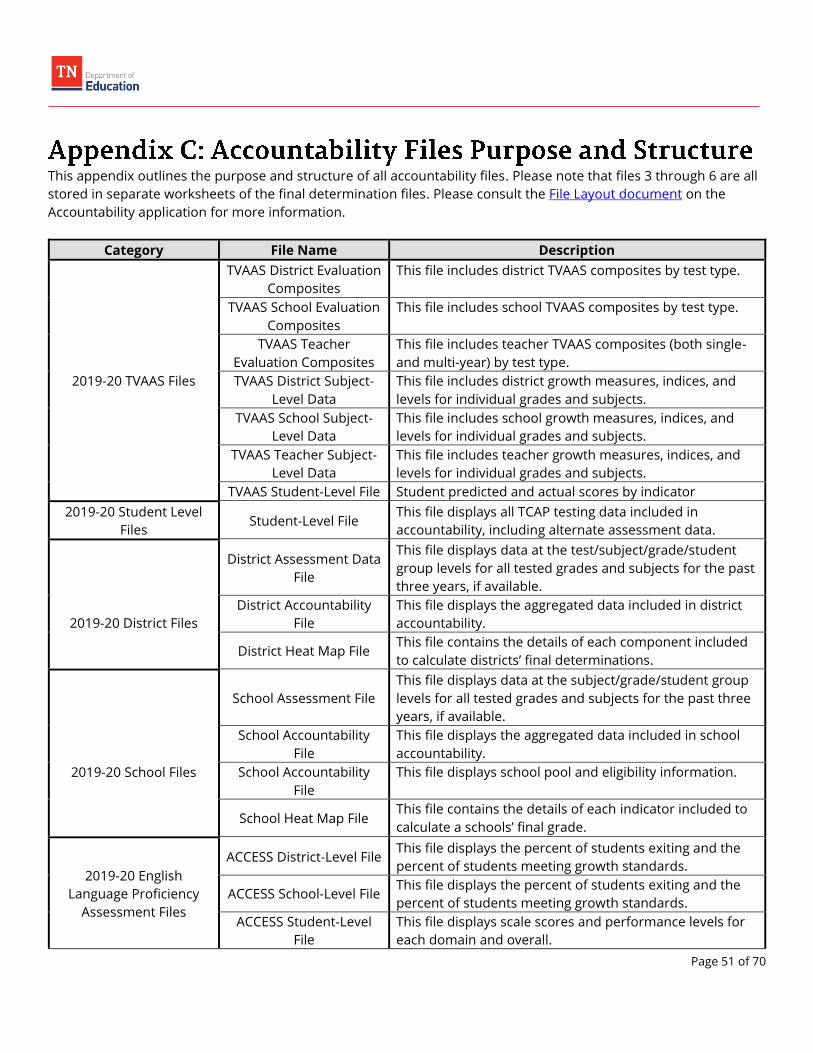
Page 51 of 70
This appendix outlines the purpose and structure of all accountability files. Please note that files 3 through 6 are all
stored in separate worksheets of the final determination files. Please consult the File Layout document on the
Accountability application for more information.
Category File Name Description
2019-20 TVAAS Files
TVAAS District Evaluation
Composites
This file includes district TVAAS composites by test type.
TVAAS School Evaluation
Composites
This file includes school TVAAS composites by test type.
TVAAS Teacher
Evaluation Composites
This file includes teacher TVAAS composites (both single-
and multi-year) by test type.
TVAAS District Subject-
Level Data
This file includes district growth measures, indices, and
levels for individual grades and subjects.
TVAAS School Subject-
Level Data
This file includes school growth measures, indices, and
levels for individual grades and subjects.
TVAAS Teacher Subject-
Level Data
This file includes teacher growth measures, indices, and
levels for individual grades and subjects.
TVAAS Student-Level File Student predicted and actual scores by indicator
2019-20 Student Level
Files Student-Level File
This file displays all TCAP testing data included in
accountability, including alternate assessment data.
2019-20 District Files
District Assessment Data
File
This file displays data at the test/subject/grade/student
group levels for all tested grades and subjects for the past
three years, if available.
District Accountability
File
This file displays the aggregated data included in district
accountability.
District Heat Map File This file contains the details of each component included
to calculate districts’ final determinations.
2019-20 School Files
School Assessment File
This file displays data at the subject/grade/student group
levels for all tested grades and subjects for the past three
years, if available.
School Accountability
File
This file displays the aggregated data included in school
accountability.
School Accountability
File
This file displays school pool and eligibility information.
School Heat Map File This file contains the details of each indicator included to
calculate a schools’ final grade.
2019-20 English
Language Proficiency
Assessment Files
ACCESS District-Level File This file displays the percent of students exiting and the
percent of students meeting growth standards.
ACCESS School-Level File This file displays the percent of students exiting and the
percent of students meeting growth standards.
ACCESS Student-Level
File
This file displays scale scores and performance levels for
each domain and overall.

Page 52 of 70
2019-20 ACT Files
ACT District-Level File
This file contains average composite and subscore
information for the highest scores graduates earned, as
well as the percent of students meeting readiness
benchmarks.
ACT School-Level File
This file contains average composite and subscore
information for the highest scores graduates earned, as
well as the percent of students meeting readiness
benchmarks.
ACT Student-Level File This file contains composite and subscore information for
the highest scores graduates earned.
ACT Retake District-Level
File
This file contains average composite and subscore
information for the scores students earned, as well as the
percent of students meeting readiness benchmarks for
the fall retake opportunity.
ACT Retake School-Level
File
This file contains average composite and subscore
information for the scores students earned, as well as the
percent of students meeting readiness benchmarks for
the fall retake opportunity.
ACT Retake Student
Level File
This file contains composite and subscore information for
students who participated in the fall retake opportunity.
2020-21 AMO Files
District-Level AMO
Targets
This file contains targets for reducing the percent of
students who are not meeting standards.
School-Level AMO
Targets
This file contains targets for reducing the percent of
students who are not meeting standards.
2019-20 Chronic
Absenteeism Files
Chronic Absenteeism
District-Level File
This file details the percentages of students who are
chronically absent by student group.
Chronic Absenteeism
School-Level File
This file details the percentages of students who are
chronically absent by student group.
Chronic Absenteeism
Student-Level File
This file includes students’ absenteeism rates. Students
may appear in the file who are not included in
accountability calculations (e.g., enrolled less than 50
percent of the year).
2019-20 Ready Graduate
Files
Ready Graduate District-
Level File
This file contains the percentage of students who are
identified as Ready Graduates by meeting detailed criteria
by student group for the district.
Ready Graduate School-
Level File
This file contains the percentage of students who are
identified as Ready Graduates by meeting detailed criteria
by student group for each school.
Ready Graduate
Student-Level File
This file details the students who are identified as Ready
Graduates by meeting detailed criteria by student group.
2019-20 Second Grade
Second Grade
Assessment District-
Level File
This file details districts’ performance on the second grade
assessment.
Second Grade This file details schools’ performance on the second grade

Page 53 of 70
Assessment Files Assessment School-Level
File
assessment.
Second Grade
Assessment Student-
Level File
This file details student performance on the second grade
assessment.

Page 54 of 70
The equation below is used to calculate confidence intervals (CIs) for each student group and subject.
ci95 = round
(
100
(
n
n + Z952 (p + (
Z952
2n) ± Z95√
p(1 − p)
n+Z95
2
4n2)
)
)
In the equation above, n represents the number of students with a valid test, Z95 = 1.96 from a standard normal
distribution to have a 95 percent confidence interval, and p is the percentage of on track or mastered (or below)
students.

Page 55 of 70
Percentile rankings identify the school or student ranking, as defined below. Rankings identify the placement of a
district, school, or student’s performance relative to other districts, schools, or students. Please see below for
specific details pertaining to these calculation procedures.
E.1: Rankings A percentile rank is defined as the percentage of schools or districts with an equal or lesser score for the same
year/student group/grade pool (as applicable). Listed below are the steps used to calculate a percentile rank
1. Determine the number of eligible schools/districts according to the eligibility criteria listed in this protocol.
2. Reverse rank schools/districts so that schools with lower scores have a higher rank value121.
3. Divide each school’s/district’s rank by the number of eligible schools/districts. The percentile rank is
calculated using the following formula:
Percentile Rank = school rank
# of eligible schools∗ 100
In the event of a tie, the following business rule is applied: schools get the best possible rank amongst schools. For
example:
School Score Rank
A 100 1
B 98 2
C 98 2
D 92 4
E.2: Student Rankings Student percentile rankings reported in the Student-level Assessment file will follow the calculation procedures
outlined by SAS in the TVAAS technical document.
121 This step only applies to Priority and ATSI designations.
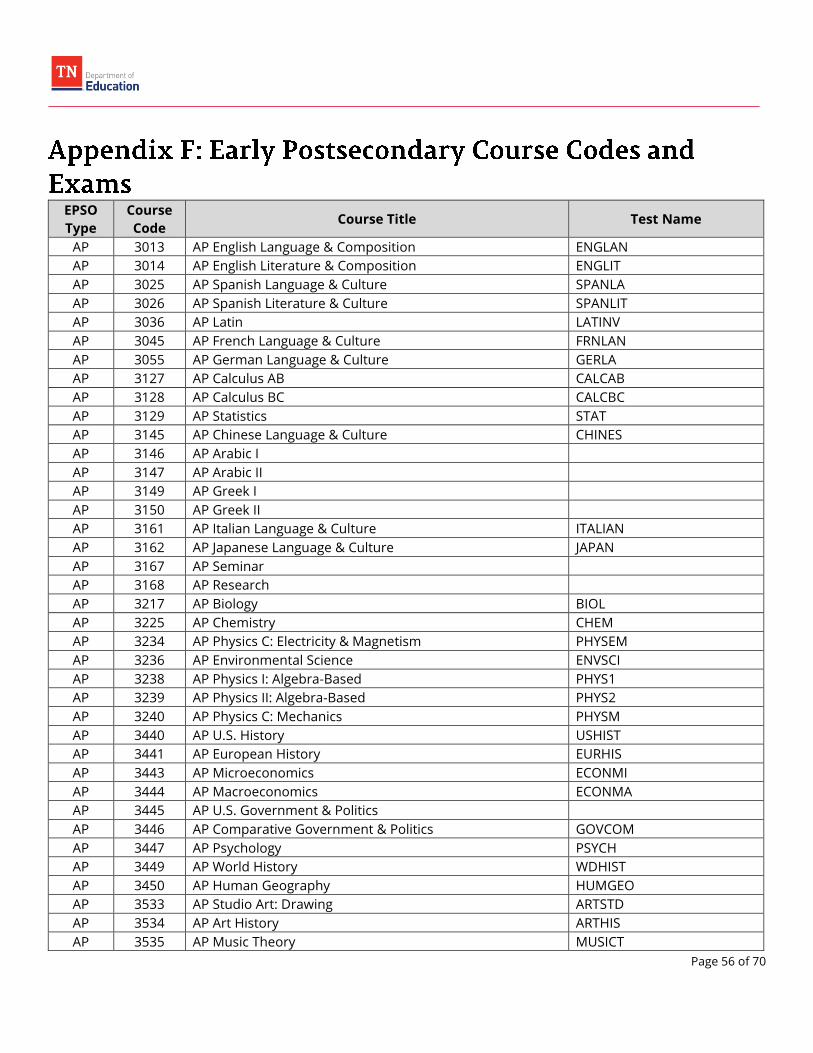
Page 56 of 70
EPSO
Type
Course
Code Course Title Test Name
AP 3013 AP English Language & Composition ENGLAN
AP 3014 AP English Literature & Composition ENGLIT
AP 3025 AP Spanish Language & Culture SPANLA
AP 3026 AP Spanish Literature & Culture SPANLIT
AP 3036 AP Latin LATINV
AP 3045 AP French Language & Culture FRNLAN
AP 3055 AP German Language & Culture GERLA
AP 3127 AP Calculus AB CALCAB
AP 3128 AP Calculus BC CALCBC
AP 3129 AP Statistics STAT
AP 3145 AP Chinese Language & Culture CHINES
AP 3146 AP Arabic I
AP 3147 AP Arabic II
AP 3149 AP Greek I
AP 3150 AP Greek II
AP 3161 AP Italian Language & Culture ITALIAN
AP 3162 AP Japanese Language & Culture JAPAN
AP 3167 AP Seminar
AP 3168 AP Research
AP 3217 AP Biology BIOL
AP 3225 AP Chemistry CHEM
AP 3234 AP Physics C: Electricity & Magnetism PHYSEM
AP 3236 AP Environmental Science ENVSCI
AP 3238 AP Physics I: Algebra-Based PHYS1
AP 3239 AP Physics II: Algebra-Based PHYS2
AP 3240 AP Physics C: Mechanics PHYSM
AP 3440 AP U.S. History USHIST
AP 3441 AP European History EURHIS
AP 3443 AP Microeconomics ECONMI
AP 3444 AP Macroeconomics ECONMA
AP 3445 AP U.S. Government & Politics
AP 3446 AP Comparative Government & Politics GOVCOM
AP 3447 AP Psychology PSYCH
AP 3449 AP World History WDHIST
AP 3450 AP Human Geography HUMGEO
AP 3533 AP Studio Art: Drawing ARTSTD
AP 3534 AP Art History ARTHIS
AP 3535 AP Music Theory MUSICT

Page 57 of 70
EPSO
Type
Course
Code Course Title Test Name
AP 3544 AP Studio Art: 3-D Drawing ART3D
AP 3545 AP Studio Art: 2-D Design ARTS2
AP 3634 AP Computer Science Principles COMSCIP
AP 3635 AP Computer Science A COMSCA
CIE 4138 CIE Mathematics AS & A Level CAMBRIDGE MATHEMATICS
CIE 4139 CIE Mathematics w/ Mechanics 1 AS Level CAMBRIDGE MATHEMATICS
CIE 4140 CIE Mathematics w/ Mechanics 2 A Level CAMBRIDGE MATHEMATICS
CIE 4141 CIE Mathematics w/ Probability & Statistics I AS Level CAMBRIDGE MATHEMATICS
CIE 4142 CIE Mathematics w/ Probability & Statistics II A Level CAMBRIDGE MATHEMATICS
CIE 4143 CIE Mathematics Further AS & A Level CAMBRIDGE MATHEMATICS
CIE 4144 CIE Mathematics w/ Mechanics & Probability & Statistics AS
Level
CAMBRIDGE MATHEMATICS
CIE 4150 CIE Biology AS & A Level CAMBRIDGE BIOLOGY
CIE 4151 CIE Chemistry AS & A Level CAMBRIDGE CHEMISTRY
CIE 4152 CIE Physics AS & A Level
CIE 4153 CIE Physical Science AS & A Level
CIE 4154 CIE Environmental Management AS & A Level CAMBRIDGE
ENVIRONMENTAL
MANAGEMENT
CIE 4155 CIE Chemistry A Level CAMBRIDGE CHEMISTRY
CIE 4156 CIE Biology A Level CAMBRIDGE BIOLOGY
CIE 4157 CIE Physics A Level
CIE 4158 Pre-CIE Physical Education IGCSE Level
CIE 4159 CIE Physical Education AS & A Level
CIE 4160 CIE Physical Education 2 A Level
CIE 4164 CIE German Language AS Level
CIE 4165 CIE German Literature AS Level
CIE 4166 CIE German A Level
CIE 4170 CIE Spanish Language AS Level
CIE 4171 CIE Spanish Literature AS Level
CIE 4172 CIE Spanish A Level
CIE 4176 CIE French Language AS Level
CIE 4177 CIE French Literature AS Level
CIE 4178 CIE French A Level
CIE 4182 CIE Chinese Language AS Level
CIE 4183 CIE Chinese Literature AS Level
CIE 4184 CIE Chinese A Level
CIE 4188 CIE Japanese Language AS Level
CIE 4190 CIE Economics I AS Level
CIE 4191 CIE Economics II A Level
CIE 4193 CIE Geography I AS Level
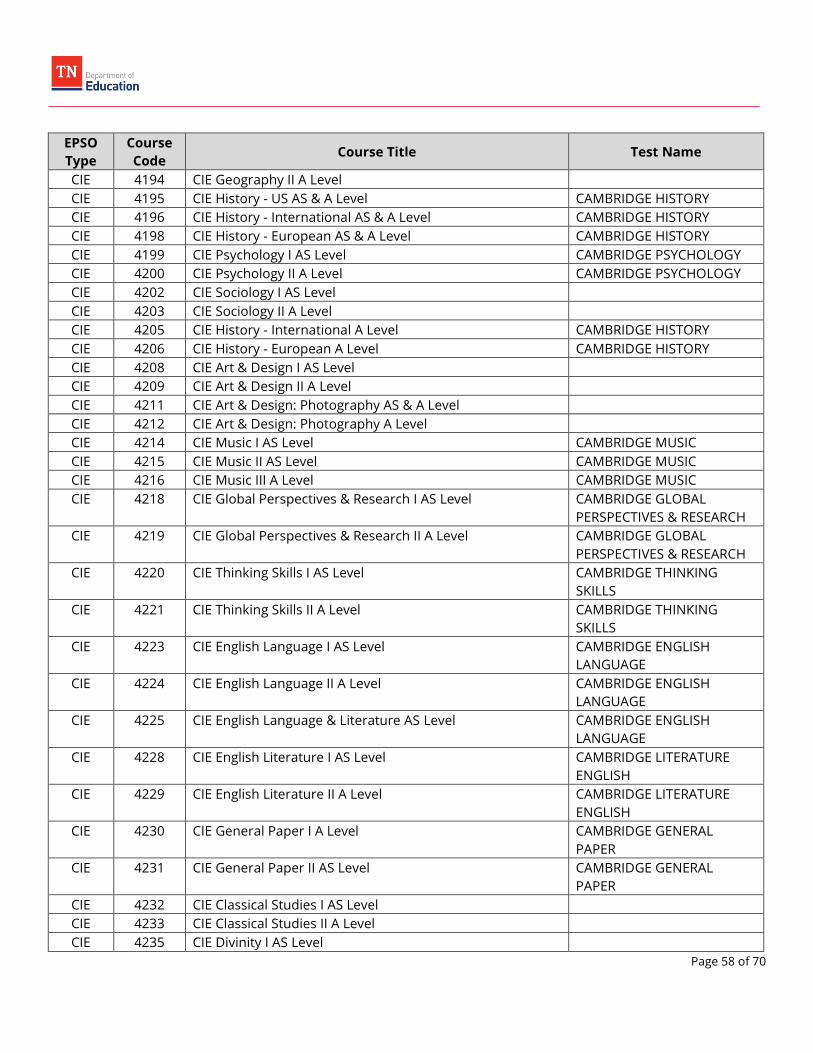
Page 58 of 70
EPSO
Type
Course
Code Course Title Test Name
CIE 4194 CIE Geography II A Level
CIE 4195 CIE History - US AS & A Level CAMBRIDGE HISTORY
CIE 4196 CIE History - International AS & A Level CAMBRIDGE HISTORY
CIE 4198 CIE History - European AS & A Level CAMBRIDGE HISTORY
CIE 4199 CIE Psychology I AS Level CAMBRIDGE PSYCHOLOGY
CIE 4200 CIE Psychology II A Level CAMBRIDGE PSYCHOLOGY
CIE 4202 CIE Sociology I AS Level
CIE 4203 CIE Sociology II A Level
CIE 4205 CIE History - International A Level CAMBRIDGE HISTORY
CIE 4206 CIE History - European A Level CAMBRIDGE HISTORY
CIE 4208 CIE Art & Design I AS Level
CIE 4209 CIE Art & Design II A Level
CIE 4211 CIE Art & Design: Photography AS & A Level
CIE 4212 CIE Art & Design: Photography A Level
CIE 4214 CIE Music I AS Level CAMBRIDGE MUSIC
CIE 4215 CIE Music II AS Level CAMBRIDGE MUSIC
CIE 4216 CIE Music III A Level CAMBRIDGE MUSIC
CIE 4218 CIE Global Perspectives & Research I AS Level CAMBRIDGE GLOBAL
PERSPECTIVES & RESEARCH
CIE 4219 CIE Global Perspectives & Research II A Level CAMBRIDGE GLOBAL
PERSPECTIVES & RESEARCH
CIE 4220 CIE Thinking Skills I AS Level CAMBRIDGE THINKING
SKILLS
CIE 4221 CIE Thinking Skills II A Level CAMBRIDGE THINKING
SKILLS
CIE 4223 CIE English Language I AS Level CAMBRIDGE ENGLISH
LANGUAGE
CIE 4224 CIE English Language II A Level CAMBRIDGE ENGLISH
LANGUAGE
CIE 4225 CIE English Language & Literature AS Level CAMBRIDGE ENGLISH
LANGUAGE
CIE 4228 CIE English Literature I AS Level CAMBRIDGE LITERATURE
ENGLISH
CIE 4229 CIE English Literature II A Level CAMBRIDGE LITERATURE
ENGLISH
CIE 4230 CIE General Paper I A Level CAMBRIDGE GENERAL
PAPER
CIE 4231 CIE General Paper II AS Level CAMBRIDGE GENERAL
PAPER
CIE 4232 CIE Classical Studies I AS Level
CIE 4233 CIE Classical Studies II A Level
CIE 4235 CIE Divinity I AS Level

Page 59 of 70
EPSO
Type
Course
Code Course Title Test Name
CIE 4236 CIE Divinity II A Level
CIE 4239 CIE Accounting 1 AS Level
CIE 4240 CIE Accounting 2 A Level
CIE 4242 CIE Design & Textile AS Level
CIE 4243 CIE Design & Textile A Level
CIE 4244 CIE Art & Design: Fashion & Design AS Level
CIE 4245 CIE Art & Design: Textiles AS Level
CIE 4247 CIE Computing 1 AS Level
CIE 4248 CIE Computing 2 A Level
CIE 4249 CIE Applied ICT 1 AS Level
CIE 4250 CIE Applied ICT 2 A Level
CIE 4252 CIE Design & Technology 1 AS Level
CIE 4253 CIE Design & Technology 2 A Level
CIE 4255 CIE Environmental Management AS Level CAMBRIDGE
ENVIRONMENTAL
MANAGEMENT
CIE 4256 CIE Food Studies 1 AS Level
CIE 4257 CIE Food Studies 2 A Level
CIE 4260 CIE Business Studies 1 AS Level
CIE 4261 CIE Business Studies 2 A Level
CIE 4263 CIE Travel & Tourism 1 AS Level CAMBRIDGE TRAVEL AND
TOURISM
CIE 4264 CIE Travel & Tourism 2 A Level CAMBRIDGE TRAVEL AND
TOURISM
CIE 6260 CIE Spanish First Language AS Level CAMBRIDGE FIRST
LANGUAGE SPANISH
CIE 9825 CIE Computer Science 1 AS Level
DE 4000 Dual Enrollment Science
DE 4001 Dual Enrollment Human Anatomy & Physiology I
DE 4002 Dual Enrollment Human Anatomy & Physiology II
DE 4003 Dual Enrollment Biology I
DE 4004 Dual Enrollment Biology II
DE 4005 Dual Enrollment General Chemistry I
DE 4006 Dual Enrollment General Chemistry II
DE 4007 Dual Enrollment Non-Calculus Based Physics I
DE 4008 Dual Enrollment Non-Calculus Based Physics II
DE 4009 Dual Enrollment Calculus Based Physics I
DE 4010 Dual Enrollment Calculus Based Physics II
DE 4011 Dual Enrollment Mathematics
DE 4012 Dual Enrollment College Algebra
DE 4013 Dual Enrollment Probability & Statistics/Elementary

Page 60 of 70
EPSO
Type
Course
Code Course Title Test Name
Statistics
DE 4014 Dual Enrollment Finite Mathematics
DE 4015 Dual Enrollment Calculus I
DE 4016 Dual Enrollment Calculus II
DE 4017 Dual Enrollment Calculus III
DE 4018 Dual Enrollment Visual & Performing Arts
DE 4019 Dual Enrollment Art History I/Survey of Art History I
DE 4020 Dual Enrollment Art History II/Survey of Art History II
DE 4021 Dual Enrollment Music Appreciation
DE 4022 Dual Enrollment Speech/Fundamentals of Speech
Communication
DE 4023 Dual Enrollment Introduction to Theatre
DE 4024 Dual Enrollment Social Studies
DE 4025 Dual Enrollment Microeconomics
DE 4026 Dual Enrollment Macroeconomics
DE 4027 Dual Enrollment Sociology
DE 4028 Dual Enrollment Personal Finance
DE 4029 Dual Enrollment Psychology
DE 4030 Dual Enrollment American Government
DE 4031 Dual Enrollment Survey of World History I
DE 4032 Dual Enrollment Survey of World History II
DE 4033 Dual Enrollment Survey of American History I
DE 4034 Dual Enrollment Survey of American History II
DE 4035 Dual Enrollment Survey of Western Civilization I
DE 4036 Dual Enrollment Survey of Western Civilization II
DE 4037 Dual Enrollment World Regional Geography
DE 4038 Dual Enrollment English Language Arts
DE 4039 Dual Enrollment English Composition I
DE 4040 Dual Enrollment English Composition II
DE 4041 Dual Enrollment Survey of American Literature
DE 4042 Dual Enrollment Survey of British Literature
DE 4043 Dual Enrollment Survey of World Literature
DE 4044 Dual Enrollment Survey of Literature of the Western World
DE 4045 Dual Enrollment Foreign Language
DE 4046 Dual Enrollment French
DE 4047 Dual Enrollment German
DE 4048 Dual Enrollment Spanish
DE 4049 Dual Enrollment Latin
DE 4050 Dual Enrollment Italian
DE 4051 Dual Enrollment Russian
DE 4052 Dual Enrollment Japanese
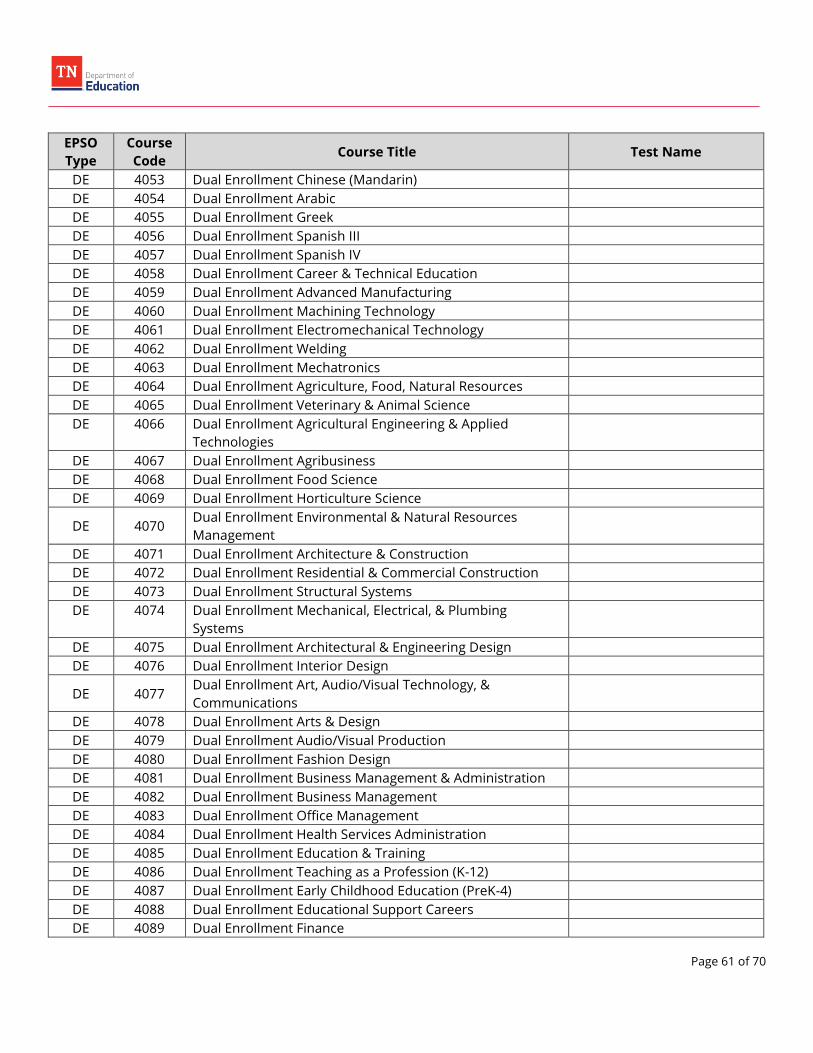
Page 61 of 70
EPSO
Type
Course
Code Course Title Test Name
DE 4053 Dual Enrollment Chinese (Mandarin)
DE 4054 Dual Enrollment Arabic
DE 4055 Dual Enrollment Greek
DE 4056 Dual Enrollment Spanish III
DE 4057 Dual Enrollment Spanish IV
DE 4058 Dual Enrollment Career & Technical Education
DE 4059 Dual Enrollment Advanced Manufacturing
DE 4060 Dual Enrollment Machining Technology
DE 4061 Dual Enrollment Electromechanical Technology
DE 4062 Dual Enrollment Welding
DE 4063 Dual Enrollment Mechatronics
DE 4064 Dual Enrollment Agriculture, Food, Natural Resources
DE 4065 Dual Enrollment Veterinary & Animal Science
DE 4066 Dual Enrollment Agricultural Engineering & Applied
Technologies
DE 4067 Dual Enrollment Agribusiness
DE 4068 Dual Enrollment Food Science
DE 4069 Dual Enrollment Horticulture Science
DE 4070 Dual Enrollment Environmental & Natural Resources
Management
DE 4071 Dual Enrollment Architecture & Construction
DE 4072 Dual Enrollment Residential & Commercial Construction
DE 4073 Dual Enrollment Structural Systems
DE 4074 Dual Enrollment Mechanical, Electrical, & Plumbing
Systems
DE 4075 Dual Enrollment Architectural & Engineering Design
DE 4076 Dual Enrollment Interior Design
DE 4077 Dual Enrollment Art, Audio/Visual Technology, &
Communications
DE 4078 Dual Enrollment Arts & Design
DE 4079 Dual Enrollment Audio/Visual Production
DE 4080 Dual Enrollment Fashion Design
DE 4081 Dual Enrollment Business Management & Administration
DE 4082 Dual Enrollment Business Management
DE 4083 Dual Enrollment Office Management
DE 4084 Dual Enrollment Health Services Administration
DE 4085 Dual Enrollment Education & Training
DE 4086 Dual Enrollment Teaching as a Profession (K-12)
DE 4087 Dual Enrollment Early Childhood Education (PreK-4)
DE 4088 Dual Enrollment Educational Support Careers
DE 4089 Dual Enrollment Finance

Page 62 of 70
EPSO
Type
Course
Code Course Title Test Name
DE 4090 Dual Enrollment Accounting
DE 4091 Dual Enrollment Banking & Finance
DE 4092 Dual Enrollment Government & Public Administration
DE 4093 Dual Enrollment Public Management & Administration
DE 4094 Dual Enrollment Health Science
DE 4095 Dual Enrollment Biotechnology Research
DE 4096 Dual Enrollment Public Health
DE 4097 Dual Enrollment Diagnostic Services
DE 4098 Dual Enrollment Health Informatics
DE 4099 Dual Enrollment Nursing Services
DE 4100 Dual Enrollment Emergency Services
DE 4101 Dual Enrollment Therapeutic Services
DE 4102 Dual Enrollment Exercise Physiology
DE 4103 Dual Enrollment Hospitality & Tourism
DE 4104 Dual Enrollment Culinary Arts
DE 4105 Dual Enrollment Hospitality & Tourism Management
DE 4106 Dual Enrollment Human Services
DE 4107 Dual Enrollment Childhood Development Services
DE 4108 Dual Enrollment Social Health Services
DE 4109 Dual Enrollment Dietetics & Nutrition
DE 4110 Dual Enrollment Cosmetology
DE 4111 Dual Enrollment Barbering
DE 4112 Dual Enrollment Information Technology
DE 4113 Dual Enrollment Coding
DE 4114 Dual Enrollment Networking Systems
DE 4115 Dual Enrollment Web Design
DE 4116 Dual Enrollment Law, Public Safety, Corrections, & Security
DE 4117 Dual Enrollment Law Enforcement Services
DE 4118 Dual Enrollment Fire Management Services
DE 4119 Dual Enrollment Legal & Correction Services
DE 4120 Dual Enrollment Marketing
DE 4121 Dual Enrollment Marketing Management
DE 4122 Dual Enrollment Entrepreneurship
DE 4123 Dual Enrollment STEM
DE 4124 Dual Enrollment Engineering
DE 4125 Dual Enrollment Technology
DE 4126 Dual Enrollment STEM Education
DE 4127 Dual Enrollment Transportation, Distribution, & Logistics
DE 4128 Dual Enrollment Automotive Maintenance & Light Repair
DE 4129 Dual Enrollment Automotive Collision Repair
DE 4130 Dual Enrollment Aviation Flight

Page 63 of 70
EPSO
Type
Course
Code Course Title Test Name
DE 4131 Dual Enrollment Aviation Maintenance
DE 4132 Dual Enrollment Distribution & Logistics
DE 4133 Dual Enrollment Diesel Technology
DE 4266 Dual Enrollment Exercise Science
DE 4267 Dual Enrollment Health & Wellness
DE 4268 Dual Enrollment Physical Education
DE 4272 Dual Enrollment Spanish II
DE 4273 Dual Enrollment French II
DE 4274 Dual Enrollment Latin II
DE 4272 Dual Enrollment Spanish II
DE 4273 Dual Enrollment French II
DE 4274 Dual Enrollment Latin II
DE 6189 Dual Enrollment Geographic Information Systems
DE 6190 Dual Enrollment Human Resources Management
DE 6191 Dual Enrollment Cybersecurity
DE 6192 Dual Enrollment Educational Therapy & Support
IB 2907 IB Language A: Literature I SL ENGLISHA
IB 2908 IB Language A: Language & Literature I SL
IB 3004 IB English I HL
IB 3006 IB English II HL
IB 3011 IB English III
IB 3016 IB Language SSL
IB 3018 IB English Literature SL/HL ENGLIT
IB 3029 IB Spanish I HL SPANISHB
IB 3039 IB French I SL
IB 3049 IB French I HL
IB 3056 IB German III SL/HL GERMANB
IB 3065 IB Language B Ab Initio I SL
IB 3066 IB Language B Ab Initio II SL
IB 3069 IB Russian III SL/HL
IB 3079 IB Theory of Knowledge I
IB 3086 IB Latin III SL/HL LATIN
IB 3089 IB Language B I SL/HL
IB 3093 IB Chinese III SL/HL
IB 3094 IB Arabic IV SL/HL
IB 3095 IB Japanese III SL/HL
IB 3096 IB Language B II SL/HL
IB 3104 IB Mathematics I SL IBMATH
IB 3105 IB Mathematics II HL IBMATH
IB 3106 IB Mathematics II SL/HL IBMATH
IB 3109 IB Computer Science I HL COMPSCI

Page 64 of 70
EPSO
Type
Course
Code Course Title Test Name
IB 3110 IB Computer Science II HL COMPSCI
IB 3137 IB Pre-Calculus
IB 3138 IB Mathematics I HL IBMATH
IB 3140 IB Math Studies I SL MATHSTUDY
IB 3141 IB Math Studies II SL MATHSTUDY
IB 3154 IB Spanish V SL/HL SPANISHB
IB 3155 IB Arabic III SL/HL
IB 3156 IB French V SL/HL
IB 3157 IB German IV SL/HL GERMANB
IB 3158 IB Latin IV SL/HL LATIN
IB 3159 IB Russian IV SL/HL
IB 3160 IB Chinese IV SL/HL
IB 3163 IB German A Language & Literature SL GERMANA
IB 3164 IB German A Language & Literature II SL/HL GERMANA
IB 3165 IB German V SL/HL GERMANB
IB 3184 IB Japanese IV SL/HL
IB 3215 IB Biology I HL BIO
IB 3218 IB Biology II HL BIO
IB 3223 IB Chemistry IV SL/HL CHEM
IB 3227 IB Biology I SL BIO
IB 3228 IB Chemistry I SL CHEM
IB 3229 IB Physics I HL PHYSICS
IB 3232 IB Physics II HL PHYSICS
IB 3244 IB Chemistry II HL CHEM
IB 3281 IB Ecosystems and Societies II SL
IB 3282 IB Environmental Systems & Societies II SL ENVIROSYS
IB 3283 IB Geography II HL GEOG
IB 3400 IB History of the Americas I SL HIST
IB 3406 IB History of the Americas I HL HIST
IB 3409 IB History of the Americas II HL HIST
IB 3413 IB History of the Americas I SL/HL HIST
IB 3414 IB History of the Americas II SL/HL HIST
IB 3434 IB Psychology I HL PSYCH
IB 3436 IB Psychology II HL PSYCH
IB 3437 IB World Arts & Cultures I SL WORLDSTUD
IB 3438 IB Economics I SL ECON
IB 3439 IB Geography I HL GEOG
IB 3453 IB Theory of Knowledge II
IB 3454 IB Music I SL MUSIC
IB 3455 IB Psychology I SL PSYCH
IB 3457 IB History, Route 2, Americas SL/HL I HIST

Page 65 of 70
EPSO
Type
Course
Code Course Title Test Name
IB 3458 IB History, Route 2, Americas HL II HIST
IB 3459 IB History, Route 2, Americas HL II HIST
IB 3460 IB History, Route 2, Europe HL I HIST
IB 3461 IB History, Route 2, Europe HL II HIST
IB 3462 IB History, Route 2, Europe SL/HL HIST
IB 3463 IB History, Route 1, Europe I HL HIST
IB 3464 IB History, Route 1, Europe I SL HIST
IB 3465 IB History, Route 1, Europe II HL HIST
IB 3466 IB Environmental Systems and Societies I SL ENVIROSYS
IB 3467 IB Biology II HL I BIO
IB 3468 IB Chemistry I HL CHEM
IB 3469 IB Physics I SL PHYSICS
IB 3470 IB Sports, Exercise, & Health Science I SL SPORTEXSCI
IB 3471 IB Sports, Exercise, & Health Science II SL SPORTEXSCI
IB 3472 IB Business and Management I HL BUSMAN
IB 3473 IB Business and Management II HL BUSMAN
IB 3474 IB Language B French Ab Initio I SL FRENCHB
IB 3475 IB Language B French Ab Initio II SL FRENCHB
IB 3476 IB Language B Spanish Ab Initio I SL SPANISHB
IB 3477 IB Language B Spanish Ab Initio II SL SPANISHB
IB 3478 IB Music II SL MUSIC
IB 3479 IB French IV SL/HL
IB 3480 IB Spanish IV SL/HL SPANISHB
IB 3481 IB History, Route 2, Americas SL HIST
IB 3482 IB Theatre Arts SL THEATRE
IB 3483 IB English IV HL
IB 3485 IB English I SL ENGLISHA
IB 3486 IB Visual Arts SL VISUALART
IB 3487 IB Theatre Arts I SL THEATRE
IB 3488 IB Theatre Arts II SL THEATRE
IB 3508 IB Music I SL/HL MUSIC
IB 3509 IB Visual Arts SL-A VISUALART
IB 3510 IB Visual Arts SL-B VISUALART
IB 3511 IB Visual Arts HL VISUALART
IB 3512 IB Film II HL FILM
IB 3513 IB Film I HL FILM
IB 3518 IB Music II SL/HL MUSIC
IB 3537 IB Visual Arts I SL/HL VISUALART
IB 3538 IB Visual Arts I HL VISUALART
IB 3539 IB Visual Arts II HL VISUALART
IB 3546 IB Theatre Arts I HL THEATRE
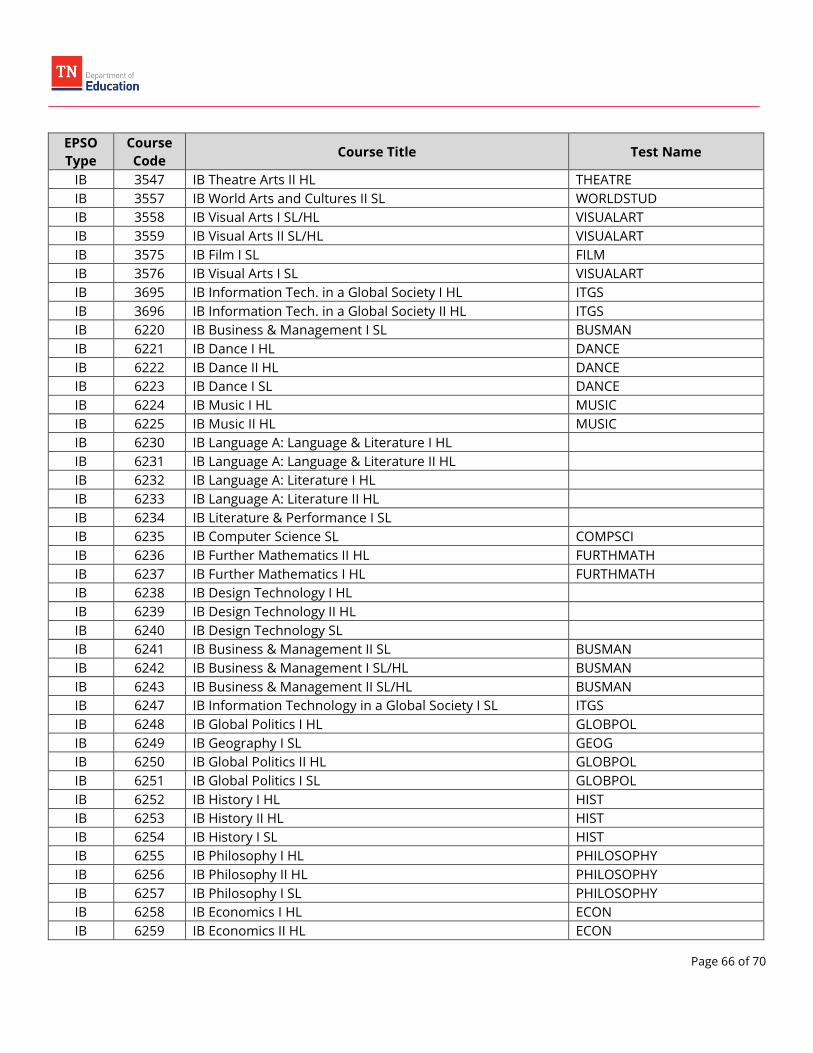
Page 66 of 70
EPSO
Type
Course
Code Course Title Test Name
IB 3547 IB Theatre Arts II HL THEATRE
IB 3557 IB World Arts and Cultures II SL WORLDSTUD
IB 3558 IB Visual Arts I SL/HL VISUALART
IB 3559 IB Visual Arts II SL/HL VISUALART
IB 3575 IB Film I SL FILM
IB 3576 IB Visual Arts I SL VISUALART
IB 3695 IB Information Tech. in a Global Society I HL ITGS
IB 3696 IB Information Tech. in a Global Society II HL ITGS
IB 6220 IB Business & Management I SL BUSMAN
IB 6221 IB Dance I HL DANCE
IB 6222 IB Dance II HL DANCE
IB 6223 IB Dance I SL DANCE
IB 6224 IB Music I HL MUSIC
IB 6225 IB Music II HL MUSIC
IB 6230 IB Language A: Language & Literature I HL
IB 6231 IB Language A: Language & Literature II HL
IB 6232 IB Language A: Literature I HL
IB 6233 IB Language A: Literature II HL
IB 6234 IB Literature & Performance I SL
IB 6235 IB Computer Science SL COMPSCI
IB 6236 IB Further Mathematics II HL FURTHMATH
IB 6237 IB Further Mathematics I HL FURTHMATH
IB 6238 IB Design Technology I HL
IB 6239 IB Design Technology II HL
IB 6240 IB Design Technology SL
IB 6241 IB Business & Management II SL BUSMAN
IB 6242 IB Business & Management I SL/HL BUSMAN
IB 6243 IB Business & Management II SL/HL BUSMAN
IB 6247 IB Information Technology in a Global Society I SL ITGS
IB 6248 IB Global Politics I HL GLOBPOL
IB 6249 IB Geography I SL GEOG
IB 6250 IB Global Politics II HL GLOBPOL
IB 6251 IB Global Politics I SL GLOBPOL
IB 6252 IB History I HL HIST
IB 6253 IB History II HL HIST
IB 6254 IB History I SL HIST
IB 6255 IB Philosophy I HL PHILOSOPHY
IB 6256 IB Philosophy II HL PHILOSOPHY
IB 6257 IB Philosophy I SL PHILOSOPHY
IB 6258 IB Economics I HL ECON
IB 6259 IB Economics II HL ECON

Page 67 of 70
EPSO
Type
Course
Code Course Title Test Name
IB 6261 IB Arabic I HL
IB 6262 IB Arabic II HL
IB 6263 IB Arabic I SL
IB 6264 IB Classical Language I HL
IB 6265 IB Classical Language II HL
IB 6266 IB Classical Language I SL
IB 6267 IB French II HL
IB 6268 IB German I HL GERMANB
IB 6269 IB German II HL GERMANB
IB 6270 IB German I SL GERMANB
IB 6271 IB Japanese I HL
IB 6272 IB Japanese II HL
IB 6273 IB Japanese I SL
IB 6277 IB Latin I HL LATIN
IB 6278 IB Latin II HL LATIN
IB 6279 IB Latin I SL LATIN
IB 6280 IB Russian I HL
IB 6281 IB Russian II HL
IB 6282 IB Russian I SL
IB 6283 IB Spanish II HL SPANISHB
IB 6284 IB Spanish I SL SPANISHB
IB 6320 IB Arabic II SL
IB 6321 IB Arabic I SL/HL
IB 6322 IB Arabic II SL/HL
IB 6323 IB Biology II SL BIO
IB 6324 IB Biology I SL/HL BIO
IB 6325 IB Biology II SL/HL BIO
IB 6326 IB Biology III SL/HL BIO
IB 6327 IB Biology III SL BIO
IB 6328 IB Biology III HL BIO
IB 6329 IB Chemistry II SL CHEM
IB 6330 IB Chemistry I SL/HL CHEM
IB 6331 IB Chemistry II SL/HL CHEM
IB 6332 IB Chemistry III SL/HL CHEM
IB 6333 IB Chemistry SL III CHEM
IB 6334 IB Chemistry HL III CHEM
IB 6335 IB Classical Language I SL/HL
IB 6336 IB Classical Language II SL/HL
IB 6337 IB Classical Language II SL
IB 6338 IB Computer Science I SL/HL COMPSCI
IB 6339 IB Computer Science II SL/HL COMPSCI

Page 68 of 70
EPSO
Type
Course
Code Course Title Test Name
IB 6340 IB Computer Science II SL COMPSCI
IB 6341 IB Dance II SL DANCE
IB 6342 IB Dance I SL/HL DANCE
IB 6343 IB Dance II SL/HL DANCE
IB 6344 IB Design Technology II SL
IB 6345 IB Design Technology I SL/HL
IB 6346 IB Design Technology II SL/HL
IB 6347 IB Economics II SL ECON
IB 6348 IB Economics I SL/HL ECON
IB 6349 IB Economics II SL/HL ECON
IB 6350 IB English II SL
IB 6351 IB English I SL/HL ENGLISHA
IB 6352 IB English II SL/HL
IB 6353 IB Film II SL FILM
IB 6354 IB Film I SL/HL FILM
IB 6355 IB Film II SL/HL FILM
IB 6356 IB French II SL
IB 6357 IB French I SL/HL
IB 6358 IB French II SL/HL
IB 6359 IB Geography II SL GEOG
IB 6360 IB Geography I SL/HL GEOG
IB 6361 IB Geography II SL/HL GEOG
IB 6362 IB German A Language and Literature I SL/HL GERMANA
IB 6363 IB German II SL GERMANB
IB 6364 IB German I SL/HL GERMANB
IB 6365 IB German II SL/HL GERMANB
IB 6366 IB Global Politics II SL GLOBPOL
IB 6367 IB Global Politics I SL/HL GLOBPOL
IB 6368 IB Global Politics II SL/HL GLOBPOL
IB 6369 IB History of the Americas II SL HIST
IB 6370 IB History II SL HIST
IB 6371 IB History I SL/HL HIST
IB 6372 IB History II SL/HL HIST
IB 6373 IB History, Route 1, Europe II SL HIST
IB 6374 IB History, Route 1, Europe I SL/HL HIST
IB 6375 IB History, Route 1, Europe II SL/HL HIST
IB 6376 IB Information Technology in a Global Society II SL ITGS
IB 6377 IB Information Technology in a Global Society I SL/HL ITGS
IB 6378 IB Information Technology in a Global Society II SL/HL ITGS
IB 6379 IB Japanese II SL
IB 6380 IB Japanese I SL/HL
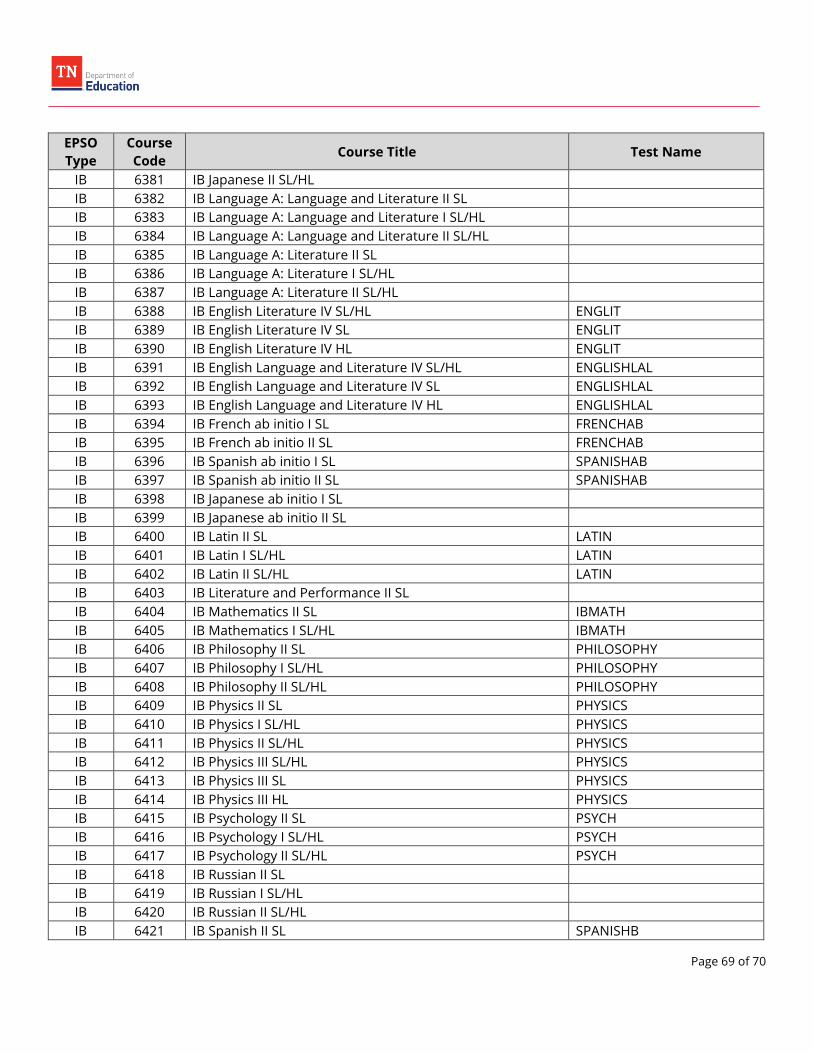
Page 69 of 70
EPSO
Type
Course
Code Course Title Test Name
IB 6381 IB Japanese II SL/HL
IB 6382 IB Language A: Language and Literature II SL
IB 6383 IB Language A: Language and Literature I SL/HL
IB 6384 IB Language A: Language and Literature II SL/HL
IB 6385 IB Language A: Literature II SL
IB 6386 IB Language A: Literature I SL/HL
IB 6387 IB Language A: Literature II SL/HL
IB 6388 IB English Literature IV SL/HL ENGLIT
IB 6389 IB English Literature IV SL ENGLIT
IB 6390 IB English Literature IV HL ENGLIT
IB 6391 IB English Language and Literature IV SL/HL ENGLISHLAL
IB 6392 IB English Language and Literature IV SL ENGLISHLAL
IB 6393 IB English Language and Literature IV HL ENGLISHLAL
IB 6394 IB French ab initio I SL FRENCHAB
IB 6395 IB French ab initio II SL FRENCHAB
IB 6396 IB Spanish ab initio I SL SPANISHAB
IB 6397 IB Spanish ab initio II SL SPANISHAB
IB 6398 IB Japanese ab initio I SL
IB 6399 IB Japanese ab initio II SL
IB 6400 IB Latin II SL LATIN
IB 6401 IB Latin I SL/HL LATIN
IB 6402 IB Latin II SL/HL LATIN
IB 6403 IB Literature and Performance II SL
IB 6404 IB Mathematics II SL IBMATH
IB 6405 IB Mathematics I SL/HL IBMATH
IB 6406 IB Philosophy II SL PHILOSOPHY
IB 6407 IB Philosophy I SL/HL PHILOSOPHY
IB 6408 IB Philosophy II SL/HL PHILOSOPHY
IB 6409 IB Physics II SL PHYSICS
IB 6410 IB Physics I SL/HL PHYSICS
IB 6411 IB Physics II SL/HL PHYSICS
IB 6412 IB Physics III SL/HL PHYSICS
IB 6413 IB Physics III SL PHYSICS
IB 6414 IB Physics III HL PHYSICS
IB 6415 IB Psychology II SL PSYCH
IB 6416 IB Psychology I SL/HL PSYCH
IB 6417 IB Psychology II SL/HL PSYCH
IB 6418 IB Russian II SL
IB 6419 IB Russian I SL/HL
IB 6420 IB Russian II SL/HL
IB 6421 IB Spanish II SL SPANISHB
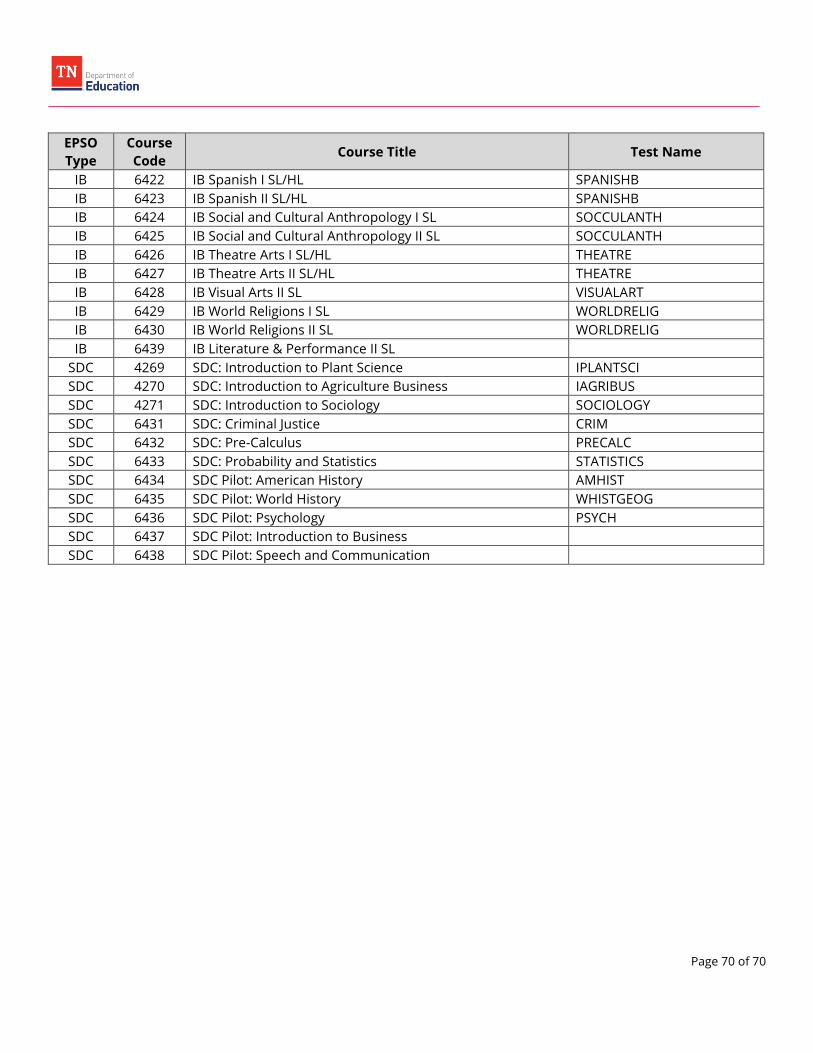
Page 70 of 70
EPSO
Type
Course
Code Course Title Test Name
IB 6422 IB Spanish I SL/HL SPANISHB
IB 6423 IB Spanish II SL/HL SPANISHB
IB 6424 IB Social and Cultural Anthropology I SL SOCCULANTH
IB 6425 IB Social and Cultural Anthropology II SL SOCCULANTH
IB 6426 IB Theatre Arts I SL/HL THEATRE
IB 6427 IB Theatre Arts II SL/HL THEATRE
IB 6428 IB Visual Arts II SL VISUALART
IB 6429 IB World Religions I SL WORLDRELIG
IB 6430 IB World Religions II SL WORLDRELIG
IB 6439 IB Literature & Performance II SL
SDC 4269 SDC: Introduction to Plant Science IPLANTSCI
SDC 4270 SDC: Introduction to Agriculture Business IAGRIBUS
SDC 4271 SDC: Introduction to Sociology SOCIOLOGY
SDC 6431 SDC: Criminal Justice CRIM
SDC 6432 SDC: Pre-Calculus PRECALC
SDC 6433 SDC: Probability and Statistics STATISTICS
SDC 6434 SDC Pilot: American History AMHIST
SDC 6435 SDC Pilot: World History WHISTGEOG
SDC 6436 SDC Pilot: Psychology PSYCH
SDC 6437 SDC Pilot: Introduction to Business
SDC 6438 SDC Pilot: Speech and Communication


![Nankana Sahib [updated 22nd Feb]](https://img.dokumen.tips/doc/110x75/54550b0ab1af9f92088b4643/nankana-sahib-updated-22nd-feb.jpg)


