Embed Size (px)
Citation preview
(2007) 115–127www.elsevier.com/locate/yqres
Quaternary Research 67
Last glacial maximum equilibrium-line altitude and paleo-temperaturereconstructions for the Cordillera de Mérida, Venezuelan Andes
Nathan D. Stansell a,⁎, Pratigya J. Polissar b, Mark B. Abbott a
a Department of Geology and Planetary Science, University of Pittsburgh, Pittsburgh, PA 15260, USAb Department of Geosciences, The Pennsylvania State University, University Park, PA 16802, USA
Received 1 July 2005Available online 5 October 2006
Abstract
The pattern and magnitude of glacier equilibrium-line altitude (ELA) lowerings in the tropics during the last glacial maximum (LGM) aretopics of current debate. In the northern tropics, paleo-ELA data are particularly limited, inhibiting the ability to make regional and large-scalepaleoclimatic inferences. To improve these records, nine paleo-glaciers in the Venezuelan Andes were reconstructed based on field observations,aerial photographs, satellite imagery and high-resolution digital topographic data. Paleo-glacier equilibrium-line altitudes (ELAs) were estimatedusing the accumulation-area ratio (AAR) and the area-altitude balance ratio (AABR) methods. During the local LGM in Venezuela (∼22,750 to19,960 cal yr BP), ELAs were ∼850 to 1420 m lower than present. Local LGM temperatures were are at least 8.8±2°C cooler than today based ona combined energy and mass-balance equation to account for an ELA lowering. This is greater than estimates using an atmospheric lapse ratecalculation, which yields a value of 6.4±1°C cooler. The paleo-glacial data from the Venezuelan Andes support other published records thatindicate the northern tropics experienced a greater ELA lowering and possibly a greater cooling than the Southern Hemisphere tropics during theLGM.© 2006 University of Washington. All rights reserved.
Keywords: Northern hemisphere tropics; Climate change; Tropical glacier mass-balance
Introduction
The CLIMAP project reconstruction of tropical sea surfacetemperatures (SSTs) has led to extensive debate about thedegree of atmospheric cooling that took place in the tropicsduring the last glacial maximum (LGM). CLIMAP (CLIMAP,1976, 1981) proposed that tropical SSTs were 1° to 3°C coolerduring the LGM. However, glacial-geological evidence sug-gests that higher elevations in the tropics experienced muchgreater cooling (e.g. Porter, 2001). New proxies and re-evaluation of the CLIMAP data has resolved some of thediscrepancy (Mix et al., 1999). However, this has not resolvedthe fundamental differences between LGM estimates of SSTand high-altitude tropical temperatures. Understanding thisdiscrepancy has implications for climate modeling, particularly
⁎ Corresponding author. Fax: +1 412 624 3914.E-mail address: [email protected] (N.D. Stansell).
0033-5894/$ - see front matter © 2006 University of Washington. All rights reservdoi:10.1016/j.yqres.2006.07.005
for determining the vertical structure of the troposphere andwater vapor feedbacks during the LGM (Betts and Ridgeway,1992; Broecker, 1997).
There is considerable controversy regarding the interpreta-tion of changes in tropical glacial extent during the LGM. Thesechanges are commonly summarized by the fluctuations in theequilibrium-line altitude (ELA, the dividing line between aglacier's accumulation and ablation areas). It has recently beenargued that reconstructed tropical LGM ELA lowerings of900 m or more may be anomalously large due to localenhancing factors such as shading by valley walls, debris cover,or orographically controlled precipitation patterns and shouldtherefore be used with caution for paleoclimatic inferences(Smith et al., 2005). This is contrary to Porter's (2001) detailedsynthesis, which shows evidence that during the LGM a largenumber of tropical ELA values were 800 to 1000 m lower thantoday. Recent reports indicate that ELAs during the LGM wereup to∼1500 m lower in the northern tropics (Mark et al., 2005).However, the data used by Mark et al. (2005) for Venezuela
ed.

116 N.D. Stansell et al. / Quaternary Research 67 (2007) 115–127
were based on poorly defined glacial-geologic data and paleo-ELA values. Here, LGM ELA values for nine individual paleo-glaciers in the Venezuelan Andes were investigated in order tobetter understand the limits of tropical LGM glaciation and toreduce ambiguity in paleo-ELA values caused by local factors.The magnitude of high-elevation tropical cooling was theninvestigated by reconstructing temperature change in theVenezuelan Andes during the LGM. The associated paleo-temperature values were determined using a combined energyand mass-balance equation, which provides a more compre-hensive estimate of cooling than commonly used atmosphericlapse rate calculations.
Background
Timing of the LGM
The globally averaged LGM is centered at ∼21,000 cal yrBP; however, the timing of the LGM in specific regions hasbeen found to lead or lag the CLIMAP global average by up toseveral thousand years (e.g., Mann and Hamilton, 1995; Lowellet al., 1995; Denton et al., 1999; Seltzer et al., 2002; Smith et al.,2005). In the Venezuelan Andes, the local LGM occurredbetween 22,750 and 19,960 cal yr BP (Schubert and Rinaldi,1987). During this period, glaciers covered ∼200 km2 ofsurface area and extended to elevations as low as 2900 m(Schubert and Clapperton, 1990).
Glacier extent and climatic change
The relationship between glacier coverage and climatechange is a challenging issue in paleoclimatology. Using theELA as a measure of glacier extent, it is possible to model theresponse of modern glaciers to climate change (Hastenrath,1984, 1989; Ames and Francou, 1995; Francou et al., 1995;Kaser, 1995; Kaser and Noggler, 1996; Oerlemans, 2001; Kaserand Osmaston, 2002). However, the climate change associatedwith alpine glaciations during the LGM is difficult to gagebecause the associated meteorological conditions are not wellconstrained. Therefore, glacial geologists commonly rely onsimple atmospheric lapse rate calculations to estimate thetemperature change responsible for an ELA lowering. Thesecalculations do not accurately represent the energy exchange atthe glacier surface and ignore the effects of changes inaccumulation (Seltzer, 1994). As an alternative, models thatcombine energy and mass-balance equations may be used inorder to reconstruct the temperature change associated with anELA lowering (Kuhn, 1989; Seltzer, 1994). In addition to theatmospheric temperature lapse rate, these models take intoconsideration the effects of vertical gradients in precipitationand humidity, and allow for secular changes in accumulationand solar radiation.
Differences between tropical and temperate glaciers
The mass-balance profiles of glaciers are controlled by ratesof accumulation and ablation along the surface of a glacier and
vary depending upon the climate regime. For instance, glaciersin the tropics are differentiated from temperate ones becausethey are affected by the annual migration of the IntertropicalConvergence Zone (ITCZ) and experience greater diurnal thanannual temperature variation (Kaser, 1995; Kaser and Noggler,1996). Further, inner tropical glaciers receive precipitation year-round and are most sensitive to changes in temperature (Kaser,2001). Outer tropical glaciers experience nearly constanttemperature year-round but precipitation is strongly seasonal.Therefore, outer tropical glaciers have an annual mass-balancethat is seasonal and sensitive to variations in both precipitationand temperature (Kaser and Georges, 1999).
The climate of the Venezuelan Andes is intermediatebetween the inner and the outer tropics because this regionexperiences seasonal precipitation combined with high humid-ity throughout the year (Azocar and Monasterio, 1980). Theseconditions play an important role in the mass-balance processbecause humid air inhibits latent heat loss through sublimationand promotes melting. Melting is a faster and more efficientablation process than sublimation because it requires lessenergy. High ablation rates reduce the overall glacier surfacearea below the equilibrium-line that is needed to balanceaccumulation. As a result, a substantial part of a humid tropicalglacier's surface area is maintained in the accumulation zoneand the equilibrium-line is situated near the base of the glacier(Kaser and Osmaston, 2002).
Study area
This study focuses on the Cordillera de Mérida of theVenezuelan Andes, located between 8.5 and 9°N at elevationsabove 2900 m (Fig. 1). Three geographic sub-regions werestudied that have different aspects and span an orographicprecipitation gradient. From southeast to northwest, theseregions are: (1) the southern Sierra de Santo Domingo, (2) thenorthern Sierra de Santo Domingo and (3) the Paramo dePiedras Blancas.
Modern climate
Moisture in northern South America is primarily derivedfrom Atlantic Ocean evaporation. Easterly trade winds transportthis moisture into the interior of the continent. In the MéridaAndes, circulation patterns and steep topography combine toform strong east-to-west precipitation and cloud-cover gradi-ents. Diurnal patterns of circulation and cloudiness have beenshown to contribute to an asymmetry in precipitation andglaciation for other tropical South American and African regions(e.g. Hastenrath, 1985; Mölg et al., 2003). This diurnal pattern isobserved in the Mérida Andes, where cloud cover is minimalduring the morning hours and increases throughout the day. Inthe Sierra de Santo Domingo, the east-facing slopes receive highsolar radiation, whereas afternoon cloudiness reduces theamount of radiation reaching the west-facing slopes. In theParamo de Piedras Blancas, conditions are drier than in the SantoDomingo region and cloud cover is minimal throughout themajority of the day.

Figure 1. (A) Location map of the Cordillera de Mérida, Venezuela. (B) Averageannual precipitation (mm/yr) for select areas, shaded relief image of theCordillera de Mérida and index map of reconstructed glaciers: (1) Las Viraviras,(2) Cerro Los Pantanos, (3) El Balcon, (4) Michurao, (5) Mucubají, (6) Negra,(7) Llano del Trigo, (8) Filo Los Pantanos, (9) Granates. Precipitation values(white boxes) are greatest on southeast-facing slopes in the study area anddecrease on northeast-facing slopes. The black boxes represent the threegeographic sub-regions used in this study.
117N.D. Stansell et al. / Quaternary Research 67 (2007) 115–127
The climate of the Mérida Andes is cold and humidthroughout the year (Azocar and Monasterio, 1980). Precipita-tion is controlled by the position and intensity of the ITCZ,which is linked to the seasonal cycle of solar declination.Precipitation patterns have a bimodal annual distribution atlower elevations near Mérida (1498 m), with peaks in May–June and September–November and a minimum in July–August (Bradley et al., 1991). A shift to a unimodal pre-cipitation regime occurs at elevations above Mérida, where thewet season occurs from April–November and peaks in June(Pulwarty et al., 1998).
Table 1Precipitation data from the Cordillera de Mérida, Venezuela
Station Lat(°N)
Lon(°W)
Alt.(m)
Average monthly precipitation (mm
Jan Feb Mar Apr
Barintas1 8.80 70.80 550 41 49 83 247Mucubají2,3 8.80 70.83 3650 19 15 26 104P. Aguila3 8.87 70.80 4118 18 17 29 75Merida1 8.60 71.18 1498 47 48 64 167P. Espejo4 8.58 71.17 4765 15 17 38 85
Source: (1) Global Historical Climatology Network, (2) Bradley et al. (1991), (3) M
The regional pattern of precipitation can be determined fromthe available station data (Table 1). The closest station to thesouthern Sierra de Santo Domingo has a similar aspect andreceives ∼2650 mm/yr of precipitation. The elevation (550 m)of this station is lower than the study area (3000 m) whereprecipitation is probably lower. Adjusting for elevation usingthe precipitation gradient from Pulwarty et al. (1998), theprecipitation for the southern Sierra de Santo Domingo region isprobably∼1600 mm/yr. The Mucubají precipitation data record∼970 mm/yr and represent the northern Sierra de SantoDomingo. Pico Aguila is representative of the Paramo dePiedras Blancas and records an average precipitation of∼790 mm/yr. The data for Pico Aguila were adapted fromMonasterio and Reyes (1980) and Monasterio (1986) and mustbe evaluated carefully because collection times and techniqueswere not specified. East of Piedras Blancas, station datarecorded 1190 mm/yr of precipitation for the Paramo de LaCulata (Schubert and Valastro, 1974), but monthly values arenot available.
Temperature in the Cordillera de Mérida is typical of the lowlatitudes and shows little seasonal variability but a substantialdiurnal freeze–thaw cycle. Daily temperatures vary as much as20°C (Schubert and Clapperton, 1990) and greatly exceed thetotal annual variation. National Center for EnvironmentalPrediction (NCEP) data indicate that the free-atmospherelapse rate is ∼0.55°C/100 m for this region of the Andes(Kalnay et al., 1996). Environmental lapse rates based on stationdata from the Mérida Andes range from 0.4° to 0.7°C/100 m,with an average of 0.6°C/100 m (Salgado-Labouriau, 1979;Bradley et al., 1991).
Modern and past glaciation of the Venezuelan Andes
Glaciers in Venezuela are currently restricted to PicosBolivar (5002 m), Humboldt (4942 m) and Bonpland(4839 m). These cirque glaciers cover less than ∼2 km2 andextend down to elevations of ∼4450 m. Glaciers at theselocations have been continuously retreating during historicaltimes (Schubert, 1984, 1998) and are currently not inequilibrium with the modern climate.
There is abundant evidence for more extensive glaciercoverage in the Cordillera de Mérida during the LGM and it isestimated that glaciers covered approximately 200 km2
(Schubert and Clapperton, 1990). Schubert and Rinaldi(1987) concluded that the local LGM for Venezuela occurred
)
May Jun Jul Aug Sep Oct Nov Dec Year
332 347 331 337 310 316 182 73 2647101 153 149 124 110 95 51 21 969101 105 105 97 95 95 36 17 790243 162 119 142 194 263 201 86 173797 80 54 75 89 81 56 30 717
onasterio and Reyes (1980), (4) Pulwarty et al. (1998).

118 N.D. Stansell et al. / Quaternary Research 67 (2007) 115–127
between ∼22,750 and 19,960 cal yr BP based on radiocarbondating of interbedded peat deposits in a 30-m-thick glacio-fluvial sequence in the northern Santo Domingo region. Theassociated glaciation produced extensive glacial-geomorphicfeatures, including pronounced moraine systems (Schubert,1974).
Previous research has identified principal moraines at twolevels: a lower level between 2600 and 2800 m and an upperlevel between 2900/3000 and 3500 m (Schubert, 1970, 1974,1992; Giegengack and Grauch, 1973; Schubert and Valastro,1974; Schubert and Rinaldi, 1987; Schubert and Clapperton,
Figure 2. Venezuela LGM reconstructed glaciers. The base map was contoured basedon SRTM data at a 50-m interval. Paleo-glaciers were grouped by geographic sub-regDomingo receives the greatest precipitation in the study site whereas the Paramo de
1990). The lower level is characterized by weathered tillcovered by abundant vegetation, whereas the upper level ischaracterized by fresh, well-preserved till forming prominentridges. The lower levels appear to date to∼81,000 yr (Mahaneyet al., 2000). Schubert (1974) concluded that the upper levelrepresents the last major local glacial advance, which he termedthe late Pleistocene Mérida glaciation. Age control for LGMdeposits is best constrained for the N. Santo Domingo regionand glaciers presented in this report are assumed to becontemporaneous to the LGM based on Schubert's (1974,1987) investigations.
on published maps at a 40-m interval. Paleo-glacier surface contours were basedion, separated by aspect and precipitation amounts. The southern Sierra de SantoPiedras Blancas receives the least.

119N.D. Stansell et al. / Quaternary Research 67 (2007) 115–127
Methods
Mapping and surface reconstruction of paleo-glaciers
Schubert (1987) mapped and identified late Pleistoceneglacial features in the Mérida Andes using photographs from theCartografía Nacional aerial photograph mission of 1952. Thesemaps were digitized on a smaller scale for this project. Becauseaerial photographs are susceptible to planimetric distortions andare limited in spatial coverage, Advanced Spaceborne ThermalEmission and Reflection Radiometer (ASTER) data were alsoused for digital mapping. Each ASTER scene can be used toproduce false-color composite images with ∼15-m resolutionover a broad spatial area.
Spatial information and elevation data used for contouringwere derived from Shuttle Radar Topography Mission (SRTM)data. These data were processed by the SRTM ground dataprocessing system at the Jet Propulsion Laboratory (JPL) andwere post-processed by the National Imagery and Mapping
Table 2Spatial data and LGM ELA values for the Sierra Nevada de Mérida, Venezuela
Paleo-glaciername
Location(DD)
HeadwallContour(m)
TerminusContour(m)
τb: avg.shear stress(kPa)
BalanceRatio(BR)
CalculatedLGM ELA(m asl)
Paramo de Piedras Blancas a, b
Las Viraviras 8.78°N 4200 3900 126 5 403070.94°W 10 4010
15 4000Cerro Los 8.80°N 4300 3600 103 5 3900Pantanos 70.93°W 10 3855
15 3830El Balcón 8.83°N 4200 3700 92 5 3930
70.85°W 10 389015 3880
Average 3930
Northern Sierra de Santo Domingob, c
Mucubají 8.79°N 4550 3350 97 5 371070.82°W 10 3670
15 3640Negra 8.78°N 4500 3200 83 5 3725
70.82°W 10 362015 3560
Michurao 8.73°N 4150 3250 83 5 365070.87°W 10 3610
15 3590Average 3640
Southern Sierra de Santo Domingoa,b
Filo Los 8.70°N 3700 3200 123 5 3505Pantanos 70.75°W 10 3460
15 3435Granates 8.73°N 3650 3000 143 5 3300
70.73°W 10 326015 3230
Llano del 8.67°N 3650 2950 105 5 3265Trigo 70.85°W 10 3230
15 3210Average 3320a Modern ELA minumum values calculated using a freezing height of 4700 m.b Modern ELA maximum values calculated using a freezing height of 4860 m.c Minimum ELA values for the northern Sierra de Santo Domingo were estimated
Agency (NIMA). Elevation values are presented in meters andreferenced to the WGS84 geoid. Digital elevation models(DEMs) with 3 arc-second resolution (∼90 m) for SouthAmerica have been derived from SRTM data and weredownloaded from the JPL. DEMs were imported into ArcGIS®9.0 software for spatial analyses.
Paleo-glaciers were reconstructed in valleys with straightfor-ward geometries and well preserved paleo-glacial landforms toensure accurate mapping. In each sub-region, three glaciers werereconstructed to increase the signal/noise ratio. This samplingscheme was used in an attempt to minimize the importance oflocal variables, such as wind speed, precipitation and cloudiness,and maximize the signal of regional parameters by reconstruct-ing multiple glaciers. In addition, reconstructing glaciers fromdifferent regions allows for characterization of the regionalpaleo-ELA gradient and comparison with modern observations.A transect of paleo-glacial valleys was studied, from the wetsoutheast-facing slope of the Sierra de Santo Domingo to thedrier Paramo de Piedras Blancas.
Accumulation–Area Ratio(AAR)
Modern ELA(minimumestimate)
Modern ELA(maximumestimate2)
ELA lowering(Δ ELA) min
ELA lowering(Δ ELA) max
0.77 4880 5040 −850 −10100.82 4880 5040 −870 −10300.84 4880 5040 −880 −10400.76 4880 5040 −980 −11400.83 4880 5040 −1025 −11850.85 4880 5040 −1050 −12100.74 4880 5040 −950 −11100.83 4880 5040 −990 −11500.84 4880 5040 −1000 −1160
−960 −1120
0.66 4670 4950 −960 −12400.73 4625 4950 −955 −12800.78 4610 4950 −970 −13100.77 4620 4950 −895 −12250.81 4625 4950 −1005 −13300.85 4615 4950 −1055 −13900.75 4610 4950 −960 −13000.84 4610 4950 −1000 −13400.87 4600 4950 −1010 −1360
−980 −1310
0.68 4470 4630 −965 −11250.76 4470 4630 −1010 −11700.82 4470 4630 −1035 −11950.73 4470 4630 −1170 −13300.78 4470 4630 −1210 −13700.82 4470 4630 −1240 −14000.73 4470 4630 −1205 −13650.81 4470 4630 −1240 −14000.86 4470 4630 −1260 −1420
−1150 −1310
using the existing glaciers on Pico Bolivar (Polissar, 2005).
120 N.D. Stansell et al. / Quaternary Research 67 (2007) 115–127
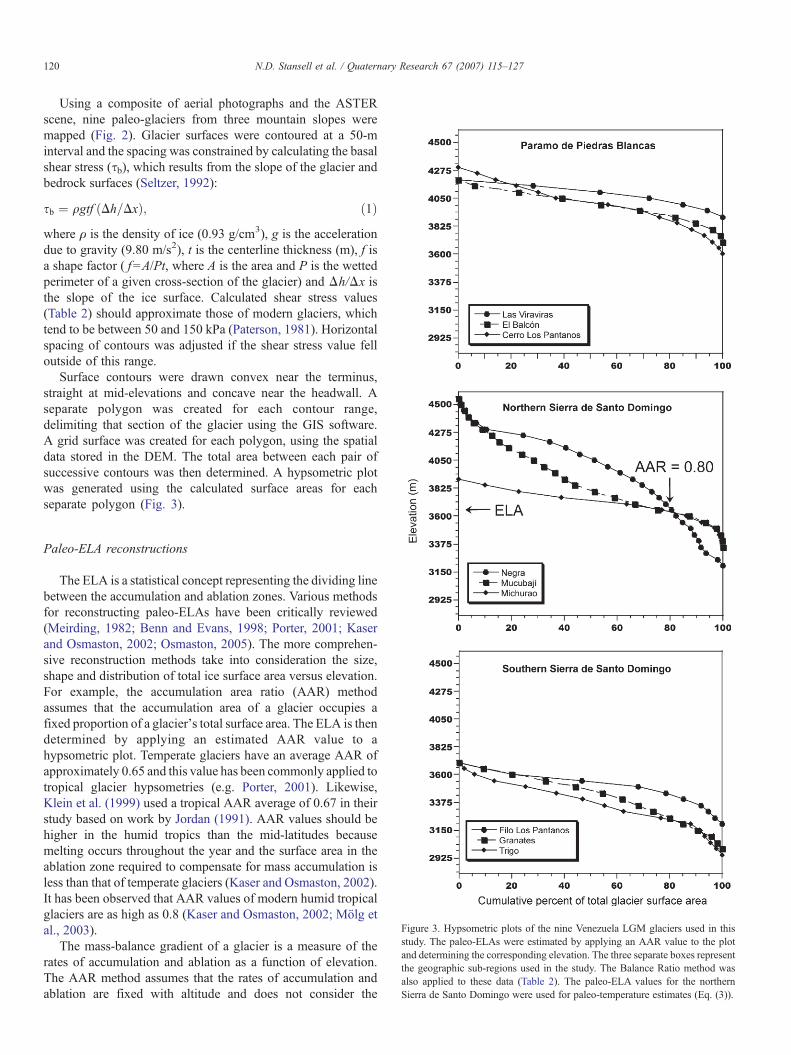
Using a composite of aerial photographs and the ASTERscene, nine paleo-glaciers from three mountain slopes weremapped (Fig. 2). Glacier surfaces were contoured at a 50-minterval and the spacing was constrained by calculating the basalshear stress (τb), which results from the slope of the glacier andbedrock surfaces (Seltzer, 1992):
sb ¼ qgtf ðDh=DxÞ; ð1Þwhere ρ is the density of ice (0.93 g/cm3), g is the accelerationdue to gravity (9.80 m/s2), t is the centerline thickness (m), f isa shape factor ( f=A/Pt, where A is the area and P is the wettedperimeter of a given cross-section of the glacier) and Δh/Δx isthe slope of the ice surface. Calculated shear stress values(Table 2) should approximate those of modern glaciers, whichtend to be between 50 and 150 kPa (Paterson, 1981). Horizontalspacing of contours was adjusted if the shear stress value felloutside of this range.
Surface contours were drawn convex near the terminus,straight at mid-elevations and concave near the headwall. Aseparate polygon was created for each contour range,delimiting that section of the glacier using the GIS software.A grid surface was created for each polygon, using the spatialdata stored in the DEM. The total area between each pair ofsuccessive contours was then determined. A hypsometric plotwas generated using the calculated surface areas for eachseparate polygon (Fig. 3).
Figure 3. Hypsometric plots of the nine Venezuela LGM glaciers used in thisstudy. The paleo-ELAs were estimated by applying an AAR value to the plotand determining the corresponding elevation. The three separate boxes representthe geographic sub-regions used in the study. The Balance Ratio method wasalso applied to these data (Table 2). The paleo-ELA values for the northernSierra de Santo Domingo were used for paleo-temperature estimates (Eq. (3)).
Paleo-ELA reconstructions
The ELA is a statistical concept representing the dividing linebetween the accumulation and ablation zones. Various methodsfor reconstructing paleo-ELAs have been critically reviewed(Meirding, 1982; Benn and Evans, 1998; Porter, 2001; Kaserand Osmaston, 2002; Osmaston, 2005). The more comprehen-sive reconstruction methods take into consideration the size,shape and distribution of total ice surface area versus elevation.For example, the accumulation area ratio (AAR) methodassumes that the accumulation area of a glacier occupies afixed proportion of a glacier's total surface area. The ELA is thendetermined by applying an estimated AAR value to ahypsometric plot. Temperate glaciers have an average AAR ofapproximately 0.65 and this value has been commonly applied totropical glacier hypsometries (e.g. Porter, 2001). Likewise,Klein et al. (1999) used a tropical AAR average of 0.67 in theirstudy based on work by Jordan (1991). AAR values should behigher in the humid tropics than the mid-latitudes becausemelting occurs throughout the year and the surface area in theablation zone required to compensate for mass accumulation isless than that of temperate glaciers (Kaser and Osmaston, 2002).It has been observed that AAR values of modern humid tropicalglaciers are as high as 0.8 (Kaser and Osmaston, 2002; Mölg etal., 2003).
The mass-balance gradient of a glacier is a measure of therates of accumulation and ablation as a function of elevation.The AAR method assumes that the rates of accumulation andablation are fixed with altitude and does not consider the
121N.D. Stansell et al. / Quaternary Research 67 (2007) 115–127
vertical mass-balance profile of a glacier. As an alternative, thearea–altitude–balance ratio (AABR) method takes into con-sideration both the hypsometry of the glacier and the shape ofthe mass-balance curve (Furbish and Andrews, 1984; Benn andEvans, 1998; Osmaston, 2005). The balance ratio (BR) isdefined as the ratio of the mass-balance gradients of the abla-tion and accumulation zones. As with an AAR value, the BRvalues are higher in the tropics than in temperate regionsbecause of the relatively high rates of ablation. Tropical gla-ciers typically have BR values of 2 to 5, but this value can be ashigh as 25 (Benn and Evans, 1998). ELAs were estimated withthe AABR method using a spreadsheet developed by Osmaston(2005).
In this study both the AAR and AABR methods were usedto determine paleo-ELAs. The proper BR and AAR values arenot known for the Venezuelan Andes because the mass-balance profiles of the existing modern glaciers have not beendirectly observed. Therefore, we used both methods with arange in AAR and BR values (Table 2). The AABR methodwith a BR value of 5 yields an ELA that closely matches theAAR method with a value of 0.73 for the northern Sierra deSanto Domingo region. Given the strongly seasonal precipita-tion and continuously high humidity in this region, theseshould be considered minimum estimates. More appropriateAAR values are likely around 0.80, which corresponds to aBR of ∼10.
As a final note, it is important to consider the effects oflower sea level during the LGM on glacier ELAs. LGM sealevel was 120 m lower than present (Fairbanks, 1989). As aresult, the global atmosphere may have descended by acomparable amount and paleo-ELA values may need to becompensated (Porter, 2001). However, convincing argumentshave been made that the transfer of water from the oceans toland displaced enough atmospheric mass to compensate forthe lower sea level (Osmaston, 2006), and thus both modernand LGM ELAs should be referenced to modern sea level.Here all elevations are reported above modern sea level andcalculated LGM ELA lowerings are not corrected for lowersea level.
Determining modern ELAs
The existing glacier on the north-facing slope of Pico Bolivarwas used to calculate the modern ELA of the northern Sierra deSanto Domingo, because both regions have similar aspects andseasonal precipitation patterns. The existing glaciers wereobserved in the field and mapped by Schubert (1972). Themodern ELAs were estimated using the AAR method applied toa hypsometric plot generated by Polissar (2005) and the resultsare presented in Table 2. During the LGM, glaciers on PicoBolivar were part of a large ice cap with a complex geometryand are therefore not included in the paleo-glacier reconstruc-tions presented in this paper.
The Pico Bolivar glaciers provide a minimum estimate of amodern ELA for the northern Santo Domingo because they areout of equilibrium with today's climate and are retreatingrapidly. Schubert (1992) documented a rise in the regional
snowline from ∼4100 m in AD 1885 to above 4700 m duringthe 1970's. National Centers for Environmental Prediction(NCEP) reanalysis data show that the modern regional freezinglevel is ∼4860 m (Kalnay et al., 1996). Alternative maximummodern ELA estimates considered the NCEP freezing height(Table 2).
The ELA can be roughly approximated in regions wheremodern glaciers do not exist if the freezing height is known byusing the following equation (Greene et al., 2002):
ELA ¼ 537þ 1:01FH� 0:51P; ð2Þwhere FH is the estimated annual freezing height (m a.s.l.), andP is the annual precipitation (mm). Modern ELAs for theParamo de Piedras Blancas and the southern Sierra de SantoDomingo were estimated using Eq. (2). Minimum andmaximum values were estimated using freezing heights of4700 and 4860 m, respectively. It should be noted that thisequation represents a statistical average for tropical glaciers andneeds to be evaluated carefully when applied to individualglaciers.
Paleo-temperature reconstruction
Seltzer (1992) modified Kuhn's (1989) equation to calculatethe temperature change (ΔT) responsible for a ΔELA:
DT ¼ LmAH
∂P∂z
DELAþ DP
� �
þ 1AH
LmLs
� 1
� �As
∂pva∂z
DELA
� �� ∂T
∂zDELA; ð3Þ
where Lm is the latent heat of melting, Ls is the latent heat ofsublimation, AH is the transfer coefficient for sensible heat, AS
is the transfer coefficient for latent heat, ∂P/∂z is the verticalprecipitation gradient, ∂pva/∂z is the vertical gradient inatmospheric absolute humidity, ∂Ta/∂z is the atmosphericlapse rate, ΔP is the change is precipitation and ΔELA is thechange in ELA (refer to Tables 3 and 4 for the correspondingvalues). The first term of this equation reflects the contributionfrom changes in precipitation over time and precipitationchange as a function of elevation. The second term reflects howan ELA-inferred temperature lowering is affected by a verticalchange in atmospheric humidity (Seltzer, 1992). The final termincorporates the temperature change resulting from the atmo-spheric temperature lapse rate. Values for precipitation werederived from modern station data. Values of ±50% of themodern mean were also used to model the possible effects ofchanges in precipitation during the LGM. The precipitationgradient was estimated using the regional maximum andminimum values from Pulwarty et al. (1998). The atmospherichumidity gradient was estimated using the modern annual meancalculated from NCEP data and a range in LGM humiditygradient values were estimated by taking ±50% of the modernmean. The transfer coefficients were based on values ofresistance to sensible and latent heat transfer from Kaser andOsmaston (2002).
Table 3Venezuela LGM temperature values as a function of changes in the atmosphericlapse rate and precipitation using the Kuhn (1989) equation
ΔELA=−980 m
Lapse rate °C/100 m ΔP mm/yr ΔT °C
+500 −7.470.55 0 −7.83
−500 −8.19+500 −8.45
0.65 0 −8.81−500 −9.17+500 −9.42
0.75 0 −9.79−500 −10.15
122 N.D. Stansell et al. / Quaternary Research 67 (2007) 115–127
Determining an appropriate LGM atmospheric lapse raterequires careful consideration because these values introduce alarge potential error in the paleo-temperature calculation. Theaverage modern tropical lapse rate is 0.6°C/100 m (Porter,2001). The published modern lapse rates for Venezuela rangefrom 0.54 to 0.63°C/100 m (Salgado-Labouriau, 1979; Bradleyet al., 1991; Kalnay et al., 1996). In addition, atmosphericconditions during the LGM in the Venezuelan Andes wereprobably more arid than today (Bradbury et al., 1981; Bradley etal., 1985; Weingarten et al., 1991; Salgado-Labouriau et al.,1992), which may have resulted in steeper atmospheric lapserates. Using steeper lapse rates is not necessarily justified,however, because it has been documented that even dry tropicallocations tend to approach the maximum of the saturatedadiabatic lapse rate (Rind and Peteet, 1985). A minimumestimate for an LGM atmospheric lapse rate in the VenezuelanAndes is probably close to the modern minimum of 0.55°C/100 m. The maximum plausible LGM tropical atmosphericlapse rate is probably ∼0.75°C/100 m (Kaser and Osmaston,2002).
Results
Last glacial maximum ELA values
The combined results of the AABR and AAR methods wereused to estimate the LGM ELA values. Minimum ELAs were
Table 4Error analysis in the estimation of ΔT for the LGM
Variable Description Value used intemperature equation
Min Max
r a resistance to sensible andlatent heat transfer
56 47 70
δP/δz precipitation gradient −3.225×10⁻³ −1.360×10⁻³ −5.0ΔP change in precipitation 0 −500 500ΔELA change in ELA −980 −880 −108δt/δz lapse rate 0.65 0.55 0.75δpva/δz atmospheric absolute
humidity gradient−1.223×10⁻⁶ −1.55×10⁻⁶ −8.9
a Used to calculate transfer coefficients for sensible and latent heat transfer.
estimated using AAR and the corresponding BR values thatapproximate reported tropical averages (e.g. Klein et al., 1999;Porter, 2001). Conversely, maximum ELAs were estimatedusing larger AAR and BR values that are conceptually moreplausible for this region based on reports from existing tropicalglaciers (Benn and Evans, 1998; Kaser and Osmaston, 2002;Mölg et al., 2003). Higher BR and AAR values also providedthe least variance in the estimated ELAvalues in this study area,supporting the contention that they are more appropriate for thisregion. Results from the Paramo de Piedras Blancas indicatethat LGM ELAvalues were between ∼4030 and 3830 m. In thenorthern Sierra de Santo Domingo, LGM ELA values werebetween ∼3725 and 3560 m. The southern Sierra de SantoDomingo LGM ELA values were between ∼3505 and 3210 m(Table 2). The average ELA values indicate that the LGM ELAgradient was ∼600 m across the 25 km study site (Fig. 4).
The LGM ELA lowering (ΔELA) can be estimated bycomparing the modern glaciers on Pico Bolivar to thereconstructed LGM glaciers in the northern Sierra de SantoDomingo. The range of modern ELA values for the northern-most glacier on Pico Bolivar was estimated using the samerange of AAR values for the northern Sierra de Santo Domingopaleo-glaciers. The average LGM ELA value for the northernSierra de Santo Domingo is ∼3640 m, which yields an averageΔELA of −980 m.
Last glacial maximum temperature reconstruction
The most reliable LGM ΔELA values are from the northernSierra de Santo Domingo region because modern glaciers existfor comparison and age of the glacial deposit is constrained.Therefore a paleo-temperature calculation was only applied tothe N. Santo Domingo region. The applied temperature equationrequires an ∼8.8°C local LGM cooling to explain a ΔELA of−980 m using modern values for precipitation. Increasing ordecreasing precipitation by up to 50% relative to modern valuesonly results in a ±0.5°C change in the overall temperaturecalculation.
A sensitivity analysis of the effects of each variable used inEq. (3) was conducted to better constrain the uncertainty in thecalculated temperature change (Table 4). For example, theuncertainty in the atmospheric lapse rate value provides the
Units Error in calculation ofΔT (ΔELA=−980 m)
Reference
s/m ±0.2°C Kaser and Osmaston(2002)
90×10−3 kg m−2 m−1 day−1 ±0.5°C Pulwarty (1998)kg m−2 ±0.4°C –
0 m ±0.9°C this study°C/100 m ±1.0°C –
4×10⁻⁶ kg m−3 m−1 ±0.9°C NCEP
Combined effect oferrors on ΔT
±1.8°C
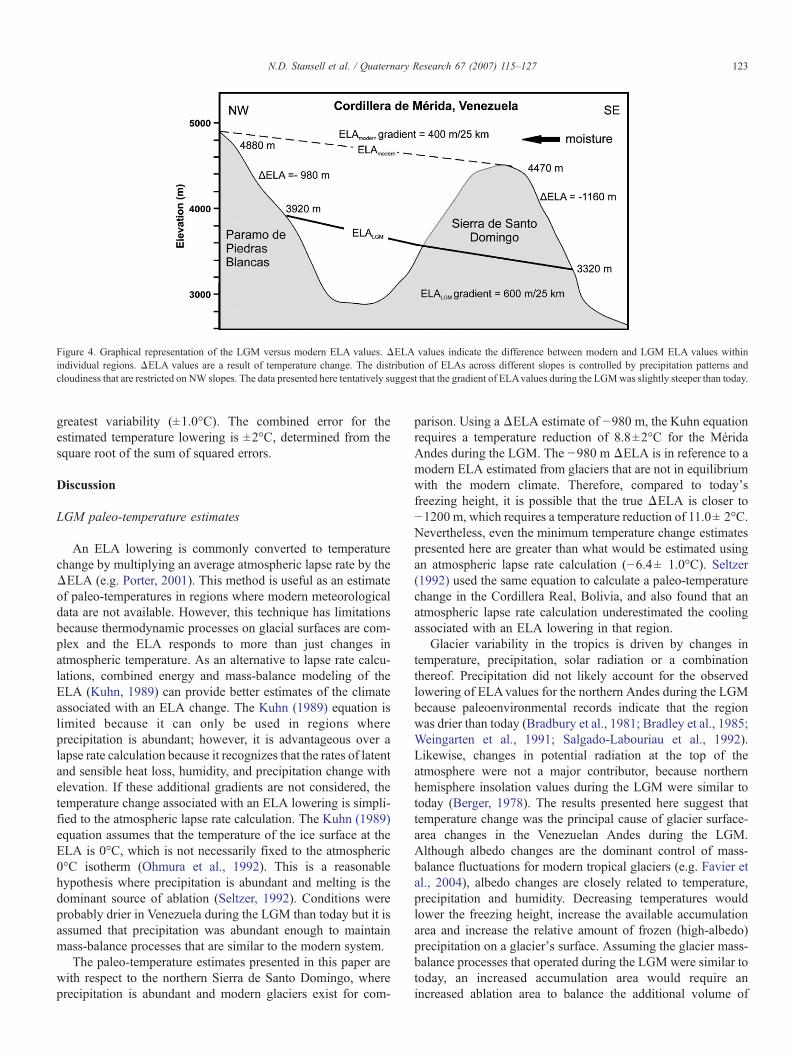
Figure 4. Graphical representation of the LGM versus modern ELA values. ΔELA values indicate the difference between modern and LGM ELA values withinindividual regions. ΔELA values are a result of temperature change. The distribution of ELAs across different slopes is controlled by precipitation patterns andcloudiness that are restricted on NW slopes. The data presented here tentatively suggest that the gradient of ELAvalues during the LGMwas slightly steeper than today.
123N.D. Stansell et al. / Quaternary Research 67 (2007) 115–127
greatest variability (±1.0°C). The combined error for theestimated temperature lowering is ±2°C, determined from thesquare root of the sum of squared errors.
Discussion
LGM paleo-temperature estimates
An ELA lowering is commonly converted to temperaturechange by multiplying an average atmospheric lapse rate by theΔELA (e.g. Porter, 2001). This method is useful as an estimateof paleo-temperatures in regions where modern meteorologicaldata are not available. However, this technique has limitationsbecause thermodynamic processes on glacial surfaces are com-plex and the ELA responds to more than just changes inatmospheric temperature. As an alternative to lapse rate calcu-lations, combined energy and mass-balance modeling of theELA (Kuhn, 1989) can provide better estimates of the climateassociated with an ELA change. The Kuhn (1989) equation islimited because it can only be used in regions whereprecipitation is abundant; however, it is advantageous over alapse rate calculation because it recognizes that the rates of latentand sensible heat loss, humidity, and precipitation change withelevation. If these additional gradients are not considered, thetemperature change associated with an ELA lowering is simpli-fied to the atmospheric lapse rate calculation. The Kuhn (1989)equation assumes that the temperature of the ice surface at theELA is 0°C, which is not necessarily fixed to the atmospheric0°C isotherm (Ohmura et al., 1992). This is a reasonablehypothesis where precipitation is abundant and melting is thedominant source of ablation (Seltzer, 1992). Conditions wereprobably drier in Venezuela during the LGM than today but it isassumed that precipitation was abundant enough to maintainmass-balance processes that are similar to the modern system.
The paleo-temperature estimates presented in this paper arewith respect to the northern Sierra de Santo Domingo, whereprecipitation is abundant and modern glaciers exist for com-
parison. Using a ΔELA estimate of −980 m, the Kuhn equationrequires a temperature reduction of 8.8±2°C for the MéridaAndes during the LGM. The −980 m ΔELA is in reference to amodern ELA estimated from glaciers that are not in equilibriumwith the modern climate. Therefore, compared to today'sfreezing height, it is possible that the true ΔELA is closer to−1200 m, which requires a temperature reduction of 11.0± 2°C.Nevertheless, even the minimum temperature change estimatespresented here are greater than what would be estimated usingan atmospheric lapse rate calculation (−6.4± 1.0°C). Seltzer(1992) used the same equation to calculate a paleo-temperaturechange in the Cordillera Real, Bolivia, and also found that anatmospheric lapse rate calculation underestimated the coolingassociated with an ELA lowering in that region.
Glacier variability in the tropics is driven by changes intemperature, precipitation, solar radiation or a combinationthereof. Precipitation did not likely account for the observedlowering of ELAvalues for the northern Andes during the LGMbecause paleoenvironmental records indicate that the regionwas drier than today (Bradbury et al., 1981; Bradley et al., 1985;Weingarten et al., 1991; Salgado-Labouriau et al., 1992).Likewise, changes in potential radiation at the top of theatmosphere were not a major contributor, because northernhemisphere insolation values during the LGM were similar totoday (Berger, 1978). The results presented here suggest thattemperature change was the principal cause of glacier surface-area changes in the Venezuelan Andes during the LGM.Although albedo changes are the dominant control of mass-balance fluctuations for modern tropical glaciers (e.g. Favier etal., 2004), albedo changes are closely related to temperature,precipitation and humidity. Decreasing temperatures wouldlower the freezing height, increase the available accumulationarea and increase the relative amount of frozen (high-albedo)precipitation on a glacier's surface. Assuming the glacier mass-balance processes that operated during the LGM were similar totoday, an increased accumulation area would require anincreased ablation area to balance the additional volume of
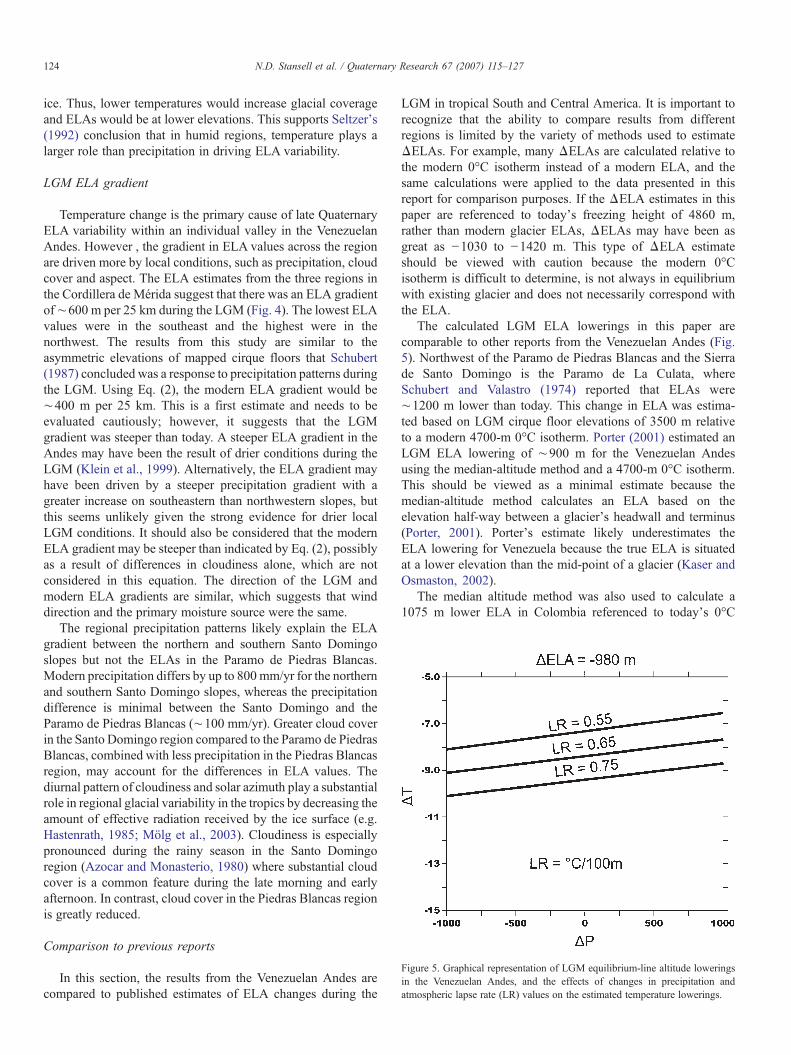
Figure 5. Graphical representation of LGM equilibrium-line altitude loweringsin the Venezuelan Andes, and the effects of changes in precipitation andatmospheric lapse rate (LR) values on the estimated temperature lowerings.
124 N.D. Stansell et al. / Quaternary Research 67 (2007) 115–127
ice. Thus, lower temperatures would increase glacial coverageand ELAs would be at lower elevations. This supports Seltzer's(1992) conclusion that in humid regions, temperature plays alarger role than precipitation in driving ELA variability.
LGM ELA gradient
Temperature change is the primary cause of late QuaternaryELA variability within an individual valley in the VenezuelanAndes. However , the gradient in ELA values across the regionare driven more by local conditions, such as precipitation, cloudcover and aspect. The ELA estimates from the three regions inthe Cordillera de Mérida suggest that there was an ELA gradientof∼600 m per 25 km during the LGM (Fig. 4). The lowest ELAvalues were in the southeast and the highest were in thenorthwest. The results from this study are similar to theasymmetric elevations of mapped cirque floors that Schubert(1987) concluded was a response to precipitation patterns duringthe LGM. Using Eq. (2), the modern ELA gradient would be∼400 m per 25 km. This is a first estimate and needs to beevaluated cautiously; however, it suggests that the LGMgradient was steeper than today. A steeper ELA gradient in theAndes may have been the result of drier conditions during theLGM (Klein et al., 1999). Alternatively, the ELA gradient mayhave been driven by a steeper precipitation gradient with agreater increase on southeastern than northwestern slopes, butthis seems unlikely given the strong evidence for drier localLGM conditions. It should also be considered that the modernELA gradient may be steeper than indicated by Eq. (2), possiblyas a result of differences in cloudiness alone, which are notconsidered in this equation. The direction of the LGM andmodern ELA gradients are similar, which suggests that winddirection and the primary moisture source were the same.
The regional precipitation patterns likely explain the ELAgradient between the northern and southern Santo Domingoslopes but not the ELAs in the Paramo de Piedras Blancas.Modern precipitation differs by up to 800 mm/yr for the northernand southern Santo Domingo slopes, whereas the precipitationdifference is minimal between the Santo Domingo and theParamo de Piedras Blancas (∼100 mm/yr). Greater cloud coverin the Santo Domingo region compared to the Paramo de PiedrasBlancas, combined with less precipitation in the Piedras Blancasregion, may account for the differences in ELA values. Thediurnal pattern of cloudiness and solar azimuth play a substantialrole in regional glacial variability in the tropics by decreasing theamount of effective radiation received by the ice surface (e.g.Hastenrath, 1985; Mölg et al., 2003). Cloudiness is especiallypronounced during the rainy season in the Santo Domingoregion (Azocar and Monasterio, 1980) where substantial cloudcover is a common feature during the late morning and earlyafternoon. In contrast, cloud cover in the Piedras Blancas regionis greatly reduced.
Comparison to previous reports
In this section, the results from the Venezuelan Andes arecompared to published estimates of ELA changes during the
LGM in tropical South and Central America. It is important torecognize that the ability to compare results from differentregions is limited by the variety of methods used to estimateΔELAs. For example, many ΔELAs are calculated relative tothe modern 0°C isotherm instead of a modern ELA, and thesame calculations were applied to the data presented in thisreport for comparison purposes. If the ΔELA estimates in thispaper are referenced to today's freezing height of 4860 m,rather than modern glacier ELAs, ΔELAs may have been asgreat as −1030 to −1420 m. This type of ΔELA estimateshould be viewed with caution because the modern 0°Cisotherm is difficult to determine, is not always in equilibriumwith existing glacier and does not necessarily correspond withthe ELA.
The calculated LGM ELA lowerings in this paper arecomparable to other reports from the Venezuelan Andes (Fig.5). Northwest of the Paramo de Piedras Blancas and the Sierrade Santo Domingo is the Paramo de La Culata, whereSchubert and Valastro (1974) reported that ELAs were∼1200 m lower than today. This change in ELA was estima-ted based on LGM cirque floor elevations of 3500 m relativeto a modern 4700-m 0°C isotherm. Porter (2001) estimated anLGM ELA lowering of ∼900 m for the Venezuelan Andesusing the median-altitude method and a 4700-m 0°C isotherm.This should be viewed as a minimal estimate because themedian-altitude method calculates an ELA based on theelevation half-way between a glacier's headwall and terminus(Porter, 2001). Porter's estimate likely underestimates theELA lowering for Venezuela because the true ELA is situatedat a lower elevation than the mid-point of a glacier (Kaser andOsmaston, 2002).
The median altitude method was also used to calculate a1075 m lower ELA in Colombia referenced to today's 0°C

125N.D. Stansell et al. / Quaternary Research 67 (2007) 115–127
isotherm (Hoyos-Patiño, 1998; Porter, 2001). The toe-to-headwall ratio (THAR) method is a modification of the medianaltitude method which more closely approximates the ELAbecause a ratio other than 0.5 can be used (Meirding, 1982).ELAs of up to 1500 m lower were reported for Costa Rica usingtoday's 0°C isotherm combined with the AAR and THARmethods (Lachniet and Seltzer, 2002). ELA lowerings between∼550 and 1200 m were calculated for the Central Andes usingthe THAR and cirque-floor elevation methods (Klein et al.,1999), and up to 920 m in Ecuador using the median-altitudemethod (Clapperton, 1987, 1993; Porter, 2001). To summarize,some of the older published ELA values for the tropics rely onapproximate methods, such as the median-altitude method, andthese reports may underestimate the amount of tropical LGMELA lowering. The THAR, AAR and AABR methods are moreaccurate reconstruction techniques and commonly yield greaterΔELA values.
The temperature estimates based on ELA reconstructionspresented here are supported by independent lines of evidencethat indicate a large cooling at high elevations in the northerntropics during the LGM. Rull (1998) estimated a temperaturelowering of 7±1°C for the LGM in the Venezuelan Andes basedon a∼1200-m descent of vegetation zones relative to today, andan atmospheric lapse rate calculation. Lachniet and Seltzer(2002) estimate a LGM cooling of 8 to 9°C for Costa Rica basedon an atmospheric lapse rate calculation. Furthermore, Mark etal. (2005) concluded that the greatest tropical LGM ELA lo-wering occurred in the northern Andes, Mexico and Papua NewGuinea. The paleo-temperature results for the northern tropicssummarized here are greater than vegetation, lake-level andgeochemical studies that indicate temperatures at high Andeanelevations were ∼5 to 6.4°C cooler during the LGM (Farrera etal., 1999). Interestingly, ice-core evidence from the PeruvianAndes indicates high elevation temperatures may have been asmuch as 8 to 12°C cooler than modern (Thompson et al.,1995), though an alternative interpretation of the δ18O fromthe Huascaran ice cores suggests that this may be an over-estimate (Pierrehumbert, 1999).
Discrepancy between low and high elevationpaleo-temperature reconstructions
The large cooling at high elevations inferred from glacialELAs for the northern hemisphere tropics does not directlycorrespond to reconstructed changes in temperature at the oceansurface. For example, the maximum estimated tropical Atlantictemperatures were only 5 to 6°C cooler during the LGM(Guilderson et al., 1994; Thompson et al., 1995; Stute et al.,1995; Mix et al., 1999). Paleo-temperature estimates from theCariaco Basin, off the north coast of Venezuela, indicateconditions were ∼3 to 4°C cooler during the LGM (Lin et al.,1997; Lea et al., 2003). This leaves at least a ∼3°C and up to∼5°C discrepancy between the temperature reconstructionsproposed for sea-surface and the high-elevation temperaturereconstructions presented in this paper.
The discrepancy between sea-surface and high-elevationpaleo-temperature estimates is an area of active research. One
explanation is that a steeper atmospheric lapse rate would lowerthe freezing height relative to sea surface. This is controversialbecause it is difficult to find an adequate mechanism capable ofproducing such steep values (Rind and Peteet, 1985). Betts andRidgeway (1992) suggested that another mechanism is requiredto lower the freezing height, such as a reduction of mean surfacewind speed, or an increase in the net atmospheric transport oftropical heat. Using the model of Betts and Ridgeway (1989),Greene et al. (2002) showed that the observed LGM tropicalELA lowering can be achieved with an average tropical SSTcooling of only 2.8°C and a reduction in the equivalent potentialtemperature of the atmospheric mixing layer. To summarize,climate modeling studies suggest that temperature changes athigh elevations during the LGM were not necessarily equal tothose at sea surface. In fact, a more comprehensive evaluation ofglacio-geological evidence from certain regions indicates thatthere may be an even greater discrepancy between LGMtemperature values at sea surface and high elevations thanpreviously proposed.
Conclusions
ELAs were 850 to 1420 m lower than present in theVenezuelan Andes during the LGM. This supports thecontention of Mark et al. (2005) that ELA values during theLGM were lower in the northern Andes than the central Andes.The associated temperatures were lower in the VenezuelanAndes during the LGM by at least 8.8±2.0°C and possibly asmuch as 11°C using a combined energy and mass-balanceequation. This is ∼2°C cooler than the value estimated by anatmospheric lapse rate calculation. The values for the northerntropics are greater than the overall tropical average for LGMcooling of 5° to 6.4°C previously presented and calculated withthe atmospheric lapse rate (Porter, 2001). Lapse rate calcula-tions underestimate the cooling associated with lower ELAvalues because they do not take into account the energy budgetacross a glacier's surface and neglect the controls of the altitudegradients of humidity and precipitation on the ELA. There is adiscrepancy between low- and high-altitude paleo-temperatureestimates during the LGM for the northern tropics and anadequate explanation needs to be proposed with futuremodeling studies. The spatial gradient of LGM ELA values inVenezuela is consistent with the modern cloudiness andprecipitation patterns, suggesting that similar patterns werepresent during the LGM. There is tentative evidence of a steeperELA gradient during the LGM that could have been the result ofa drier atmosphere.
Acknowledgments
The authors would like to thank Matthew Lachniet andHenry Osmaston for materials that helped with the methodssection of this paper. Maximiliano Bezada provided field andlogistical support. Michael Ramsey, Thomas Anderson and twoanonymous reviewers provided valuable comments thatimproved an earlier version of the manuscript. This projectwas supported by NSF grant ATM-9809472.
126 N.D. Stansell et al. / Quaternary Research 67 (2007) 115–127
References
Ames, A., Francou, B., 1995. Cordillera Blanca, Glaciares en la Historia.Bulletin de l'Institut Francais d'Etudes Andines 24, 37–64.
Azocar, A., Monasterio, M., 1980. Caracterización Ecológica del Clima en ElPáramo de Mucubají. In: Monasterio, M. (Ed.), Estudios Ecologicos en losPáramos Andinos. Ediciones de la Universidad de Los Andes, Merida,Venezuela, pp. 207–223.
Benn, D., I., Evans, D.J.A., 1998. Glaciers and Glaciation. JohnWiley and Sons,Inc., New York.
Berger, A.L., 1978. Long-term variations of caloric insolation resulting from theEarth's orbital elements. Quaternary Research 9, 139–167.
Betts, A.K., Ridgeway, W., 1989. Climate equilibrium of the atmosphericconvective boundary layer over a tropical ocean. Journal of the AtmosphericSciences 46, 2621–2641.
Betts, A.K., Ridgeway, W., 1992. Tropical boundary layer equilibrium in theLast Ice Age. Journal of Geophysical Research 97, 2529–2534.
Bradbury, J.P., Leyden, B., Salgado-Labouriau, M., Lewis Jr., W.M., Schubert,C., Binford, M.W., Frey, D.G., Whitehead, D.R., Weibezahn, F.H., 1981.Late quaternary environmental history of Lake Valencia, Venezuela. Science214, 1299–1305.
Bradley, R.S., Yuretich, R., Salgado-Labouriau, M.L., Weingarten, B., 1985.Late Quaternary paleoenvironmental reconstruction using lake sedimentsfrom the Venezuelan Andes: preliminary results. Zeitschrift für Gletscher-kunde und Glazialgeologie 21, 97–106.
Bradley, R., Yuretich, R., Weingarten, B., 1991. Studies of modern climate. In:Yuretich, R. (Ed.), Late Quaternary Climatic Fluctuations of the VenezuelanAndes. University of Massachusetts, Amherst, MA, pp. 45–62.
Broecker, W.S., 1997. Mountain glaciers: recorders of atmospheric water vaporcontent? Global Biogeochemical Cycles 11, 589–597.
Clapperton, C.M., 1987. Glacial geomorphology, Quaternary glacialsequence and palaeoclimatic inferences in the Ecuadorian Andes. In:Gardiner, V. (Ed.), International Geomorphology 1986, Part II. Wiley,Chichester, pp. 843–870.
Clapperton, C.M., 1993. Quaternary Geology and Geomorphology of SouthAmerica. Elsevier, Amsterdam.
CLIMAP, P.M., 1976. The surface of the ice-age earth. Science 191, 1131–1137.CLIMAP, P.M., 1981. Seasonal reconstruction of the earth's surface at the last
glacial maximum. Geological Society of America Map and Chart Series.Denton, G.H., Heusser, C.J., Lowell, T.V., Schluchter, C., Andersen, B.G.,
Heusser, L.E., Moreno, P.I., Marchant, D.R., 1999. Geomorphology,Stratigraphy, and Radiocarbon Chronology of Llanquihue Drift in theArea of the Southern Lake District, Seno Reloncavi, and Isla Grande deChiloe, Chile. Geografiska Annaler 81A, 167–229.
Fairbanks, R.G., 1989. A 17,000-year glacio-eustatic sea level record: influenceof glacial melting rates on the Younger Dryas event and deep-oceancirculation. Nature 342, 637–642.
Farrera, I., Harrison, S.P., Prentice, I.C., Ramstein, G., Guiot, J., Bartlein, P.J.,Bonnefille, R., Bush, M., Cramer, W., von Grafenstein, U., Holmgren, K.,Hopogheimstra, H., Hope, G., Jolly, D., Lauritzen, S.-E., Ono, Y., Pinot, S.,Stute, M., Yu, G., 1999. Tropical climates at the last glacial maximum: a newsynthesis of terrestrial palaeoclimate data: I. Vegetation, lake-levels andgeochemistry. Climate Dynamics 15, 823–856.
Favier, V., Wagnon, P., Ribstein, 2004. Glaciers of the outer and inner tropics: adifferent behaviour but a common response to climatic forcing. GeophysicalResearch Letters 31, L16403, doi:10.1029/2004GL020654.
Francou, B., Ribstein, P., Saravia, R., Tiriau, E., 1995. Monthly balance andwater discharge of an inter-tropical glacier: Zongo Glacier, Cordillera Real,Bolivia, 16°S. Journal of Glaciology 41, 61–67.
Furbish, D.J., Andrews, J.T., 1984. The use of hypsometry to indicate long-termstability and response of valley glaciers to changes in mass transfer. Journalof Glaciology 30, 199–211.
Giegengack, R., Grauch, R., 1973. Quaternary geology of the central Andes,Venezuela: a preliminary assessment. Excursion 1, 38–93.
Greene, A.M., Seager, R., Broecker, W.S., 2002. Tropical snowline depression atthe last glacial maximum: comparison with proxy records using a single-celltropical climate model. Journal of Geophysical Research 107 (ACL 4-1 to 17.).
Guilderson, T.P., Fairbanks, R.G., Rubenstone, J.L., 1994. Tropical temperature
variations since 20,000 years ago: modulating interhemispheric climatechange. Science 263, 663–665.
Hastenrath, S., 1984. Interannual variability and the annual cycle: mechanismsof circulation and climate in the tropical Atlantic sector. Monthly WeatherReview 112, 1097–1107.
Hastenrath, S., 1985. Climate and ciculation of the tropics. C. Reidel PublishingCompany, Dordrecht.
Hastenrath, S., 1989. Ice flow and mass changes of Lewis Glacier, MountKenya, East Africa: observations 1974–86, modeling, and predictions to theyear 2000 A.D. Journal of Glaciology 35, 325–332.
Hoyos-Patiño, F., 1998. Glaciers of colombia. In: Williams, Ferrigno, J.G.(Eds.), Glaciers of South America, Satellite Image Atlas of Glaciers of theWorld. U.S. Geological Survey Professional Paper 1386-I, pp. 111–130.
Jordan, E., 1991. Die Gletscher der bolivianischen Andean. Franz Steiner VerlagStuttgart, Eurasburg, Germany.
Kalnay, E., co-authors, 1996. The NCEP/NCAR reanalysis 40-year project.Bulletin of the American Meteorological Society 77, 437–471.
Kaser, G., 1995. Some notes on the behavior of tropical glaciers. Bulletin del'Institut Francais d'Etudes Andines 24, 671–681.
Kaser, G., 2001. Glacier–climate interaction at low latitudes. Journal ofGlaciology 47, 195–204.
Kaser, G., Georges, C., 1999. On the mass balance of low latitude glaciers withparticular consideration of the Peruvian Cordillera Blanca. GeografiskaAnnaler 81A, 643–651.
Kaser, G., Noggler, B., 1996. Glacier fluctuations in the Ruwenzori Range (EastAfrika) during the 20th century. A preliminary report. ZeitschriftGletscherkunde Glazialgeologie 32, 109–117.
Kaser, G., Osmaston, H., 2002. Tropical Glaciers. Cambridge University Press,Cambridge.
Klein, A.G., Seltzer, G.O., Isacks, B.L., 1999. Modern and last local glacialmaximum snowlines in the Central Andes of Peru, Bolivia, and NorthernChile. Quaternary Science Reviews 18, 63–84.
Kuhn, M., 1989. The response of the equilibrium line altitude to climatefluctuations: theory and observations. In: Oerlemans, J. (Ed.), GlacierFluctuations and Climate Change. Kluwer Academic Publishers, TheNetherlands, pp. 407–417.
Lachniet, M.S., Seltzer, G., 2002. Late Quaternary glaciation of Costa Rica.GSA Bulletin 114, 547–558.
Lea, D.W., Pak, D.K., Peterson, L.C., Hughen, K.A., 2003. Synchronicity oftropical and high-latitude Atlantic temperatures over the last glacialtermination. Science 301, 1361–1364.
Lin, H.-L., Peterson, L.C., Overpeck, J.T., Trumbore, S.E., Murray, D.W., 1997.Late Quaternary climate change from δ18O records of multiple species ofplanktonic foraminifera: high-resolution records from the anoxic CariacoBasin, Venezuela. Paleoceanography 12, 415–427.
Lowell, T.V., Heusser, C.J., Andersen, B.G., Moreno, P.I., Hauser, A., Heusser,L.E., Schluchter, C., Marchant, D.R., Denton, G.H., 1995. Interhemisphericcorrelation of late pleistocene glacial events. Science 269, 1541–1549.
Mahaney, W.C., Milner, M.W., Voros, J., Kalm, V., Hutt, G., Bezada, M.,Hancock, R.G.V., Aufreiter, S., 2000. Stratotype for the Mérida Glaciation atPueblo Llano in the northern Venezuelan Andes. Journal of South AmericanEarth Sciences 13, 761–774.
Mann, D.H., Hamilton, T.D., 1995. Late pleistocene and holocene paleo-environments of the north Pacific coast. Quaternary Science Reviews 14,449–471.
Mark, B.G., Harrison, S., Spessa, A., New, M., Evans, D.J.A., Helmens, K.F.,2005. Tropical snowline changes at the last glacial maximum: a globalassessment. Quaternary International 138–139, 168–201.
Meirding, T.C., 1982. Late pleistocene glacial equilibrium-line altitudes in theColorado front range: a comparison of methods. Quaternary Research 18,289–310.
Mix, A.C., Morey, A.E., Pisias, N.G., Hostetler, S.W., 1999. Foraminifera faunalestimates of paleotemperature: circumventing the no-analog problem yieldscool ice age tropics. Paleoceanography 14, 350–359.
Mölg, T., Georges, C., Kaser, G., 2003. The contribution of increasedincoming shortwave radiation to the retreat of the Rwenzori Glaciers, EastAfrica, during the 20th century. International Journal of Climatology 23,291–303.
127N.D. Stansell et al. / Quaternary Research 67 (2007) 115–127
Monasterio, M., 1986. Adaptive Strategies of Espeletia in the Andean DesertParamo. Oxford University Press, London.
Monasterio, M., Reyes, S., 1980. Diversidad ambiental y variacion de lavegetacion en los páramos de los Andes Venezolanos. In: Monasterio, M.(Ed.), Estudios Ecologicos en los Páramos Andinos. Ediciones de laUniversidad de Los Andes, Merida, Venezuela, pp. 47–91.
Oerlemans, J., 2001. Glaciers and Climate Change. A.A. Balkema Publishers,Amsterdam.
Ohmura, A., Kasser, P., Funk, M., 1992. Climate at the equilibrium line ofglaciers. Journal of Glaciology 38, 397–411.
Osmaston, H., 2005. Estimates of glacier equilibrium line altitudes by theArea×Altitude, the Area×Altitude Balance Ratio and the Area×AltitudeBalance Index methods and their validation. Quaternary International138–139, 22–31.
Osmaston, H., 2006. Should quaternary sea-level changes be used to correctglacier ELAs, vegetation belt altitudes and sea level temperatures forinferring climate changes. Quaternary Research 65, 244–251.
Paterson, W.S.B., 1981. The Physics of Glaciers. Pergamon Press Inc., New York.Pierrehumbert, R.T., 1999. Huascaran δ18O as an indicator of tropical climate
during the last glacial maximum. Geophysical Research Letters 26,1345–1348.
Polissar, P.J., 2005. Unpublished PhD. Dissertation. University of Massachu-setts at Amherst.
Porter, S.C., 2001. Snowline depression in the tropics during the Last Glaciation.Quaternary Science Reviews 20, 1067–1091.
Pulwarty, R.S., Barry, R.G., Hurst, C.M., Sellinger, K., Mogollon, L.F., 1998.Precipitation in the Venezuelan Andes in the context of regional climate.Meteorology and Atmospheric Physics 67, 217–237.
Rind, D., Peteet, D., 1985. Terrestrial conditions at the Last Glacial Maximumand CLIMAP sea-surface temperature estimates: are they consistent?Quaternary Research 24, 1–22.
Rull, V., 1998. Palaeoecology of pleniglacial sediments from the VenezuelanAndes. palynological record of El Caballo stadial, sedimentation rates andglacier retreat. Review of Palaeobotany and Palynology 99, 95–114.
Salgado-Labouriau, M.L., 1979. Modern pollen deposition in the VenezuelanAndes. Grana 18, 53–68.
Salgado-Labouriau, M.L., Bradley, R.S., Yuretich, R., Weingarten, B., 1992.Paleoecological analysis of the sediments of Lake Mucubaji, VenezuelanAndes. Journal of Biogeography 19, 317–327.
Schubert, C., 1970. Glaciation of the Sierra de Santo Domingo, VenezuelanAndes. Quaternaria 13, 225–246.
Schubert, C., 1972. Geomorphology and glacier retreat in the Pico Bolivar area,
Sierra Nevada de Merida, Venezuela. Zeitschrift für Gletscherkunde undGlazialgeologie VIII, 189–202.
Schubert, C., 1974. Late Pleistocene Mérida Glaciation, Venezuelan Andes.Boreas 3, 147–151.
Schubert, C., 1987. La Extension de los Glaciares Pleistocenes en la SierraNevada de Merida. Boletín de la Sociedad Venezolana de Ciencias Naturales41, 299–308.
Schubert, C., 1984. The Pleistocene and recent extent of the glaciers of the SierraNevada de Merida, Venezuela. Erdwissenschaftliche Forschung 18,269–278.
Schubert, C., 1992. The glaciers of the Sierra Nevada de Merida (Venezuela): aphotographic comparison of recent deglaciation. Erdkunde 46, 58–64.
Schubert, C., 1998. Glaciers of Venezuela. Glaciers of South America. USGSProfessional Paper 1386-I.
Schubert, C., Clapperton, C., 1990. Quaternary Glaciations in the NorthernAndes (Venezuela, Colombia and Ecuador). Quaternary Science Reviews 9,123–135.
Schubert, C., Rinaldi, M., 1987. Nuevos Datos Sobre la Cronologia del EstadioTardio de la Glaciacion Merida, Andes Venezolanos. Acta Cientifica 38.
Schubert, C., Valastro, S., 1974. Late Pleistsocene glaciation of Paramo de LaCulata, north-central Venzuelan Andes. Sonderdruck aus der GeologischenRundschau 63, 517–537.
Seltzer, G.O., 1992. Late Quaternary glaciation of the Cordillera Real, Bolivia.Journal of Quaternary Science 7, 87–98.
Seltzer, G.O., 1994. A lacustrine record of late pleistocene climatic change in thesubtropical Andes. Boreas 23, 105–111.
Seltzer, G., Rodbell, D.T., Baker, P.A., Fritz, S., Tapia, P.M., Rowe, H.D.,Dunbar, R.B., 2002. Early warming of tropical South America at the lastglacial–interglacial transition. Science 296, 1685–1686.
Smith, J.A., Seltzer, G.O., Farber, D.L., Rodbell, D.T., Finkel, R.C., 2005. Earlylocal last glacial maximum in the tropical Andes. Science 308, 678–681.
Stute, M., Forster, M., Frischkorn, H., Serejo, A., Clark, J.F., Schlosser, P.,Broecker, W.S., Bonani, G., 1995. Cooling of Tropical Brazil (5°C) duringthe last glacial maximum. Science 269, 379–383.
Thompson, L.G., Mosley-Thompson, E., Davis, M.E., Lin, P.-N., Henderson,K.A., Cole-Dai, J., Bolzan, J.F., Liu, K.-b., 1995. Late glacial stage andholocene tropical ice core records from Huascarán, Peru. Science 269,46–50.
Weingarten, B., Salgado-Labouriau, M.L., Yuretich, R., Bradley, R., 1991. Latequaternary environmental history of the Venezuelan Andes. In: Yuretich, R.(Ed.), Late Quaternary Climatic Fluctuations of the Venezuelan Andes.University of Massachusetts, Amherst, MA, pp. 63–94.


![Easy paleo spaghetti recipe with tomato sauce [Paleo, Keto]](https://img.dokumen.tips/doc/110x75/58aa1fde1a28abff6b8b5931/easy-paleo-spaghetti-recipe-with-tomato-sauce-paleo-keto.jpg)