Embed Size (px)
Citation preview

Laser Plasma Monochromatic Soft X-ray Source Using Nitrogen Gas Puff Target
M. Vrbova1, P. Vrba2, S.V. Zakharov3, V.S. Zakharov4, M. Müller5, D. Pánek1, T. Parkman1, P.Brůža1
1Czech Technical University in Prague, CR, 2Institute of Plasma Physics, AS CR,
3NaextStream sas France, 4KIAM RAS, Russia, 5Laser Laboratorium Göttingen, Germany

Outline
• Laser plasma created in nitrogen gas puff target is studied. • Prevailing abundance of helium –like nitrogen ions is expected, if nitrogen
plasma is heated up to temperature 40 ~ 80 eV. • Monochromatic radiation with the wavelength λ = 2.88 nm, corresponding to
the quantum transition 1s2-1s2p of helium like nitrogen ion, is expected. • Laboratory experiments. • Computer modeling. • SXR emission of plasma heated by 7 ns and 170 ps Nd:YAG laser pulses is
compared. • Influence of laser pulse duration and energy and nitrogen gas density on the
brightness of the SXR source is judged.
November 2014 Workshop Dublin 2

Experimental set up
3 November 2014 Workshop Dublin
MÜLLER, M. et al.: Emission properties of ns and ps laser-induced soft x-ray sources using pulsed gas jets. Optics Express 2013, vol. 21, p. 12831

Emitted in-band SXR power
November 2014 Workshop Dublin 4
Input: 450 mJ/7 ns laser pulse 380mJ/170 ps laser pulse
Output: 0.12 mJ/4.9 ns SXR pulse 0.43 mJ/3.5 ns SXR pulse
Conversion efficiency: 2.7 x 10⁻² % Conversion efficiency: 1.1 x 10⁻¹ %
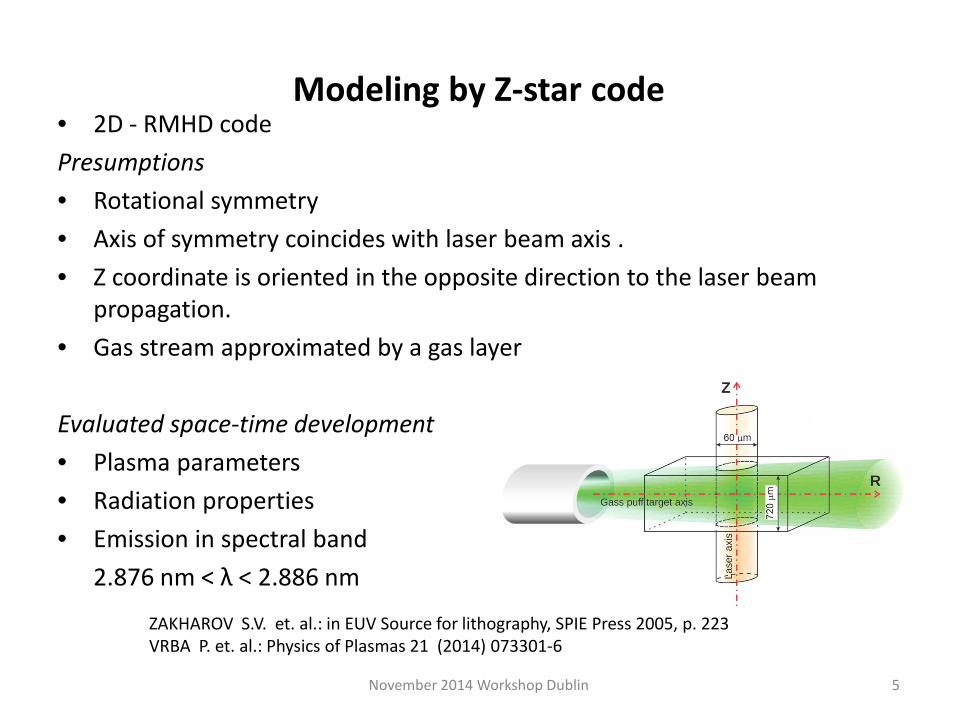
Modeling by Z-star code • 2D - RMHD code Presumptions • Rotational symmetry • Axis of symmetry coincides with laser beam axis . • Z coordinate is oriented in the opposite direction to the laser beam
propagation. • Gas stream approximated by a gas layer
Evaluated space-time development • Plasma parameters • Radiation properties • Emission in spectral band 2.876 nm < λ < 2.886 nm
November 2014 Workshop Dublin 5
ZAKHAROV S.V. et. al.: in EUV Source for lithography, SPIE Press 2005, p. 223 VRBA P. et. al.: Physics of Plasmas 21 (2014) 073301-6

Z-star code – input parameters
November 2014 Workshop Dublin 6
Laser parameters
Laser energy [mJ] 450 380 Pulse duration [FWHM ns] 7 0.17 Peak power [W] 6.4 .107 2.24 .109 Focal spot radius [cm] 0.006 0.006 Focal position [cm] 0.25 0.25
Gas target parameters
Thickness [mm] 0.72 Mass density [g.cm-3] (3.7 - 31) .10-4
Lase
r bea
m
Gas layer

Absorbed and emitted power (results of simulations)
November 2014 Workshop Dublin 7
7 ns laser pulse 170 ps laser pulse
-1 0 1 2 3 4 5Time (ns)
0.1
1
10
100
1000
10000
P (M
W)
ρ = 7.1 10-4 g/ccmPlaserPabsorbPemisPbnd
0.02
0.43
0.68
- ns
-5 0 5 10 15 20 25 30Time (ns)
0.001
0.01
0.1
1
10
100
P (M
W)
ρ =1.1 10-3 g/ccmPlaserPabsorbPemisPbnd
- ns
1
5
8
29
0.02 mJ/1ns SXR pulse 0.6 mJ/0.6 ns SXR pulse

Plasma spatial evolution – 7ns laser pulse
R(cm)
Z(cm
)
0.02 0.04 0.06 0.08 0.1 0.12 0.140.2
0.22
0.24
0.26
0.28
0.3
DENS(g/ccm)
2.6E-032.2E-031.9E-031.7E-031.4E-031.2E-031.1E-039.0E-047.8E-046.7E-045.8E-044.9E-044.3E-043.7E-043.1E-042.7E-042.3E-042.0E-04
t= 1.0001E+00 ns
Frame 001 16 Oct 2014 ZSTAR - code output, cell values
November 2014 Workshop Dublin 8
R(cm)Z(
cm)
0.02 0.04 0.06 0.08 0.1 0.12 0.140.2
0.22
0.24
0.26
0.28
0.3
DENS(g/ccm)
2.6E-032.2E-031.9E-031.7E-031.4E-031.2E-031.1E-039.0E-047.8E-046.7E-045.8E-044.9E-044.3E-043.7E-043.1E-042.7E-042.3E-042.0E-04
t= 5.0015E+00 ns
Frame 001 16 Oct 2014 ZSTAR - code output, cell values
R(cm)
Z(cm
)
0.02 0.04 0.06 0.08 0.1 0.12 0.140.2
0.22
0.24
0.26
0.28
0.3
DENS(g/ccm)
2.6E-032.2E-031.9E-031.7E-031.4E-031.2E-031.1E-039.0E-047.8E-046.7E-045.8E-044.9E-044.3E-043.7E-043.1E-042.7E-042.3E-042.0E-04
t= 8.0006E+00 ns
Frame 001 16 Oct 2014 ZSTAR - code output, cell values
R(cm)
Z(cm
)
0.02 0.04 0.06 0.08 0.1 0.12 0.140.2
0.22
0.24
0.26
0.28
0.3
Geuv(MW/ccm)
70004158.32470.211467.41871.704517.83307.613182.735108.55364.484938.306822.755913.5188.030254.770312.833771.683381
t= 1.0001E+00 ns
Frame 001 16 Oct 2014 ZSTAR - code output, cell values
R(cm)
Z(cm
)
0.02 0.04 0.06 0.08 0.1 0.12 0.140.2
0.22
0.24
0.26
0.28
0.3
Geuv(MW/ccm)
7.0E+062.8E+061.1E+064.3E+051.7E+056.8E+042.7E+041.1E+044.2E+031.7E+036.6E+022.6E+021.0E+024.1E+011.6E+016.4E+002.5E+001.0E+00
t= 5.0015E+00 ns
Frame 001 16 Oct 2014 ZSTAR - code output, cell values
R(cm)Z(
cm)
0.02 0.04 0.06 0.08 0.1 0.12 0.140.2
0.22
0.24
0.26
0.28
0.3
Geuv(MW/ccm)
7.0E+034.2E+032.5E+031.5E+038.7E+025.2E+023.1E+021.8E+021.1E+026.4E+013.8E+012.3E+011.4E+018.0E+004.8E+002.8E+001.7E+001.0E+00
t= 8.0006E+00 ns
Frame 001 16 Oct 2014 ZSTAR - code output, cell values
Mass density
Emitted SXR power
1 ns 5 ns 8 ns

Plasma spatial evolution – 7ns laser pulse
R(cm)
Z(cm
)
0.1 0.2 0.3 0.4 0.5 0.6 0.7
0.1
0.2
0.3
0.4
Te(eV)
90766454463832272319161412108765
t= 1.0001E+00 ns
Frame 001 16 Oct 2014 ZSTAR - code output, cell values
November 2014 Workshop Dublin 9
R(cm)Z(
cm)
0.1 0.2 0.3 0.4 0.5 0.6 0.7
0.1
0.2
0.3
0.4
Te(eV)
90766454463832272319161412108765
t= 5.0015E+00 ns
Frame 001 16 Oct 2014 ZSTAR - code output, cell values
R(cm)
Z(cm
)
0.1 0.2 0.3 0.4 0.5 0.6 0.7
0.1
0.2
0.3
0.4
Te(eV)
90766454463832272319161412108765
t= 8.0006E+00 ns
Frame 001 16 Oct 2014 ZSTAR - code output, cell values
Plasma electron temperature
Longitudinal plasma velocity
R(cm)
Z(cm
)
0.1 0.2 0.3 0.4 0.5 0.6 0.7
0.1
0.2
0.3
0.4Vz(m/s)
3000026363.622727.319090.915454.511818.28181.824545.45909.091
-2727.27-6363.64-10000
t= 1.0001E+00 ns
Frame 001 20 Oct 2014 ZSTAR - code output, cell values
R(cm)
Z(cm
)
0.1 0.2 0.3 0.4 0.5 0.6 0.7
0.1
0.2
0.3
0.4Vz(m/s)
1200001100001000009000080000700006000050000400003000020000100000
-10000-20000-30000-40000
t= 5.0015E+00 ns
Frame 001 20 Oct 2014 ZSTAR - code output, cell values
R(cm)Z(
cm)
0.1 0.2 0.3 0.4 0.5 0.6 0.7
0.1
0.2
0.3
0.4Vz(m/s)
120000100000800006000040000200000
-20000-40000-60000-80000-100000-120000-140000
t= 8.0006E+00 ns
Frame 001 20 Oct 2014 ZSTAR - code output, cell values
1 ns 5 ns 8 ns

Plasma spatial evolution – 170 ps laser pulse
R(cm)
Z(cm
)
0.02 0.04 0.06 0.08 0.1 0.12 0.140.2
0.22
0.24
0.26
0.28
0.3
DENS(g/ccm)
0.00130.00120.00110.0010.00090.00080.00070.00060.00050.00040.00030.00020.0001
t= 2.0014E-01 ns
Frame 001 21 Oct 2014 ZSTAR - code output, cell values
November 2014 Workshop Dublin 10
R(cm)
Z(cm
)
0.02 0.04 0.06 0.08 0.1 0.12 0.140.2
0.22
0.24
0.26
0.28
0.3
DENS(g/ccm)
0.00130.00120.00110.0010.00090.00080.00070.00060.00050.00040.00030.00020.0001
t= 4.3000E-01 ns
Frame 001 21 Oct 2014 ZSTAR - code output, cell values
R(cm)
Z(cm
)
0.02 0.04 0.06 0.08 0.1 0.12 0.140.2
0.22
0.24
0.26
0.28
0.3
DENS(g/ccm)
0.00130.00120.00110.0010.00090.00080.00070.00060.00050.00040.00030.00020.0001
t= 6.8025E-01 ns
Frame 001 21 Oct 2014 ZSTAR - code output, cell values
R(cm)
Z(cm
)
0.02 0.04 0.06 0.08 0.1 0.12 0.140.2
0.22
0.24
0.26
0.28
0.3
Geuv(MW/ccm)
90000082857175714368571461428654285747142940000032857125714318571411428642857.1
-28571.4-100000
t= 2.0014E-01 ns
Frame 001 21 Oct 2014 ZSTAR - code output, cell values
R(cm)
Z(cm
)
0.02 0.04 0.06 0.08 0.1 0.12 0.140.2
0.22
0.24
0.26
0.28
0.3
Geuv(MW/ccm)
90000082857175714368571461428654285747142940000032857125714318571411428642857.1
-28571.4-100000
t= 4.3000E-01 ns
Frame 001 20 Oct 2014 ZSTAR - code output, cell values
Mass density
Emitted SXR power
0.68 ns 0.43 ns 0.02 ns

Spatial distribution of emitted SXR energy
November 2014 Workshop Dublin 11
7 ns laser pulse 170 ps laser pulse
Observations Pin-hole Imaging
7 ns laser pulse 170 ps laser pulse
Simulations (Energy density) Cross-section in R-Z coordinates

Spatial distribution of emitted SXR energy (170 ps laser pulse and various target mass densities)
November 2014 Workshop Dublin 12
ρ = 3.7 10-4 g.cm-3 5.4 10-4 g.cm-3 7.1 10-4 g.cm-3 10.6 10-4 g.cm-3

SXR energy and brightness vs target density
November 2014 Workshop Dublin 13
Mass density g.cm-3
Spot imension (2Rspot x Zspot)
µm2
Qeuv,max J.cm-3
Energy in band mJ
Efficiency %
Brightness mJ.mm-2.sr-1
3.7 .10-4 60 x 660 1.57 0.000102 2.26 .10-5 2.26.10-3 1.06 .10-3 96 x 670 279 0.0365 8.11.10-3 4.49.10-2
3.1 .10-3 132 x 780 1290 0.6543 1.45.10-1 5.06.10-1
7 ns laser pulse
Mass density g.cm-3
Spot dimension (2Rspot x Zspot)
µm2
Qeuv,max J.cm-3
Energy in band mJ
Efficiency %
Brightness mJ.mm-2.sr-1
3.7 .10-4 340 x 730 187 0.593 1.559.10-1 0.19 5.4 .10-4 350 x 820 349 0.783 2.059.10-1 0.22 7.1 .10-4 370 x 560 518 0.845 2.223.10-1 0.32 1.06 .10-3 362 x 300 1337 0.854 2.246.10-1 0.63
170 ps laser pulse

Spatial distribution of emitted SXR energy for 170 ps laser pulse and various laser energies
November 2014 Workshop Dublin 14
Laser energy: 525 mJ 260 mJ 130 mJ 65 mJ.

SXR Spatial frequency heterodyne imaging (SFHI) attenuation inline X-ray imaging modality small-angle scattering diff. phase contrast based on single transmission grating and Fourier analysis of image single-exposure
N2 plasma 430 eV 2.88 nm
in-line radiography SFHI image [1,0] and [0,1] scattering
additional information enhanced visibility negligible loss of spatial resolution SAXS anisotropy ad-hoc – no tedious alignment, – no modification of imaging setup
Demonstration of soft X-ray SFHI imaging on thin section of biological sample 5 μm section - tendo calcaneus of a Norway rat

SXR time-resolved luminescence spectroscopy
s ms μs ns ps TCSPC
SXR TRLS afterglow
Outstanding sensitivity allow to distinguish both fast (ns) intense luminescence and
slow (ms) weak one
Complementary method to TCSPC and afterglow measurement techniques
Goals: to discover and assess defects in scintillation materials of biomedical importance to resolve the decay pathways (τ = ns .. ms) for better understanding of scintillation
mechanism
IR laser, 7 ns 1064 nm, 0.7 J
Soft X-ray pulse 4.7 ns, ~400 eV
Ar plasma
scintillator
Ti filter
monochromator
fast PMT I
t
oscilloscope
t
I λ
λ amplifier

Conclusions
• Results of modeling correspond properly to the experiments: – In-band SXR emitted power (or energy), – Spatial distribution of in-band emitted energy (SXR source dimensions)
• Plasma induced by 7 ns laser pulse is created along the laser beam passing trough the gas stream. Laser pulse is not fully absorbed in the plasma.
– If the mass density of the target is increased, the SXR emission becomes higher, the laser power is more absorbed by plasma.
• Plasma induced by 170 ps laser pulse is created around the border between gas and vacuum near the entry point of the laser beam.
– The efficiency of in-band SXR generation is much higher with shorter pulse. – Further increase in mass density of nitrogen target has negligible effect.
November 2014 Workshop Dublin 17
This work was supported by grants on the projects: GACR P102/12/2043 Pulse Source of Soft X- Rays for Biomedical Applications, MEYSF CR Project LG13029 Research in the Frame of Dense and Magnetized Plasma Center and the MEYS ESF Project CZ.1.07/2.3.00/20.0092: BIO-OPT-XUV (BOX) Research Team Advancement.


![Pulsed Quasi-monochromatic x-ray source for radiography and x … · 2018-06-22 · monochromatic image [6] and flat crystals are used for the quasi-monochromatic x-ray source [7]](https://img.dokumen.tips/doc/110x75/5fa9392718e985551817b3ff/pulsed-quasi-monochromatic-x-ray-source-for-radiography-and-x-2018-06-22-monochromatic.jpg)