Embed Size (px)
Citation preview
Spectrochimica Acta Part B 66 (2011) 767–775
Contents lists available at SciVerse ScienceDirect
Spectrochimica Acta Part B
j ourna l homepage: www.e lsev ie r .com/ locate /sab
Laser Ablation Molecular Isotopic Spectrometry: Strontium and its isotopes
Xianglei Mao a, Alexander A. Bol'shakov b, Inhee Choi a, Christopher P. McKay c, Dale L. Perry a,Osman Sorkhabi a, Richard E. Russo a,b,⁎a Lawrence Berkeley National Laboratory, University of California, Berkeley, CA 94720, USAb Applied Spectra, Inc., 46661 Fremont Boulevard, Fremont, CA 94538, USAc NASA-Ames Research Center, Moffett Field, CA 94035, USA
⁎ Corresponding author at: Lawrence Berkeley NatiCalifornia, Berkeley, CA 94720, USA.
E-mail address: [email protected] (R.E. Russo).
0584-8547/$ – see front matter © 2011 Elsevier B.V. Alldoi:10.1016/j.sab.2011.12.002
a b s t r a c t
a r t i c l e i n f oArticle history:Received 31 July 2011Accepted 3 December 2011Available online 13 December 2011
Keywords:Optical isotopic measurementLaser ablation plasmaMolecular emission spectrumLIBS analysisLAMIS of strontium
The experimental details are reported of Laser Ablation Molecular Isotopic Spectrometry (LAMIS) and its ap-plication for performing optical isotopic analysis of solid strontium-containing samples in ambient atmo-spheric air at normal pressure. The LAMIS detection method is described for strontium isotopes fromsamples of various chemical and isotopic compositions. The results demonstrate spectrally resolved measure-ments of the three individual 86Sr, 87Sr, and 88Sr isotopes that are quantified using multivariate calibration ofspectra. The observed isotopic shifts are consistent with those calculated theoretically. The measured spectraof diatomic oxide and halides of strontium generated in laser ablation plasmas demonstrate the isotopic res-olution and capability of LAMIS. In particular, emission spectra of SrO and SrF molecular radicals providedclean and well resolved spectral signatures for the naturally occurring strontium isotopes. A possibility is dis-cussed of using LAMIS of strontium isotopes for radiogenic age determination.
© 2011 Elsevier B.V. All rights reserved.
1. Introduction
Laser Ablation Molecular Isotopic Spectrometry (LAMIS) is a newapproach to rapid optical isotopic analysis of condensed samples inambient atmospheric air [1,2]. The technique exploits laser ablationof the sample and measurement of optical spectra from molecularspecies that are produced during plasma expansion into the air. Awell established and closely related technique known as Laser In-duced Breakdown Spectroscopy (LIBS) uses optical emission spectraof atoms and atomic ions to analyze solid, liquid or gaseous samples,including aerosols and suspended particles [3–6]. LAMIS expands thecapabilities of LIBS by adding isotope measurements.
The recognized advantages of LIBS include elemental analysis andmaterial classification at atmospheric pressure in real time; no sam-ple dissolution or other sample preparation, and no acidic consum-ables that would have to be disposed of after the analysis. As only amicrogram-sized amount of ablated material is required for analysis,the sample can be preserved for archiving. Both laboratory and fieldenvironments are appropriate to perform analyses, and in the lattercase open-path standoff measurements can be carried out [7,8]. LIBSis generally not utilized for isotopic detection because of two factors:very small isotope splitting in spectra of the majority of atomic spe-cies and significant broadening of these spectral lines in laser ablationplasmas at atmospheric pressure. For example, a characteristic
onal Laboratory, University of
rights reserved.
isotope shift in atomic emission spectra of strontium isotopes 86Srand 88Sr is only 0.25 pm (165 MHz=0.005 cm−1) [9,10] but thespectral lines of metals in LIBS plasma are broadened up to severalnanometers at early stages [11] and remain broadened to the orderof 100 pm at typical acquisition delays of ~1 μs and temporal gatewidths of several microseconds [12,13].
In earlier studies of LIBS at atmospheric pressure, the isotopic spectraof atoms or atomic ions were resolved or at least partially resolved onlyfor three elements (H, Li, and U) [14–16]. Hydrogen and lithium are verylight atoms inwhich nucleimove about the centroid commonwith theirelectron shells, thus resulting in relatively large changes in atomic ener-gy dependant on the number of protons and neutrons. In contrast, theuranium nucleus is so large that its volumetric charge causes deviationsfrom the intra-atomic Coulomb field distribution, which varies depend-ing on the number of protons and neutrons included in the nucleus.There are other subtle effects on the isotopic shift, such as the collectivemulti-electron interaction with the nucleus recoil, momentum couplingperturbations and an influence of the nuclear binding energy. Howeverin general, very light and very heavy elements represent the two oppo-site ends of relatively large splitting in atomic isotope spectra (15 pmbetween 6Li and 7Li atomic lines at 670.8 nm; and 25 pm between235U and 238U ionic lines at 424.4 nm [16]). For intermediate elements,interactions of electron shells with their nuclei areweak, yielding gener-ally very small isotopic differences in optical spectra [17]. As a result, theisotopic shifts for the majority of elements are no more than a few pic-ometers [18].
Broadening of spectral lines in laser ablation plasmas decreaseswith the reduction of pressure, due to the decrease in collision

768 X. Mao et al. / Spectrochimica Acta Part B 66 (2011) 767–775
frequency, diminishing electron density and related reduction in thetemperature. Consequently, the atomic isotope spectra of several ad-ditional elements (H, Li, Rb, Ce, Gd, U, Pu) could be optically resolvedin laser ablation plasmas at reduced pressure air or noble gasses[19–26]. Other plasma sources (arc, glow discharge, inductively-coupled plasma) at significantly lower electron densities relative tothe laser ablation plasma also were shown to provide isotopic mea-surements from optical emission spectra [27–32].
LAMIS is based on themeasurement ofmolecular emission spectra inlaser ablation plasmas [1,2]. Relative to atomic emission, molecular spec-tra can exhibit significantly larger isotopic shifts due to contributions ofthe vibrational and rotational motion in the molecule. Vibration and ro-tation ofmolecule's nuclei depend on the number of neutrons at a signif-icantly greater scale than does the electronic shell of a free atom. As anexample, the isotopic splitting for 10B and 11B atomic transition at208.9 nm is 2.5 pm but for boron monoxide 10BO and 11BO, the molecu-lar isotopic shift is more than 5 nm in the A2Πi (ν=0)→X2Σ+ (ν=3)transition [2]; that is three orders of magnitude larger isotopic effect.For strontiummonoxide 86SrO and 88SrO, we predicted and experimen-tally confirmed an isotopic shift of 148 pm (2.2 cm−1) in the origin ofSrO A1Σ+ (ν=2)→X1Σ+ (ν=0) emission band. This shift is signifi-cantly larger than the isotopic splitting of 0.25 pm (0.005 cm−1) in theatomic line at 689.5 nm [9], or splitting of 0.10 pm (0.006 cm−1) in theatomic ion line at 421.5 nm of 86Sr and 88Sr [33] (compare the shifts inSrO spectra for different Sr isotopes listed in Table 1 of this work).
Strontium has many roles in research and technology. Due to uniqueelectronic, optical, mechanical and chemical properties, strontium com-pounds are employed in a wide range of applications, including micro-electronic thin films for memory storage capacitors and tunablemicrowave filters [34,35], nonlinear photonic glasses [36], superconduc-tors [37], ceramics [38,39], catalysts [40,41], ferro- and piezoelectricnanotubes or nanorods [42,43]. Strontium iodide materials (ceramic orcrystalline) are the brightest known scintillators suitable for nuclear γ-ray radiation detection [38]. Strontium chemistry has been a focus ofmedical studies related to the treatment of osteoporosis [44] and ex-treme toxicity of heavy metal ingestion [45].
Strontium is a relatively abundant element in geological and nat-ural materials. Total Sr content up to ~3000 ppm is found in marineand magmatic carbonates. Although the major isotopes 88Sr, 87Srand 86Sr are stable, a continuous increase in 87Sr occurs naturallyover time as a result of radioactive β-decay of 87Rb. Hence, a ratio ofSr isotopes (normally 87Sr/86Sr) is extensively used for age dating ingeochronology, oceanography, archeology, and also as a provenancetracer for defining the origin of historic or forensic samples. Examples
Table 1The vibrational band origins and isotope shifts for the SrO transition A1Σ+→X1Σ+. Theisotope shifts (Δλ=λ88−λi) are given relative to the spectrum of 88Sr16O.
Molecule ν′ ν″ Wave number(cm−1)
Wavelength(nm)
Isotope shift(cm−1)
Isotope shift(pm)
88Sr16O 1 0 11488.2 870.219 0.0 0.02 0 12104.2 825.930 0.0 0.03 0 12718.5 786.042 0.0 0.0
90Sr16O 1 0 11487.2 870.297 1.0 −78.12 0 12102.1 826.072 2.1 −142.13 0 12715.3 786.235 3.1 −193.3
87Sr16O 1 0 11488.7 870.178 −0.5 40.22 0 12105.3 825.857 −1.1 73.03 0 12720.1 785.942 −1.6 99.4
86Sr16O 1 0 11489.3 870.137 −1.1 81.32 0 12106.4 825.783 −2.2 147.93 0 12721.7 785.841 −3.3 201.2
85Sr16O 1 0 11489.8 870.095 −1.6 123.32 0 12107.5 825.706 −3.3 224.23 0 12723.4 785.737 −4.9 304.9
84Sr16O 1 0 11490.4 870.052 −2.2 166.32 0 12108.7 825.628 −4.4 302.43 0 12725.1 785.630 −6.7 411.3
include the use of the 87Sr/86Sr ratio to infer rock ages [46]; to facili-tate the discovery of new petroleum reserves [47]; to determine theorigin of uranium ores [48]; to study agricultural soil–vegetation sys-tems and for food authentication [49]; to locate the origin and move-ment of different species of fish [50]; migration of ancient people[46,51] and Neanderthals [52].
At present, the determination of Sr isotopic ratios is usually accom-plished by thermal ionization mass spectrometry (TIMS) or multi-collector inductively coupled mass spectrometry (MC-ICP-MS). TIMSrelies on samplemicrodrilling, dissolution and chromatographic separa-tion of strontium from rubidium prior to the analysis. Pre-separation ofanalytes is necessary due to non-resolvable isobaric interference be-tween the 87Sr and 87Rb isotopes. Laser ablation sampling is oftenused with MC-ICP-MS, followed by indirect calculation of the 87Sr/86Srratio based on measurements of ratios 86Sr/88Sr, 84Sr/88Sr and 85Rb/87Rb [48,49,53]. Difficulties in measuring 87Sr versus 87Rb isotopesprompted the development of resonance ionization mass spectrometry(RIMS) inwhich two or three tunable lasers are simultaneously tuned atstrontium spectral lines to resonantly ionize Sr atoms in a laser pumpedmulti-step excitation process [54,55]. However, all techniques currentlyavailable for strontium isotopic analysis are tedious and require exten-sive instrumentation.
LAMIS is free from isobaric interferences, but other interferences inthe optical spectrum can play a role. Although LAMIS will be generallyless sensitive than the traditional mass spectrometry, all functional hard-ware can be engineered into a portable device which in principle can op-erate remotely in a fashion similar to the LIBS-based instrumentChemCam designed for a robotic mission to Mars [56]. Martian atmo-spheric pressure is only 0.5–0.9 kPa (4–7 Torr) that is favorable for for-mation of molecular radicals, which remain excited for a longer timewith their spectra less broadened than at terrestrial ambient pressure of~100 kPa. Along with optical spectra of 85Rb and 87Rb already measuredin laser ablation plasmas at low pressure [21], themeasurement of Sr iso-tope ratios using LAMIS can result in determination of the geological ageof rocks with uncertainty less than ±500Ma that corresponds to errorswithin±2% in the 87Rb/86Sr ratio. There is no othermeans tomake directage dating measurements on Mars (current age estimates have uncer-tainties in billions of years, and validity of these estimates for Mars geo-logical components is unknown [57]). The US National Research Councilstrongly emphasized a need to establish the absolute chronology ofMars and other planets as one of the cross-cutting “overarching issues”relevant to multiple missions to different celestial bodies [58].
Practical strontium analyses of structured materials in industryand inhomogeneous natural samples in geological studies usually re-quire localized microanalysis. For example, strontium titanate films inmemory capacitors are typically ~20 to ~250 nm thick, while the grainsizes in strontium ceramics as well as in natural rocks and other ma-terials are on the sub-millimeter scale. Surface scanning and depth-profiling capabilities are in the realm of commercial LIBS instruments[7,59] that can be adjusted for lateral resolution of ~10 μm and depthresolution of ~20 nm, with a nominal sample amount required of only~1 μg. Using such instruments, LAMIS can be straightforwardly imple-mented for rapid isotopic analysis.
The analyses of natural and enriched strontium isotopes usingLAMIS are reported in this manuscript. The results demonstrate sen-sitivity to 86Sr, 87Sr, and 88Sr with spectrally resolved measurementsfor each of these isotopes. Diatomic oxide and halides of strontiumwere used in this study to represent the application of LAMIS forisotope-specific analysis of solid samples in ambient temperatureand pressure conditions.
2. Experimental
Samples with known strontium isotopic content were ablatedusing a Nd:YAG laser with wavelength of 1064 nm, pulse durationof 4 ns, and adjustable pulse energy within 50–100 mJ. The laser

400 500 600 700 800 900 1000
0.1
1
10
100
1000*
*
+
30 μs
15 μs
6.7 μs
1 μs
0.26 μs
A-X1-0
A-X2-0
A-X3-0
Orange Band
++
Em
issi
on in
tens
ity (
Arb
. Uni
t)
Wavelength (nm)
Fig. 1. The emission spectra from ablation of the SrCO3 sample at different delay timeson a semi-logarithmic scale. The delays are indicated on the plot; the gate widths wereset at 10% of the delays (e.g., the gate width of 0.1 μs was used for the delay of 1 μs). Thestrontium ionic lines (407.8; 421.6; 430.5 nm) are denoted by a symbol “+”, the atom-ic line (460.7 nm) is denoted by a symbol “*”. The “Orange band” and three vibrationalbands of A1Σ+→X1Σ+ transition of SrO are labeled accordingly. Data were acquired ata spectral resolution of ~5 nm using a single laser pulse with energy of 60 mJ.
780 810 840 870 900 930 9600
2500
5000 Na
A-X
(0,
0)
A-X
(3,
0)
A-X
(2,
0)
A-X
(1,
0)
Em
issi
on in
tens
ity (
Arb
. Uni
t)
Wavelength (nm)
Fig. 2. Four vibrational bands of A1Σ+→X1Σ+ transition of SrO measured from laser ab-lation of the SrCO3 sample with laser energy of 60 mJ, laser spot diameter of 500 μm,delay of 1.3 μs, and gate width of 1100 μs. Two atomic sodium lines at 818.3 and819.5 nm are also present as a result of sample surface contamination by traces of Na.
769X. Mao et al. / Spectrochimica Acta Part B 66 (2011) 767–775
beam of approximately 6 mm in diameter was directed through afused silica lens (focal length 75 mm) to the sample. A focus pointwas positioned slightly below the sample surface to create a spot di-ameter of ~100 μm on the surface as determined by the size of the ab-lation crater. A second lens was used to collect the emission fromlaser ablation plasma onto the entrance of a fiber optic cable coupledto one of the two Czerny–Turner spectrographs available for thiswork. Acton SpectraPro SP2150 spectrograph with 150-mm focallength and two exchangeable gratings was used for low resolutionmeasurements. These two gratings (150 and 600 gr/mm) providedspectral resolution of 5 and 1.3 nm, respectively. High resolutionmeasurements were performed using Horiba JY 1250 M spectrographwith 1250-mm focal length and a grating of 1200 gr/mm. The spectralresolution was 0.04 nm in the latter case.
Both spectrographs were fitted with an Intensified Charge-Coupled Device (ICCD) camera as a detector. The acquisition of spec-tra was delayed after the laser ablation pulse, and the delay time wasvaried to maximize the intensity of molecular emission while mini-mizing continuum background and emission from atoms and atomicions. The data reported in this article represent measurements ofspectra from a single or accumulated multiple laser pulses. All mea-surements were performed in air at atmospheric pressure.
Strontium carbonate and strontium halide powders were obtainedfrom commercial sources, then mixed with 10% paraffin as a binderand pressed by a 7 ton press into one-centimeter diameter pellets.
SrCO3 powder (99.99% chemical purity) with natural isotopic abun-dance was obtained from Alfa Aesar, a Johnson Matthey Co. Isotope-enriched powders of 88SrCO3 (99.75% enriched in 88Sr), 87SrCO3
(90.6% enriched in 87Sr) and 86SrCO3 (96.3% enriched in 86Sr) wereobtained from Trace Sciences International Corp. and Cambridge Iso-tope Laboratories, Inc. Other SrCO3 powder included NIST Standard Ref-erence Material (SRM 987) with the certified values of the atomicisotope fractions in percent: 88Sr=82.5845±0.0066; 87Sr=7.0015±0.0026; 86Sr=9.8566±0.0034; and 84Sr=0.5574±0.0015 [60]. Thevalues of the Sr isotopic percentage were used in this work for propor-tional subtraction of the isotopomeric SrO spectra.
In addition to SrCO3, several strontium halides were utilized inthis study to demonstrate that molecular spectra of different diatomicradicals can be used for isotopic analysis in LAMIS. Strontium halidepowders of natural isotopic abundance included SrF2 (Sigma-Aldrich,98% purity), SrCl2 (Alfa Aesar, 99.5% purity), SrBr2 (Strem Chemicals,99% purity), and SrI2 (Alfa Aesar, 99.99% purity).
3. Results and discussion
Strontium monoxide, SrO is a relatively strong emitter in laser in-duced plasmas. Emission spectra of the isotopomeric radicals 88SrO,87SrO and 86SrO in the gaseous phase are well known and character-ized, particularly in the A1Σ+→X1Σ+ band system [61,62]. Strontiumatom has an electronic structure very similar to calcium, and there-fore SrO spectrophysical properties are similar to CaO [63]. Orangebands of CaO were often detected in arc and spark discharges [64]and are also clearly seen in ChemCam-like LIBS spectra from gypsumat 590–630 nm, although unresolved [65,66]. The analogous bandsof SrO are equally complex and congested but appear at somewhatlonger wavelengths than that of CaO. The low-resolution spectra ofSrO obtained in emission from laser ablation of SrCO3 are shown asa semi-logarithmic plot in Fig. 1. These spectra were recorded at dif-ferent delays (0.26 to 30 μs) after the ablation laser pulse to demon-strate their evolution in the plasma. Visibly, the continuumbackground decreases more than 3 orders of magnitude in the plasmafrom 0.26 to 30 μs. At delays longer than 6 μs, the SrO molecular emis-sion becomes prominent, while three strontium ionic lines (407.8;421.6; 430.5 nm, denoted by “+”) and one atomic line (460.7 nm,denoted by “*”) are diminishing. The three vibrational bands (1,0),(2,0) and (3,0) of the SrO A1Σ+→X1Σ+ system, the “Orange” band,
and several other SrO bands are seen in Fig. 1 with their locationsindicated.
The diatomic strontiumoxide radicals in the laser ablation plasma canoriginate from the direct extraction by a laser pulse from the sample inthe form of intact molecules. The other pathway of formation of theseradicals is association of the free Sr atoms evaporated from the samplewith dissociated atmospheric oxygen. A small deviation in plasma chem-istry of different isotopes of the same element may occur but in general,all isotopes undergo very similar reactions. Quantitative calibration canrelate the measured spectra of isotopomeric radicals in an ablation plas-ma to the original abundances of isotopes in the sample.
The spectral interval between 780 and 960 nm of the SrOA1Σ+→X1Σ+ band system observed in laser ablation plasma fromthe same SrCO3 target is presented in Fig. 2. This low-resolution spec-trum was measured with an acquisition delay of 1.3 μs after the laserpulse and long integration time (gate width of 1.1 ms). Four vibra-tional bands of SrO in the A→X system were observed along with
770 X. Mao et al. / Spectrochimica Acta Part B 66 (2011) 767–775
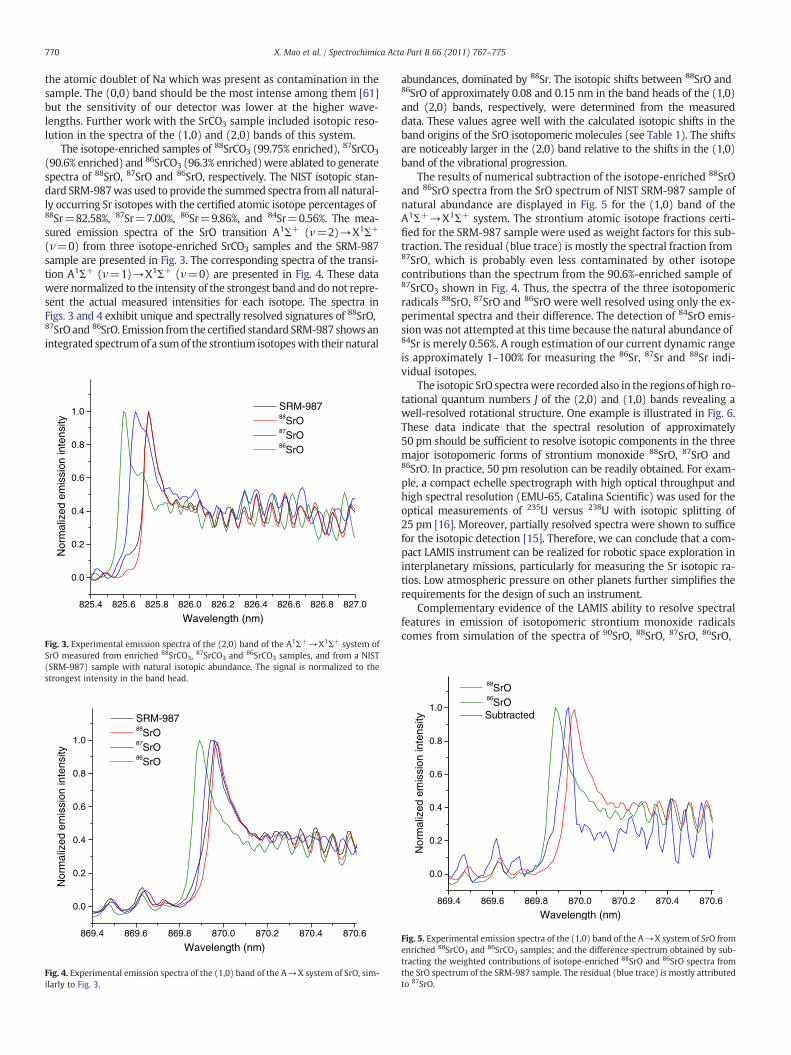
the atomic doublet of Na which was present as contamination in thesample. The (0,0) band should be the most intense among them [61]but the sensitivity of our detector was lower at the higher wave-lengths. Further work with the SrCO3 sample included isotopic reso-lution in the spectra of the (1,0) and (2,0) bands of this system.
The isotope-enriched samples of 88SrCO3 (99.75% enriched), 87SrCO3
(90.6% enriched) and 86SrCO3 (96.3% enriched)were ablated to generatespectra of 88SrO, 87SrO and 86SrO, respectively. The NIST isotopic stan-dard SRM-987was used to provide the summed spectra fromall natural-ly occurring Sr isotopes with the certified atomic isotope percentages of88Sr=82.58%, 87Sr=7.00%, 86Sr=9.86%, and 84Sr=0.56%. The mea-sured emission spectra of the SrO transition A1Σ+ (ν=2)→X1Σ+
(ν=0) from three isotope-enriched SrCO3 samples and the SRM-987sample are presented in Fig. 3. The corresponding spectra of the transi-tion A1Σ+ (ν=1)→X1Σ+ (ν=0) are presented in Fig. 4. These datawere normalized to the intensity of the strongest band and do not repre-sent the actual measured intensities for each isotope. The spectra inFigs. 3 and 4 exhibit unique and spectrally resolved signatures of 88SrO,87SrO and 86SrO. Emission from the certified standard SRM-987 shows anintegrated spectrumof a sumof the strontium isotopeswith their natural
825.4 825.6 825.8 826.0 826.2 826.4 826.6 826.8 827.0
0.0
0.2
0.4
0.6
0.8
1.0
Nor
mal
ized
em
issi
on in
tens
ity
Wavelength (nm)
SRM-98788SrO87SrO86SrO
Fig. 3. Experimental emission spectra of the (2,0) band of the A1Σ+→X1Σ+ system ofSrO measured from enriched 88SrCO3, 87SrCO3 and 86SrCO3 samples, and from a NIST(SRM-987) sample with natural isotopic abundance. The signal is normalized to thestrongest intensity in the band head.
869.4 869.6 869.8 870.0 870.2 870.4 870.6
0.0
0.2
0.4
0.6
0.8
1.0
Nor
mal
ized
em
issi
on in
tens
ity
Wavelength (nm)
SRM-987 88SrO 87SrO 86SrO
Fig. 4. Experimental emission spectra of the (1,0) band of the A→X system of SrO, sim-ilarly to Fig. 3.
abundances, dominated by 88Sr. The isotopic shifts between 88SrO and86SrO of approximately 0.08 and 0.15 nm in the band heads of the (1,0)and (2,0) bands, respectively, were determined from the measureddata. These values agree well with the calculated isotopic shifts in theband origins of the SrO isotopomeric molecules (see Table 1). The shiftsare noticeably larger in the (2,0) band relative to the shifts in the (1,0)band of the vibrational progression.
The results of numerical subtraction of the isotope-enriched 88SrOand 86SrO spectra from the SrO spectrum of NIST SRM-987 sample ofnatural abundance are displayed in Fig. 5 for the (1,0) band of theA1Σ+→X1Σ+ system. The strontium atomic isotope fractions certi-fied for the SRM-987 sample were used as weight factors for this sub-traction. The residual (blue trace) is mostly the spectral fraction from87SrO, which is probably even less contaminated by other isotopecontributions than the spectrum from the 90.6%-enriched sample of87SrCO3 shown in Fig. 4. Thus, the spectra of the three isotopomericradicals 88SrO, 87SrO and 86SrO were well resolved using only the ex-perimental spectra and their difference. The detection of 84SrO emis-sion was not attempted at this time because the natural abundance of84Sr is merely 0.56%. A rough estimation of our current dynamic rangeis approximately 1–100% for measuring the 86Sr, 87Sr and 88Sr indi-vidual isotopes.
The isotopic SrO spectrawere recorded also in the regions of high ro-tational quantum numbers J of the (2,0) and (1,0) bands revealing awell-resolved rotational structure. One example is illustrated in Fig. 6.These data indicate that the spectral resolution of approximately50 pm should be sufficient to resolve isotopic components in the threemajor isotopomeric forms of strontium monoxide 88SrO, 87SrO and86SrO. In practice, 50 pm resolution can be readily obtained. For exam-ple, a compact echelle spectrograph with high optical throughput andhigh spectral resolution (EMU-65, Catalina Scientific) was used for theoptical measurements of 235U versus 238U with isotopic splitting of25 pm [16]. Moreover, partially resolved spectra were shown to sufficefor the isotopic detection [15]. Therefore, we can conclude that a com-pact LAMIS instrument can be realized for robotic space exploration ininterplanetary missions, particularly for measuring the Sr isotopic ra-tios. Low atmospheric pressure on other planets further simplifies therequirements for the design of such an instrument.
Complementary evidence of the LAMIS ability to resolve spectralfeatures in emission of isotopomeric strontium monoxide radicalscomes from simulation of the spectra of 90SrO, 88SrO, 87SrO, 86SrO,
869.4 869.6 869.8 870.0 870.2 870.4 870.6
0.0
0.2
0.4
0.6
0.8
1.0
Nor
mal
ized
em
issi
on in
tens
ity
Wavelength (nm)
88SrO 86SrO Subtracted
Fig. 5. Experimental emission spectra of the (1,0) band of the A→X system of SrO fromenriched 88SrCO3 and 86SrCO3 samples; and the difference spectrum obtained by sub-tracting the weighted contributions of isotope-enriched 88SrO and 86SrO spectra fromthe SrO spectrum of the SRM-987 sample. The residual (blue trace) is mostly attributedto 87SrO.

874.0 874.2 874.4 874.6 874.8 875.0 875.2 875.4 875.6 875.8 876.0
0.0
0.2
0.4
0.6
0.8
1.0 88SrO 87SrO 86SrO
Nor
mal
ized
em
issi
on in
tens
ity
Wavelength (nm)
Fig. 6. Same as in Fig. 4 but for the spectral regions of high rotational quantum numbersJ in the (1,0) vibrational band of the A→X system.
869.4 869.6 869.8 870.0 870.2 870.4 870.60.0
0.2
0.4
0.6
0.8
1.0
Nor
mal
ized
em
issi
on in
tens
ity
Wavelength (nm)
90SrO 88SrO 87SrO 86SrO 85SrO 84SrO
Fig. 8. Same as in Fig. 7 but for the (1,0) band.
K I
SrCl2
102
103
104
SrF C 2Π - X 2Σ+
SrF2
102
103
Sr I
SrO Orange Band
SrCO3
771X. Mao et al. / Spectrochimica Acta Part B 66 (2011) 767–775
85SrO and 84SrO molecules. The results of the simulation of the (2,0)and (1,0) vibrational bands of the A1Σ+→X1Σ+ transition are pre-sented in Figs. 7 and 8, respectively, for the six isotopes of strontium.This simulation was performed in the same fashion as in our previousstudies [1,2] following Herzberg's framework of molecular spectra[67]. The molecular constants for the simulation were taken from[68]. Simulated intensities do not include any isotopic abundance fac-tors but in each case assume 100% pure content of a given isotope todemonstrate the magnitude of the isotopic shifts between the spec-tra. The laser plasma at extended delays after the laser pulse was as-sumed to reach local thermodynamic equilibrium (LTE) with auniform and quasi-steady-state temperature. The temperature was afitting parameter, and a value of 3000 K was chosen for these spectralsimulations. An acceptable agreement between experimental andsimulated spectra of 88SrO, 87SrO and 86SrO justifies our simple as-sumption of a steady-state LTE model.
The calculated SrO band origins and isotopic shifts for the sixstrontium isotopes are summarized in Table 1. All shifts are reportedrelative to 88SrO because 88Sr is the most abundant naturally occur-ring isotope of strontium. The shifts in wavelength versus those inwavenumbers have the opposite signs due to the fact that the wave-length increases when the wavenumber decreases and vice versa. Theisotopic shifts are up to 411 pm depending on the band and isotope.
825.0 825.2 825.4 825.6 825.8 826.0 826.2 826.4 826.6 826.8 827.00.0
0.2
0.4
0.6
0.8
1.0
Nor
mal
ized
em
issi
on in
tens
ity
Wavelength (nm)
90SrO 88SrO 87SrO 86SrO 85SrO 84SrO
Fig. 7. Simulated emission spectra of the (2,0) band of the A→X system for 90SrO,88SrO, 87SrO, 86SrO, 85SrO and 84SrO.
In further work, we can model or fit the experimental data such asthat shown in Figs. 3–6. The ability to model experimentally mea-sured spectra opens the door for performing isotopic analysis on un-known samples such as we previously demonstrated for a boronnitride sample [2].
300 400 500 600 700 800 900102
103
SrCl C 2Π - X 2Σ+
SrI C 2Π - X 2Σ+
Wavelength (nm)
SrI2
102
103
104
SrBr C 2Π - X 2Σ+
SrBr2
102
103 Na I
Fig. 9. Spectra of diatomic molecules obtained from ablation of SrCO3, SrF2, SrCl2, SrBr2, andSrI2 samples. The vertical arrows indicate the position of the “Orange band” of SrO. Identi-fied bands of strontium halides are listed in Tables 2–5. All spectra include the Sr atomicline at 460.7 nm. Spectral resolution was ~1.3 nm. Delay was 10 μs; gate width was 30 μs.

772 X. Mao et al. / Spectrochimica Acta Part B 66 (2011) 767–775
We performed multivariate calibration using our strontium car-bonate samples with known isotopic composition as standards: thethree isotope-enriched samples and one NIST-certified sample withnatural isotopic abundance. A linear regression fitted with partialleast squares (PLS) was used to match a spectrum of the unknownsample to one of the reference spectra. We applied this PLS routineto obtain multivariate calibration that takes into account all spectralintensities at every pixel within the region of 870–880 nm. In thiswavelength interval the SrO emission is dominated by the (1,0)band with minor contributions from the (2,0) band of the electronictransition system A1Σ+→X1Σ+. The multivariate approach is moreaccurate, robust and reliable in comparison to traditional univariatecalibration. Multivariate calibration can be performed correctly evenwhen spectra are only partially resolved that is particularly importantfor molecular spectra [2].
In order to compile a library of reference spectra for themultivariatePLS calibration, we recorded 100 separate spectra from each referencesample without averaging or accumulating signals. Each spectrum wasfroma single laser pulse. Using these spectra, we calculated a PLS regres-sion coefficient matrix that correlated strontium isotopic abundance tothe relevant reference spectra, which included information on theirpulse-to-pulse variability. The PLS regression model was fully cross-validated by consecutively removing every individual spectrum from
389 390 391 392 393 394 395 396 397 398 399 400 4015000
6000
7000
8000
9000
10000
11000
12000
(0-1)
(1-0)
(1-0)
(0-0)(0-0)
Em
issi
on In
tens
ity (
Arb
. Uni
t)
Wavelength (nm)
SrCl
364 365 366 367 368 369 370 371 372 373 374 375 3765000
10000
15000
20000
25000
Δν = -1
Δν = 0
Em
issi
on in
tens
ity (
Arb
. Uni
t)
Wavelength (nm)
SrF
(a)
(b)
Fig. 10. Spectra of the C2Π→X2Σ+ band structure of strontium monohalides: (a) SrF; (b) Srindicated in the figure. Two bands with the same vibrational quantum numbers are observ
the library and treating it as the unknown. As a result of thismultivariatecalibration of spectral intensities, isotope composition of the samplewith natural isotopic abundance was predicted to be 9.8±2.8% (86Sr),9.1±3.5% (87Sr), and 81.6±3.4% (88Sr). These values are fairly consis-tent with the true isotopic abundances of 9.86% (86Sr), 7.00% (87Sr),and82.58% (88Sr) certified byNIST. This approach to isotopic determina-tion is fully empirical and does not require simulating the spectra or as-suming the thermalized plasma state. Precision of isotope quantificationcan be improved.
In addition to SrO, spectra of diatomic halides of strontium SrF,SrCl, SrBr, and SrI were measured in our laser induced plasmas. Sever-al different halide samples (SrF2, SrCl2, SrBr2, and SrI2) were ablatedin ambient air, and the emission spectra of SrF, SrCl, SrBr, and SrIwere measured from the respective samples. These emission spectraare shown in Fig. 9 at spectral resolution of ~1.3 nm. The SrO emissionspectrum obtained from the SrCO3 sample is also included in Fig. 9 toprovide a comparison. Ablating the SrCO3 sample generates mostlySrO emission. For strontium halides, ablation generates emission ofboth SrO and strontium monohalides. Each diatomic halide of stron-tium has its own spectral signature that appears in a different spectralregion with its own unique structure. The spectral features of theC2Π→X2Σ+ transition for each halide are labeled accordingly inFig. 9. In these experiments, some portion of the diatomic halides of
434 436 438 440 442 444 446
10000
15000
20000
25000
Sr I
Sr I(2-0)
(1-0)
(0-1)
(0-0)
Em
issi
on In
tens
ity (
Arb
. Uni
t)
Wavelength (nm)
SrI
409 410 411 412 413 414 415 416 417 418 419 420 4215000
6000
7000
8000
9000
10000
11000
12000
13000
(0-2)
(0-2)(0-1)
(0-1)
(0-0)
Em
issi
on In
tens
ity (
Arb
. Uni
t)
Wavelength (nm)
SrBr
(d)
(c)
Cl; (c) SrBr; and (d) SrI. Spectral resolution was ~40 pm. Assigned vibrational bands areed for SrCl and SrBr because of doublet splitting (see Tables 3 and 4).

Table 4The vibrational band origins and isotope shifts for the 86Sr81Br and 88Sr81Br (only ex-perimentally observed bands are listed).
Transition ν′ ν″ Wave number(cm−1)
Wavelength(nm)
Isotope shift(cm−1)
Isotopeshift (pm)
C2Π3/2→X2Σ+ 5 0 25671.5 389.427 −5.5 83.54 0 25471.2 392.490 −4.4 68.13 0 25269.9 395.616 −3.3 52.02 0 25067.6 398.808 −2.2 35.31 0 24864.4 402.068 −1.1 17.70 0 24660.2 405.398 0.0 −0.50 1 24444.7 408.972 1.2 −20.50 2 24230.2 412.591 2.4 −40.90 3 24016.8 416.258 3.6 −61.90 4 23804.4 419.973 4.7 −83.40 5 23593.0 423.736 5.9 −105.5
C2Π1/2→X2Σ+ 5 0 25349.4 394.376 −5.5 85.64 0 25149.1 397.517 −4.4 69.93 0 24947.8 400.724 −3.3 53.42 0 24745.5 403.999 −2.2 36.21 0 24542.3 407.345 −1.1 18.20 0 24338.1 410.763 0.0 −0.50 1 24122.6 414.433 1.2 −21.00 2 23908.1 418.150 2.4 −42.00 3 23694.7 421.917 3.6 −63.60 4 23482.3 425.734 4.7 −85.7
B2Σ+→X2Σ+ 3 0 16014.1 624.275 −3.6 141.92 0 15795.4 632.919 −2.4 98.01 0 15575.6 641.850 −1.2 50.90 0 15354.7 651.084 0.0 0.6
A2Π1/2→X2Σ+ 0 0 14702.2 679.983 0.0 0.70 1 14486.7 690.097 1.2 −56.00 2 14272.3 700.467 2.4 −115.60 3 14058.8 711.101 3.5 −178.3
773X. Mao et al. / Spectrochimica Acta Part B 66 (2011) 767–775
strontium is likely to be extracted by a laser pulse directly from thesample in the form of intact molecular radicals, native to the sample.Concurrently, the presence of the “Orange band” of SrO in all of thespectra displayed in Fig. 9 indicates that the SrO radicals are beingformed in plasma-chemical reactions, which occur in a laser ablationplume expending into the air. The origin and pathways of the oxideand halide species are currently under study.
High resolution spectra of the C2Π→X2Σ+ system of SrF, SrCl,SrBr, and SrI are presented in four parts of Fig. 10. Because of thesmall rotational constants for these halides, the rotational structureis not resolved, contrary to the well-resolved structure of SrO (seeFig. 6). Nonetheless, the vibrational progressions are clearly presentand are labeled in Fig. 10. Tables 2–5 list the band origin locationsand isotopic shifts for the measured emission bands of SrF, SrCl,SrBr, and SrI, respectively.
Fig. 11 displays the high-resolution measured emission spectrum ofB2Σ+→X2Σ+ transition of SrF between 561 and 573 nm. The spectrumincludes a vibrational progression (Δν=1) with unresolved rotationalstructure. At higher vibrational quantum numbers, the doublet natureof this transition is apparent; theminor splittings are due to the divergingR1 and R2 rotational branches. The relevant simulated spectra are shownin Fig. 12 for comparison.When the natural abundances of Sr isotopes arefactored in, the experimental data can be simulated suitably well(Fig. 13). The simulated spectrum in Fig. 13 (black trace) was computedusing the weighted sum of strontium isotopes 88Sr×0.8258+87Sr×0.07+86Sr×0.0986+84Sr×0.0056 in accordance with their natu-ral abundances. No fitting was performed in the latter case; the weightfactors reproducing natural isotopic abundances provide nearly perfectspectral overlap.
Table 2The vibrational band origins and isotope shifts for the 86Sr19F and 88Sr19F (only exper-imentally observed bands are listed).
Transition ν′ ν″ Wave number(cm−1)
Wavelength(nm)
Isotope shift(cm−1)
Isotopeshift (pm)
C2Π1/2→X2Σ+ 0 0 27358.3 365.416 0.1 −0.70 1 26860.4 372.189 1.1 −14.8
B2Σ+→X2Σ+ 0 0 17264.1 579.076 0.0 −0.21 0 17755.2 563.058 −1.0 31.6
A2Π3/2→X2Σ+ 0 0 15351.5 651.223 0.0 0.21 0 15854.4 630.565 −1.0 41.1
Table 3The vibrational band origins and isotope shifts for the 86Sr35Cl and 88Sr35Cl (only experi-mentally observed bands are listed).
Transition ν′ ν″ Wave number(cm−1)
Wavelength(nm)
Isotope shift(cm−1)
Isotopeshift (pm)
C2Π3/2→X2Σ+ 2 0 25951.6 385.223 −1.8 26.81 0 25671.9 389.420 −0.9 13.50 0 25390.4 393.739 0.0 −0.50 1 25090.0 398.453 1.0 −16.10 2 24791.5 403.251 2.0 −32.40 3 24494.9 408.134 2.9 −49.20 4 24200.2 413.104 3.9 −66.50 5 23907.4 418.163 4.8 −84.5
C2Π1/2→X2Σ+ 2 0 25793.4 387.587 −1.8 27.01 0 25514.8 391.818 −0.9 13.60 0 25234.5 396.171 0.0 −0.50 1 24934.1 400.944 1.0 −16.40 2 24635.6 405.802 2.0 −32.80 3 24339.0 410.747 3.0 −49.80 4 24044.3 415.781 3.9 −67.40 5 23751.5 420.907 4.8 −85.7
B2Σ+→X2Σ+ 1 0 16026.0 623.814 −1.0 39.10 0 15721.5 635.894 0.0 0.30 1 15421.1 648.281 1.0 −41.2
A2Π3/2→X2Σ+ 0 0 15116.1 661.361 0.0 0.50 1 14815.7 674.771 1.0 −44.40 2 14517.2 688.646 1.9 −92.4
Table 5The vibrational band origins and isotope shifts for the 86Sr127I and 88Sr127I (only exper-imentally observed bands are listed).
Transition ν′ ν″ Wave number(cm−1)
Wavelength(nm)
Isotope shift(cm−1)
Isotopeshift (pm)
C2Π1/2→X2Σ+ 5 0 23508.2 425.264 −5.7 102.94 0 23340.9 428.312 −4.6 83.83 0 23172.9 431.418 −3.4 64.02 0 23004.1 434.582 −2.3 43.41 0 22834.7 437.807 −1.1 22.00 0 22664.5 441.095 0.0 −0.20 1 22491.1 444.496 1.2 −23.60 2 22318.4 447.935 2.4 −47.50 3 22146.4 451.414 3.5 −71.9
A2Π1/2→X2Σ+ 1 0 14608.0 684.369 −1.3 59.00 0 14426.8 692.965 0.0 1.30 1 14253.4 701.396 1.2 −56.8
4. Conclusion
Application of LAMIS is reported for rapid optical isotopic analysisof solid samples in ambient atmospheric air. The spectrally resolvedmeasurements of the individual isotopes 86Sr, 87Sr, and 88Sr weredemonstrated. Spectra of diatomic oxide and halides of strontiumgenerated in laser ablation plasma were used in this study. The isoto-pic shift of 0.15 nm in emission spectra of 86SrO and 88SrO was mea-sured, and significantly larger shifts are predicted. A better accuracyin prediction of the computed molecular spectra should improve theLAMIS detection limits when the isotopic determination includes nu-merical spectroscopic subtraction. A possibility of using LAMIS ofstrontium isotopes for radiogenic age determination was discussed.Based on this study, a compact LAMIS instrument for robotic spaceexploration can be realized. Low atmospheric pressure on otherplanets simplifies the requirements for the design of such an instru-ment. Although 84Sr was not studied, we believe this isotope is alsodetectable based on our calculations.

561 562 563 564 565 566 567 568 569 570 571 572 573
5000
10000
15000
20000
25000
Em
issi
on in
tens
ity (
Arb
. Uni
t)
Wavelength (nm)
Fig. 11. Experimental emission spectrum of the vibrational band system (Δν=1) of theSrF transition B2Σ+→X2Σ+ obtained from ablation of the SrF2 sample.
561.5 562.0 562.5 563.0 563.5 564.0 564.5
0.0
0.2
0.4
0.6
0.8
1.0
Nor
mal
ized
em
issi
on in
tens
ity
Wavelength (nm)
90SrF 88SrF 87SrF 86SrF 85SrF 84SrF
Fig. 12. Simulated emission spectra of the vibrational band system (Δν=1) of the SrFtransition B2Σ+→X2Σ+ for 90SrF, 88SrF, 87SrF, 86SrF, 85SrF and 84SrF.
562.0 562.2 562.4 562.6 562.8 563.0
0.0
0.2
0.4
0.6
0.8
1.0
Nor
mal
ized
em
issi
on in
tens
ity
Wavelength (nm)
Simulation Experiment
Fig. 13. Comparison of the SrF experimental spectrum (fraction of data in Fig. 11) to aweighted sum of simulated spectra with the factors 88Sr×0.8258+87Sr×0.07+86Sr×0.0986+84Sr×0.0056.
774 X. Mao et al. / Spectrochimica Acta Part B 66 (2011) 767–775
Acknowledgment
This work was supported by the Defense Threat Reduction Admin-istration (DTRA) of the U. S. Department of Defense under FederalAward Nos. LB09005541 and LB09005541A, and Contract No. DE-AC02-05CH11231 awarded by the U.S. Department of Energy throughthe National Nuclear Security Administration (NNSA) and NASA Con-tract No. NNX10CA07C awarded to Applied Spectra, Inc.
References
[1] R.E. Russo, A.A. Bol'shakov, X. Mao, C.P. McKay, D.L. Perry, O. Sorkhabi, Laser abla-tion molecular isotopic spectrometry, Spectrochim. Acta Part B 66 (2011) 99–104.
[2] X. Mao, A.A. Bol'shakov, D.L. Perry, O. Sorkhabi, R.E. Russo, Laser ablation molec-ular isotopic spectrometry: parameter influence on boron isotope measurements,Spectrochim. Acta Part B 66 (2011) 604–609.
[3] D.M. Wong, A.A. Bol'shakov, R.E. Russo, Laser induced breakdown spectroscopy,in: J. Lindon, G. Tranter, D. Koppenaal (Eds.), Encyclopedia of Spectroscopy andSpectrometry, 2nd Edition, Academic Press, 2010, pp. 1281–1287.
[4] J.P. Singh, S.N. Thakur (Eds.), Laser-Induced Breakdown Spectroscopy, Elsevier,Amsterdam, Oxford, 2007.
[5] D.A. Cremers, L.J. Radziemski, Handbook of Laser-Induced Breakdown Spectrosco-py, J. Wiley & Sons, New York, 2006.
[6] A.W. Miziolek, V. Palleschi, I. Schechter (Eds.), Laser-Induced Breakdown Spec-troscopy (LIBS), Fundamentals and Applications, Cambridge University Press,UK, 2006.
[7] A.A. Bol'shakov, J. Yoo, C. Liu, J.R. Plumer, R.E. Russo, Laser-induced breakdownspectroscopy in industrial and security applications, Appl. Opt. 49 (2010)C132–C142.
[8] R.E. Russo, T.W. Suen, A.A. Bol'shakov, J. Yoo, O. Sorkhabi, X. Mao, J. Gonzalez, D.Oropeza, V. Zorba, Laser plasma spectrochemistry, J. Anal. At. Spectrom. 26(2011) 1596–1603.
[9] B.A. Bushaw, B.D. Cannon, Diode laser based resonance ionization mass spectro-metric measurement of strontium-90, Spectrochim. Acta Part B 52 (1997)1839–1854.
[10] A.A. Celikov, A.M. Akulshin, V.L. Velichansky, A.S. Zibrov, Doppler-free spectroscopy ofthe 5 1S0–5 3P1 strontium intercombination transition, Laser Phys. 5 (1995) 739–746.
[11] H.C. Liu, X.L. Mao, J.H. Yoo, R.E. Russo, Early phase laser induced plasma diagnos-tics and mass removal during single-pulse laser ablation of silicon, Spectrochim.Acta Part B 54 (1999) 1607–1624.
[12] J. Bengoechea, C. Aragón, J.A. Aguilera, Asymmetric stark broadening of the Fe I538.34 nm emission line in a laser induced plasma, Spectrochim. Acta Part B 60(2005) 897–904.
[13] W. Hübert, G. Ankerhold, Elemental misinterpretation in automated analysis ofLIBS spectra, Anal. Bioanal. Chem. 400 (2011) 3273–3278.
[14] A. D'Ulivo, M. Onor, E. Pitzalis, R. Spiniello, L. Lampugnani, G. Cristoforetti, S. Legnaioli,V. Palleschi, A. Salvetti, E. Tognoni, Determination of the deuterium/hydrogen ratio ingas reaction products by laser-induced breackdown spectroscopy, Spectrochim. ActaPart B 61 (2006) 797–802.
[15] F.R. Doucet, G. Lithgow, R. Kosierb, P. Bouchard, M. Sabsabi, Determination of iso-tope ratios using laser-induced breakdown spectroscopy in ambient air at atmo-spheric pressure for nuclear forensics, J. Anal. At. Spectrom. 26 (2011) 536–541.
[16] D.A. Cremers, A. Beddingfield, R. Smithwick, R.C. Chinni, C.R. Jones, B. Beardsley, L.Karch, Monitoring uranium, hydrogen, and lithium and their isotopes using acompact Laser-Induced Breakdown Spectroscopy probe and high resolution spec-trometer, Appl. Spectrosc. 66 (in press).
[17] A.F. Golovin, A.R. Striganov, The isotope effect in the spectra of the heavy ele-ments, Sov. Phys. Usp. 10 (1968) 658–673.
[18] R.C. Stern, B.B. Snavely, The laser isotope separation program at Lawrence Liver-more Laboratory, Ann. N. Y. Acad. Sci. 267 (1976) 71–79.
[19] L. Mercadier, J. Hermann, C. Grisolia, A. Semerok, Plume segregation observedin hydrogen and deuterium containing plasmas produced by laser ablation ofcarbon fiber tiles from a fusion reactor, Spectrochim. Acta Part B 65 (2010)715–720.
[20] B.W. Smith, I.B. Gornushkin, L.A. King, J.D. Winefordner, A laser ablation-atomicfluorescence technique for isotopically selective determination of lithium insolids, Spectrochim. Acta Part B 53 (1998) 1131–1138.
[21] L.A. King, I.B. Gornushkin, D. Pappas, B.W. Smith, J.D. Winefordner, Rubidium iso-tope measurements in solid samples by laser ablation-laser atomic absorptionspectroscopy, Spectrochim. Acta Part B 54 (1999) 1771–1781.
[22] A. Quentmeier, M. Bolshov, K. Niemax, Measurement of uranium isotope ratios insolid samples using laser ablation and diode laser-atomic absorption spectrome-try, Spectrochim. Acta Part B 56 (2001) 45–55.
[23] W. Pietsch, A. Petit, A. Briand, Isotope ratio determination of uranium by opticalemission spectroscopy on a laser-produced plasma— basic investigations and an-alytical results, Spectrochim. Acta Part B 53 (1998) 751–761.
[24] M. Miyabe, M. Oba, H. Iimura, K. Akaoka, Y. Maruyama, I. Wakaida, Spectroscopyof laser-produced cerium plasma for remote isotope analysis of nuclear fuel, Appl.Phys. A 101 (2010) 65–70.
[25] B.A. Bushaw, N.C. Anheier, Isotope ratio analysis on micron-sized particles incomplex matrices by laser ablation–absorption ratio spectrometry, Spectrochim.Acta Part B 64 (2009) 1259–1265.

775X. Mao et al. / Spectrochimica Acta Part B 66 (2011) 767–775
[26] C.A. Smith, M.A. Martinez, D.K. Veirs, D.A. Cremers, Pu-239/Pu-240 isotope ratiosdetermined using high resolution emission spectroscopy in a laser-induced plas-ma, Spectrochim. Acta Part B 57 (2002) 929–937.
[27] D. Vukanović, V. Vukanović, On the behaviour of hydrogen isotopes in a d.c. arcplasma, Spectrochim. Acta Part B 24 (1969) 579–583.
[28] A.G. Zhiglinskii, G.G. Kund, On the spectral determination of the isotopic compo-sition of strontium, Opt. Spectrosc. 7 (1957) 490.
[29] V.M. Nemets, A.A. Petrov, A.A. Solov'ev, Aspects of isotopic composition determi-nation of hydrogen in plasma of a radio-frequency discharge at low and interme-diate pressures, Zh. Prikl. Spektrosk. 34 (1981) 400–405.
[30] M.C. Edelson, V.A. Fassel, Isotopic abundance determinations by inductively coupledplasma atomic emission spectrometry, Anal. Chem. 53 (1981) 2345–2347.
[31] P.S. Goodall, S.G. Johnson, Isotopic uranium determination by inductively coupledplasma atomic emission spectrometry using conventional and laser ablation sam-ple introduction, J. Anal. At. Spectrom. 11 (1996) 57–60.
[32] M. Krachler, P. Carbol, Validation of isotopic analysis of depleted, natural andenriched uranium using high resolution ICP-OES, J. Anal. At. Spectrom. 26(2011) 293–299.
[33] K. Heilig, Die Isotopieverschiebung zwischen den geraden Sr-Isotopen 84, 86, 88und 90 und der Sprungim Kernvolumeneffekt bei der Neutronenzahl 50, Z. Phys.161 (1961) 252–266.
[34] S. Zafar, R.E. Jones, B. Jiang, B. White, V. Kaushik, S. Gillespie, The electronic con-duction mechanism in barium strontium titanate thin films, Appl. Phys. Lett. 73(1998) 3533–3535.
[35] P. Padmini, T.R. Taylor, M.J. Lefevre, A.S. Nagra, R.A. York, J.S. Speck, Realization ofhigh tunability barium strontium titanate thin films by rf magnetron sputtering,Appl. Phys. Lett. 75 (1999) 3186–3188.
[36] P. Molina, M. de la O. Ramírez, L.E. Bausá, Strontium barium niobate as a multi-functional two-dimensional nonlinear photonic glass, Adv. Funct. Mater. 18(2008) 709–715.
[37] Y. Maeno, T.M. Rice, M. Sigrist, The intriguing superconductivity of strontiumruthenate, Phys. Today (January 2001) 42–47.
[38] S.R. Podwitz, R.M. Gaume, W.T. Hong, A. Laouar, Fabrication and properties oftranslucent SrI2 and Eu:SrI2 scintillator ceramics, IEEE Trans. Nucl. Sci. 57(2010) 3827–3835.
[39] R. Moos, K.H. Hardtl, Defect chemistry of donor-doped and un-doped strontiumtitanate ceramics between 1000° and 1400 °C, J. Am. Ceram. Soc. 80 (1997)2549–2562.
[40] M. Agostinho, S. Kobayashi, Strontium-catalyzed highly enantioselective Michaeladditions of malonates to enones, J. Am. Chem. Soc. 130 (2008) 2430–2431.
[41] R. Voyatriz, J.B. Moffat, Simultaneous, sequential, and reverse sequential tech-niques for the preparation of binary silica-supported sodium/strontium catalystsand the effect of carbon tetrachloride on the oxidative coupling of methane, En-ergy Fuel 8 (1994) 1106–1114.
[42] F.D. Morrison, L. Ramsay, J.F. Scott, High aspect ratio piezoelectric strontium–bis-muth–tantalate nanotubes, J. Phys. Condens. Matter 15 (2003) L527–L532.
[43] J.J. Urban, W.S. Yun, Q. Gu, Hongkun Park, Synthesis of single-crystalline perov-skite nanorods composed of barium titanate and strontium titanate, J. Am.Chem. Soc. 124 (2002) 1186–1187.
[44] P.J. Marie, Optimizing bone metabolism in osteoporosis: insight into the pharma-cologic profile of strontium ranelate, Osteoporos. Int. 14 (2003) 9–12.
[45] B.M. Kirrane, L.S. Nelson, R.S. Hoffman, Massive strontium ferrite ingestion with-out acute toxicity, Basic Clin. Pharmacol. Toxicol. 99 (2006) 358–359.
[46] A. Gilli, D.A. Hodell, G.D. Kamenov, M. Brenner, Geological and archaeological im-plications of strontium isotope analysis of exposed bedrock in the Chicxulub cra-ter basin, northwestern Yucatan, Mexico, Geol. 37 (2009) 723–726.
[47] S.N. Ehrenberg, J.M. McArthur, M.F. Thirwall, Strontium isotope dating of spiculi-tic Permian strata from Spitsbergen outcrops and Barents sea well-cores, J. Petrol.Geol. 33 (2010) 247–254.
[48] Z. Varga, M. Wallenius, K. Mayer, E. Keegan, S. Millet, Application of lead and stron-tium ratio measurements for the origin assessment of uranium ore concentrates,Anal. Chem. 81 (2009) 8327–8334.
[49] G. Fortunato, K. Mumic, S. Wundeli, L. Pillonel, J. So Bosset, G. Gremaud, Applica-tion of strontium isotope abundance ratios measured by MC-ICP-MS for food au-thentication, J. Anal. At. Spectrom. 19 (2004) 227–234.
[50] B.P. Kennedy, J.D. Blum, C.L. Folt, K.H. Nislow, Using natural strontium isotopicsignatures as fish markers: methodology and application, Can. J. Fish. Aquat. Sci.57 (2000) 2280–2292.
[51] A. Nafplioti, Tracing population mobility in the Aegean using isotope geochemis-try: a first map of local biologically available 87Sr/86Sr signatures, J. Archaeol. Sci.38 (2011) 1560–1570.
[52] M. Richards, K. Harvati, V. Grimes, C. Smith, T. Smith, J.-J. Hablin, P. Karkanas,E. Panagopoulou, Strontium isotope evidence of Neanderthal mobility at the site ofLakonis, Greece using laser-ablation PIMMS, J. Archaeol. Sci. 35 (2008) 1251–1256.
[53] P.Z. Vroon, B. van der Wagt, J.M. Koornneef, G.R. Davies, Problems in obtainingprecise and accurate Sr isotope analysis from geological materials using laser ab-lation MC-ICPMS, Anal. Bioanal. Chem. 390 (2008) 465–476.
[54] I.K. Perera, I.C. Lyon, G. Turner, Isotope ratio measurements in strontium usingtwo-photon two-colour resonance ionization mass spectrometry, J. Anal. At.Spectrom. 10 (1995) 273–280.
[55] H. Tomita, C. Mattolat, S. Raeder, S. Sasada, Y. Higuchi, K. Takezawa, T. Muramatsu, T.Iguchi, K. Wendt, Development of laser ablation assisted resonant ionization massspectrometry for isotope analysis, Hyperfine Interact. 196 (2010) 169–176.
[56] C. Fabre, S. Maurice, A. Cousin, R.C. Wiens, O. Forni, V. Sautter, D. Guillaume, On-board calibration igneous targets for the Mars Science Laboratory Curiosity roverand the Chemistry Camera laser induced breakdown spectroscopy instrument,Spectrochim. Acta Part B 66 (2011) 280–289.
[57] W.K. Hartmann, G. Neukum, Cratering chronology and the evolution of Mars,Space Sci. Rev. 96 (2001) 165–194.
[58] Assessment of NASA's Mars Architecture 2007–2016, National Research Council,National Academies Press, Washington, D.C, 2006.
[59] Applied Spectra instruments, www.appliedspectra.com/products/.[60] L.J. Moore, T.J. Murphy, I.L. Barnes, P.J. Paulsen, Absolute isotopic abundance ratios
and atomic weight of a reference sample of strontium, J. Res. (NBS) 87 (1982) 1–8.[61] H. Li, R. Skelton, C. Focsa, B. Pinchemel, P.F. Bernath, Fourier transform spectros-
copy of chemiluminescence from the SrO A1Σ+–X1Σ+ transition, J. Mol. Spec-trosc. 203 (2000) 188–195.
[62] D. Husain, G. Roberts, Time-resolved molecular chemiluminescence investiga-tions of SrO following pulsed dye-laser generation of Sr (5s5p (3PJ)) in the pres-ence of N2O, Chem. Phys. 138 (1989) 187–202.
[63] R. Hefferlin, R. Campbell, D. Gimbel, H. Kuhlman, T. Cayton, The periodic table ofdiatomic molecules – I. An algorithm for retrieval and prediction of spectrophysi-cal properties, Quant. Spectrosc. Radiat. Transfer 21 (1979) 315–336.
[64] B. Rosen, S. Weniger, Spectroscopie moléculaire — spectres d'émission des oxidesde calcium, C.R. Acad. Sci. 248 (1959) 1645–1646.
[65] J. Thompson, R. Wiens, S. Sharma, P. Lucey, A. Misra, Combined remote LIBS andRaman spectroscopy measurements, 36th Lunar and Planetary Science Conf., LeagueCity, TX, 2005, poster 1517 www.lpi.usra.edu/meetings/lpsc2005/pdf/1517.pdf.
[66] R.C. Wiens, S.K. Sharma, J. Thompson, A. Misra, P.G. Lucey, Joint analyses by laser-induced breakdown spectroscopy (LIBS) and Raman spectroscopy at stand-offdistances, Spectrochim. Acta Part B 61 (2005) 2324–2334.
[67] G. Herzberg, Molecular spectra and molecular structure. I, Spectra of DiatomicMolecules, 2nd Ed., Van Nostrand Reinhold, New York, 1950.
[68] K.P. Huber, G. Herzberg, Molecular spectra and molecular structure. VI, Constantsof Diatomic Molecules, Van Nostrand Reinhold, New York, 1979.