Embed Size (px)
Citation preview

Version 2.23/12/20122011-2012 LVMCOG HMP_v2.2
MLC & Associates, Inc.
Las Virgenes-Malibu Council ofGovernments
Multi-Jurisdictional Hazard MitigationPlan
Las Virgenes-Malibu Council of Governments

Las Virgenes-Malibu Council of GovernmentsMulti-Jurisdictional Hazard Mitigation Plan
Final
Version 2.2 Page iRevision Date: 3/12/2012
©2004-2012 MLC & Associates, Inc.All rights reserved
Table of Contents
SECTION 1. INTRODUCTION ....................................................................................................................... 1-1
ACKNOWLEDGEMENTS .......................................................................................................................................... 1-1EXECUTIVE SUMMARY .................................................................................................................................. 1-2
Multi-Jurisdictional Plan ................................................................................................................................. 1-3Los Angeles County Operational Area and Disaster Management Areas ....................................................... 1-4Hazard Mitigation Plan Organization ............................................................................................................. 1-6Mitigation Strategy Five-Year Action Plan...................................................................................................... 1-6Plan Participants ............................................................................................................................................. 1-6Plan Mission .................................................................................................................................................... 1-7Plan Goals ....................................................................................................................................................... 1-7Strategy Organization ...................................................................................................................................... 1-8Plan Implementation, Monitoring, and Evaluation.......................................................................................... 1-8Plan Adoption .................................................................................................................................................. 1-8Coordinating Body........................................................................................................................................... 1-8Implementation Through Existing Programs................................................................................................... 1-8Economic Analysis of Mitigation Projects ....................................................................................................... 1-9Formal Review Process.................................................................................................................................... 1-9Continued Public Involvement ......................................................................................................................... 1-9
PLAN DESCRIPTION ....................................................................................................................................... 1-10Multi-Jurisdictional Hazard Mitigation Plan ................................................................................................ 1-10Why Develop a Mitigation Plan? ................................................................................................................... 1-10Whom Does the Mitigation Plan Affect?........................................................................................................ 1-11How is the Plan Used?................................................................................................................................... 1-11Plan Update Process...................................................................................................................................... 1-11Internal Input ................................................................................................................................................. 1-12External Input ................................................................................................................................................ 1-12
REQUIREMENTS FOR MITIGATION PLANS ............................................................................................... 1-13Federal and State Requirements .................................................................................................................... 1-13Public/Community Process ............................................................................................................................ 1-13
HAZARD MITIGATION PLAN ORGANIZATION......................................................................................... 1-14
SECTION 2. COMMUNITY PROFILE .......................................................................................................... 2-1
INTRODUCTION ...................................................................................................................................................... 2-1POPULATION .......................................................................................................................................................... 2-1GEOGRAPHY AND THE ENVIRONMENT ................................................................................................................... 2-3CLIMATE................................................................................................................................................................ 2-4
Temperature ..................................................................................................................................................... 2-4Rainfall............................................................................................................................................................. 2-5El Niño and La Niña ........................................................................................................................................ 2-5
LAW ENFORCEMENT AND FIRE RESOURCES .......................................................................................................... 2-6Los Angeles County Sheriff’s Department ....................................................................................................... 2-6Malibu Search & Rescue Team........................................................................................................................ 2-7Los Angeles County Fire Department.............................................................................................................. 2-7
MULTI-REGIONAL COLLABORATION ..................................................................................................................... 2-9Agoura Hills / Calabasas Community Center.................................................................................................. 2-9Community Emergency Response Training ..................................................................................................... 2-9Specific Needs Awareness Planning (SNAP) ................................................................................................... 2-9OARRS ........................................................................................................................................................... 2-10Connect-CTY.................................................................................................................................................. 2-10
DETAILS BY CITY ................................................................................................................................................ 2-10AGOURA HILLS.................................................................................................................................................... 2-11
Brief History................................................................................................................................................... 2-11Climate /Topography ..................................................................................................................................... 2-11Economic Activity .......................................................................................................................................... 2-13Agoura Hills Principal Property Tax Payers................................................................................................. 2-13

Las Virgenes-Malibu Council of GovernmentsMulti-Jurisdictional Hazard Mitigation Plan
Final
Version 2.2 Page iiRevision Date: 3/12/2012
©2004-2012 MLC & Associates, Inc.All rights reserved
Population and Demographics....................................................................................................................... 2-15Land Use ........................................................................................................................................................ 2-18Housing Characteristics................................................................................................................................. 2-18Emergency Preparedness............................................................................................................................... 2-21
CALABASAS......................................................................................................................................................... 2-23Brief History................................................................................................................................................... 2-23Climate/Topography ...................................................................................................................................... 2-23Economic Activity .......................................................................................................................................... 2-25Population and Demographics....................................................................................................................... 2-27Land Use ........................................................................................................................................................ 2-30Housing Characteristics................................................................................................................................. 2-30Emergency Preparedness............................................................................................................................... 2-33
HIDDEN HILLS ..................................................................................................................................................... 2-35Brief History................................................................................................................................................... 2-35Climate/Topography ...................................................................................................................................... 2-35Economic Activity .......................................................................................................................................... 2-36Population and Demographics....................................................................................................................... 2-37Land Use ........................................................................................................................................................ 2-40Emergency Preparedness............................................................................................................................... 2-43
MALIBU ............................................................................................................................................................... 2-45Brief History................................................................................................................................................... 2-45Climate/Topography ...................................................................................................................................... 2-45Economic Activity .......................................................................................................................................... 2-47Population Demographics ............................................................................................................................. 2-48Land Use ........................................................................................................................................................ 2-51Emergency Preparedness............................................................................................................................... 2-54Public Involvement Groups............................................................................................................................ 2-55
WESTLAKE VILLAGE ........................................................................................................................................... 2-56Brief History................................................................................................................................................... 2-56Climate/Topography ...................................................................................................................................... 2-56Economic Activity .......................................................................................................................................... 2-58Population and Demographics....................................................................................................................... 2-60Housing Characteristics................................................................................................................................. 2-63Emergency Preparedness............................................................................................................................... 2-66
SECTION 3. RISK ASSESSMENT .................................................................................................................. 3-1
DISASTER HISTORY ............................................................................................................................................... 3-1FEDERAL REQUIREMENTS FOR RISK ASSESSMENTS............................................................................................... 3-3HAZARD IDENTIFICATION AND RISK ANALYSIS..................................................................................................... 3-4
Hazard Identification Process.......................................................................................................................... 3-5Identified Hazards............................................................................................................................................ 3-7Other Natural Disasters................................................................................................................................... 3-7Human Generated and Technology Disasters................................................................................................ 3-11
VULNERABILITY AND LOSS ESTIMATES............................................................................................................... 3-17Critical Facilities and Infrastructure Overview............................................................................................. 3-17Earthquake and Flood Loss Estimates........................................................................................................... 3-23Wildfire Loss Estimates.................................................................................................................................. 3-53Future Development Trends........................................................................................................................... 3-54
SECTION 4. HAZARD MITIGATION GOALS AND STRATEGIES......................................................... 4-1
MISSION ................................................................................................................................................................ 4-1HAZARD MITIGATION PLAN GOALS ...................................................................................................................... 4-1
To Protect Life, Property, Environment........................................................................................................... 4-1Public Awareness............................................................................................................................................. 4-1Partnerships and Implementation .................................................................................................................... 4-2Emergency Management.................................................................................................................................. 4-2
HAZARD MITIGATION STRATEGIES........................................................................................................................ 4-2Hazard Mitigation Strategy Status Summary................................................................................................... 4-3

Las Virgenes-Malibu Council of GovernmentsMulti-Jurisdictional Hazard Mitigation Plan
Final
Version 2.2 Page iiiRevision Date: 3/12/2012
©2004-2012 MLC & Associates, Inc.All rights reserved
Strategy Organization .................................................................................................................................... 4-15HAZARD MITIGATION STRATEGY PROJECTS........................................................................................................ 4-16
Regional Mitigation Projects ......................................................................................................................... 4-16Agoura Hills Mitigation Projects................................................................................................................... 4-37Calabasas Mitigation Projects....................................................................................................................... 4-39Hidden Hills Mitigation Projects ................................................................................................................... 4-43Malibu Mitigation Projects ............................................................................................................................ 4-49Westlake Village Mitigation Projects............................................................................................................. 4-69
SECTION 5. PLAN MAINTENANCE AND MONITORING ....................................................................... 5-1
IMPLEMENTATION AND PLAN ADOPTION............................................................................................................... 5-1Continued Public Involvement ......................................................................................................................... 5-1Coordinating Body........................................................................................................................................... 5-1Adoption and Implementation .......................................................................................................................... 5-2
IMPLEMENTATION THROUGH EXISTING PROGRAMS .............................................................................................. 5-2ECONOMIC ANALYSIS OF MITIGATION PROJECTS .................................................................................................. 5-2
Benefit/Cost Analysis ....................................................................................................................................... 5-2Review Types.................................................................................................................................................... 5-3Benefit-Cost Analysis Exemptions.................................................................................................................... 5-3Lower-Bound Analysis ..................................................................................................................................... 5-4Upper-Bound Analysis ..................................................................................................................................... 5-5Best Estimate Analysis ..................................................................................................................................... 5-5
PLAN MONITORING, EVALUATION, UPDATES, AND FORMAL REVIEW PROCESS .................................................... 5-5
SECTION 6. EARTHQUAKE........................................................................................................................... 6-1
THE NATURE OF THE EARTHQUAKE THREAT......................................................................................................... 6-1HISTORICAL RECORD OF EARTHQUAKES IN SOUTHERN CALIFORNIA .................................................................... 6-2
History of Significant Earthquakes in Southern California ............................................................................. 6-3CAUSES AND CHARACTERISTICS OF EARTHQUAKES .............................................................................................. 6-4
Earthquake Faults In or Near the Las Virgenes-Malibu Region ..................................................................... 6-4Las Virgenes-Malibu Region Earthquake Probability ..................................................................................... 6-5ShakeMap Scenarios ........................................................................................................................................ 6-6
EARTHQUAKE HAZARD IDENTIFICATION ............................................................................................................... 6-9Casualties......................................................................................................................................................... 6-9Structures ......................................................................................................................................................... 6-9Transportation Infrastructure .......................................................................................................................... 6-9Lifelines.......................................................................................................................................................... 6-10Fire................................................................................................................................................................. 6-10Economy......................................................................................................................................................... 6-11Estimated Impact of an Event ........................................................................................................................ 6-11
EARTHQUAKE VULNERABILITIES......................................................................................................................... 6-12Liquefaction ................................................................................................................................................... 6-12Landslide........................................................................................................................................................ 6-13
CALIFORNIA EARTHQUAKE MITIGATION LEGISLATION ....................................................................................... 6-13EARTHQUAKE MITIGATION STRATEGIES ............................................................................................................. 6-15
LVMCOG Mitigation Activities...................................................................................................................... 6-15
SECTION 7. WILDFIRE................................................................................................................................... 7-1
THE NATURE OF THE WILDFIRE THREAT ............................................................................................................... 7-1HISTORICAL RECORD OF SIGNIFICANT FIRES......................................................................................................... 7-1
History of Fire Events in the Las Virgenes-Malibu Region ............................................................................. 7-2CAUSES AND CHARACTERISTICS OF WILDFIRES .................................................................................................... 7-3WILDFIRE HAZARD IDENTIFICATION ..................................................................................................................... 7-3
Urban/Wildland Interface Fires....................................................................................................................... 7-3Very High Fire Hazard Severity Zones ............................................................................................................ 7-4Estimated Impact of an Event .......................................................................................................................... 7-6
WILDFIRE VULNERABILITIES ................................................................................................................................. 7-6Base Hazard Factors ....................................................................................................................................... 7-6
Las Virgenes-Malibu Council of GovernmentsMulti-Jurisdictional Hazard Mitigation Plan
Final
Version 2.2 Page ivRevision Date: 3/12/2012
©2004-2012 MLC & Associates, Inc.All rights reserved
The Threat of Urban Conflagration ................................................................................................................. 7-8WILDFIRE MITIGATION STRATEGIES ..................................................................................................................... 7-9
Federal Programs ............................................................................................................................................ 7-9Los Angeles County Fire Department............................................................................................................ 7-10Fire Codes...................................................................................................................................................... 7-12Building Codes............................................................................................................................................... 7-12Public Education and Involvement ................................................................................................................ 7-13LVCOG Mitigation Activities ......................................................................................................................... 7-14
SECTION 8. WINDSTORM ............................................................................................................................. 8-1
THE NATURE OF THE WINDSTORM THREAT........................................................................................................... 8-1CAUSES AND CHARACTERISTICS OF WINDSTORMS IN THE LAS VIRGENES-MALIBU REGION ................................ 8-1WINDSTORM HAZARD IDENTIFICATION ................................................................................................................. 8-1
Estimated Impact of an Event .......................................................................................................................... 8-2WINDSTORM VULNERABILITIES ............................................................................................................................ 8-3
Life and Property ............................................................................................................................................. 8-3Utilities and Infrastructure .............................................................................................................................. 8-3Transportation ................................................................................................................................................. 8-3Increased Fire Threat ...................................................................................................................................... 8-3
WINDSTORM MITIGATION STRATEGIES ................................................................................................................. 8-4Interagency Efforts........................................................................................................................................... 8-4LVMCOG Mitigation Activities........................................................................................................................ 8-4
SECTION 9. LANDSLIDE ................................................................................................................................ 9-1
THE NATURE OF THE LANDSLIDE THREAT............................................................................................................. 9-1Debris Flow ..................................................................................................................................................... 9-1
HISTORICAL RECORD OF LANDSLIDE EVENTS ....................................................................................................... 9-21994 Northridge Earthquake Landslide Related Impact.................................................................................. 9-2History of Landslides in the Las Virgenes-Malibu Region .............................................................................. 9-2
CAUSES AND CHARACTERISTICS OF LANDSLIDES .................................................................................................. 9-3Landslide Events and Impacts.......................................................................................................................... 9-3
LANDSLIDE HAZARD IDENTIFICATION ................................................................................................................... 9-4Natural Processes ............................................................................................................................................ 9-4Land Development, Grading, and Excavation ................................................................................................. 9-4Landslide Risk Factors..................................................................................................................................... 9-5Potential Landslide Areas ................................................................................................................................ 9-6Estimated Impact of an Event .......................................................................................................................... 9-7
LANDSLIDE VULNERABILITIES .............................................................................................................................. 9-8Roads................................................................................................................................................................ 9-8Lifelines and Critical Facilities........................................................................................................................ 9-8
LANDSLIDE MITIGATION STRATEGIES ................................................................................................................... 9-8LVCOG Mitigation Activities ........................................................................................................................... 9-8
SECTION 10. FLOOD ................................................................................................................................... 10-1
THE NATURE OF THE FLOOD THREAT .................................................................................................................. 10-1HISTORICAL RECORD OF FLOODING .................................................................................................................... 10-1
History of Flooding in Southern California ................................................................................................... 10-1Significant Floods in the Las Virgenes-Malibu Region ................................................................................. 10-1
CAUSES AND CHARACTERISTICS OF FLOODS ....................................................................................................... 10-2Annual Rainfall .............................................................................................................................................. 10-2Dam and Reservoir Failure ........................................................................................................................... 10-3
FLOOD HAZARD IDENTIFICATION ........................................................................................................................ 10-4Tropical Storms and El Nino Conditions ....................................................................................................... 10-4Geography and Geology ................................................................................................................................ 10-4Urban Development ....................................................................................................................................... 10-4Flood Maps and Flood Insurance Studies ..................................................................................................... 10-5Flood Insurance Rate Maps (FIRM).............................................................................................................. 10-5Estimated Impact of an Event ........................................................................................................................ 10-5

Las Virgenes-Malibu Council of GovernmentsMulti-Jurisdictional Hazard Mitigation Plan
Final
Version 2.2 Page vRevision Date: 3/12/2012
©2004-2012 MLC & Associates, Inc.All rights reserved
FLOOD VULNERABILITIES .................................................................................................................................... 10-6Property Loss ................................................................................................................................................. 10-6Critical Infrastructure.................................................................................................................................... 10-6Business and Industry .................................................................................................................................... 10-6
FLOOD MITIGATION STRATEGIES ........................................................................................................................ 10-6LVCOG Mitigation Activities ......................................................................................................................... 10-6
SECTION 11. TERRORISM......................................................................................................................... 11-1
THE NATURE OF THE TERRORISM THREAT .......................................................................................................... 11-1HISTORY OF TERRORIST EVENTS IN THE LAS VIRGENES-MALIBU REGION.......................................................... 11-1
Specific Threats.............................................................................................................................................. 11-1Motivation ...................................................................................................................................................... 11-1
CAUSES AND CHARACTERISTICS OF TERRORISM ................................................................................................. 11-2Defining Terrorism ........................................................................................................................................ 11-2
TERRORISM HAZARD IDENTIFICATION ................................................................................................................ 11-2Domestic Terrorism in the United States ....................................................................................................... 11-5Weapons of Mass Destruction (WMD)........................................................................................................... 11-6Estimated Impact of an Event ........................................................................................................................ 11-7
TERRORISM VULNERABILITIES ............................................................................................................................ 11-7General Targets ............................................................................................................................................. 11-7Impact on the Community .............................................................................................................................. 11-7
LAW ENFORCEMENT ROLE IN COMBATING TERRORISM ...................................................................................... 11-9REGIONAL RESPONSE, MITIGATION, AND PREVENTION ACTIVITIES .................................................................... 11-9
Emergency Response Actions......................................................................................................................... 11-9Mitigation and Prevention ........................................................................................................................... 11-10Terrorism Early Warning Group ................................................................................................................. 11-10
TERRORISM MITIGATION STRATEGIES............................................................................................................... 11-11LVCOG Mitigation Activities ....................................................................................................................... 11-11
SECTION 12. ANNEX A: RESOURCES..................................................................................................... 12-1
SECTION 13. ANNEX B: LOCAL HAZARD MITIGATION PLAN REVIEW CROSSWALK .......... 13-1
SECTION 14. ANNEX C: DISASTER PREPAREDNESS RISK SURVEY............................................. 14-1
DISASTER PREPAREDNESS AND RISK SURVEY RESULTS ...................................................................................... 14-1
SECTION 15. ANNEX D: STEERING COMMITTEE / PLANNING GROUP HMP RISKASSESSMENT SURVEY ..................................................................................................................................... 15-1
RISK ASSESSMENT SURVEY RESULTS.................................................................................................................. 15-3Earthquake (Greater than Magnitude 6.0)..................................................................................................... 15-3Wildfire .......................................................................................................................................................... 15-5Flood.............................................................................................................................................................. 15-7Landslide........................................................................................................................................................ 15-9Severe Windstorm ........................................................................................................................................ 15-11Terrorism ..................................................................................................................................................... 15-13
SECTION 16. ANNEX E: PLANNING AND PUBLIC INVOLVEMENT............................................... 16-1
PLANNING............................................................................................................................................................ 16-1PUBLIC PARTICIPATION AND INVOLVEMENT ....................................................................................................... 16-4
Disaster Preparedness Risk Survey................................................................................................................ 16-4Public Announcements and Information ........................................................................................................ 16-5City Council Meetings.................................................................................................................................... 16-5
SECTION 17. ANNEX F: FLOOD INSURANCE RATE MAPS .............................................................. 17-1
SECTION 18. ANNEX G: MALIBU FLOOD MITIGATION PLAN....................................................... 18-1
SECTION 19. ANNEX H: PLAN APPROVAL DOCUMENTATION ..................................................... 19-1

Las Virgenes-Malibu Council of GovernmentsMulti-Jurisdictional Hazard Mitigation Plan
Final
Version 2.2 Page viRevision Date: 3/12/2012
©2004-2012 MLC & Associates, Inc.All rights reserved
Figures
Figure 1: HMP Update Process Workflow .............................................................................................................. 1-11
Figure 2: LVMCOG Population Distribution by City ............................................................................................... 2-2
Figure 3: Average Temperature by Month ................................................................................................................ 2-4
Figure 4: Santa Ana Winds (Feb 2002) ..................................................................................................................... 2-4
Figure 5: Average Rainfall by Month........................................................................................................................ 2-5
Figure 6: LASD Malibu/Lost Hills Station................................................................................................................ 2-6
Figure 7: Fire Station #89 .......................................................................................................................................... 2-8
Figure 8: Agoura Hills / Calabasas Community Center ............................................................................................ 2-9
Figure 9: SNAP Program........................................................................................................................................... 2-9
Figure 10: Agoura Hills Taxable Sales Percentage by Category............................................................................. 2-14
Figure 11: Agoura Hills Female to Male Distribution............................................................................................. 2-15
Figure 12: Agoura Hills Age Distribution ............................................................................................................... 2-15
Figure 13: Agoura Hills Race Distribution.............................................................................................................. 2-16
Figure 14: Agoura Hills Languages Spoken at Home ............................................................................................. 2-16
Figure 15: Agoura Hills Income Distribution.......................................................................................................... 2-17
Figure 16: Agoura Hills Number of Structures Built by Year ................................................................................. 2-19
Figure 17: Agoura Hills Distribution of Owner Occupied Unit Values .................................................................. 2-20
Figure 18: Calabasas Taxable Sales Percentage by Category.................................................................................. 2-26
Figure 19: Calabasas Female to Male Distribution.................................................................................................. 2-27
Figure 20: Calabasas Age Distribution.................................................................................................................... 2-27
Figure 21: Calabasas Race Distribution................................................................................................................... 2-28
Figure 22: Calabasas Languages Spoken at Home .................................................................................................. 2-28
Figure 23: Calabasas Income Distribution............................................................................................................... 2-29
Figure 24: Calabasas Number of Structures Built by Year...................................................................................... 2-31
Figure 25: Calabasas Distribution of Owner Occupied Unit Values ....................................................................... 2-32
Figure 26: Hidden Hills Female to Male Distribution ............................................................................................. 2-37
Figure 27: Hidden Hills Age Distribution ............................................................................................................... 2-37

Las Virgenes-Malibu Council of GovernmentsMulti-Jurisdictional Hazard Mitigation Plan
Final
Version 2.2 Page viiRevision Date: 3/12/2012
©2004-2012 MLC & Associates, Inc.All rights reserved
Figure 28: Hidden Hills Race Distribution .............................................................................................................. 2-38
Figure 29: Hidden Hills Languages Spoken at Home.............................................................................................. 2-38
Figure 30: Hidden Hills Income Distribution .......................................................................................................... 2-39
Figure 31: Hidden Hills Number of Structures Built by Year ................................................................................. 2-41
Figure 32: Hidden Hills Distribution of Owner Occupied Unit Values................................................................... 2-42
Figure 33: Malibu Female to Male Distribution ...................................................................................................... 2-48
Figure 34: Malibu Age Distribution ........................................................................................................................ 2-48
Figure 35: Malibu Race Distribution ....................................................................................................................... 2-49
Figure 36: Malibu Languages Spoken at Home ...................................................................................................... 2-49
Figure 37: Malibu Income Distribution ................................................................................................................... 2-50
Figure 38: Malibu Number of Structures Built by Year .......................................................................................... 2-52
Figure 39: Malibu Distribution of Owner Occupied Unit Values............................................................................ 2-53
Figure 40: Westlake Village Taxable Sales Percentage by Category ...................................................................... 2-59
Figure 41: Westlake Village Female to Male Distribution ...................................................................................... 2-60
Figure 42: Westlake Village Age Distribution ........................................................................................................ 2-60
Figure 43: Westlake Village Race Distribution ....................................................................................................... 2-61
Figure 44: Westlake Village Languages Spoken at Home ...................................................................................... 2-61
Figure 45: Westlake Village Income Distribution ................................................................................................... 2-62
Figure 46: Westlake Village Number of Structures Built by Year .......................................................................... 2-64
Figure 47: Westlake Village Distribution of Owner Occupied Unit Values............................................................ 2-65
Figure 48: Malibu Coastline ...................................................................................................................................... 3-8
Figure 49: Malibu Coast ............................................................................................................................................ 3-9
Figure 50: U.S. Seasonal Drought Outlook ............................................................................................................. 3-10
Figure 51: NERC Interconnections.......................................................................................................................... 3-11
Figure 52: Pipelines - Agoura Hills ......................................................................................................................... 3-12
Figure 53: Pipelines - West Calabasas and Hidden Hills......................................................................................... 3-12
Figure 54: Pipelines - East Calabasas ...................................................................................................................... 3-13
Figure 55: San Bruno Pipeline Explosion................................................................................................................ 3-13
Figure 56: USGA PGA Instrumental Intensity Scale .............................................................................................. 3-24
Las Virgenes-Malibu Council of GovernmentsMulti-Jurisdictional Hazard Mitigation Plan
Final
Version 2.2 Page viiiRevision Date: 3/12/2012
©2004-2012 MLC & Associates, Inc.All rights reserved
Figure 57: Simi-Santa Rosa M7.0 EQ Peak Ground Acceleration Estimate ........................................................... 3-25
Figure 58: Malibu Coast M7.0 EQ Peak Ground Acceleration Estimate ................................................................ 3-37
Figure 59: Wildfire $ Loss Estimate........................................................................................................................ 3-53
Figure 60: Catch Basin Grates and Filters ............................................................................................................... 4-37
Figure 61: City of Malibu Emergency Preparedness Library .................................................................................. 4-51
Figure 62: CCAMP Letter (Page 1)......................................................................................................................... 4-52
Figure 63: CCAMP Letter (Page 2)......................................................................................................................... 4-53
Figure 64: Las Flores Creek .................................................................................................................................... 4-55
Figure 65: Michael Landon Center at Bluffs Park................................................................................................... 4-57
Figure 66: Zuma Beach Parking Lot........................................................................................................................ 4-59
Figure 67: City of Malibu Emergency Information TV Bulletins ........................................................................... 4-68
Figure 68: Malibu Flood Map (Colony Road Area) .............................................................................................. 10-11
Figure 69: NWS Storm Ready Award Announcement.......................................................................................... 10-12
Figure 70: Westlake Village Flood Map................................................................................................................ 10-14
Figure 71: Acorn Newspaper Survey Announcement ............................................................................................. 16-4
Figure 72: Agoura Hills and Malibu Patch Survey Announcement ........................................................................ 16-4
Figure 73: Westlake Village DRT and Exercise Announcement............................................................................. 16-5
Las Virgenes-Malibu Council of GovernmentsMulti-Jurisdictional Hazard Mitigation Plan
Final
Version 2.2 Page ixRevision Date: 3/12/2012
©2004-2012 MLC & Associates, Inc.All rights reserved
Maps
Map 1: Area Map....................................................................................................................................................... 1-2
Map 2: LVMCOG Cities ........................................................................................................................................... 1-3
Map 3: Los Angeles County Disaster Management Areas and LVMCOG Cities (circled) ...................................... 1-5
Map 4: Population Density per Square Mile.............................................................................................................. 2-2
Map 5: Las Virgenes-Malibu Council of Governments Region Map........................................................................ 2-3
Map 6: LASD Malibu/Lost Hills Station Location.................................................................................................... 2-6
Map 7: Agoura Hills Location Map......................................................................................................................... 2-12
Map 8: Calabasas Location Map ............................................................................................................................. 2-24
Map 9: Hidden Hills Location Map......................................................................................................................... 2-36
Map 10: Malibu Location Map................................................................................................................................ 2-46
Map 11: Westlake Village Location Map................................................................................................................ 2-57
Map 12: LVMCOG Study Area and Population Density .......................................................................................... 3-4
Map 13: Hazardous Materials Sites ......................................................................................................................... 3-14
Map 14: Airports within 25 miles............................................................................................................................ 3-15
Map 15: Las Virgenes-Malibu COG Fire Hazard Areas and Fire Station Locations .............................................. 3-18
Map 16: Las Virgenes Municipal Water District Service Area ............................................................................... 3-19
Map 17: Simi-Santa Rosa M7.0 EQ Total $ Loss Estimate..................................................................................... 3-31
Map 18: Simi-Santa Rosa Fault M7.0 EQ Residential $ Loss Estimate .................................................................. 3-34
Map 19: Simi-Santa Rosa Fault M7.0 EQ Commercial $ Loss Estimate ................................................................ 3-35
Map 20: Simi-Santa Rosa Fault M7.0 EQ Industrial $ Loss Estimate..................................................................... 3-36
Map 21: Malibu Coast M7.0 EQ Total $ Loss Estimate.......................................................................................... 3-42
Map 22: Malibu Coast Fault M7.0 EQ Residential $ Loss Estimate ....................................................................... 3-45
Map 23: Malibu Coast Fault M7.0 EQ Commercial $ Loss Estimate ..................................................................... 3-46
Map 24: Malibu Coast Fault M7.0 EQ Industrial $ Loss Estimate.......................................................................... 3-47
Map 25: 50-year Flood Residential Building Dollar Loss Estimate ........................................................................ 3-49
Map 26: 50-year Flood Commercial Building Dollar Loss Estimate ...................................................................... 3-49
Map 27: 50-year Flood Industrial Building Dollar Loss Estimate........................................................................... 3-50
Map 28: 100-year Flood Residential Building Dollar Loss Estimate ...................................................................... 3-51

Las Virgenes-Malibu Council of GovernmentsMulti-Jurisdictional Hazard Mitigation Plan
Final
Version 2.2 Page xRevision Date: 3/12/2012
©2004-2012 MLC & Associates, Inc.All rights reserved
Map 29: 100-year Flood Commercial Building Dollar Loss Estimate .................................................................... 3-52
Map 30: 100-year Flood Industrial Building Dollar Loss Estimate......................................................................... 3-52
Map 31: San Andreas Fault "Big Bend" .................................................................................................................... 6-1
Map 32: Parallel Faults to the San Andreas Fault...................................................................................................... 6-1
Map 33: Los Angeles County Earthquakes for the Past 7 Days ................................................................................ 6-2
Map 34: Earthquake Faults in the Greater Los Angeles / Ventura County Area....................................................... 6-4
Map 35: Major Faults Around the Las Virgenes-Malibu Region .............................................................................. 6-4
Map 36: Southern California PHSA Model (USGS) ................................................................................................. 6-5
Map 37: Northridge Earthquake ShakeMap .............................................................................................................. 6-6
Map 38: Santa Monica Fault Scenario ShakeMap..................................................................................................... 6-7
Map 39: Newport-Inglewood Fault Scenario ShakeMap .......................................................................................... 6-8
Map 40: San Andreas Fault Scenario ShakeMap ...................................................................................................... 6-8
Map 41: Liquefaction Zones.................................................................................................................................... 6-12
Map 42: Potential Earthquake Induced Landslide Areas......................................................................................... 6-13
Map 43: Fire History In The Las Virgenes-Malibu Region....................................................................................... 7-2
Map 44: Major Fires Near or In the Las Virgenes-Malibu Region Since 2003......................................................... 7-2
Map 45: Las Virgenes – Malibu Region Fire Map .................................................................................................... 7-5
Map 46: Landslide Localities in the S. Calif. Coastal Area....................................................................................... 9-2
Map 47: Agoura Hills Landslide Areas ..................................................................................................................... 9-6
Map 48: Potential Mudflow Impact, City of Malibu ................................................................................................. 9-7
Map 49: North Santa Monica Bay Watershed ......................................................................................................... 10-3
Map 50: City of Agoura Hills Flood Areas ............................................................................................................. 10-7
Map 51: Drainages and Floodways in Calabasas .................................................................................................... 10-9
Map 52: Agoura Hills and Westlake Village FIRM Panel 1241 ............................................................................. 17-3
Map 53: Agoura Hills FIRM Panel 1242................................................................................................................. 17-4
Map 54: Agoura Hills FIRM Panel 1244................................................................................................................. 17-5
Map 55: Agoura Hills and Calabasas FIRM Panel 1263 ......................................................................................... 17-6
Map 56: Calabasas FIRM Panel 1262 ..................................................................................................................... 17-7
Map 57: Calabasas FIRM Panel 1264 ..................................................................................................................... 17-8
Las Virgenes-Malibu Council of GovernmentsMulti-Jurisdictional Hazard Mitigation Plan
Final
Version 2.2 Page xiRevision Date: 3/12/2012
©2004-2012 MLC & Associates, Inc.All rights reserved
Map 58: Calabasas FIRM Panel 1269 ..................................................................................................................... 17-9
Map 59: Calabasas FIRM Panel 1527 ................................................................................................................... 17-10
Map 60: Calabasas FIRM Panel 1531 ................................................................................................................... 17-11
Map 61: Calabasas FIRM Panel 1532 ................................................................................................................... 17-12
Map 62: Calabasas FIRM Panel 1567 ................................................................................................................... 17-13
Map 63: Calabasas FIRM Panel 1267 ................................................................................................................... 17-14
Map 64: Calabasas FIRM Panel 1268 ................................................................................................................... 17-15
Map 65: Hidden Hills FIRM Panel 1266............................................................................................................... 17-16
Map 66: Hidden Hills FIRM Panel 1267............................................................................................................... 17-17
Map 67: Hidden Hills FIRM Panel 1268............................................................................................................... 17-17
Map 68: Malibu FIRM Panel 1491 (1) .................................................................................................................. 17-18
Map 69: Malibu FIRM Panel 1491 (2) .................................................................................................................. 17-19
Map 70: Malibu FIRM Panel 1491 (3) .................................................................................................................. 17-20
Map 71: Malibu FIRM Panel 1492 (1) .................................................................................................................. 17-21
Map 72: Malibu FIRM Panel 1492 (2) .................................................................................................................. 17-22
Map 73: Malibu FIRM Panel 1511 (1) .................................................................................................................. 17-23
Map 74: Malibu FIRM Panel 1511 (2) .................................................................................................................. 17-24
Map 75: Malibu FIRM Panel 1512........................................................................................................................ 17-25
Map 76: Malibu FIRM Panel 1514 (1) .................................................................................................................. 17-26
Map 77: Malibu FIRM Panel 1514 (2) .................................................................................................................. 17-27
Map 78: Malibu FIRM Panel 1514 (3) .................................................................................................................. 17-28
Map 79: Malibu FIRM Panel 1518 (1) .................................................................................................................. 17-29
Map 80: Malibu FIRM Panel 1518 (2) .................................................................................................................. 17-30
Map 81: Malibu FIRM Panel 1519 (1) .................................................................................................................. 17-31
Map 82: Malibu FIRM Panel 1519 (2) .................................................................................................................. 17-32
Map 83: Malibu FIRM Panel 1536 (1) .................................................................................................................. 17-33
Map 84: Malibu FIRM Panel 1536 (2) .................................................................................................................. 17-34
Map 85: Malibu FIRM Panel 1537........................................................................................................................ 17-35
Map 86: Malibu FIRM Panel 1541 (1) .................................................................................................................. 17-36
Las Virgenes-Malibu Council of GovernmentsMulti-Jurisdictional Hazard Mitigation Plan
Final
Version 2.2 Page xiiRevision Date: 3/12/2012
©2004-2012 MLC & Associates, Inc.All rights reserved
Map 87: Malibu FIRM Panel 1541 (2) .................................................................................................................. 17-37
Map 88: Malibu FIRM Panel 1541 (3) .................................................................................................................. 17-38
Map 89: Malibu FIRM Panel 1542 (1) .................................................................................................................. 17-39
Map 90: Malibu FIRM Panel 1542 (2) .................................................................................................................. 17-40
Map 91: Malibu FIRM Panel 1542 (3) .................................................................................................................. 17-41
Map 92: Malibu FIRM Panel 1561 (1) .................................................................................................................. 17-42
Map 93: Malibu FIRM Panel 1561 (2) .................................................................................................................. 17-43
Map 94: Malibu FIRM Panel 1562 (1) .................................................................................................................. 17-44
Map 95: Malibu FIRM Panel 1562 (2) .................................................................................................................. 17-45
Map 96: Malibu FIRM Panel 1562 (3) .................................................................................................................. 17-46
Map 97: Malibu FIRM Panel 1562 (4) .................................................................................................................. 17-47
Map 98: Westlake Village FIRM Panel 1239 (1) .................................................................................................. 17-48
Map 99: Westlake Village FIRM Panel 1239 (2) .................................................................................................. 17-49
Map 100: Westlake Village FIRM Panel 1241...................................................................................................... 17-50
Map 101: Westlake Village FIRM Panel 1243...................................................................................................... 17-51

Las Virgenes-Malibu Council of GovernmentsMulti-Jurisdictional Hazard Mitigation Plan
Final
Version 2.2 Page xiiiRevision Date: 3/12/2012
©2004-2012 MLC & Associates, Inc.All rights reserved
Tables
Table 1: LVMCOG Population by City..................................................................................................................... 1-2
Table 2: Las Virgenes-Malibu 2010 Population Data ............................................................................................... 2-1
Table 3: Agoura Hills Principal Employers............................................................................................................. 2-13
Table 4: Agoura Hills Principal Property Tax Payers.............................................................................................. 2-13
Table 5: Agoura Hills Taxable Sales ....................................................................................................................... 2-14
Table 6: Agoura Hills Sex and Age Demographics................................................................................................. 2-15
Table 7: Agoura Hills Race Composition................................................................................................................ 2-16
Table 8: Agoura Hills Languages Spoken at Home................................................................................................. 2-16
Table 9: Agoura Hills Income and Benefits (2009 Inflation Adjusted Dollars) ...................................................... 2-17
Table 10: Agoura Hills Housing Occupancy ........................................................................................................... 2-18
Table 11: Agoura Hills Units in Structure Change from 2000 to 2010 ................................................................... 2-18
Table 12: Year Structures Built in Agoura Hills ..................................................................................................... 2-19
Table 13: Agoura Hills Home Value Distribution................................................................................................... 2-20
Table 14: Calabasas Principal Employers ............................................................................................................... 2-25
Table 15: Calabasas Principal Tax Payers ............................................................................................................... 2-25
Table 16: Calabasas Principal Taxable Sales........................................................................................................... 2-26
Table 17: Calabasas Sex and Age Demographics.................................................................................................... 2-27
Table 18: Calabasas Race Composition................................................................................................................... 2-28
Table 19: Calabasas Languages Spoken at Home ................................................................................................... 2-28
Table 20: Calabasas Income and Benefits (2009 Inflation Adjusted Dollars) ......................................................... 2-29
Table 21: Calabasas Housing Occupancy................................................................................................................ 2-30
Table 22: Calabasas Units in Structure Change from 2000 to 2010 ........................................................................ 2-30
Table 23: Year Structures Built in Calabasas .......................................................................................................... 2-31
Table 24: Calabasas Home Value Distribution........................................................................................................ 2-32
Table 25: Hidden Hills Sex and Age Demographics ............................................................................................... 2-37
Table 26: Hidden Hills Race Composition .............................................................................................................. 2-38
Table 27: Hidden Hills Languages Spoken at Home............................................................................................... 2-38
Table 28: Hidden Hills Income and Benefits (2009 Inflation Adjusted Dollars) .................................................... 2-39
Las Virgenes-Malibu Council of GovernmentsMulti-Jurisdictional Hazard Mitigation Plan
Final
Version 2.2 Page xivRevision Date: 3/12/2012
©2004-2012 MLC & Associates, Inc.All rights reserved
Table 29: Hidden Hills Housing Occupancy ........................................................................................................... 2-40
Table 30: Hidden Hills Units in Structure Change from 2000 to 2010 ................................................................... 2-40
Table 31: Year Structures Built in Hidden Hills...................................................................................................... 2-41
Table 32: Hidden Hills Home Value Distribution ................................................................................................... 2-42
Table 33: Malibu Principal Property Tax Payers..................................................................................................... 2-47
Table 34: Malibu Sex and Age Demographics ........................................................................................................ 2-48
Table 35: Malibu Race Composition ....................................................................................................................... 2-49
Table 36: Malibu Languages Spoken at Home........................................................................................................ 2-49
Table 37: Malibu Income and Benefits (2009 Inflation Adjusted Dollars) ............................................................. 2-50
Table 38: Malibu Housing Occupancy .................................................................................................................... 2-51
Table 39: Malibu Units in Structure Change from 2000 to 2010 ............................................................................ 2-51
Table 40: Year Structures Built in Malibu............................................................................................................... 2-52
Table 41: Malibu Home Value Distribution ............................................................................................................ 2-53
Table 42: Westlake Village Principal Employers .................................................................................................... 2-58
Table 43: Westlake Village Principal Property Tax Payers..................................................................................... 2-58
Table 44: Westlake Village Taxable Sales .............................................................................................................. 2-59
Table 45: Westlake Village Sex and Age Demographics ........................................................................................ 2-60
Table 46: Westlake Village Race Composition ....................................................................................................... 2-61
Table 47: Westlake Village Languages Spoken at Home........................................................................................ 2-61
Table 48: Westlake Village Income and Benefits (2009 Inflation Adjusted Dollars) ............................................. 2-62
Table 49: Westlake Village Housing Occupancy .................................................................................................... 2-63
Table 50: Westlake Village Units in Structure Change from 2000 to 2010 ............................................................ 2-63
Table 51: Year Structures Built in Westlake Village............................................................................................... 2-64
Table 52: Westlake Village Home Value Distribution ............................................................................................ 2-65
Table 53: Los Angeles County Federal Declared Disasters from 1995-2010............................................................ 3-2
Table 54: Hazard Rating Survey................................................................................................................................ 3-7
Table 55: Las Virgenes-Malibu COG Area Sheriff's Station .................................................................................. 3-17
Table 56: Las Virgenes-Malibu COG Area Fire Stations........................................................................................ 3-18
Table 57: Critical Facilities and Infrastructure Matrix ............................................................................................ 3-22

Las Virgenes-Malibu Council of GovernmentsMulti-Jurisdictional Hazard Mitigation Plan
Final
Version 2.2 Page xvRevision Date: 3/12/2012
©2004-2012 MLC & Associates, Inc.All rights reserved
Table 58: Hazus-MH Estimated $ Exposure ........................................................................................................... 3-23
Table 59: Hazus-MH Estimated Depreciated Exposure .......................................................................................... 3-23
Table 60: Hazus-MH Estimated Building Count..................................................................................................... 3-24
Table 61: Simi-Santa Rosa Fault M7.0 EQ Casualty Estimates ............................................................................. 3-26
Table 62: Simi-Santa Rosa Fault M7.0 EQ Transportation System Lifeline Inventory Replacement Values......... 3-27
Table 63: Simi-Santa Rosa Fault M7.0 EQ Water Utility Lifeline Inventory Replacement Values........................ 3-28
Table 64: Simi-Santa Rosa Fault M7.0 EQ Expected Building Damage by Occupancy......................................... 3-28
Table 65: Simi-Santa Rosa Fault M7.0 EQ Expected Building Damage by Building Type.................................... 3-29
Table 66: Simi-Santa Rosa Fault M7.0 EQ Expected Damage to Essential Facilities - Schools............................. 3-29
Table 67: Simi-Santa Rosa Fault M7.0 EQ Expected Damage to Transportation Systems..................................... 3-30
Table 68: Simi-Santa Rosa Fault M7.0 EQ Expected Damage to Waste Water Utility Systems ............................ 3-30
Table 69: Simi-Santa Rosa Fault M7.0 EQ Expected Utility System Pipeline Damage ......................................... 3-30
Table 70: Simi-Santa Rosa Fault M7.0 EQ Expected Potable Water and Electric Power System Performance..... 3-30
Table 71: Simi-Santa Rosa Fault M7.0 EQ Building-Related Economic Loss Estimates ....................................... 3-32
Table 72: Simi-Santa Rosa Fault M7.0 EQ Transportation System Economic Losses ........................................... 3-32
Table 73: Simi-Santa Rosa Fault M7.0 EQ Utility System Economic Losses ....................................................... 3-32
Table 74: Simi-Santa Rosa Fault M7.0 EQ Indirect Economic Impact .................................................................. 3-33
Table 75: Simi-Santa Rosa Fault M7.0 EQ Residential Loss $ Exposure ............................................................... 3-34
Table 76: Simi-Santa Rosa Fault M7.0 EQ Commercial $ Loss ............................................................................. 3-35
Table 77: Simi-Santa Rosa Fault M7.0 EQ Industrial Loss $ Exposure.................................................................. 3-36
Table 78: Malibu Coast Fault M7.0 EQ Casualty Estimates .................................................................................. 3-38
Table 79: Malibu Coast Fault M7.0 EQ Transportation System Lifeline Inventory Replacement Values.............. 3-39
Table 80: Malibu Coast Fault M7.0 EQ Water Utility Lifeline Inventory Replacement Values............................. 3-40
Table 81: Malibu Coast Fault M7.0 EQ Expected Building Damage by Occupancy.............................................. 3-40
Table 82: Malibu Coast Fault M7.0 EQ Expected Building Damage by Building Type......................................... 3-40
Table 83: Malibu Coast Fault M7.0 EQ Expected Damage to Essential Facilities - Schools.................................. 3-41
Table 84: Malibu Coast Fault M7.0 EQ Expected Damage to Transportation Systems.......................................... 3-41
Table 85: Malibu Coast Fault M7.0 EQ Expected Damage to Waste Water Utility Systems ................................. 3-41
Table 86: Malibu Coast Fault M7.0 EQ Expected Utility System Pipeline Damage .............................................. 3-41

Las Virgenes-Malibu Council of GovernmentsMulti-Jurisdictional Hazard Mitigation Plan
Final
Version 2.2 Page xviRevision Date: 3/12/2012
©2004-2012 MLC & Associates, Inc.All rights reserved
Table 87: Malibu Coast Fault M7.0 EQ Expected Potable Water and Electric Power System Performance .......... 3-41
Table 88: Malibu Coast Fault M7.0 EQ Building-Related Economic Loss Estimates ............................................ 3-43
Table 89: Malibu Coast Fault M7.0 EQ Transportation System Economic Losses................................................. 3-43
Table 90: Malibu Coast Fault M7.0 EQ Utility System Economic Losses............................................................. 3-44
Table 91: Malibu Coast Fault M7.0 EQ Indirect Economic Impact ....................................................................... 3-44
Table 92: Malibu Coast Fault M7.0 EQ Residential Loss $ Exposure .................................................................... 3-45
Table 93: Malibu Coast Fault M7.0 EQ Commercial $ Loss .................................................................................. 3-46
Table 94: Malibu Coast Fault M7.0 EQ Industrial Loss $ Exposure....................................................................... 3-47
Table 95: 50-year Flood General Building Stock Damage Count ........................................................................... 3-48
Table 96: 50-year Flood Direct Economic Loss for Full Replacement of Buildings and Contents......................... 3-48
Table 97: 50-year Flood Direct Economic Loss for Deprec. Replacement Value of Bdgs and Contents ............... 3-48
Table 98: 50-year Flood General Building Stock Damage Count ........................................................................... 3-50
Table 99: 100-year Flood Direct Economic Loss for Full Replacement of Buildings and Contents....................... 3-51
Table 100: 100-year Flood Direct Economic Loss for Deprec. Replacement Value of Bdgs and Contents............ 3-51
Table 101: 50-year Flood General Building Stock Damage Count ......................................................................... 3-53
Table 102: Agoura Hills Commercial Development Trends ................................................................................... 3-54
Table 103: Agoura Hills Residential Development Trends ..................................................................................... 3-54
Table 104: Calabasas Development Trends............................................................................................................. 3-55
Table 105: Malibu Development Trends - Pending................................................................................................. 3-56
Table 106: Malibu Development Trends - Active ................................................................................................... 3-56
Table 107: Westlake Village Development Trends - Active ................................................................................... 3-57
Table 108: Significant Southern California Earthquakes Since 1857........................................................................ 6-3
Table 109: Estimated Population and Economic Loss of an Earthquake ................................................................ 6-11
Table 110: Partial List of California Laws on Earthquake Safety ........................................................................... 6-14
Table 111: Partial List of Agoura Hills Building Codes.......................................................................................... 6-16
Table 112: CAL FIRE Number of Fires and Acres Burned for 2010 and 2011 ........................................................ 7-1
Table 113: Los Angeles County Significant Fire Examples from 1993 to 2009 ....................................................... 7-1
Table 114: Major Fires Near of In the Las Virgenes-Malibu Region........................................................................ 7-3
Table 115: Estimated Population and Economic Loss of a Wildfire ......................................................................... 7-6

Las Virgenes-Malibu Council of GovernmentsMulti-Jurisdictional Hazard Mitigation Plan
Final
Version 2.2 Page xviiRevision Date: 3/12/2012
©2004-2012 MLC & Associates, Inc.All rights reserved
Table 116: Political Entities that Coordinate with the LACoFD to Mitigate the Threat of Fire.............................. 7-10
Table 117: Beaufort Scale ......................................................................................................................................... 8-2
Table 118: Estimated Population and Economic Loss of a Windstorm..................................................................... 8-2
Table 119: Estimated Population and Economic Loss of Multiple Landslides ......................................................... 9-7
Table 120: Significant Flood Events in Southern California 1978 – 2010 .............................................................. 10-1
Table 121: Flood Loss Statistics for California (From January 1, 1978 to December 31, 2011) ............................ 10-1
Table 122: Estimated Population and Economic Loss of Floods ............................................................................ 10-5
Table 123: Terrorist Group Categories .................................................................................................................... 11-3
Table 124: Foreign Terrorist Organizations ............................................................................................................ 11-4
Table 125: State Sponsors of Terrorism .................................................................................................................. 11-5
Table 126: Domestic Terrorism Examples .............................................................................................................. 11-5
Table 127: Estimated Population and Economic Loss of Terrorist Events.............................................................. 11-7
Table 128: Terrorist Event Considerations .............................................................................................................. 11-8
Table 129: Risk Ratings .......................................................................................................................................... 15-2

Las Virgenes-Malibu Council of GovernmentsMulti-Jurisdictional Hazard Mitigation Plan
Final
Version 2.2 Page 1-1Revision Date: 3/12/2012
©2004-2012 MLC & Associates, Inc.All rights reserved
SECTION 1. INTRODUCTION
Acknowledgements
The Multi-Jurisdictional Hazard Mitigation Plan was an extensive effort that involved the effortsof multiple individuals representing all five cities within the Las Virgenes-Malibu Council ofGovernments. Participants in the process included:
Steering Committee
Greg Ramirez, City Manager - City of Agoura Hills
Tony Coroalles, City Manager - City of Calabasas
Cherie L. Paglia, City Manager - City of Hidden Hills
Jim Thorsen, City Manager - City of Malibu
Ray Taylor, City Manager - City of Westlake Village
Terry Dipple, Executive Director - Las Virgenes-Malibu Council of Governments
Planning Group
Louis Celaya, Deputy City Manager - City of Agoura Hills
Jim Jordan, Director of Public Safety - City of Calabasas
Debbie Larson, Public Safety Coordinator– City of Calabasas
Dirk Lovett, City Engineer - City of Hidden Hills
Brad Davis, Emergency Preparedness Coordinator - City of Malibu
Kerry Kallman, Administrative Analyst - City of Westlake Village
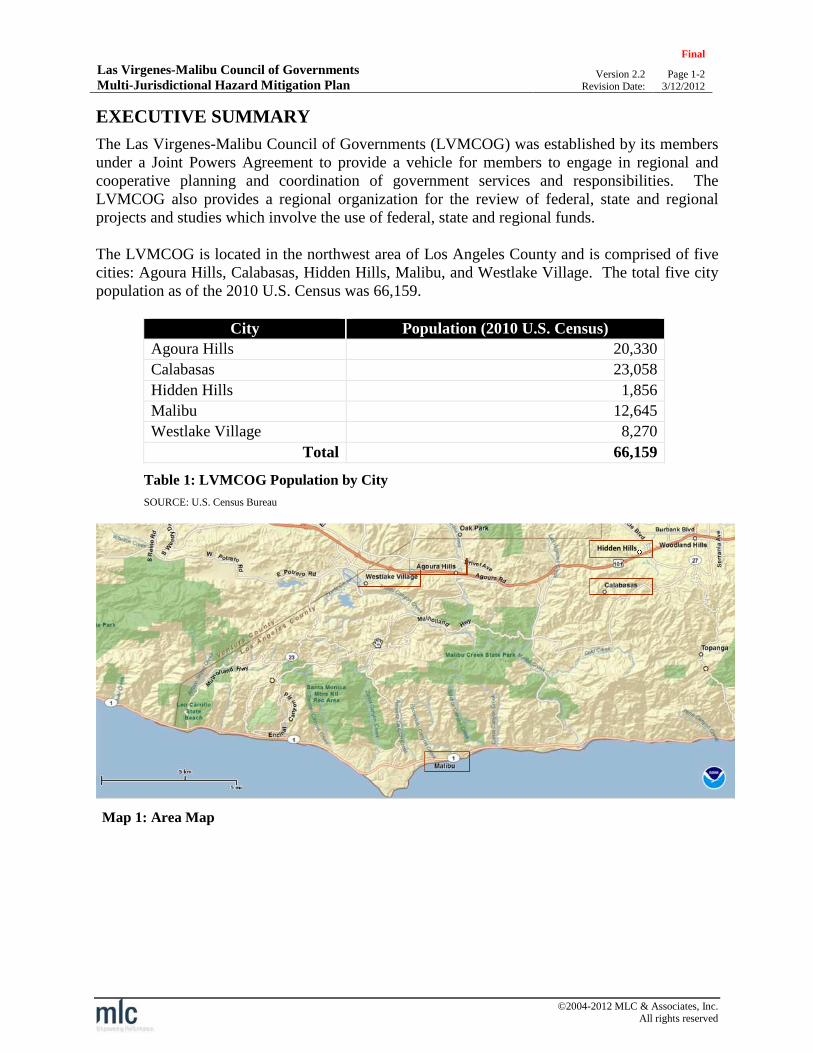
Las Virgenes-Malibu Council of GovernmentsMulti-Jurisdictional Hazard Mitigation Plan
Final
Version 2.2 Page 1-2Revision Date: 3/12/2012
©2004-2012 MLC & Associates, Inc.All rights reserved
EXECUTIVE SUMMARY
The Las Virgenes-Malibu Council of Governments (LVMCOG) was established by its membersunder a Joint Powers Agreement to provide a vehicle for members to engage in regional andcooperative planning and coordination of government services and responsibilities. TheLVMCOG also provides a regional organization for the review of federal, state and regionalprojects and studies which involve the use of federal, state and regional funds.
The LVMCOG is located in the northwest area of Los Angeles County and is comprised of fivecities: Agoura Hills, Calabasas, Hidden Hills, Malibu, and Westlake Village. The total five citypopulation as of the 2010 U.S. Census was 66,159.
City Population (2010 U.S. Census)
Agoura Hills 20,330
Calabasas 23,058
Hidden Hills 1,856
Malibu 12,645
Westlake Village 8,270
Total 66,159
Table 1: LVMCOG Population by City
SOURCE: U.S. Census Bureau
Map 1: Area Map
Hidden Hills
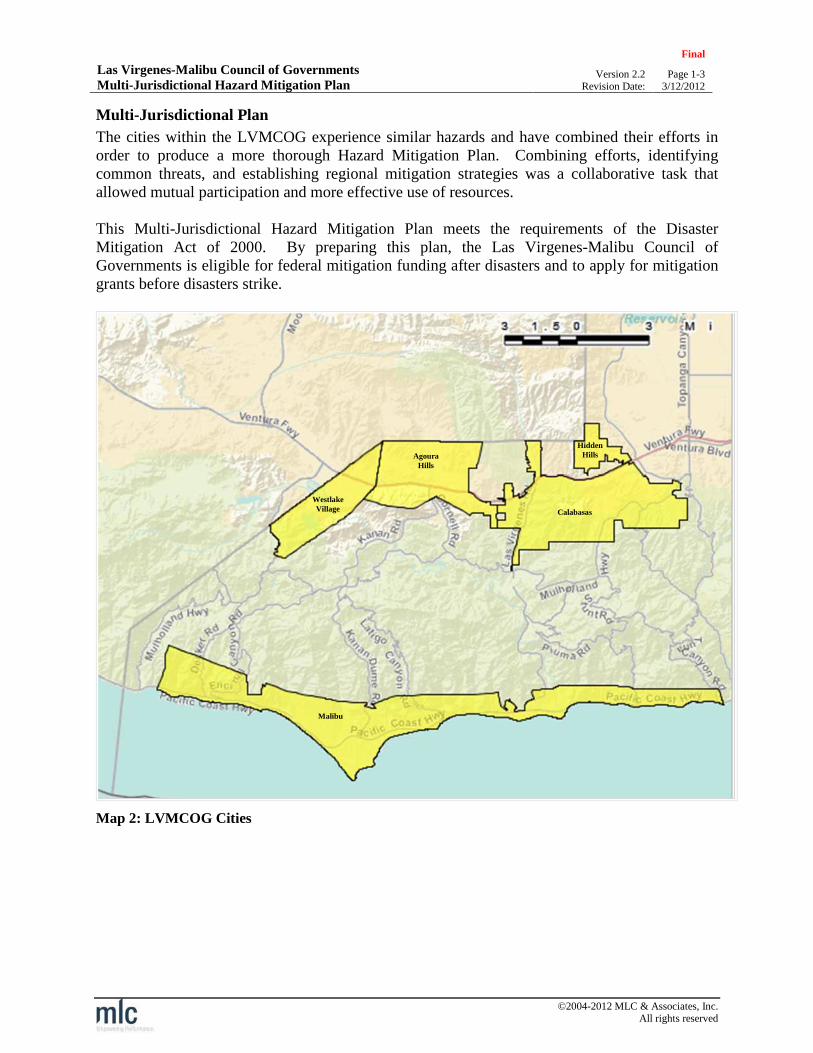
Las Virgenes-Malibu Council of GovernmentsMulti-Jurisdictional Hazard Mitigation Plan
Final
Version 2.2 Page 1-3Revision Date: 3/12/2012
©2004-2012 MLC & Associates, Inc.All rights reserved
Multi-Jurisdictional Plan
The cities within the LVMCOG experience similar hazards and have combined their efforts inorder to produce a more thorough Hazard Mitigation Plan. Combining efforts, identifyingcommon threats, and establishing regional mitigation strategies was a collaborative task thatallowed mutual participation and more effective use of resources.
This Multi-Jurisdictional Hazard Mitigation Plan meets the requirements of the DisasterMitigation Act of 2000. By preparing this plan, the Las Virgenes-Malibu Council ofGovernments is eligible for federal mitigation funding after disasters and to apply for mitigationgrants before disasters strike.
Map 2: LVMCOG Cities
Malibu
WestlakeVillage
AgouraHills
HiddenHills
Calabasas

Las Virgenes-Malibu Council of GovernmentsMulti-Jurisdictional Hazard Mitigation Plan
Final
Version 2.2 Page 1-4Revision Date: 3/12/2012
©2004-2012 MLC & Associates, Inc.All rights reserved
Los Angeles County Operational Area and Disaster Management Areas
The Los Angeles County Office of Emergency Management (OEM) was established by Chapter2.68 of the County Code with responsibility for organizing and directing the preparedness effortsof the Emergency Management Organization of Los Angeles County. OEM responsibilitiesinclude: Planning and Coordination, Operations, Training, Technical Operations, and PublicEducation.
The Los Angeles County Operational Area is divided into 8 groupings (A through H):
Area ABeverly HillsCulver CitySanta MonicaWest Hollywood
Area BAgoura Hills*Calabasas*Hidden Hills*LancasterMalibu*PalmdaleSanta ClaritaWestlake Village*
Area CAlhambraBurbankGlendaleLa Canada FlintridgeMonterey ParkPasadenaSan FernandoSan GabrielSan MarinoSouth Pasadena
Area DArcadiaAzusaBaldwin ParkBradburyClaremontCity Of IndustryCovinaDiamond BarDuarteEl MonteGlendoraIrwindaleLa PuenteLa VerneMonroviaPomonaRosemeadSan DimasSierra MadreSouth El MonteTemple CityWalnutWest Covina
Area EArtesiaBellBell GardensBellflowerCarsonCerritosCity Of CommerceComptonCudahyDowneyHawaiian GardensHuntington ParkLa Habra HeightsLa MiradaLakewoodLynwoodMaywoodMontebelloNorwalkParamountPico RiveraSanta Fe SpringsSouth GateVernonWhittier
Area FAvalonLong BeachSignal Hill
Area GEl SegundoGardenaHawthorneHermosa BeachInglewoodLawndaleLomitaManhattan BeachPalos Verdes EstatesRancho Palos VerdesRedondo BeachRolling HillsRolling Hills EstatesTorrance
Area HLos Angeles
*LVMCOG Members highlighted in in blue
The Joint Powers Agreement provides for inter-agency cooperation in major natural or man-made disasters. This group meets on a monthly basis and is responsible for:
Creating and updating emergency, terrorism, recovery volunteer, debris management andhazard mitigation plans
Training for emergency and disaster preparedness for cities, residents and businesses Technology for communications Homeland Security Grants Program (management)
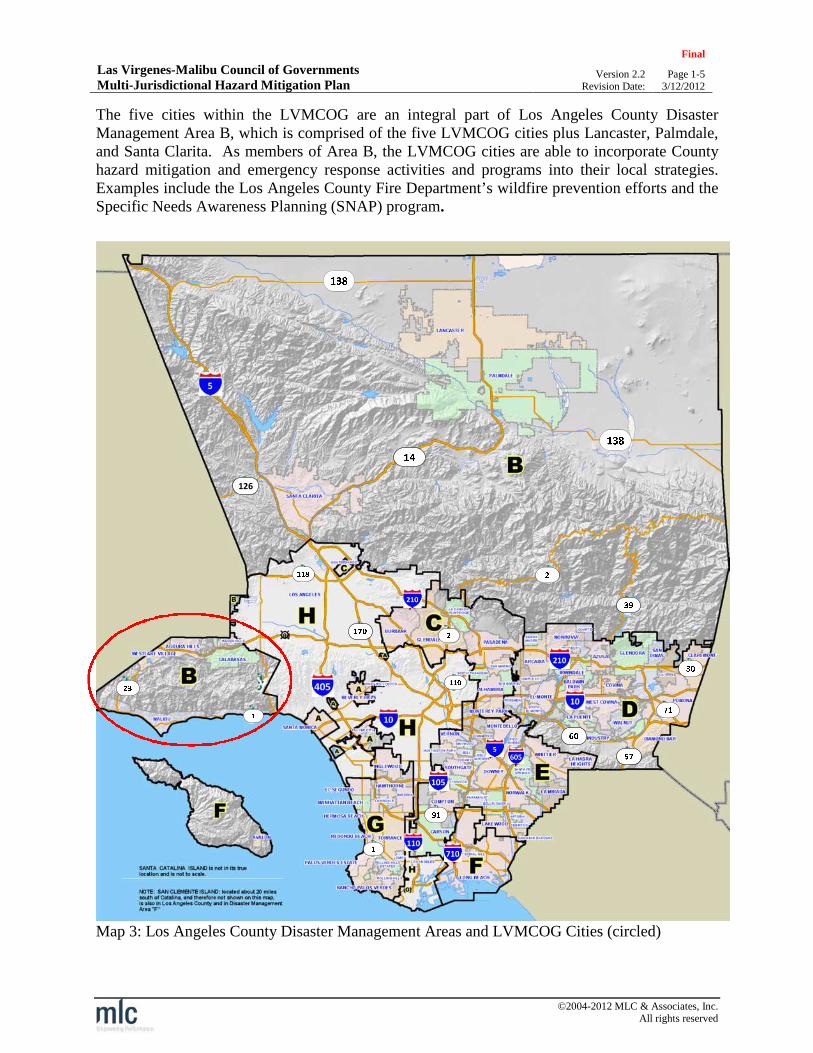
Las Virgenes-Malibu Council of GovernmentsMulti-Jurisdictional Hazard Mitigation Plan
Final
Version 2.2 Page 1-5Revision Date: 3/12/2012
©2004-2012 MLC & Associates, Inc.All rights reserved
The five cities within the LVMCOG are an integral part of Los Angeles County DisasterManagement Area B, which is comprised of the five LVMCOG cities plus Lancaster, Palmdale,and Santa Clarita. As members of Area B, the LVMCOG cities are able to incorporate Countyhazard mitigation and emergency response activities and programs into their local strategies.Examples include the Los Angeles County Fire Department’s wildfire prevention efforts and theSpecific Needs Awareness Planning (SNAP) program.
Map 3: Los Angeles County Disaster Management Areas and LVMCOG Cities (circled)
126
Las Virgenes-Malibu Council of GovernmentsMulti-Jurisdictional Hazard Mitigation Plan
Final
Version 2.2 Page 1-6Revision Date: 3/12/2012
©2004-2012 MLC & Associates, Inc.All rights reserved
Hazard Mitigation Plan Organization
This Hazard Mitigation Plan contains background information on the purpose and methodologyused to develop the mitigation plan, a profile of the Las Virgenes-Malibu Region, sections on theidentified hazards that threaten the Region as well as the associated risks, a five-year mitigationstrategy action plan matrix, and supporting information contained in the Appendices. Additionalsection details are provided in Section 1: Plan Introduction.
Mitigation Strategy Five-Year Action Plan
The Las Virgenes-Malibu Council of Governments Multi-Jurisdictional Hazard MitigationAction Plan includes resources and information to assist residents, public and private sectororganizations, and others interested in participating in planning for hazards. The MitigationStrategy Action Plan provides a list of activities designed to assist the LVMCOG to reduce riskand prevent losses from future hazard events. The strategies address multi-hazard issues, as wellas hazard specific activities for earthquakes, fires, flooding, landslide, windstorms, and terrorism.
Plan Participants
The development of the Las Virgenes-Malibu Council of Governments Multi-JurisdictionalHazard Mitigation Plan has been a collaborative city and community effort. The planningprocess was facilitated by a variety of Region-wide departments along with a consulting agency,MLC & Associates, Inc. The Las Virgenes-Malibu Council of Governments Steering Committeeand Planning Group provided vital guidance in developing and updating the plan. Since fivecities are represented, at least one representative from each city was a member of eachcommittee.
The public was invited to participate in the development and update of the plan. In addition,ongoing disaster preparedness and mitigation information is routinely provided through publicnotices, city websites, newsletters, cable television, and the local newspapers.
The Steering Committee was chosen to provide needed feedback, guidance and approval. TheSteering Committee drafted the original Mission Statement, Plan Goals, identified the hazardslist, and is responsible for final approval of the plan and strategies.
The Planning Group provided key information, supporting documentation, and updated thehazard ratings for the identified local area hazards. The hazard rating identified hazardsaccording to probability, magnitude/severity, warning time and duration. The survey is providedin Annex C: Disaster Preparedness Risk Survey.
Part II of the plan contains hazard specific information. Each of the sections providesinformation on the background and history of the hazard, as well as the associated economic andsocial impacts.
Las Virgenes-Malibu Council of GovernmentsMulti-Jurisdictional Hazard Mitigation Plan
Final
Version 2.2 Page 1-7Revision Date: 3/12/2012
©2004-2012 MLC & Associates, Inc.All rights reserved
Plan Mission
The Mission of the Las Virgenes-Malibu Council of Governments Multi-Jurisdictional HazardMitigation Plan is to promote sound public policy and programs designed to protect the public,critical facilities, infrastructure, private and public property, and the environment from naturaland human generated hazards. This will be achieved by developing, implementing, andmaintaining this plan to guide the Region towards creating and maintaining a safer moresustainable community.
Plan Goals
The Plan Goals describe the overall direction that the LVMCOGs’ agencies, organizations, andcitizens can take to minimize the impacts of hazards. The Plan Goals help to guide the directionof future activities aimed at reducing risk and preventing loss from hazards. The Plan Goals arethe foundation for the broad direction of the Mission Statement and the specificrecommendations that are outlined in the strategies. These goals are divided into 4 majorcategories:
To Protect Life, Property, Environment Implement activities that assist in protecting lives by making homes, businesses, infrastructure,
critical facilities, and other property more resistant to hazards. Reduce losses and repetitive damages for chronic hazard events while promoting insurance
coverage for catastrophic hazards. Encourage preventative measures for existing and new development in areas vulnerable to
hazards.
Public Awareness Develop and implement education and outreach programs to increase public awareness of the
risks associated with hazards. Develop and implement education and outreach programs to increase public awareness of the
mitigation measures associated with hazards. Provide information on tools, partnership opportunities, and funding resources to assist in
implementing mitigation activities.
Partnerships and Implementation Strengthen communication and coordinate participation among and within public agencies,
citizens, non-profit organizations, business, and industry to gain a vested interest inimplementation.
Encourage leadership within public and private sector organizations to prioritize and implementlocal, county, and Regional hazard mitigation activities.
Assist in the development of the Safety Element of the General Plan
Emergency Management Establish policy to ensure mitigation projects for critical facilities, services, and infrastructure. Update current ordinances, make recommendations for Region guidelines, codes, and permitting
process and establish new ordinances that support mitigation. Strengthen emergency operations by increasing collaboration and coordination among
departments, public agencies, non-profit organizations, business, and industry. Coordinate and integrate hazard mitigation activities, where appropriate, with emergency
operations plans and procedures.

Las Virgenes-Malibu Council of GovernmentsMulti-Jurisdictional Hazard Mitigation Plan
Final
Version 2.2 Page 1-8Revision Date: 3/12/2012
©2004-2012 MLC & Associates, Inc.All rights reserved
Strategy Organization
The data collection, research and the public participation process resulted in the development ofthe hazard mitigation strategies listed. The strategies outline activities in which each of thevarious cities and citizens can be engaged to reduce risk. They reflect future action to be takenin order to reduce the loss of property and life. Section 4 Hazard Mitigation Goals and Strategiesprovides brief descriptions of the projects and strategies developed.
Plan Implementation, Monitoring, and Evaluation
Section 5 Plan Implementation, Monitoring, and Evaluation details the formal process thatdescribes how the Las Virgenes-Malibu Council of Governments Multi-Jurisdictional HazardMitigation Plan is maintained. The plan maintenance process included a schedule for monitoringand evaluating the plan and producing a plan revision every five years. In addition, this sectionalso describes how the LVMCOG integrated public participation in the plan maintenance andupdate process.
Finally, the Plan Implementation, Monitoring, and Evaluation section includes an explanation ofhow the Las Virgenes-Malibu Council of Governments incorporated the mitigation strategiesoutlined into existing planning mechanisms such as each city’s individual General Plans, CapitalImprovement Plans, Building & Safety Codes and other programs, and/or plans within the cities.
Plan Adoption
In 2005, the Las Virgenes-Malibu Council of Governments and each city adopted the originalMulti-Jurisdictional Hazard Mitigation Plan. Subsequently, in 2012 this HMP update wasreviewed and adopted. These governing bodies have the authority to promote sound publicpolicy regarding hazards.
The Executive Director of the Las Virgenes-Malibu COG was responsible for submitting theupdated plan to the State Hazard Mitigation Officer at the Governor’s Emergency ManagementAgency (Cal-EMA). Cal-EMA then submitted the updated plan to the Federal EmergencyManagement Agency (FEMA) for review. This review addressed the federal criteria outlined inTitle 44 CFR Emergency Management and Assistance: Part 201 – Mitigation Planning. Uponacceptance by FEMA, Las Virgenes-Malibu Council of Governments will maintain its eligibilityfor Hazard Mitigation Grant Program funds.
Coordinating Body
The Las Virgenes-Malibu Council of Governments Hazard Mitigation Steering Committee wasresponsible for coordinating implementation of plan strategies and undertaking the formal reviewprocess. The Planning Group was responsible for supporting the Steering Committee and thetactical/operational tasks required to implement the Hazard Mitigation Plan.
Implementation Through Existing Programs
Each city within the Las Virgenes-Malibu Council of Governments addresses statewide planninggoals and legislative requirements through their General Plans, Capital Improvement Plans, andBuilding & Safety Codes. This Multi-Jurisdictional Hazard Mitigation Plan provides a series ofrecommendations that are closely related to the goals and objectives of these existing planningprograms. Each city may implement the recommended mitigation strategies through existingprograms and procedures.
Las Virgenes-Malibu Council of GovernmentsMulti-Jurisdictional Hazard Mitigation Plan
Final
Version 2.2 Page 1-9Revision Date: 3/12/2012
©2004-2012 MLC & Associates, Inc.All rights reserved
Economic Analysis of Mitigation Projects
Determining the economic feasibility of mitigating hazards can provide decision makers with anunderstanding of the potential benefits and costs of an activity, as well as provide a basis uponwhich to compare alternative projects. The Federal Emergency Management Agency's approachto identify costs and benefits associated with hazard mitigation strategies or projects falls intotwo general categories: benefit-cost analysis and cost-effectiveness analysis.
Conducting a benefit-cost analysis for a mitigation activity can assist communities indetermining whether a project is worth undertaking now in order to avoid disaster-relateddamages later. A cost-effectiveness analysis evaluates how best to spend a given amount ofmoney to achieve a specific goal. For the purposes of this HMP, an estimate of the benefit/costratio was used to evaluate the relative feasibility of the mitigation projects and strategies outlinedin Section 4 Hazard Mitigation Goals and Strategies.
Formal Review Process
As part of this update, the LVMCOG HMP was evaluated to determine the effectiveness ofexisting mitigation programs and projects as well as consider changes in land development orother changes that may have affected mitigation priorities. The Executive Director of the LasVirgenes-Malibu COG was responsible for contacting the Hazard Mitigation Steering Committeemembers and organizing progress reviews. Committee members were then responsible formonitoring and evaluating the progress of the mitigation strategies in the plan.
Continued Public Involvement
The Las Virgenes-Malibu Council of Governments is dedicated to involving the public directlyin the continual review and updating of the Multi-Jurisdictional Hazard Mitigation Plan. Copiesof the plan were made available at various locations throughout the Region including but notlimited to libraries, City Halls and respective city websites. The existence and location of thesecopies were publicized on city websites and through information bulletins.

Las Virgenes-Malibu Council of GovernmentsMulti-Jurisdictional Hazard Mitigation Plan
Final
Version 2.2 Page 1-10Revision Date: 3/12/2012
©2004-2012 MLC & Associates, Inc.All rights reserved
PLAN DESCRIPTION
Multi-Jurisdictional Hazard Mitigation Plan
The Las Virgenes-Malibu Council of Governments (LVMCOG) is comprised of the cities ofAgoura Hills, Calabasas, Hidden Hills, Malibu and Westlake Village. The LVMCOG wasvoluntarily established by its members under a Joint Powers Agreement to provide a vehicle formembers to engage in regional and cooperative planning and coordination of governmentservices and responsibilities. The LVMCOG also provides a local area organization for thecoordination of regional projects and studies funded by federal, state, and local governments.While disasters cannot be fully prevented, their effects can be reduced through a well-organizedpublic education and awareness effort, preparedness, mitigation, and coordinated response. In2005, the LVMCOG chose to develop the Multi-Jurisdictional Hazard Mitigation Plan (HMP) inorder to coordinate efforts and resources. This update to the HMP is part of the ongoing renewalprocess.
Why Develop a Mitigation Plan?
The Robert T. Stafford Disaster Relief and Emergency Assistance Act provides the basis forfederal assistance to state and local governments impacted by a disaster and outlines therequirements for mitigation planning. Hazard Mitigation is considered the first step in preparingfor emergencies (rather than placing a reliance on recovery after an event). The FederalEmergency Management Agency (FEMA) requires state and local governments to update theirhazard mitigation plans every 5 years. The consequences of not having an approved LocalHazard Mitigation Plan can be significant. Without it, cities are ineligible for FEMA mitigationprograms including: the Hazard Mitigation Grant Program and Flood Mitigation AssistanceProgram. More importantly, an ongoing mitigation effort is required in order for cities to obtainpublic assistance funding for repetitive losses (e.g., damaged facilities) following a disaster.
The Disaster Mitigation Act of 2000 (DMA 2000), Section 322 (a-d) requires that localgovernments maintain mitigation plans that describe the process for identifying hazards, risksand vulnerabilities, identifies and prioritizes mitigation actions, encourages the development oflocal mitigation, and provides technical support for those efforts as a condition of receivingfederal disaster mitigation funds. This Hazard Mitigation Plan serves to meet theserequirements.
Furthermore, this plan assists the LVMCOG in reducing risk from hazards by identifyingresources, information, and strategies for risk reduction, while helping to guide and coordinatemitigation activities throughout the Las Virgenes-Malibu Region. Mitigation strategies forreducing the potential losses identified in the risk assessment are outlined and are based onexisting authorities, policies, programs, resources, and the ability to expand on and improvethese existing tools. In summary, the information and mitigation strategies within the HazardMitigation Plan:
Establish a basis for coordination and collaboration between departments and the publicin the Las Virgenes-Malibu Council of Governments Region
Identify and prioritize future mitigation projects
Assist in meeting the requirements of federal assistance programs

Las Virgenes-Malibu Council of GovernmentsMulti-Jurisdictional Hazard Mitigation Plan
Final
Version 2.2 Page 1-11Revision Date: 3/12/2012
©2004-2012 MLC & Associates, Inc.All rights reserved
Whom Does the Mitigation Plan Affect?
This Multi-Jurisdictional Hazard Mitigation Plan affects the entire region and provides aframework for pre-emptive planning for hazards. The resources and background information inthe plan are applicable area-wide, and the goals and recommendations lay the groundwork formitigation plans and partnerships for neighboring communities.
How is the Plan Used?
Each section of the Hazard Mitigation Plan provides information and resources to assist inunderstanding the region and the hazard-related issues facing citizens, businesses, and theenvironment. The sections of the HMP combine to create a document that guides the mission toreduce risk and prevent loss from future hazard events.
Plan Update Process
The update of this plan was a collaborative effort. The process was facilitated across multipledepartments along with a consulting agency, MLC & Associates, Inc. The Steering Committeewas composed of the Las Virgenes-Malibu Council of Governments City Managers and wasestablished in order to guide the process and provide final approval of the HMP and mitigationstrategies. In addition, the Planning Group facilitated the plan update process, providedfeedback, reviewed the plan, and was responsible for initial approvals.
Various departments within the cities assisted in updating the plan. Information resourcesincluded but were not limited to: General Plans, Master Plans, SEMS Plans, reports and studies,hazard maps, and public process documentation. Participating departments included:
Building & Safety City Manager Community Development
Emergency Preparedness Fire Planning
Public Works Recreation & Parks Sheriff’s Department
The workflow below depicts the basic process of updating the plan.
Figure 1: HMP Update Process Workflow

Las Virgenes-Malibu Council of GovernmentsMulti-Jurisdictional Hazard Mitigation Plan
Final
Version 2.2 Page 1-12Revision Date: 3/12/2012
©2004-2012 MLC & Associates, Inc.All rights reserved
Internal Input
The Steering Committee was composed of the Las Virgenes-Malibu Council of GovernmentsCity Managers and was established in order to facilitate the update to the plan, provide feedback,guidance, and approval.
The Hazard Mitigation Steering Committee along with Planning Committee, city staff andvarious other stakeholders were involved in updating the plan. This process involved meetings,discussion and individual reviews and input. The planning process included:
Planning sessions with LVMCOG representatives Interviews with city Emergency Management and Disaster Preparedness personnel Reviews of historical disaster events in the local area A review of activities related to hazard mitigation from existing programs and city
General Plans, Capital Improvement Projects, and Development Projects
External Input
Existing mitigation plans, programs and activities from neighboring communities and fromaround the country were reviewed as well as current FEMA hazard mitigation planning standardsand the State of California Hazard Mitigation Plan Guidance document. In addition, geographicarea and hazard specific data were generated to develop scenario based hazard maps. Theseresources were valuable in updating the LVMCOG Hazard Mitigation Plan (see Annex AResources for source information).
Information from the sources noted above was evaluated and (when applicable) incorporated intothe plan. In addition, the information gathered served as a basis for the strategy sessions thatwere conducted to document ongoing and future mitigation activities:
Las Virgenes-Malibu Council of GovernmentsMulti-Jurisdictional Hazard Mitigation Plan
Final
Version 2.2 Page 1-13Revision Date: 3/12/2012
©2004-2012 MLC & Associates, Inc.All rights reserved
REQUIREMENTS FOR MITIGATION PLANS
Federal and State Requirements
The following Federal requirements must be met for approval of a Hazard Mitigation Plan: Open public involvement, with public meetings that introduce the process and project
requirements. The public must be afforded opportunities for involvement in: identifying and assessing
risk, drafting a plan, and public involvement in approval stages of the plan. Community cooperation, with opportunity for other local government agencies, the
business community, educational institutions, and non-profits to participate in theprocess.
Incorporation of local documents, including General Plans, Zoning Ordinances, BuildingCodes, and other pertinent city and regional documents.
The following components must be part of the planning process: Complete documentation of the planning process. A detailed risk assessment on hazard exposures in the community. A comprehensive mitigation strategy, which describes the goals & objectives, including
proposed strategies, programs & actions to avoid long-term vulnerabilities. A plan maintenance process, which describes the method and schedule of monitoring,
evaluating and updating the plan and integration of the All Hazard Mitigation Plan intoother planning mechanisms.
Formal adoption by each City Council. Plan Review by CAL EMA and FEMA.
Public/Community Process
Public participation is a key component of strategic planning processes. Citizen participationoffers stakeholders in the community the opportunity for inclusion of their interests and concernsinto the process. The Federal Emergency Management Agency requires public input during thedevelopment of local hazard mitigation plans.
During the HMP development and update process, the public was invited to participate.Information was provided on city websites, newsletters, cable television stations, and the localnewspapers. Examples are provided in Annex E Planning and Public Involvement.
Las Virgenes-Malibu Council of GovernmentsMulti-Jurisdictional Hazard Mitigation Plan
Final
Version 2.2 Page 1-14Revision Date: 3/12/2012
©2004-2012 MLC & Associates, Inc.All rights reserved
HAZARD MITIGATION PLAN ORGANIZATION
The Hazard Mitigation Plan is organized as follows:
PART I: OVERVIEW AND MITIGATION STRATEGY ACTION PLAN
Section 1: IntroductionThe Introduction provides an overview of the Hazard Mitigation Plan Mission, Goals, andStrategies. In addition, this section outlines the process used to develop the goals and strategiesthat cut across the six hazards addressed in the Hazard Mitigation Plan. Finally, this sectiondescribes the background and purpose of developing the Hazard Mitigation Plan and theplanning process.
Section 2: Community ProfileThe Community Profile section presents the history, geography, demographics, and socio-economics of Las Virgenes-Malibu Region. It serves as a tool to provide a historical perspectiveof hazards in the area, potential impacts, and identifies at risk populations.
Section 3: Risk AssessmentThe Risk Assessment section provides information on hazard identification, vulnerability, andrisk associated with hazards in Las Virgenes-Malibu Region.
Section 4: Multi-Hazard Goals and StrategiesThe Multi-Hazard Goals and Strategies section describes the mitigation strategies developed forthe HMP. The strategies address multi-hazard issues, as well as hazard-specific activities thatcan be implemented to reduce risk and prevent loss from future events.
Section 5: Plan MaintenanceThe Plan Maintenance section provides information on plan implementation, monitoring andevaluation.
PART II: HAZARD SPECIFIC INFORMATIONPart II provides hazard specific Information on the six hazards addressed in the HMP.Continuing hazards occur on an ongoing and/or seasonal basis and may be predicted throughhistoric evidence and scientific methods. Each of the hazard-specific sections includesinformation on the history, hazard causes and characteristics, hazard assessment, mitigation goalsand strategies. Continuing hazards addressed in the plan include:
Section 6: Earthquake
Section 7: Wildfire
Section 8: Windstorm
Section 9: Landslide
Section 10: Flood
Section 11: Terrorism
Las Virgenes-Malibu Council of GovernmentsMulti-Jurisdictional Hazard Mitigation Plan
Final
Version 2.2 Page 1-15Revision Date: 3/12/2012
©2004-2012 MLC & Associates, Inc.All rights reserved
PART III: ANNEXESThe Annexes includes references to the information used to gather data and conduct analyticalresearch to assemble the Las Virgenes-Malibu COG Hazard Mitigation Plan. The Resourcessection also includes a description of the tools used to develop the plan as well as documentationof the meetings, discussions and events that were involved in the planning process.
Annex A: ResourcesThis section provides a list of resources for Regional, County, State, and Federal agencies andorganizations that may be referenced directly and indirectly within the Las Virgenes-MalibuCOG Hazard Mitigation Plan.
Annex B: Local Hazard Mitigation Plan Review CrosswalkThis section includes the Local Hazard Mitigation Plan Review Crosswalk for California LocalGovernments. The Crosswalk provides a quick reference to key sections of the plan.
Annex C: Disaster Preparedness Risk SurveyThis section includes the survey by which community members rated their preparedness fordisasters and risk ratings of the identified hazards.
Annex D: Steering Committee/Planning Group Hazard Rating SurveyThis survey was provided to the Steering Committee and Planning Group to rate the LasVirgenes-Malibu COG Region hazards.
Annex E: Planning and Public InvolvementThis section provides a description of public involvement activities including meetings and otherpublic outreach efforts related to the Hazards Mitigation Plan update. This section also provides
Annex F: Flood Insurance Rate MapsThis section provides Flood Insurance Rate Maps (FIRM) for selected areas within theLVMCOG area. These maps depict areas subject to flooding and are used for planning purposes.
Annex G: Malibu Flood Mitigation PlanThis section includes the Hazard Mitigation Plan prepared for the City of Malibu in May of 2001(and still in use) by David Evens and Associates.
Annex H: Plan Approval DocumentationThis section provides a copy of Plan Approval documents related to the Las Virgenes- MalibuCOG Hazard Mitigation Plan.

Las Virgenes-Malibu Council of GovernmentsMulti-Jurisdictional Hazard Mitigation Plan
Final
Version 2.2 Page 2-1Revision Date: 3/12/2012
©2004-2012 MLC & Associates, Inc.All rights reserved
SECTION 2. COMMUNITY PROFILE
Introduction
Hazards impact the region’s citizens, property, environment, and economy. In addition to thepotential loss of life and property, residents and businesses are subject to the financial andemotional costs of recovering from disasters.
Identifying population groups and the risks posed by hazards provides the basis forimplementing strategies to reduce potential impacts; thereby protecting the lives and property ofcitizens and communities. The result is the development and implementation of strategies,coordination of resources, and increased public awareness that will reduce risk and prevent lossfrom future hazard events.
This section of the Hazard Mitigation Plan provides an overview of the Las Virgenes-MalibuCouncil of Governments (LVMCOG) region as well as the individual cities that comprise theLVMCOG. City specific profiles contained within this section provide brief summaries of thevulnerable populations, structures, and economic base of each community.
Population
According to 2010 Census data, the population of the five cities in the Las Virgenes-MalibuCouncil of Governments region totaled 66,159. Within the region, Calabasas represents thelargest population closely followed by Agoura Hills. Calabasas also represented the fastedgrowth area (15.1%) outpacing Los Angeles County (3.1%) through the period from 2000 to2010. The population levels of the other cities within the area were relatively stable during thepast ten years. Due to terrain restrictions, designated parks and reserves, and localplanning/zoning requirements, local populations are centered along the Ventura 101 Freeway andPacific Coast Highway (see Population Density Map on the following page).
Las Virgenes-Malibu Population Data
Location 2010 Population% of Los Angeles
County2000 Population
% Change from2000 to 2010
Agoura Hills 20,330 0.21% 20,537 -1.0%Calabasas 23,058 0.23% 20,033 15.1%Hidden Hills 1,856 0.02% 1,875 -1.0%Malibu 12,645 0.13% 12,575 0.6%Westlake Village 8,270 0.08% 8,368 -1.2%LVMCOG 66,159 0.67% 63,388 4.4%Los Angeles County 9,818,605 100.00% 9,519,338 3.1%
Table 2: Las Virgenes-Malibu 2010 Population Data
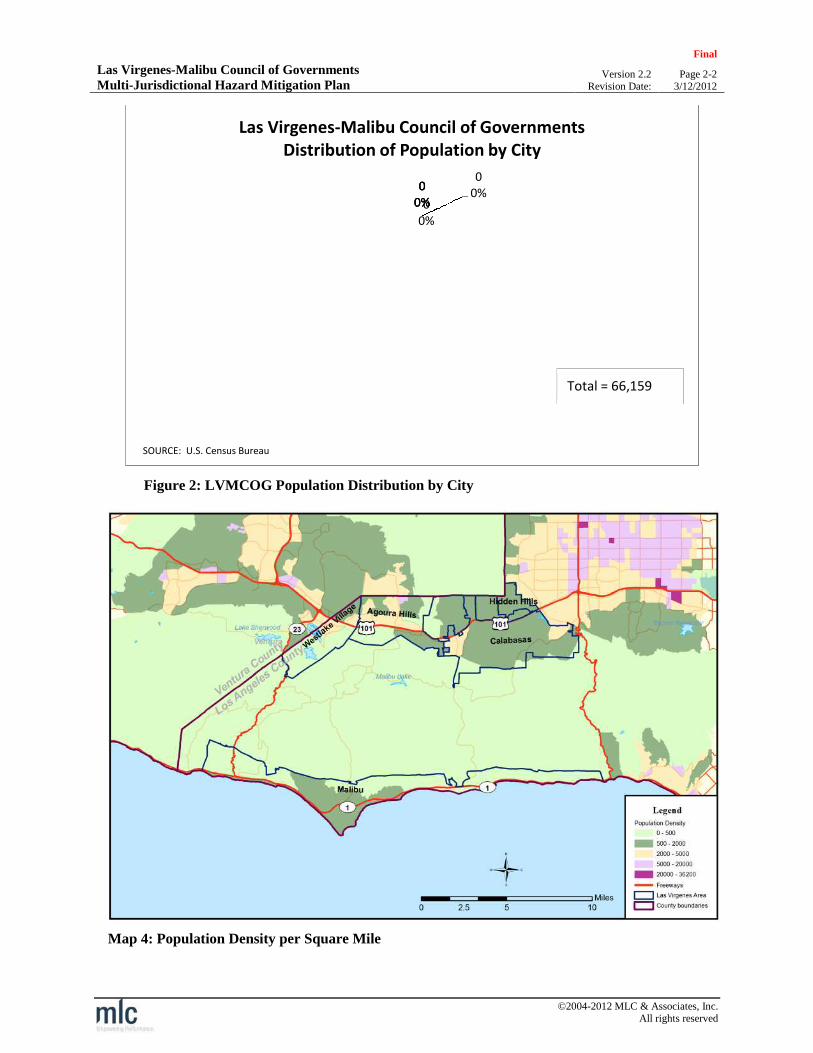
Las Virgenes-Malibu Council of GovernmentsMulti-Jurisdictional Hazard Mitigation Plan
Final
Version 2.2 Page 2-2Revision Date: 3/12/2012
©2004-2012 MLC & Associates, Inc.All rights reserved
Figure 2: LVMCOG Population Distribution by City
Map 4: Population Density per Square Mile
00%
00%
00%0
0%00%
Las Virgenes-Malibu Council of GovernmentsDistribution of Population by City
Total = 66,159
SOURCE: U.S. Census Bureau
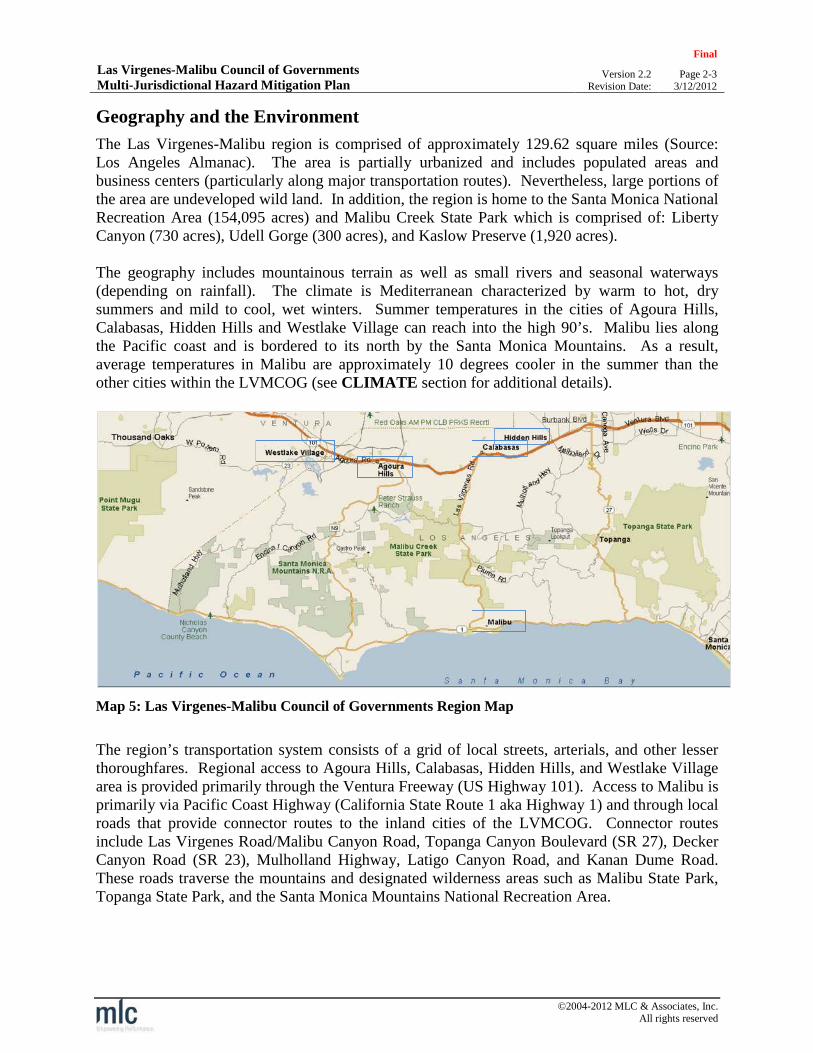
Las Virgenes-Malibu Council of GovernmentsMulti-Jurisdictional Hazard Mitigation Plan
Final
Version 2.2 Page 2-3Revision Date: 3/12/2012
©2004-2012 MLC & Associates, Inc.All rights reserved
Geography and the Environment
The Las Virgenes-Malibu region is comprised of approximately 129.62 square miles (Source:Los Angeles Almanac). The area is partially urbanized and includes populated areas andbusiness centers (particularly along major transportation routes). Nevertheless, large portions ofthe area are undeveloped wild land. In addition, the region is home to the Santa Monica NationalRecreation Area (154,095 acres) and Malibu Creek State Park which is comprised of: LibertyCanyon (730 acres), Udell Gorge (300 acres), and Kaslow Preserve (1,920 acres).
The geography includes mountainous terrain as well as small rivers and seasonal waterways(depending on rainfall). The climate is Mediterranean characterized by warm to hot, drysummers and mild to cool, wet winters. Summer temperatures in the cities of Agoura Hills,Calabasas, Hidden Hills and Westlake Village can reach into the high 90’s. Malibu lies alongthe Pacific coast and is bordered to its north by the Santa Monica Mountains. As a result,average temperatures in Malibu are approximately 10 degrees cooler in the summer than theother cities within the LVMCOG (see CLIMATE section for additional details).
Map 5: Las Virgenes-Malibu Council of Governments Region Map
The region’s transportation system consists of a grid of local streets, arterials, and other lesserthoroughfares. Regional access to Agoura Hills, Calabasas, Hidden Hills, and Westlake Villagearea is provided primarily through the Ventura Freeway (US Highway 101). Access to Malibu isprimarily via Pacific Coast Highway (California State Route 1 aka Highway 1) and through localroads that provide connector routes to the inland cities of the LVMCOG. Connector routesinclude Las Virgenes Road/Malibu Canyon Road, Topanga Canyon Boulevard (SR 27), DeckerCanyon Road (SR 23), Mulholland Highway, Latigo Canyon Road, and Kanan Dume Road.These roads traverse the mountains and designated wilderness areas such as Malibu State Park,Topanga State Park, and the Santa Monica Mountains National Recreation Area.

Las Virgenes-Malibu Council of GovernmentsMulti-Jurisdictional Hazard Mitigation Plan
Final
Version 2.2 Page 2-4Revision Date: 3/12/2012
©2004-2012 MLC & Associates, Inc.All rights reserved
Climate
Temperature
The Las Virgenes-Malibu region is characterized by warm to hot dry summers and mild to coolwet winters typical of a Mediterranean climate.
Figure 3: Average Temperature by Month
The average high in the summer rangesfrom the mid to upper 90 degreesFahrenheit. Average lows in the wintermonths range from the upper 30 to low 40degrees Fahrenheit.
August tends to be the hottest month andDecember tends to be the coldest month.However it should be noted thattemperatures can vary over a wide range.
For example, Santa Ana winds typicallyoccur in late fall and early winter. TheSanta Ana winds are characterized bystrong dry offshore winds originatingfrom the Great Basin and Upper MojaveDesert.
Wind temperatures can range fromextremely hot to cold. Damage can occurdirectly from the high wind speedsgenerated or from the secondary effects ofvery low humidity – which increases thethreat of wildfires.
Figure 4: Santa Ana Winds (Feb 2002)
SOURCE: NASA/JPL-Caltech)
0 0 0 0 0 0 0 0 0 0 0 0
#REF! 0 0 0 0 0 0 0 0 0 0 0 0
#REF! 0 0 0 0 0 0 0 0 0 0 0 0
0
0.2
0.4
0.6
0.8
1
Fah
ren
he
it
Average Monthly Temperatures

Las Virgenes-Malibu Council of GovernmentsMulti-Jurisdictional Hazard Mitigation Plan
Final
Version 2.2 Page 2-5Revision Date: 3/12/2012
©2004-2012 MLC & Associates, Inc.All rights reserved
Rainfall
Rainfall in the LVMCOG region averages nearly 18 inches per year. However the term “averagerainfall” is misleading because over the recorded history of rainfall in the region, rainfallamounts have ranged from no rain at all in some years to well over normal averages in very wetyears. Furthermore, actual rainfall in Southern California tends to fall in large amounts duringsporadic and often heavy storms rather than in consistent amounts throughout the year.
Figure 5: Average Rainfall by Month
El Niño and La Niña
Periodically, Southern California and the LVMCOG region are subject to the effects of El Niñoor La Niña conditions:
El Niño is characterized by unusually warm ocean temperatures in the Equatorial Pacificresulting in increased rainfall in the southern tier of the U.S. El Niño conditions canresult in flooding, mudslides, and traffic disruptions in the LVMCOG region.
La Niña is characterized by unusually cold ocean temperatures in the Equatorial Pacificresulting in decreased rainfall in the southern tier of the U.S. La Niña conditions canresult in drought and increased danger from wildfires.
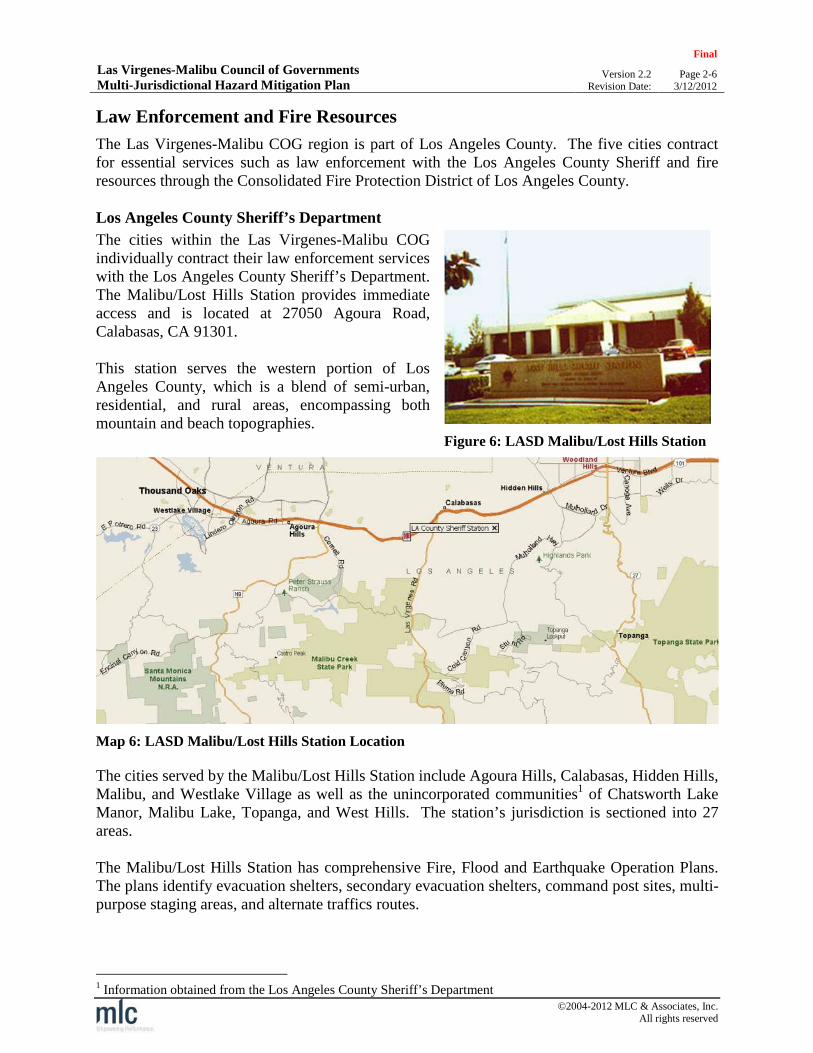
Las Virgenes-Malibu Council of GovernmentsMulti-Jurisdictional Hazard Mitigation Plan
Final
Version 2.2 Page 2-6Revision Date: 3/12/2012
©2004-2012 MLC & Associates, Inc.All rights reserved
Law Enforcement and Fire Resources
The Las Virgenes-Malibu COG region is part of Los Angeles County. The five cities contractfor essential services such as law enforcement with the Los Angeles County Sheriff and fireresources through the Consolidated Fire Protection District of Los Angeles County.
Los Angeles County Sheriff’s Department
The cities within the Las Virgenes-Malibu COGindividually contract their law enforcement serviceswith the Los Angeles County Sheriff’s Department.The Malibu/Lost Hills Station provides immediateaccess and is located at 27050 Agoura Road,Calabasas, CA 91301.
This station serves the western portion of LosAngeles County, which is a blend of semi-urban,residential, and rural areas, encompassing bothmountain and beach topographies.
Figure 6: LASD Malibu/Lost Hills Station
Map 6: LASD Malibu/Lost Hills Station Location
The cities served by the Malibu/Lost Hills Station include Agoura Hills, Calabasas, Hidden Hills,Malibu, and Westlake Village as well as the unincorporated communities1 of Chatsworth LakeManor, Malibu Lake, Topanga, and West Hills. The station’s jurisdiction is sectioned into 27areas.
The Malibu/Lost Hills Station has comprehensive Fire, Flood and Earthquake Operation Plans.The plans identify evacuation shelters, secondary evacuation shelters, command post sites, multi-purpose staging areas, and alternate traffics routes.
1 Information obtained from the Los Angeles County Sheriff’s Department

Las Virgenes-Malibu Council of GovernmentsMulti-Jurisdictional Hazard Mitigation Plan
Final
Version 2.2 Page 2-7Revision Date: 3/12/2012
©2004-2012 MLC & Associates, Inc.All rights reserved
Furthermore, the Malibu/Lost Hills Station has implemented a process for prioritizing criticalfacilities assessments. This process ranks locations in the following order:
1. “A” priorities must be checked immediately2. “B” priorities must be checked immediately if children are present, otherwise as time
permits3. “C” priorities must be checked as time permits
Critical facilities identified by the Malibu/Lost Hills Station are noted in Section 3.
Malibu Search & Rescue Team
The Malibu Search & Rescue Team (SAR) was founded in 1977 and is an all-volunteerorganization comprised of Los Angeles County Sheriff's Department Reserve Deputy Sheriffsand a select group of Civilian Volunteer Specialists and Incident Support Personnel. The MalibuSAR Team is a unit of the Los Angeles County Sheriff's Department and a member of theCalifornia region of the Mountain Rescue Association.
The Malibu SAR jurisdiction covers 187 square miles of the Santa Monica Mountains from theLos Angeles/Ventura County line to Pacific Palisades, the east face of the Santa SusanaMountains and the contract cities of Agoura Hills, Calabasas, Hidden Hills, Malibu, andWestlake Village. The Malibu SAR will also travel anywhere in Los Angeles County to assistother LASD teams. Furthermore, the team will respond to other states or other country ifrequested to do so through the California Emergency Management Agency (Cal EMA). The LosAngeles County Sheriff’s Department provides the team with rescue vehicles and rescueoperations are conducted under the guidance of the Los Angeles County Sheriff.
Los Angeles County Fire Department
Agoura Hills, Calabasas, Hidden Hills, Malibu and Westlake Village contract fire services withthe Los Angeles County Fire Department. The Las Virgenes-Malibu COG is located in DivisionVII – Central Region of the Los Angeles County Fire Department’s Regional Plan Divisions.Battalion 5 of the Los Angeles County Fire Department is assigned to directly serve the LasVirgenes-Malibu region. The local LA County Fire Department headquarters are located at 3970Carbon Canyon Rd., Malibu 90265.
BATTALION 5
Fire Station #65 4206 N Cornell Rd, Agoura, 91301
Fire Station #67 25801 Piuma Rd, Calabasas, 91302
Fire Station #68 24130 Calabasas Rd, Calabasas, 91302
Fire Station #69 401 S Topanga Cyn Blvd, Topanga, 90290
Fire Station #70 - Headquarters 3970 Carbon Cyn Rd, Malibu, 90265
Fire Station #71 28722 W Pacific Coast Hwy, Malibu, 90265
Fire Station #72 1832 Decker Canyon Rd, Malibu, 90265
Fire Station #88 23720 W Malibu Rd, Malibu, 90265
Fire Station #89 29575 Canwood St., Agoura Hills, 91301
Fire Station #99 32550 Pacific Coast Hwy, Malibu, 90265
Fire Station #125 5215 N Las Virgenes Rd, Calabasas, 91302
Fire Station #144 31981 Foxfield Dr, Westlake Village, 91361
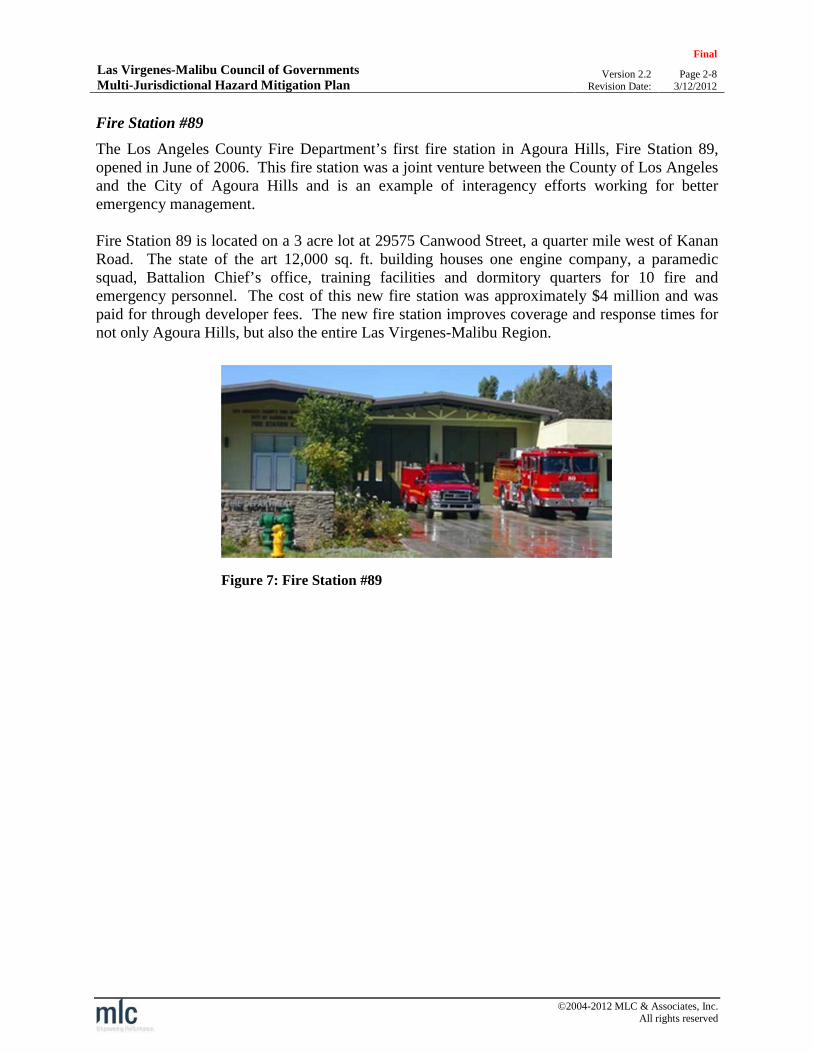
Las Virgenes-Malibu Council of GovernmentsMulti-Jurisdictional Hazard Mitigation Plan
Final
Version 2.2 Page 2-8Revision Date: 3/12/2012
©2004-2012 MLC & Associates, Inc.All rights reserved
Fire Station #89
The Los Angeles County Fire Department’s first fire station in Agoura Hills, Fire Station 89,opened in June of 2006. This fire station was a joint venture between the County of Los Angelesand the City of Agoura Hills and is an example of interagency efforts working for betteremergency management.
Fire Station 89 is located on a 3 acre lot at 29575 Canwood Street, a quarter mile west of KananRoad. The state of the art 12,000 sq. ft. building houses one engine company, a paramedicsquad, Battalion Chief’s office, training facilities and dormitory quarters for 10 fire andemergency personnel. The cost of this new fire station was approximately $4 million and waspaid for through developer fees. The new fire station improves coverage and response times fornot only Agoura Hills, but also the entire Las Virgenes-Malibu Region.
Figure 7: Fire Station #89

Las Virgenes-Malibu Council of GovernmentsMulti-Jurisdictional Hazard Mitigation Plan
Final
Version 2.2 Page 2-9Revision Date: 3/12/2012
©2004-2012 MLC & Associates, Inc.All rights reserved
Multi-Regional Collaboration
Agoura Hills / Calabasas Community Center
The cities in the Las Virgenes-Malibu COG often combine resources and work together to createmore productive communities. One such example was the joint venture of the cities of Calabasasand Agoura Hills to build the Agoura Hills / Calabasas Community Center. This is a state-of-the-art recreational facility that offers a variety of recreational, social, cultural, and educationalprograms and activities to meet the needs of the surrounding communities. This endeavor is aprime example of how communities can come together in order to offer residents a more livablecommunity. Furthermore, in the event of an emergency, facilities such as the Agoura Hills /Calabasas Community Center are valuable resources that can be used to support the localpopulation.
Figure 8: Agoura Hills / Calabasas Community Center
Community Emergency Response Training
The cities in the Las Virgenes-Malibu COG make available Community Emergency ResponseTraining (CERT) programs to their residents as well as residents of neighboring communities.This CERT effort facilitates the concept of joint cooperation to create safer communities.
Specific Needs Awareness Planning (SNAP)The cities in the Las Virgenes-Malibu COG participatein the Los Angeles County Office of EmergencyManagement (OEM) Specific Needs AwarenessPlanning (S.N.A.P.) voluntary disaster registry. TheS.N.A.P. registry is an Internet-based system thatallows residents to provide information to public safetyofficials about their access or functional needs.Examples include requirements relating to physical,medical, sensory, cognitive or age-related conditionsS.N.A.P. does not guarantee priority response toregistrants. It assists emergency response officials inplanning and responding to the requirements of peoplewith access and functional needs during a disaster byintegrating database and mapping technology together. Figure 9: SNAP Program

Las Virgenes-Malibu Council of GovernmentsMulti-Jurisdictional Hazard Mitigation Plan
Final
Version 2.2 Page 2-10Revision Date: 3/12/2012
©2004-2012 MLC & Associates, Inc.All rights reserved
OARRS
The cities in the Las Virgenes-Malibu COG participate in the Los Angeles County Office ofEmergency Management (OEM) Operational Area Response and Recovery System (OARRS)which is designed to provide:
Remote system access in the Operational Area; Interface with the State of California's Response Information Management System; Interface with the County's Enterprise Geographic Information System; Facilitation of emergency response activities, multi-jurisdictional and multidisciplinary
response and recovery coordination, and information flow; Support for multi-disciplinary and multi-jurisdiction plans and exercises; System of communication and information management that links County departments,
cities, schools, and special districts; Custom reporting; and Secure emergency information and data sharing.
Connect-CTY
All cities in the Las Virgenes-Malibu COG have implemented Connect-CTY (BlackboardConnect® by Blackboard Inc.), a service that allows authorized civic leaders to create andrapidly disseminate emergency messages to every telephone number stored in the notificationdatabase.
Details by City
The remainder of this section provides detailed descriptions of each of the five cities within theLas Virgenes-Malibu Council of Governments. The information included outlines each city andprovides a basic history, location, climate and topographical information, demographics, socialmakeup, employment figures, major employers, and housing data. An understanding of each ofthese categories is important for addressing the needs of the local community.
Cities are displayed in alphabetical order. Agoura Hills Calabasas Hidden Hills Malibu Westlake Village
Las Virgenes-Malibu Council of GovernmentsMulti-Jurisdictional Hazard Mitigation Plan
Final
Version 2.2 Page 2-11Revision Date: 3/12/2012
©2004-2012 MLC & Associates, Inc.All rights reserved
Agoura Hills
Agoura Hills is located in the foothills of the SantaMonica Mountains on the western edge of Los AngelesCounty in the Conejo Valley. Agoura Hillsencompasses 7.79 square miles and straddles theVentura Freeway approximately 36 miles west ofdowntown Los Angeles. In the 1950’s the availabilityof a reliable water supply caused the area to transformfrom a semi-rural ranching community to greaterresidential and commercial development.
Today, Agoura Hills is characterized by rolling hills and a blend of semi-rural and suburbandevelopment. The total population of Agoura Hills is comprised of approximately 20,330 people(2010 U.S. Census).
Brief History
The area around what is today the City of Agoura Hills was a popular resting place along theCamino Real, the original road connecting the Spanish missions from San Diego to SanFrancisco. Ranching was the area’s dominant industry from the arrival of the Spanish in the late18th century until the early 20th century. In the 1920’s Paramount Studios purchased a portion ofthe Rancho Las Virgenes, just south of what is now the City of Agoura Hills and established afilm studio. In the late 1920’s a group of residents asked to have a permanent post officeestablished in the area, and the name “Agoura” was given.
Growth and development was slow due in part to a lack of a significant water source. In the late1950’s, the Las Virgenes Municipal Water District was established, and reliable water sourcesmade the Agoura area more attractive for families and businesses. Concurrently with theavailability of water, further growth occurred when the local highway became part of theVentura Freeway. During the late 1960’s and the 1970’s, expansion continued as large housingtracts and shopping areas, as well as schools, developed. In 1982, residents voted in favor ofcityhood, and on December 8, 1982 Agoura Hills became the 83rd city in Los Angeles County.
Climate /Topography
The climate in Agoura Hills is characterized by mild winters with temperatures ranging from thelow 40’s to the high 60’s, and warm summers with temperatures ranging from the low 60’s to thehigh 90’s. Average annual rainfall is 19.5 inches with the greatest portion of precipitationoccurring in the winter months.
Agoura Hills is located in the eastern Conejo Valley between the Simi Hills to the north and theSanta Monica Mountains to the south. The City ranges in altitude from 936 feet to 2,036 feetabove sea level.
General CoordinatesLatitude 34°8’42’’NorthLongitude 118°46’40’’West

Las Virgenes-Malibu Council of GovernmentsMulti-Jurisdictional Hazard Mitigation Plan
Final
Version 2.2 Page 2-12Revision Date: 3/12/2012
©2004-2012 MLC & Associates, Inc.All rights reserved
Map 7: Agoura Hills Location Map

Las Virgenes-Malibu Council of GovernmentsMulti-Jurisdictional Hazard Mitigation Plan
Final
Version 2.2 Page 2-13Revision Date: 3/12/2012
©2004-2012 MLC & Associates, Inc.All rights reserved
Economic Activity
Economic activity is one indicator of the potential losses that may be incurred in the event of adisaster. The following tables list the principal employers, property tax payers, and taxable salesin Agoura Hills.
Agoura Hills Principal Employers
Company Industry EmployeesPercent of Total City
Employment
Bank of America Finance 860 8.06%
Las Virgenes Unified School District* Government 487 4.57%
THQ Inc. Publishing 425 3.98%
IBM Corporation Technology 220 2.06%
Teradyne Manufacturing 197 1.85%
Touch Commerce Internet 197 1.85%
Employers Direct Insurance Insurance 150 1.41%
Renaissance Hotel Hotel 150 1.41%
Farmers Financial Solutions Insurance 150 1.41%
Wood Ranch Barbecue Restaurant 130 1.22%
Total 2,966 27.81%
Total City Employment 10,665 100.00%Source Agoura Hills 2010 Comprehensive Annual Financial Report and SCAG Profile of the City of Agoura Hills, May 2011*Employee count is based on Agoura Hills school sites only
Table 3: Agoura Hills Principal Employers
Agoura Hills Principal Property Tax Payers
CompanyTaxable Assessed
ValuePercent of Total City
Assessed Value
Tishman Speyer Archstone Smith Oak Creek $19,930,130 2.61%
Tishman Speyer Archstone Smith Agoura Hills $43,444,338 1.11%
RBD Agoura Hills LLC $34,668,134 0.89%
Bank of America $32,798,273 0.84%
Teradyne Inc. $18,921,527 0.49%
MEF Realty LLC $27,810,300 0.71%
Whizin Market Square LLC $27,258,480 0.70%
Apple Seven Hospitality Ownership Inc. $25,614,647 0.66%
FW CA Twin Oaks Shopping Center LLC $24,311,398 0.62%
Agoura North Jacobsen Holdings LLC $23,562,317 0.60%
Total $360,009,344 9.23%
Source Agoura Hills 2010 Comprehensive Annual Financial Report
Table 4: Agoura Hills Principal Property Tax Payers
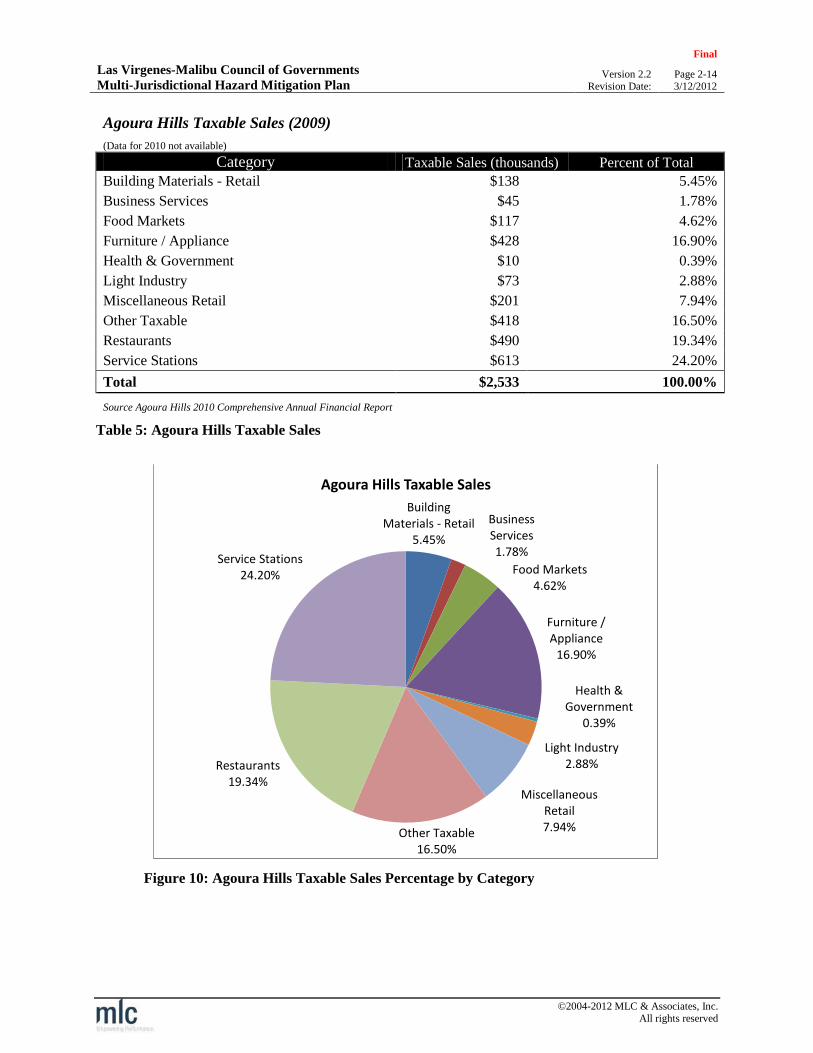
Las Virgenes-Malibu Council of GovernmentsMulti-Jurisdictional Hazard Mitigation Plan
Final
Version 2.2 Page 2-14Revision Date: 3/12/2012
©2004-2012 MLC & Associates, Inc.All rights reserved
Agoura Hills Taxable Sales (2009)
(Data for 2010 not available)
Category Taxable Sales (thousands) Percent of Total
Building Materials - Retail $138 5.45%
Business Services $45 1.78%
Food Markets $117 4.62%
Furniture / Appliance $428 16.90%
Health & Government $10 0.39%
Light Industry $73 2.88%
Miscellaneous Retail $201 7.94%
Other Taxable $418 16.50%
Restaurants $490 19.34%
Service Stations $613 24.20%
Total $2,533 100.00%
Source Agoura Hills 2010 Comprehensive Annual Financial Report
Table 5: Agoura Hills Taxable Sales
Figure 10: Agoura Hills Taxable Sales Percentage by Category
BuildingMaterials - Retail
5.45%
BusinessServices1.78%
Food Markets4.62%
Furniture /Appliance
16.90%
Health &Government
0.39%
Light Industry2.88%
MiscellaneousRetail7.94%Other Taxable
16.50%
Restaurants19.34%
Service Stations24.20%
Agoura Hills Taxable Sales
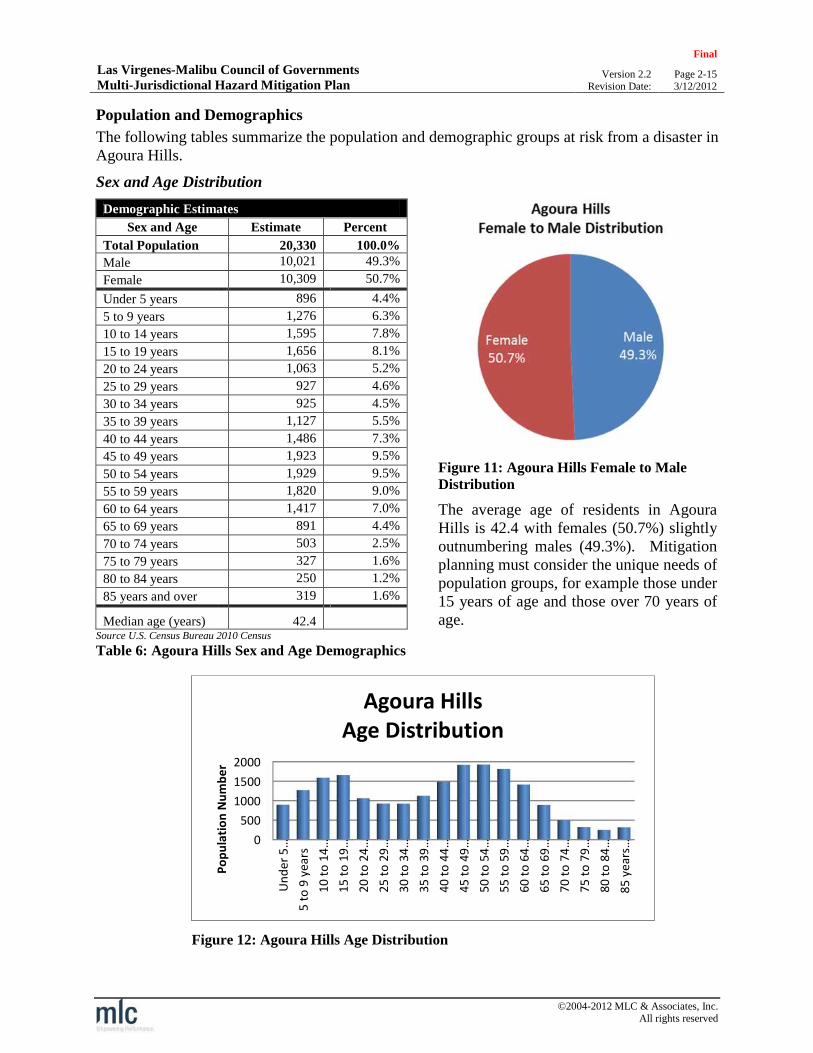
Las Virgenes-Malibu Council of GovernmentsMulti-Jurisdictional Hazard Mitigation Plan
Final
Version 2.2 Page 2-15Revision Date: 3/12/2012
©2004-2012 MLC & Associates, Inc.All rights reserved
Population and Demographics
The following tables summarize the population and demographic groups at risk from a disaster inAgoura Hills.
Sex and Age Distribution
Demographic Estimates
Figure 11: Agoura Hills Female to MaleDistribution
The average age of residents in AgouraHills is 42.4 with females (50.7%) slightlyoutnumbering males (49.3%). Mitigationplanning must consider the unique needs ofpopulation groups, for example those under15 years of age and those over 70 years ofage.
Sex and Age Estimate Percent
Total Population 20,330 100.0%
Male 10,021 49.3%
Female 10,309 50.7%
Under 5 years 896 4.4%
5 to 9 years 1,276 6.3%
10 to 14 years 1,595 7.8%
15 to 19 years 1,656 8.1%
20 to 24 years 1,063 5.2%
25 to 29 years 927 4.6%
30 to 34 years 925 4.5%
35 to 39 years 1,127 5.5%
40 to 44 years 1,486 7.3%
45 to 49 years 1,923 9.5%
50 to 54 years 1,929 9.5%
55 to 59 years 1,820 9.0%
60 to 64 years 1,417 7.0%
65 to 69 years 891 4.4%
70 to 74 years 503 2.5%
75 to 79 years 327 1.6%
80 to 84 years 250 1.2%
85 years and over 319 1.6%
Median age (years) 42.4Source U.S. Census Bureau 2010 Census
Table 6: Agoura Hills Sex and Age Demographics
Figure 12: Agoura Hills Age Distribution
0
500
1000
1500
2000
Un
de
r5
…
5to
9ye
ars
10
to1
4…
15
to1
9…
20
to2
4…
25
to2
9…
30
to3
4…
35
to3
9…
40
to4
4…
45
to4
9…
50
to5
4…
55
to5
9…
60
to6
4…
65
to6
9…
70
to7
4…
75
to7
9…
80
to8
4…
85
year
s…
Po
pu
lati
on
Nu
mb
er
Agoura HillsAge Distribution

Las Virgenes-Malibu Council of GovernmentsMulti-Jurisdictional Hazard Mitigation Plan
Final
Version 2.2 Page 2-16Revision Date: 3/12/2012
©2004-2012 MLC & Associates, Inc.All rights reserved
Race Composition
One aspect of mitigation planning isthe need to address the language(communications) needs of localpopulations. This includes the abilityto distribute information and providenotification in the event of a regionalemergency. For Agoura Hills, anestimated 21% of the population speakslanguages other than English (includingEnglish and another language or non-English only) with more than a quarterof these speaking English “less thanvery well”.
Race PopulationPercent of
Total
Total Population 20,330 100.0%
White Alone 15,971 78.6%
Hispanic or Latino (of anyrace)
1,936 9.5%
Black or African Americanalone
256 1.3%
American Indian and AlaskaNative alone
26 0.1%
Asian alone 1,503 7.4%
Native Hawaiian and OtherPacific Islander Alone
22 0.1%
Some other race alone 51 0.3%
Two or more races 565 2.8%US Census Bureau 2010 Census
Table 7: Agoura Hills Race Composition
Languages Spoken at Home
Subject Total EstimateSpeak English "very
well" Estimate
Speak English lessthan "very well"
EstimatePopulation 5 years and over 19,555 94.5% 5.5%
Speak only English 79.0% (X) (X)
Speak a language other than English 21.0% 73.8% 26.2%
Spanish or Spanish Creole 6.2% 71.1% 28.9%
Other Indo-European languages 8.5% 83.3% 16.7%
Asian and Pacific Island languages 4.1% 56.7% 43.3%
Other languages 2.3% 76.6% 23.4%
Table 8: Agoura Hills Languages Spoken at Home
Figure 13: Agoura Hills Race Distribution Figure 14: Agoura Hills Languages Spoken at Home
White Alone78.6%
Hispanic orLatino (of any
race)9.5%
Black or AfricanAmerican alone
1.3%
American Indianand Alaska
Native alone0.1%
Asian alone7.4%
Native Hawaiianand Other Pacific
Islander Alone0.1%
Some other racealone0.3% Two or more
races2.8%
Agoura Hills Race Distribution
Speak onlyEnglish78.9%
Spanish orSpanish Creole
6.2%
Other Indo-Europeanlanguages
8.5%
Asian andPacific Island
languages4.1%
Otherlanguages
2.3%
Agoura Hills Language Spoken atHome
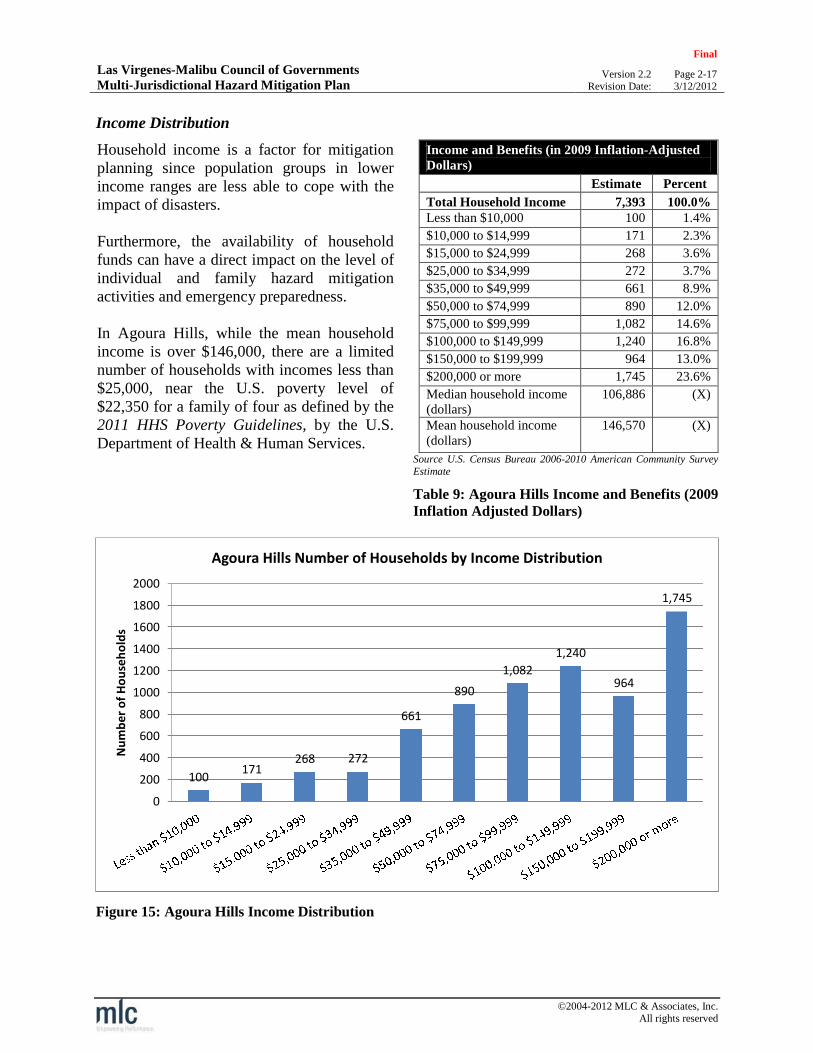
Las Virgenes-Malibu Council of GovernmentsMulti-Jurisdictional Hazard Mitigation Plan
Final
Version 2.2 Page 2-17Revision Date: 3/12/2012
©2004-2012 MLC & Associates, Inc.All rights reserved
Income Distribution
Household income is a factor for mitigationplanning since population groups in lowerincome ranges are less able to cope with theimpact of disasters.
Furthermore, the availability of householdfunds can have a direct impact on the level ofindividual and family hazard mitigationactivities and emergency preparedness.
In Agoura Hills, while the mean householdincome is over $146,000, there are a limitednumber of households with incomes less than$25,000, near the U.S. poverty level of$22,350 for a family of four as defined by the2011 HHS Poverty Guidelines, by the U.S.Department of Health & Human Services.
Income and Benefits (in 2009 Inflation-AdjustedDollars)
Estimate Percent
Total Household Income 7,393 100.0%Less than $10,000 100 1.4%
$10,000 to $14,999 171 2.3%
$15,000 to $24,999 268 3.6%
$25,000 to $34,999 272 3.7%
$35,000 to $49,999 661 8.9%
$50,000 to $74,999 890 12.0%
$75,000 to $99,999 1,082 14.6%
$100,000 to $149,999 1,240 16.8%
$150,000 to $199,999 964 13.0%
$200,000 or more 1,745 23.6%
Median household income(dollars)
106,886 (X)
Mean household income(dollars)
146,570 (X)
Source U.S. Census Bureau 2006-2010 American Community SurveyEstimate
Table 9: Agoura Hills Income and Benefits (2009Inflation Adjusted Dollars)
Figure 15: Agoura Hills Income Distribution
100171
268 272
661
890
1,082
1,240
964
1,745
0
200
400
600
800
1000
1200
1400
1600
1800
2000
Nu
mb
er
of
Ho
use
ho
lds
Agoura Hills Number of Households by Income Distribution

Las Virgenes-Malibu Council of GovernmentsMulti-Jurisdictional Hazard Mitigation Plan
Final
Version 2.2 Page 2-18Revision Date: 3/12/2012
©2004-2012 MLC & Associates, Inc.All rights reserved
Land Use
Basic land use patterns are well established in the City of Agoura Hills. Residentialneighborhoods are fully developed and there are limited opportunities for infill developmentremaining. Agoura Hills also contains a number of commercial zones. The city’s main shoppingareas are the Twin Oaks Shopping Center and the Agoura Meadows Shopping Center. AgouraHills also has a number of business centers which include the following:
Agoura City Mall Agoura Hills Town Center Agoura Pointe Agoura Village Kanan Plaza
Kanan Pointe Lake Lindero Shopping Center Mann Theater Complex Shopps at Oak Creek Whizin Shopping Center
Regional access to Agoura Hills is provided by U.S. Highway 101, which runs east/west throughthe center of Agoura Hills dividing the town in half. Local access within the City is providedprimarily by Kanan Road and Reyes Adobe Road in the north/south directions; Agoura Road andThousand Oaks Boulevard in the east/west directions. City owned streets run 64 miles.
Housing Characteristics
The following housing statistics provide a summary of the numbers and types of housing unitsthat are at risk if a disaster were to occur in Agoura Hills. Housing data includes: HousingOccupancy, Change from 2000 to 2010, Number of Structures Built by Year, Home Values, andHome Value Distribution. In Agoura Hills there has been a significant increase in the number oflarge units (10 or more) since 2000.
Housing Occupancy Estimate Percent
Total Housing Units 7,681 100.0%
Occupied housing units 7,393 96.3%
Vacant housing units 288 3.7%
Source U.S. Census Bureau 2006-2010 American Community Survey
Table 10: Agoura Hills Housing Occupancy
Units In Structure 2010 2000 Change
EstimatedNumber
Percent ofUnits
NumberPercent of
UnitsDifference2010-2000
PercentChange
Total Housing Units 7,681 100.0% 6,955 100% 726 10.4%
1-unit, detached 5,390 70.2% 5,191 74.6% 199 3.8%
1-unit, attached 1,032 13.4% 974 14.0% 58 6.0%
2 units 12 0.2% 7 0.1% 5 71.4%
3 or 4 units 161 2.1% 168 2.4% -7 -4.2%
5 to 9 units 124 1.6% 126 1.8% -2 -1.6%
10 to 19 units 359 4.7% 140 2.0% 219 156.4%
20 or more units 581 7.6% 349 5.0% 232 66.5%
Mobile home 22 0.3% 0 0.0% 22 N/A
Boat, RV, van, etc. 0 0.0% 0 0.0% 0 0.0%Source: US Census Bureau 2006 - 2010 ACS and US Census Bureau 2000 Census
Table 11: Agoura Hills Units in Structure Change from 2000 to 2010

Las Virgenes-Malibu Council of GovernmentsMulti-Jurisdictional Hazard Mitigation Plan
Final
Version 2.2 Page 2-19Revision Date: 3/12/2012
©2004-2012 MLC & Associates, Inc.All rights reserved
In terms of risk and disaster mitigation, olderstructures that have not been retrofitted orotherwise improved may be more susceptibleto damage or destruction due to age and thefact that older building codes were lessstringent than those required for newerstructures. As a result the inventory of olderstructures is a consideration when developingmitigation plans.
In Agoura Hills, 90% of structures (6,915)were built prior to 1990 and 53.1% (4,075)before 1980.
Year StructureBuilt
Estimate Percent
Total housing units 7,681 100.0%
Built 2005 or later 67 0.9%
Built 2000 to 2004 379 4.9%
Built 1990 to 1999 320 4.2%
Built 1980 to 1989 2,840 37.0%
Built 1970 to 1979 2,756 35.9%
Built 1960 to 1969 879 11.4%
Built 1950 to 1959 286 3.7%
Built 1940 to 1949 124 1.6%
Built 1939 or earlier 30 0.4%
Source: U.S. Census Bureau 2006-2010 American CommunitySurvey
Table 12: Year Structures Built in AgouraHills
Figure 16: Agoura Hills Number of Structures Built by Year
0
500
1000
1500
2000
2500
3000
Nu
mb
er
of
Stru
ctu
res
Agoura Hills Number of Structures Built by Year
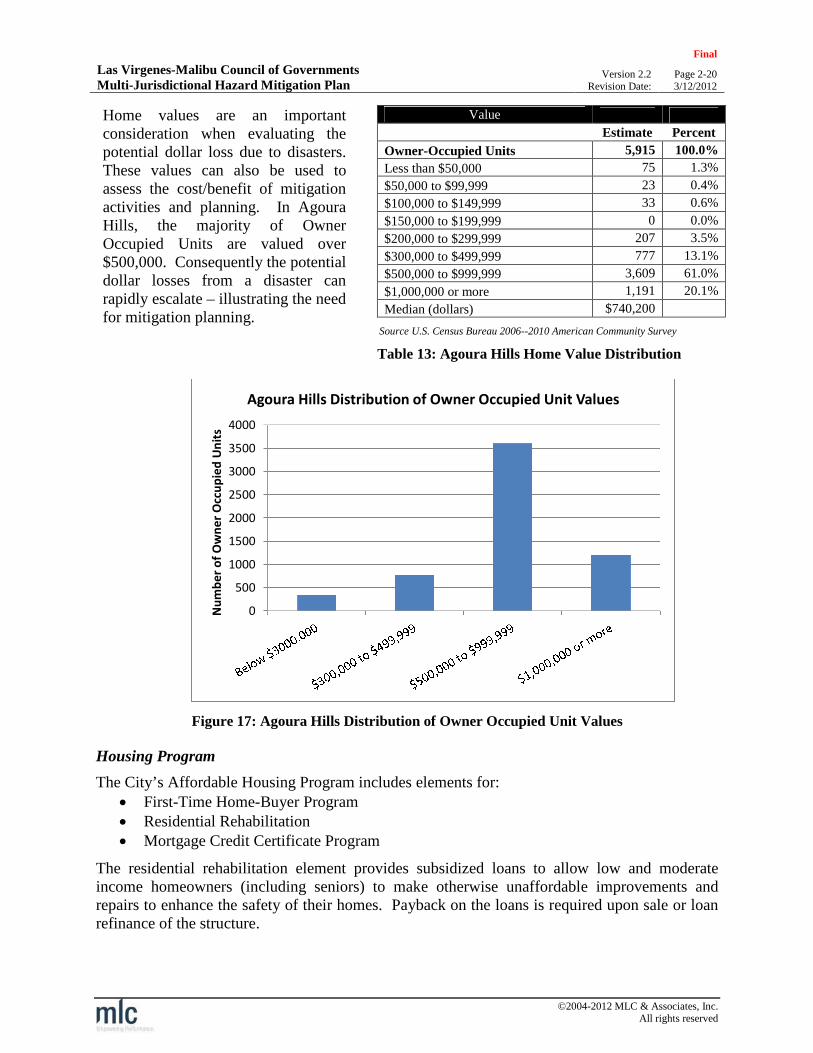
Las Virgenes-Malibu Council of GovernmentsMulti-Jurisdictional Hazard Mitigation Plan
Final
Version 2.2 Page 2-20Revision Date: 3/12/2012
©2004-2012 MLC & Associates, Inc.All rights reserved
Home values are an importantconsideration when evaluating thepotential dollar loss due to disasters.These values can also be used toassess the cost/benefit of mitigationactivities and planning. In AgouraHills, the majority of OwnerOccupied Units are valued over$500,000. Consequently the potentialdollar losses from a disaster canrapidly escalate – illustrating the needfor mitigation planning.
Value
Estimate Percent
Owner-Occupied Units 5,915 100.0%
Less than $50,000 75 1.3%
$50,000 to $99,999 23 0.4%
$100,000 to $149,999 33 0.6%
$150,000 to $199,999 0 0.0%
$200,000 to $299,999 207 3.5%
$300,000 to $499,999 777 13.1%
$500,000 to $999,999 3,609 61.0%
$1,000,000 or more 1,191 20.1%
Median (dollars) $740,200
Source U.S. Census Bureau 2006--2010 American Community Survey
Table 13: Agoura Hills Home Value Distribution
Figure 17: Agoura Hills Distribution of Owner Occupied Unit Values
Housing Program
The City’s Affordable Housing Program includes elements for: First-Time Home-Buyer Program Residential Rehabilitation Mortgage Credit Certificate Program
The residential rehabilitation element provides subsidized loans to allow low and moderateincome homeowners (including seniors) to make otherwise unaffordable improvements andrepairs to enhance the safety of their homes. Payback on the loans is required upon sale or loanrefinance of the structure.
0
500
1000
1500
2000
2500
3000
3500
4000
Nu
mb
er
of
Ow
ne
rO
ccu
pie
dU
nit
s
Agoura Hills Distribution of Owner Occupied Unit Values

Las Virgenes-Malibu Council of GovernmentsMulti-Jurisdictional Hazard Mitigation Plan
Final
Version 2.2 Page 2-21Revision Date: 3/12/2012
©2004-2012 MLC & Associates, Inc.All rights reserved
Emergency Preparedness
The following groups are active in providing emergency preparedness, mitigation, and responseservices within Agoura Hills:
Emergency Operations Center
The City of Agoura Hills has a fully-equipped and maintained Emergency Operations Centerlocated in the Community Room of the Civic Center at 30001 Ladyface Court. City staff istrained to operate the center in a disaster or emergency situation. Activation of the center can beordered by the City Manager, the Sheriff’s Department, or the Fire Department.
Emergency Response Team
The City of Agoura Hills implements a City of Agoura Hills Volunteer Disaster Response Team.The City currently has 80 volunteers on its roster and will continue to grow its volunteer baseover the next five years. The City solicits volunteers regularly through their city newsletter, theAgoura Hills Leaflet. As part of their preparation to assist the city staff and community in timeof emergency, new members attend the CERT training program.
Agoura Hills SAR Team
The City maintains a Search and Rescue Team through its CERT program. These volunteerswould assist public safety agencies in rescue activities if requested.
City of Agoura Hills Law Enforcement Committee
While the City does not have a Public Safety Committee, the City’s Law EnforcementCommittee acts in this similar capacity meeting with staff and representatives from LawEnforcement and Los Angeles County Fire representative to discuss safety issues as they presentthemselves. The Law Enforcement Committee consists of two members of the City Council,who work with the City Manager and a staff liaison. The Law Enforcement Committee meetsprimarily as needed, but at least annually.
Emergency Communications
The City maintains multiple communications capabilities that are used on a daily basis as well asin emergencies:
Connect CTY (Mass notification system) AHTV – City of Agoura Hills Cable Channel City Twitter Account @cityagourahills City Amateur (HAM) Radio Frequency Capabilities/City Repeater - The City has ham
radio capabilities within it EOC which provides another method of communicationduring emergencies. Additionally, the City also has a repeater at the Kimberly Peaklocation to assist with providing further communications capabilities.
Las Virgenes-Malibu Council of GovernmentsMulti-Jurisdictional Hazard Mitigation Plan
Final
Version 2.2 Page 2-22Revision Date: 3/12/2012
©2004-2012 MLC & Associates, Inc.All rights reserved
Homeowners Associations
Homeowners associations in Agoura Hills meet on a regular basis to discuss community issues,including hazard mitigation. Homeowners associations mail out information on a periodic basisand are very involved in the community. Additionally, the City will visit HomeownerAssociations and other groups to speak about emergency services to encourage groups to becomemore involved in the City's emergency network.
The following is a list of the Homeowners Associations in the City of Agoura Hills: Agoura Hills Country Estates Liberty Canyon Townhomes
Agoura Country Townhomes Meadow Ridge Townhomes
Annandale I Townhomes Morrison Ranch
Annandale II Townhomes Oak Hills
Chateau Creek Oak Valley
Chateau Park Oakview Garden
Fountainwood Oakview Ranch
Griffin Parkside Old Agoura
Hillrise Open Space Peacock Ridge
Indian Hills Rondell Condominiums
Lake Lindero Community Stonecrest
Lake Lindero Country Club Town and Country
Lake Lindero Townhomes Village of Oak Creek
Lakeview Villas Westlake Villas
Liberty Canyon
General Plan
The City Council of Agoura Hills approved a new General Plan on March 24, 2010, whichdetails a strategy for the City’s development over the next 25 years. Included in this plan areprovisions for flood hazards, geological and seismic hazards, wildland and urban fire hazardsand emergency preparedness in general.
As part of the general plan, the City of Agoura Hills implemented the following principles thatadhere to particular facets of disaster preparedness:
1. Protect Agoura Hills’ residents, workers, and visitors from flood hazards.
2. Protect all personal and property in Agoura Hills from non-seismic geological hazards.
3. Protect all persons and property in Agoura Hills from urban and wildland fires.
4. Protect all persons and property in Agoura Hills from criminal activities.
5. Ensure that life and property in Agoura Hills are not endangered by the use, storage, ortransport of hazardous materials.

Las Virgenes-Malibu Council of GovernmentsMulti-Jurisdictional Hazard Mitigation Plan
Final
Version 2.2 Page 2-23Revision Date: 3/12/2012
©2004-2012 MLC & Associates, Inc.All rights reserved
Calabasas
Calabasas is located in the southwestern portion of theSan Fernando Valley in Los Angeles County.Calabasas is situated along the heavily traveled VenturaFreeway (Highway 101) approximately 25 miles fromdowntown Los Angeles. A portion of the Calabasasnorthern boundary is shared with Ventura County.
The City of Calabasas encompasses approximately 12.9 square miles or 8,512 acres of land. Thepopulation of Calabasas is estimated at 23,058 people. Unincorporated areas surrounding thecity that may be considered for future growth total 3.9 square miles (2,514 acres) and includeresidential neighborhoods, commercial areas, open space, and a public school.
Brief History
In the early 19th century Spanish settlers established farms and ranches in the rural area that isnow the city of Calabasas. In the late 19th century large ranches gave way to smaller familyfarms. Residential and commercial development of the area was restricted by water availabilityuntil 1958 when the Las Virgenes Municipal Water District established a substantial and reliablewater source. Prior to incorporation, Calabasas was an unincorporated community governed bythe County of Los Angeles. The City of Calabasas was incorporated in 1991.
Climate/Topography
The climate in the City of Calabasas can be characterized as mild in the winters, and warm anddry in the summers. Precipitation averages 13.6 inches per year. The terrain can be categorizedas rugged or mountainous with a few level areas. Calabasas is located in the foothills of theSanta Monica Mountains, and ranges in elevation from 500 to 2,500 feet above sea level, with anaverage elevation of 796 feet. The scenic character of Calabasas is a result of its mountainousterrain and most undeveloped areas in Calabasas will likely remain that way due to topographicalconstraints and zoning limitations.
General CoordinatesLatitude 34°9’28’’NorthLongitude 118°38’15’’West

Las Virgenes-Malibu Council of GovernmentsMulti-Jurisdictional Hazard Mitigation Plan
Final
Version 2.2 Page 2-24Revision Date: 3/12/2012
©2004-2012 MLC & Associates, Inc.All rights reserved
Map 8: Calabasas Location Map

Las Virgenes-Malibu Council of GovernmentsMulti-Jurisdictional Hazard Mitigation Plan
Final
Version 2.2 Page 2-25Revision Date: 3/12/2012
©2004-2012 MLC & Associates, Inc.All rights reserved
Economic Activity
Economic activity is one indicator of the potential losses that may be incurred in the event of adisaster. The following tables list the principal employers, property tax payers, and taxable salesin Calabasas.
Calabasas Principal Employers
Company Industry EmployeesPercent of Total City
Employment
Las Virgenes Unified School District Education *1,641 12.23%The Cheesecake Factory Mfg/Office 692 5.16%Ixia Technology 550 4.10%City of Calabasas Government 150 2.18%Sedgwick Claims Management Services Insurance 285 2.12%Viewpoint Education Foundation Education 278 2.07%Alcatel Internetworking, Inc. Technology 266 1.98%Spirent Communications Technology 200 1.49%Informa Research Services, Inc. Business Services 190 1.42%Davis Research, LLC Business Services 165 1.23%Total 4,559 33.99%
Total City Employment 13,413 100.00%Calabasas 2010 Comprehensive Annual Financial Report and SCAG Profile of the City of Calabasas, May 2011*Includes all District employees since the Las Virgenes Unified School District Headquarters is located in Calabasas- see Agoura HillsPrincipal Employers for the number of employees in Agoura Hills
Table 14: Calabasas Principal Employers
Calabasas Principal Property Tax Payers
Company Taxable Assessed ValuePercent of Total City
Assessed ValueASN Calabasas I LLC 163,328,392 2.54%
Calabasas TC Properties LLC 87,720,000 1.37%
Casden Malibu Canyon L P 84,021,327 1.31%
Kilroy Realty LP 69,663,351 1.09%
Commons At Calabasas LLC 64,560,420 1.01%
MS LPC Malibu Land Holdings LLC 52,291,776 0.81%
Bank of America NA 49,700,916 0.77%
Cheesecake Factory Inc. 40,331,421 0.63%
Calabasas Courtyard Inc. 33,597,176 0.52%
Cypress Calabasas LLC 24,558,131 0.38%
Total $669,772,910 8.9%
Total Property Tax Assessed Value $6,417,971,246
Source Calabasas 2010 Comprehensive Annual Financial Report
Table 15: Calabasas Principal Tax Payers

Las Virgenes-Malibu Council of GovernmentsMulti-Jurisdictional Hazard Mitigation Plan
Final
Version 2.2 Page 2-26Revision Date: 3/12/2012
©2004-2012 MLC & Associates, Inc.All rights reserved
Calabasas Taxable Sales
Category Taxable Sales (thousands) Percent of TotalBusiness to Business $1,801 38.86%Transportation $1,594 34.39%Food Products $686 14.80%General Retail $488 10.53%Miscellaneous $61 1.32%Construction $5 0.10%Total $4,635 100.00%Source Calabasas 2010 Comprehensive Annual Financial Report*General grocery items are not taxable; the sales tax applies only to prepared food items and nonfood items.
Table 16: Calabasas Principal Taxable Sales
Figure 18: Calabasas Taxable Sales Percentage by Category
Business toBusiness38.86%
Transportation34.39%
Food Products14.80%
General Retail10.53%
Miscellaneous1.32%
Construction0.10%
Calabasas Taxable Sales

Las Virgenes-Malibu Council of GovernmentsMulti-Jurisdictional Hazard Mitigation Plan
Final
Version 2.2 Page 2-27Revision Date: 3/12/2012
©2004-2012 MLC & Associates, Inc.All rights reserved
Population and Demographics
The following tables summarize the population and demographic groups at risk from a disaster inCalabasas.
Sex and Age Distribution
Demographic Estimates
Figure 19: Calabasas Female to MaleDistribution
The average age of residents in Calabasasis 41.6 with females (51.7%) outnumberingmales (48.3%). Mitigation planning mustconsider the unique needs of populationgroups, for example those under 15 yearsof age and those over 70 years of age.
Sex and Age Estimate PercentTotal Population 23,058 100.0%Male 11,147 48.3%Female 11,911 51.7%
Under 5 years 1131 4.4%5 to 9 years 1,571 6.3%10 to 14 years 1,885 7.8%15 to 19 years 1,762 8.1%20 to 24 years 1,367 5.2%25 to 29 years 982 4.6%30 to 34 years 909 4.5%35 to 39 years 1,372 5.5%40 to 44 years 1,762 7.3%45 to 49 years 2,083 9.5%50 to 54 years 2,088 9.5%55 to 59 years 1,869 9.0%60 to 64 years 1,374 7.0%65 to 69 years 985 4.4%70 to 74 years 736 2.5%75 to 79 years 521 1.6%80 to 84 years 383 1.2%85 years and over 278 1.6%
Median age (years) 41.6
Source U.S. Census Bureau 2010 Census
Table 17: Calabasas Sex and Age Demographics
Figure 20: Calabasas Age Distribution
0500
1000150020002500
Un
de
r5
year
s
5to
9ye
ars
10
to1
4ye
ars
15
to1
9ye
ars
20
to2
4ye
ars
25
to2
9ye
ars
30
to3
4ye
ars
35
to3
9ye
ars
40
to4
4ye
ars
45
to4
9ye
ars
50
to5
4ye
ars
55
to5
9ye
ars
60
to6
4ye
ars
65
to6
9ye
ars
70
to7
4ye
ars
75
to7
9ye
ars
80
to8
4ye
ars
85
year
san
d…
Po
pu
lati
on
Nu
mb
er
CalabasasAge Distribution

Las Virgenes-Malibu Council of GovernmentsMulti-Jurisdictional Hazard Mitigation Plan
Final
Version 2.2 Page 2-28Revision Date: 3/12/2012
©2004-2012 MLC & Associates, Inc.All rights reserved
Race Composition
One aspect of mitigation planning isthe need to address the language(communications) needs of localpopulations. This includes the abilityto distribute information and providenotification in the event of a regionalemergency.
For Calabasas, an estimated 28.9% ofthe population speaks languages otherthan English (including English andanother language or non-English only)with nearly a quarter of these speakingEnglish “less than very well”.
Race PopulationPercent of
TotalTotal Population 23,058 100.00%White Alone 18,332 79.50%Hispanic or Latino (ofany race)
1,481 6.42%
Black or AfricanAmerican alone
356 1.54%
American Indian andAlaska Native alone
30 0.13%
Asian alone 1,977 8.57%Native Hawaiian andOther Pacific IslanderAlone
6 0.03%
Some other race alone 68 0.29%Two or more races 808 3.50%
US Census Bureau 2010 Census
Table 18: Calabasas Race Composition
Languages Spoken at Home
Subject Total EstimateSpeak English "very
well" Estimate
Speak English lessthan "very well"
EstimatePopulation 5 years and over 21,655 93.2% 6.8%)
Speak only English 71.1% (X) (X)
Speak a language other than English 28.9% 76.6% 23.4%
Spanish or Spanish Creole 6.5% 79.9% 20.10%
Other Indo-European languages 12.9% 79.4% 20.60%
Asian and Pacific Island languages 4.4% 68.9% 31.10%
Other languages 5.1% 71.9% 28.10%
Table 19: Calabasas Languages Spoken at Home
Figure 21: Calabasas Race Distribution Figure 22: Calabasas Languages Spoken at Home
White Alone79.50%
Hispanic orLatino (of any
race)6.42%
Black or AfricanAmerican alone
1.54%
American Indianand Alaska
Native alone0.13%
Asian alone8.57%
Native Hawaiianand Other
Pacific IslanderAlone0.03%
Some other racealone0.29%
Two or moreraces3.50%
Calabasas Race Distribution
Speak onlyEnglish71.1%
Spanish orSpanish Creole
6.5%
Other Indo-Europeanlanguages
12.9%
Asian andPacific Island
languages4.4%
Otherlanguages
5.1%
Calabasas Language Spoken atHome

Las Virgenes-Malibu Council of GovernmentsMulti-Jurisdictional Hazard Mitigation Plan
Final
Version 2.2 Page 2-29Revision Date: 3/12/2012
©2004-2012 MLC & Associates, Inc.All rights reserved
Income Distribution
Household income is a factor for mitigationplanning since population groups in lowerincome ranges are less able to cope with theimpact of disasters.
Furthermore, the availability of householdfunds can have a direct impact on the level ofindividual and family hazard mitigationactivities and emergency preparedness.
In Calabasas, while the mean householdincome is $164,833, there are a limitednumber of households with incomes less than$25,000, near the U.S. poverty level of$22,350 for a family of four as defined by the2011 HHS Poverty Guidelines, by the U.S.Department of Health & Human Services.
Income and Benefits (in 2009 Inflation-AdjustedDollars)
Estimate Percent
Total Household Income 8339 100.0%
Less than $10,000 277 3.3%
$10,000 to $14,999 125 1.5%
$15,000 to $24,999 381 4.6%
$25,000 to $34,999 317 3.8%
$35,000 to $49,999 544 6.5%
$50,000 to $74,999 938 11.2%
$75,000 to $99,999 1,005 12.1%
$100,000 to $149,999 1,585 19.0%
$150,000 to $199,999 998 12.0%
$200,000 or more 2,169 26.0%
Median household income(dollars)
116,403 (X)
Mean household income(dollars)
164,833 (X)
Source U.S. Census Bureau 2006-2010 American Community SurveyEstimate
Table 20: Calabasas Income and Benefits (2009Inflation Adjusted Dollars)
Figure 23: Calabasas Income Distribution
277125
381 317
544
938 1,005
1,585
998
2,169
-
500
1,000
1,500
2,000
2,500
Nu
mb
er
of
Ho
use
ho
lds
Calabasas Number of Households by Income Distribution

Las Virgenes-Malibu Council of GovernmentsMulti-Jurisdictional Hazard Mitigation Plan
Final
Version 2.2 Page 2-30Revision Date: 3/12/2012
©2004-2012 MLC & Associates, Inc.All rights reserved
Land Use
There are 55.5 lane miles of streets in the City of Calabasas. Due to environmental constraintsand steep hillsides, most undeveloped land within the Calabasas City limits will remainundeveloped and most developable areas are already built out. The non-developed areas ofCalabasas are mainly in open space or hillside/mountainous zones.
The City of Calabasas is mainly residential but also hosts a number of commercial businessparks and shopping centers including:
Calabasas Canyon Center Calabasas Plaza Creekside Village Gelson’s Village
Malibu Canyon Plaza Old Town Shopping Center Plaza Calabasas The Commons The Courtyard at the Commons
Housing Characteristics
The following housing statistics provide a summary of the numbers and types of housing unitsthat are at risk if a disaster were to occur in Calabasas. Housing data includes: HousingOccupancy, Units in Structure Change from 2000 to 2010, Number of Structures Built by Year,Home Values, and Home Value Distribution. In Calabasas, there has been a significant increasein the number of housing units since 2000 – particularly in multi-unit structures.
Housing Occupancy Estimate Percent
Total Housing Units 8,686 100.0%
Occupied housing units 8,339 96.0%
Vacant housing units 347 4.0%
Source U.S. Census Bureau 2006-2010 American Community Survey
Table 21: Calabasas Housing Occupancy
Units In Structure 2010 2000 Change
EstimatedNumber
Percent ofUnits
NumberPercent of
UnitsDifference2010-2000
PercentChange
Total Housing Units 8,686 100.00% 6,955 100% 1,731 24.9%
1-unit, detached 5,966 68.69% 5,191 74.6% 775 14.9%
1-unit, attached 649 7.47% 974 14.0% (325) -33.4%
2 units 11 0.13% 7 0.1% 4 57.1%
3 or 4 units 470 5.41% 168 2.4% 302 179.8%
5 to 9 units 403 4.64% 126 1.8% 277 219.8%
10 to 19 units 400 4.61% 140 2.0% 260 185.7%
20 or more units 561 6.46% 349 5.0% 212 60.7%
Mobile home 226 2.60% 0 0.0% 226 -
Boat, RV, van, etc. - 0.00% 0 0.0% - 0.0%Source: US Census Bureau 2006 - 2010 ACS and US Census Bureau 2000 Census
Table 22: Calabasas Units in Structure Change from 2000 to 2010

Las Virgenes-Malibu Council of GovernmentsMulti-Jurisdictional Hazard Mitigation Plan
Final
Version 2.2 Page 2-31Revision Date: 3/12/2012
©2004-2012 MLC & Associates, Inc.All rights reserved
In terms of risk and disaster mitigation, olderstructures that have not been retrofitted orotherwise improved may be more susceptibleto damage or destruction due to age and thefact that older building codes were lessstringent than those required for newerstructures. As a result the inventory of olderstructures is a consideration when developingmitigation plans.
In Calabasas, 71.3% of structures (6,197)were built prior to 1990 and 21.7% (1,882)before 1980.
Year StructureBuilt
Estimate Percent
Total housing units 8,688 100.0%
Built 2005 or later 344 4.0%
Built 2000 to 2004 224 2.6%
Built 1990 to 1999 1923 22.1%
Built 1980 to 1989 2,857 32.9%
Built 1970 to 1979 1,882 21.7%
Built 1960 to 1969 1294 14.9%
Built 1950 to 1959 54 0.6%
Built 1940 to 1949 16 0.2%
Built 1939 or earlier 94 1.1%
Source: U.S. Census Bureau 2006-2010 American Community Survey
Table 23: Year Structures Built in Calabasas
Figure 24: Calabasas Number of Structures Built by Year
-
500
1,000
1,500
2,000
2,500
3,000
Nu
mb
er
of
Stru
ctu
res
Calabasas Number of Structures Built by Year

Las Virgenes-Malibu Council of GovernmentsMulti-Jurisdictional Hazard Mitigation Plan
Final
Version 2.2 Page 2-32Revision Date: 3/12/2012
©2004-2012 MLC & Associates, Inc.All rights reserved
Home values are an importantconsideration when evaluating thepotential dollar loss due to disasters.These values can also be used toassess the cost/benefit of mitigationactivities and planning. In Calabasas,the majority of Owner OccupiedUnits are valued over $500,000.Consequently the potential dollarlosses from a disaster can rapidlyescalate – illustrating the need formitigation planning.
Value
Estimate Percent
Owner-Occupied Units 6,344 100.0%
Less than $50,000 28 0.4%
$50,000 to $99,999 127 2.0%
$100,000 to $149,999 59 0.9%
$150,000 to $199,999 51 0.8%
$200,000 to $299,999 96 1.5%
$300,000 to $499,999 456 7.2%
$500,000 to $999,999 2,578 40.6%
$1,000,000 or more 2,949 46.5%
Median (dollars) $962,700
Source U.S. Census Bureau 2006--2010 American Community Survey
Table 24: Calabasas Home Value Distribution
Figure 25: Calabasas Distribution of Owner Occupied Unit Values
0
500
1000
1500
2000
2500
3000
3500
Nu
mb
er
of
Ow
ne
rO
ccu
pie
dU
nit
s
Calabasas Distribution of Owner Occupied Unit Values
Las Virgenes-Malibu Council of GovernmentsMulti-Jurisdictional Hazard Mitigation Plan
Final
Version 2.2 Page 2-33Revision Date: 3/12/2012
©2004-2012 MLC & Associates, Inc.All rights reserved
Emergency Preparedness
The following groups are active in providing emergency preparedness, mitigation, and responseservices within Calabasas.
Emergency Operations Center
The City of Calabasas’ Emergency Response organization is organized using the federallymandated Incident Command System (ICS). The City of Calabasas has an EmergencyOperations Center and separate communications room. The City of Calabasas coordinates itsemergency activities with the Lost Hills Sheriff’s Station and the L.A. County Office ofEmergency Management through the Emergency Management Information System OperationalArea Response and Recovery System (OARRS). The City of Calabasas also has an internalcable television network which is used during emergency/disaster situations to relay informationto the public on conditions within the City including transit issues, fire hazards, flood, shelterlocations, school issues, and animal care and control.
Public Safety Commission
The City of Calabasas has a variety of commissions that offer residents opportunities toparticipate in city issues including the Public Safety Commission. The purpose of the PublicSafety Commission is to foster and maintain effective interaction with law enforcement and todevelop a formal mechanism to support such interaction. The scope of subject matter that ispursued by the Public Safety Commission and representatives of law enforcement are as follows: Fire / Life Safety Issues Crime Incidents / Trends Traffic Safety School Related Issues Time and Performance Data Safety Hazards Public Perceptions of Law Enforcement Performance
Emergency Communications
The City maintains multiple communications capabilities that are used on a daily basis as well asin emergencies:
Blackboard Connect (Connect CTY mass notification system) CTV (The Calabasas Channel) – City of Calabasas Cable Channel City of Calabasas emergency broadcast information radio channel AM 1630 City of Calabasas website (www.cityofcalabasas.com) Connect with Calabasas (Automated Email notifications, newsletters, agendas, projects,
and reports) City Email ([email protected]) City Twitter Account @CityofCalabasas City Facebook Account

Las Virgenes-Malibu Council of GovernmentsMulti-Jurisdictional Hazard Mitigation Plan
Final
Version 2.2 Page 2-34Revision Date: 3/12/2012
©2004-2012 MLC & Associates, Inc.All rights reserved
CalHamThe City of Calabasas has an amateur radio station "CalHam" comprised of community memberswho are CERP (Community Emergency Response Program), CERT (Community EmergencyResponse Training), and FCC licensed that test the system on a weekly basis. During anemergency, neighborhood information/status reports are forwarded to the City's EmergencyOperations Center.
Homeowners Associations
Calabasas has an extensive list of Homeowners Associations that meet to discuss variouscommunity issues and are very involved in the community. The following is a list of theHomeowners Associations in the City of Calabasas.
Calabasas Homeowner AssociationsAlizia Canyon Malibu Canyon Townhomes
Archstone Calabasas Malibu Canyon Villas
Bellagio - Park Verdi Malibu Creek Apartments
Braewood Calabasas Malibu Creek Condominiums
Calabasas Colony Mira Monte
Calabasas Country Estates Mountain Park
Calabasas Highlands Mulholland Heights
Calabasas Hills Mulholland Heights North
Calabasas Park (Lake) Mulholland Ranch Estates
Calabasas Park Estates Mullwood Townhomes
Calabasas Ridge Oak Creek
Calabasas View Oak Creek Estates
Calabasas Village Mobil Estates Oak Park
Clairidge Old Topanga, Inc.
Classic Calabasas Palatino
Country Lane HOA Park Moderne
Creekside Calabasas Park Sorrento Condos
Deer Springs Saint Andrews
El Encanto Saratoga Hills HOA
Greater Mulwood Homeowners Saratoga Ranch
Las Villas Calabasas Serenata
Las Virgenes Hills Homes Steeplechase
Las Virgenes Homeowners Federation Stonecreek
Las Virgenes Park Tanterra HOA
Las Virgenes Village Townhomes The Oaks of Calabasas
Malibu Canyon Apartments Vista Pointe
Malibu Canyon Community Westridge
Malibu Canyon Park Woodland
Las Virgenes-Malibu Council of GovernmentsMulti-Jurisdictional Hazard Mitigation Plan
Final
Version 2.2 Page 2-35Revision Date: 3/12/2012
©2004-2012 MLC & Associates, Inc.All rights reserved
Hidden Hills
Hidden Hills is a small, affluent, gated community located along theVentura Freeway (U.S. Highway 101) in the westernmost portion of theSan Fernando Valley in Los Angeles County. The land area is 1.65 squaremiles with a population of 1,856 people and a median home value greaterthan $1,000,000. Hidden Hills is a master planned community designedand developed by A.E. Hanson in the 1950’s.
Brief History
The area that is today the city of Hidden Hills was initially farm and ranchland. In 1950developer A.E. Hanson purchased 1000 acres from local landowners, divided the property andbegan selling homes and home sites. In 1961 facing the prospect of becoming annexed by thecity of Los Angeles and having Burbank Boulevard extended through the community, theresidents of Hidden Hills elected to incorporate becoming the 73rd city incorporated in LosAngeles County. The community has continued to develop in a controlled fashion followingstrict development codes governed by the Hidden Hills Community Association.
Three full-time employees staff the office of City Hall and provide all necessary services andinformation to residents, visitors and contractors. Residents of Hidden Hills elect a five-memberCity Council on a non-partisan basis to serve four year overlapping terms. The Mayor is selectedby the City Council, from one of its members, for a one year term and serves as the officialrepresentative of the City.
Climate/Topography
Winters are mild and slightly rainy while summers are warm and dry. The temperature rangesfrom the low 60’s to the high 90’s in the summer and from the low 40’s to the high 60’s in thewinter. The average annual rain fall in Hidden Hills is 13.6 inches.
To the northwest, Hidden Hills abuts the foothills of the Simi Hills mountain range and the 3,000acre Upper Las Virgenes Canyon Open Space Preserve. To the south the community is borderedby U.S. Highway 101.
General CoordinatesLatitude 34° 10’ 3” NorthLongitude 118° 39’ 39” West

Las Virgenes-Malibu Council of GovernmentsMulti-Jurisdictional Hazard Mitigation Plan
Final
Version 2.2 Page 2-36Revision Date: 3/12/2012
©2004-2012 MLC & Associates, Inc.All rights reserved
Map 9: Hidden Hills Location Map
Economic Activity
The City of Hidden Hills is a completely residential community with the exception of a smallrestricted commercial zone with one real estate office. As a result the impact of a disaster wouldhave limited economic impact in terms of businesses; however there could be a large impact tothe local population and residential structures (see Population Demographics and Land Usesections below).

Las Virgenes-Malibu Council of GovernmentsMulti-Jurisdictional Hazard Mitigation Plan
Final
Version 2.2 Page 2-37Revision Date: 3/12/2012
©2004-2012 MLC & Associates, Inc.All rights reserved
Population and Demographics
The following tables summarize the population and demographic groups at risk from a disaster inHidden Hills.
Sex and Age Distribution
Demographic Estimates
Figure 26: Hidden Hills Female to MaleDistribution
The average age of residents in HiddenHills is 45.8 with females (51.0%)outnumbering males (49.0%). Mitigationplanning must consider the unique needs ofpopulation groups, for example those under15 years of age and those over 70 years ofage.
Sex and Age Estimate PercentTotal Population 1,856 100.0%Male 909 49.0%Female 947 51.0%
Under 5 years 57 3.1%5 to 9 years 139 7.5%10 to 14 years 205 11.0%15 to 19 years 183 9.9%20 to 24 years 72 3.9%25 to 29 years 36 1.9%30 to 34 years 27 1.5%35 to 39 years 49 2.6%40 to 44 years 133 7.2%45 to 49 years 187 10.1%50 to 54 years 195 10.5%55 to 59 years 156 8.4%60 to 64 years 122 6.6%65 to 69 years 102 5.5%70 to 74 years 77 4.1%75 to 79 years 46 2.5%80 to 84 years 36 1.9%85 years and over 34 1.8%
Median age (years) 45.8
Source U.S. Census Bureau 2010 Census
Table 25: Hidden Hills Sex and Age Demographics
Figure 27: Hidden Hills Age Distribution
0
50
100
150
200
250
Po
pu
lati
on
Nu
mb
er
Hidden HillsAge Distribution

Las Virgenes-Malibu Council of GovernmentsMulti-Jurisdictional Hazard Mitigation Plan
Final
Version 2.2 Page 2-38Revision Date: 3/12/2012
©2004-2012 MLC & Associates, Inc.All rights reserved
Race Composition
One aspect of mitigation planning isthe need to address the language(communications) needs of localpopulations. This includes the abilityto distribute information and providenotification in the event of a regionalemergency. For Hidden Hills, anestimated 4.8% of the populationspeaks languages other than English(including English and anotherlanguage or non-English only) withnearly a quarter of these speakingEnglish “less than very well”.
Race PopulationPercent of
Total
Total Population 1,856 100.0%
White Alone 1,622 87.4%
Hispanic or Latino (of anyrace)
123 6.6%
Black or African Americanalone
36 1.9%
American Indian and AlaskaNative alone
3 0.2%
Asian alone 39 2.1%
Native Hawaiian and OtherPacific Islander Alone
1 0.1%
Some other race alone 4 0.2%
Two or more races 28 1.5%US Census Bureau 2010 Census
Table 26: Hidden Hills Race Composition
Languages Spoken at Home
Subject Total EstimateSpeak English "very
well" Estimate
Speak English lessthan "very well"
EstimatePopulation 5 years and over 2,437 96.7% 3.3%Speak only English 87.8% (X) (X)
Speak a language other than English 12.2 73.2% 26.8%Spanish or Spanish Creole 4.8% 76.1% 23.9%Other Indo-European languages 5.9% 64.1% 35.9%Asian and Pacific Island languages 0.5% 100.0% 0.0%Other languages 1.0% 100.0% 0.0%
Table 27: Hidden Hills Languages Spoken at Home
Figure 28: Hidden Hills Race Distribution Figure 29: Hidden Hills Languages Spoken at Home
White Alone87.4%
Hispanic orLatino (of any
race)6.6%
Black or AfricanAmerican alone
1.9%
American Indianand Alaska
Native alone0.2%
Asian alone2.1%
Native Hawaiianand Other
Pacific IslanderAlone0.1%
Some other racealone0.2%
Two or moreraces1.5%
Hidden Hills Race Distribution
Speak onlyEnglish87.8%
Spanish orSpanish Creole
4.8%
Other Indo-Europeanlanguages
5.9%
Asian andPacific Island
languages0.5%
Other languages1.0%
Hidden Hills Language Spoken atHome
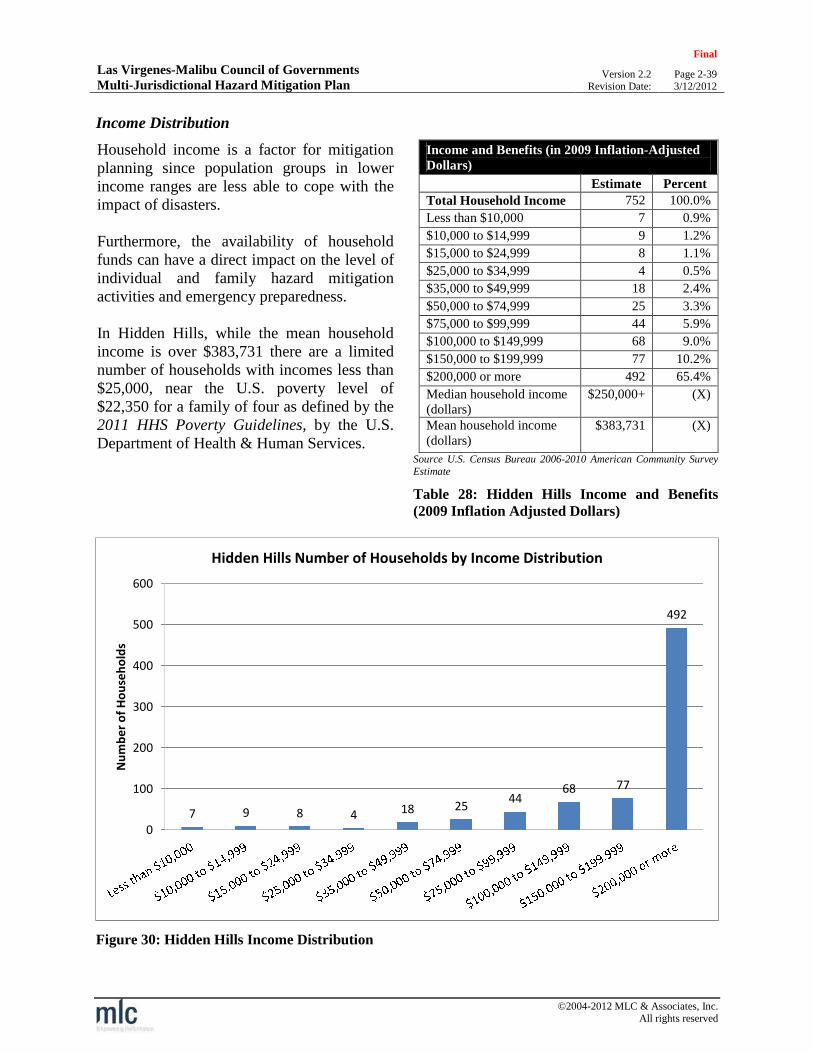
Las Virgenes-Malibu Council of GovernmentsMulti-Jurisdictional Hazard Mitigation Plan
Final
Version 2.2 Page 2-39Revision Date: 3/12/2012
©2004-2012 MLC & Associates, Inc.All rights reserved
Income Distribution
Household income is a factor for mitigationplanning since population groups in lowerincome ranges are less able to cope with theimpact of disasters.
Furthermore, the availability of householdfunds can have a direct impact on the level ofindividual and family hazard mitigationactivities and emergency preparedness.
In Hidden Hills, while the mean householdincome is over $383,731 there are a limitednumber of households with incomes less than$25,000, near the U.S. poverty level of$22,350 for a family of four as defined by the2011 HHS Poverty Guidelines, by the U.S.Department of Health & Human Services.
Income and Benefits (in 2009 Inflation-AdjustedDollars)
Estimate Percent
Total Household Income 752 100.0%
Less than $10,000 7 0.9%
$10,000 to $14,999 9 1.2%
$15,000 to $24,999 8 1.1%
$25,000 to $34,999 4 0.5%
$35,000 to $49,999 18 2.4%
$50,000 to $74,999 25 3.3%
$75,000 to $99,999 44 5.9%
$100,000 to $149,999 68 9.0%
$150,000 to $199,999 77 10.2%
$200,000 or more 492 65.4%
Median household income(dollars)
$250,000+ (X)
Mean household income(dollars)
$383,731 (X)
Source U.S. Census Bureau 2006-2010 American Community SurveyEstimate
Table 28: Hidden Hills Income and Benefits(2009 Inflation Adjusted Dollars)
Figure 30: Hidden Hills Income Distribution
7 9 8 4 18 2544
68 77
492
0
100
200
300
400
500
600
Nu
mb
er
of
Ho
use
ho
lds
Hidden Hills Number of Households by Income Distribution
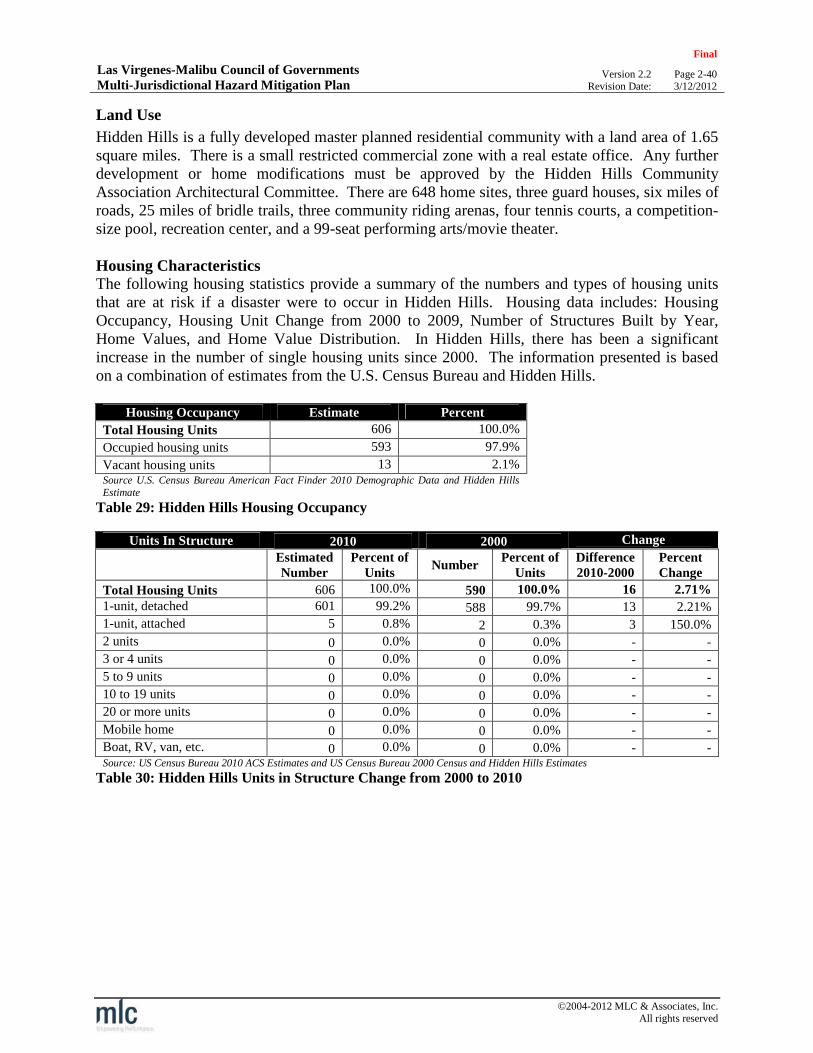
Las Virgenes-Malibu Council of GovernmentsMulti-Jurisdictional Hazard Mitigation Plan
Final
Version 2.2 Page 2-40Revision Date: 3/12/2012
©2004-2012 MLC & Associates, Inc.All rights reserved
Land Use
Hidden Hills is a fully developed master planned residential community with a land area of 1.65square miles. There is a small restricted commercial zone with a real estate office. Any furtherdevelopment or home modifications must be approved by the Hidden Hills CommunityAssociation Architectural Committee. There are 648 home sites, three guard houses, six miles ofroads, 25 miles of bridle trails, three community riding arenas, four tennis courts, a competition-size pool, recreation center, and a 99-seat performing arts/movie theater.
Housing CharacteristicsThe following housing statistics provide a summary of the numbers and types of housing unitsthat are at risk if a disaster were to occur in Hidden Hills. Housing data includes: HousingOccupancy, Housing Unit Change from 2000 to 2009, Number of Structures Built by Year,Home Values, and Home Value Distribution. In Hidden Hills, there has been a significantincrease in the number of single housing units since 2000. The information presented is basedon a combination of estimates from the U.S. Census Bureau and Hidden Hills.
Housing Occupancy Estimate Percent
Total Housing Units 606 100.0%
Occupied housing units 593 97.9%
Vacant housing units 13 2.1%Source U.S. Census Bureau American Fact Finder 2010 Demographic Data and Hidden HillsEstimate
Table 29: Hidden Hills Housing Occupancy
Units In Structure 2010 2000 Change
EstimatedNumber
Percent ofUnits
NumberPercent of
UnitsDifference2010-2000
PercentChange
Total Housing Units 606 100.0% 590 100.0% 16 2.71%1-unit, detached 601 99.2% 588 99.7% 13 2.21%
1-unit, attached 5 0.8% 2 0.3% 3 150.0%
2 units 0 0.0% 0 0.0% - -
3 or 4 units 0 0.0% 0 0.0% - -
5 to 9 units 0 0.0% 0 0.0% - -
10 to 19 units 0 0.0% 0 0.0% - -
20 or more units 0 0.0% 0 0.0% - -
Mobile home 0 0.0% 0 0.0% - -
Boat, RV, van, etc. 0 0.0% 0 0.0% - -Source: US Census Bureau 2010 ACS Estimates and US Census Bureau 2000 Census and Hidden Hills Estimates
Table 30: Hidden Hills Units in Structure Change from 2000 to 2010

Las Virgenes-Malibu Council of GovernmentsMulti-Jurisdictional Hazard Mitigation Plan
Final
Version 2.2 Page 2-41Revision Date: 3/12/2012
©2004-2012 MLC & Associates, Inc.All rights reserved
In terms of risk and disaster mitigation,older structures that have not beenretrofitted or otherwise improved may bemore susceptible to damage or destructiondue to age and the fact that older buildingcodes were less stringent than thoserequired for newer structures. As a resultthe inventory of older structures is aconsideration when developing mitigationplans. In Hidden Hills more than half ofstructures were built prior to 1980.
Year Structure Built Estimate Percent
Total housing units 606 100.0%
Built 2005 or later 12 1.5%
Built 2000 to 2004 32 4.5%
Built 1990 to 1999 131 19.3%
Built 1980 to 1989 73 16.1%
Built 1970 to 1979 71 9.4%
Built 1960 to 1969 111 15.9%
Built 1950 to 1959 168 30.7%
Built 1940 to 1949 6 0.9%
Built 1939 or earlier 2 1.7%Source: U.S. Census Bureau 2006-2010 American Community Surveyand 2009 American Community Survey 5-Year Estimate, and HiddenHills Estimates
Table 31: Year Structures Built in Hidden Hills
Figure 31: Hidden Hills Number of Structures Built by Year
0
20
40
60
80
100
120
140
160
180
Nu
mb
er
of
Stru
ctu
res
Hidden Hills Number of Structures Built by Year
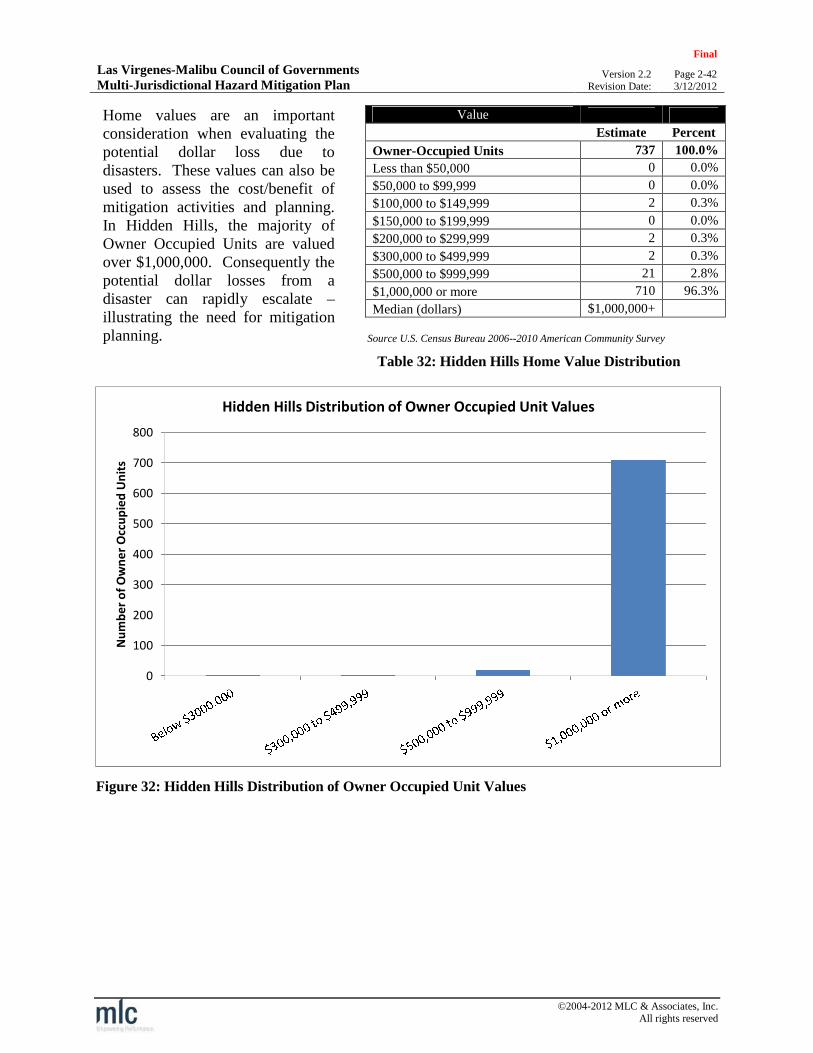
Las Virgenes-Malibu Council of GovernmentsMulti-Jurisdictional Hazard Mitigation Plan
Final
Version 2.2 Page 2-42Revision Date: 3/12/2012
©2004-2012 MLC & Associates, Inc.All rights reserved
Home values are an importantconsideration when evaluating thepotential dollar loss due todisasters. These values can also beused to assess the cost/benefit ofmitigation activities and planning.In Hidden Hills, the majority ofOwner Occupied Units are valuedover $1,000,000. Consequently thepotential dollar losses from adisaster can rapidly escalate –illustrating the need for mitigationplanning.
Value
Estimate Percent
Owner-Occupied Units 737 100.0%
Less than $50,000 0 0.0%
$50,000 to $99,999 0 0.0%
$100,000 to $149,999 2 0.3%
$150,000 to $199,999 0 0.0%
$200,000 to $299,999 2 0.3%
$300,000 to $499,999 2 0.3%
$500,000 to $999,999 21 2.8%
$1,000,000 or more 710 96.3%
Median (dollars) $1,000,000+
Source U.S. Census Bureau 2006--2010 American Community Survey
Table 32: Hidden Hills Home Value Distribution
Figure 32: Hidden Hills Distribution of Owner Occupied Unit Values
0
100
200
300
400
500
600
700
800
Nu
mb
er
of
Ow
ne
rO
ccu
pie
dU
nit
s
Hidden Hills Distribution of Owner Occupied Unit Values

Las Virgenes-Malibu Council of GovernmentsMulti-Jurisdictional Hazard Mitigation Plan
Final
Version 2.2 Page 2-43Revision Date: 3/12/2012
©2004-2012 MLC & Associates, Inc.All rights reserved
Emergency Preparedness
The City of Hidden Hills is a general law municipality operating on a contract basis for lawenforcement, building and safety, planning and engineering, as well as legal counsel. The City'sfire and emergency medical services are provided through the Consolidated Fire ProtectionDistrict of Los Angeles County.
Emergency Operations Center
The City of Hidden Hills has a fully equipped Emergency Operations Center (EOC) located atCity Hall in the City Council Chambers. The primary Casualty Collection Point is located atRound Meadow Elementary School.
Public Safety Commission
The City of Hidden Hills Public Safety Commission consists of five members appointed by theMayor and subject to the approval of City Council. The Commission advises City Council onthe health and safety needs of the public within the City, and makes recommendations to CityCouncil for the enactment of legislation or procedures to maintain and improve the welfare andsafety of the public. The Commission acts as a liaison to certain County departments such asthe Sheriff’s Department, the Department of Health Services, the Department of AnimalControl, the Fire Department, and the City's Building and Safety Department. Additionalresponsibilities include interfacing with private organizations and utilities within the City thatprovide services which relate to the responsibilities of the Commission and affect City policies.Commissioners also serve on the Disaster Council which provides an overview of theEmergency Operations Plan (EOP). They also review and conduct studies on issues of publicsafety, administer public education programs, and staff and operate the Emergency OperationsCenter for the City.
Office of Emergency Services
The Hidden Hills Office of Emergency Services (OES) is responsible for the development ofthe City's Emergency Operations Plan, which provides for the effective mobilization of all theCity’s resources, both public and private, to meet any condition constituting a local emergency,state of emergency or state of war emergency.
OES consists of all officers and employees of the City, Public Safety Commissioners, volunteerforces enrolled to aid during an emergency, and all groups, organizations and persons who may,by agreement or operations of law, including persons impressed into service, be charged withduties incident to the protection of life and property in the City during an emergency.
OES provides a liaison to Round Meadow Elementary School. This liaison is a member of theschool's Disaster Preparedness Committee.

Las Virgenes-Malibu Council of GovernmentsMulti-Jurisdictional Hazard Mitigation Plan
Final
Version 2.2 Page 2-44Revision Date: 3/12/2012
©2004-2012 MLC & Associates, Inc.All rights reserved
Hidden Hills Community Association (HHCA) - Equestrian Services Committee
This Committee is responsible for coordinating the evacuation of horses and other livestock inthe community during emergency or disaster situations.
Community Emergency Response Team (CERT)
The Community Emergency Response Team is a group of volunteers who have been certified asemergency response personnel. Volunteers receive training under a nationally recognizedprogram for emergency and disaster response. CERT members have also received additionaltraining to aid in preliminary damage assessment. To facilitate coordination of emergencyresponse efforts, the City has been divided into seven (7) geographic regions.
Emergency Medical Response
An Emergency Medical Response trailer is equipped to aid in providing services to 350 - 400victims. Storage is also provided for medical supplies and search and rescue equipment.
Communication Systems
The City has assigned Amateur Radio frequency and maintains a repeater, several base stationspositioned throughout the City, and handheld radios distributed for use throughout the city, aswell as at the EOC. In addition, the City has several licensed HAM operators. The City canmaintain contact with Round Meadow Elementary School and the Hidden Hills CommunityAssociation in emergencies.
Cable TV Channel 3 is used as a community notification and bulletin board. Throughout theyear the station is used to show videos related to emergency and disaster preparedness.Additionally, in the event of an emergency, emergency messaging can be broadcast on Channel3.
The City of Hidden Hills implemented the Blackboard Connect® service allowing authorizedcivic leaders to create and rapidly disseminate emergency messages to every telephone numberstored in the notification database.
Hidden Hills uses an E-mail notification system that immediately provides importantinformation to residents who have voluntarily joined the program. This system is also used tocirculate public service announcements, such as reminding seniors to check alternate electricalpower sources in the event of an electric shutdown.
Finally, the City of Hidden Hills circulates a monthly newsletter. The newsletter providesgeneral bulletins as well as emergency preparedness recommendations and information.

Las Virgenes-Malibu Council of GovernmentsMulti-Jurisdictional Hazard Mitigation Plan
Final
Version 2.2 Page 2-45Revision Date: 3/12/2012
©2004-2012 MLC & Associates, Inc.All rights reserved
Malibu
The City of Malibu is located along the Pacific Oceannorthwest of the City of Los Angeles. Malibu is generallybounded on the north by the Santa Monica Mountains, on theeast by Topanga Canyon, on the west by Ventura County andon the south by the Pacific Ocean. Malibu was incorporatedon March 28, 1991. The City has 21 miles of coastline alongthe Pacific Ocean and has a population of 12,645 (2010 U.S.Census)
The City of Malibu is a dynamic, internationally recognized community in Northern Los AngelesCounty that offers a high quality of life for its residents. Celebrated for its natural beauty andunique coastal resources, the City is also renowned for its leadership in environmentalstewardship, excellent schools and political activism. Malibu has seven miles of public beaches,canyons and watershed along its 21 miles of coastline and provides numerous opportunities forrecreation and outdoor activities.
Brief History
The Malibu area was settled in the 1890s by the Rindge Family, which owned the RanchoTopanga Malibu Sequit, a large ranch. Its remote location between the ocean and the mountainsled to its small-town, rural residential community development pattern. Malibu has remained aprimarily residential community. Commercial areas are limited to small neighborhood-servingand visitor-serving uses interspersed throughout the City, but located primarily in the Las Flores,Civic Center, Point Dume and Trancas areas.
Climate/Topography
Malibu has a unique climate due to its location, which is wedged between the Santa MonicaMountains and the Pacific Ocean. Temperatures range from the low 50s to the mid-60s duringthe winter months and from the low 60s to mid-70s in the summer months. Average rainfall forthe area is 13 inches per year, with the winter months characterized as wetter than summermonths.
The geography of Malibu includes a wide variety of terrain changes including mesas, canyonsand rugged cliffs facing sandy beaches. The landscape ranges from lush greenery with exoticplants to natural habitats consisting of endemic chaparral, scrub grasses, riparian woodlands, andwetlands. Malibu lies on the fringe of the Santa Monica Mountains, which is an extensivechaparral wilderness area. The City has three large deep gorges and canyons with extensivevegetation growth due to its many streams and creeks.
General CoordinatesLatitude 34° 2’ 16” NorthLongitude 118° 41’ 34” West

Las Virgenes-Malibu Council of GovernmentsMulti-Jurisdictional Hazard Mitigation Plan
Final
Version 2.2 Page 2-46Revision Date: 3/12/2012
©2004-2012 MLC & Associates, Inc.All rights reserved
Map 10: Malibu Location Map
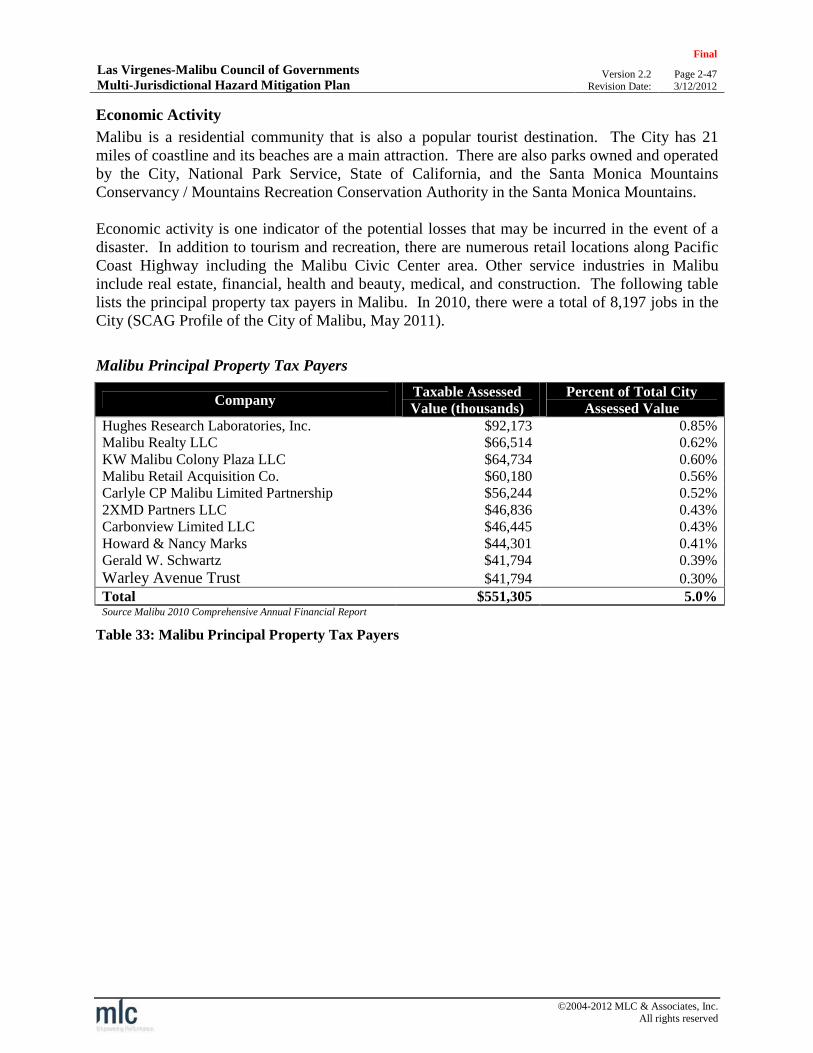
Las Virgenes-Malibu Council of GovernmentsMulti-Jurisdictional Hazard Mitigation Plan
Final
Version 2.2 Page 2-47Revision Date: 3/12/2012
©2004-2012 MLC & Associates, Inc.All rights reserved
Economic Activity
Malibu is a residential community that is also a popular tourist destination. The City has 21miles of coastline and its beaches are a main attraction. There are also parks owned and operatedby the City, National Park Service, State of California, and the Santa Monica MountainsConservancy / Mountains Recreation Conservation Authority in the Santa Monica Mountains.
Economic activity is one indicator of the potential losses that may be incurred in the event of adisaster. In addition to tourism and recreation, there are numerous retail locations along PacificCoast Highway including the Malibu Civic Center area. Other service industries in Malibuinclude real estate, financial, health and beauty, medical, and construction. The following tablelists the principal property tax payers in Malibu. In 2010, there were a total of 8,197 jobs in theCity (SCAG Profile of the City of Malibu, May 2011).
Malibu Principal Property Tax Payers
CompanyTaxable AssessedValue (thousands)
Percent of Total CityAssessed Value
Hughes Research Laboratories, Inc. $92,173 0.85%Malibu Realty LLC $66,514 0.62%KW Malibu Colony Plaza LLC $64,734 0.60%Malibu Retail Acquisition Co. $60,180 0.56%Carlyle CP Malibu Limited Partnership $56,244 0.52%2XMD Partners LLC $46,836 0.43%Carbonview Limited LLC $46,445 0.43%Howard & Nancy Marks $44,301 0.41%Gerald W. Schwartz $41,794 0.39%Warley Avenue Trust $41,794 0.30%Total $551,305 5.0%Source Malibu 2010 Comprehensive Annual Financial Report
Table 33: Malibu Principal Property Tax Payers
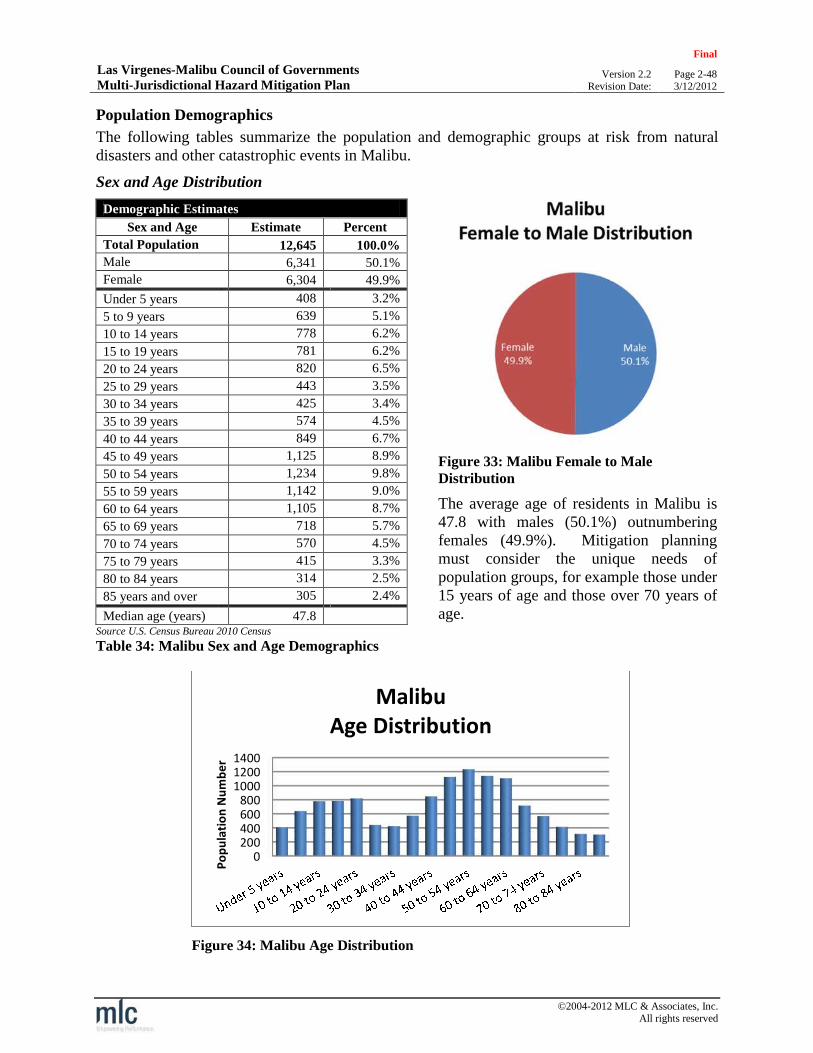
Las Virgenes-Malibu Council of GovernmentsMulti-Jurisdictional Hazard Mitigation Plan
Final
Version 2.2 Page 2-48Revision Date: 3/12/2012
©2004-2012 MLC & Associates, Inc.All rights reserved
Population Demographics
The following tables summarize the population and demographic groups at risk from naturaldisasters and other catastrophic events in Malibu.
Sex and Age Distribution
Demographic Estimates
Figure 33: Malibu Female to MaleDistribution
The average age of residents in Malibu is47.8 with males (50.1%) outnumberingfemales (49.9%). Mitigation planningmust consider the unique needs ofpopulation groups, for example those under15 years of age and those over 70 years ofage.
Sex and Age Estimate Percent
Total Population 12,645 100.0%Male 6,341 50.1%
Female 6,304 49.9%
Under 5 years 408 3.2%
5 to 9 years 639 5.1%
10 to 14 years 778 6.2%
15 to 19 years 781 6.2%
20 to 24 years 820 6.5%
25 to 29 years 443 3.5%
30 to 34 years 425 3.4%
35 to 39 years 574 4.5%
40 to 44 years 849 6.7%
45 to 49 years 1,125 8.9%
50 to 54 years 1,234 9.8%
55 to 59 years 1,142 9.0%
60 to 64 years 1,105 8.7%
65 to 69 years 718 5.7%
70 to 74 years 570 4.5%
75 to 79 years 415 3.3%
80 to 84 years 314 2.5%
85 years and over 305 2.4%
Median age (years) 47.8Source U.S. Census Bureau 2010 Census
Table 34: Malibu Sex and Age Demographics
Figure 34: Malibu Age Distribution
0200400600800
100012001400
Po
pu
lati
on
Nu
mb
er
MalibuAge Distribution
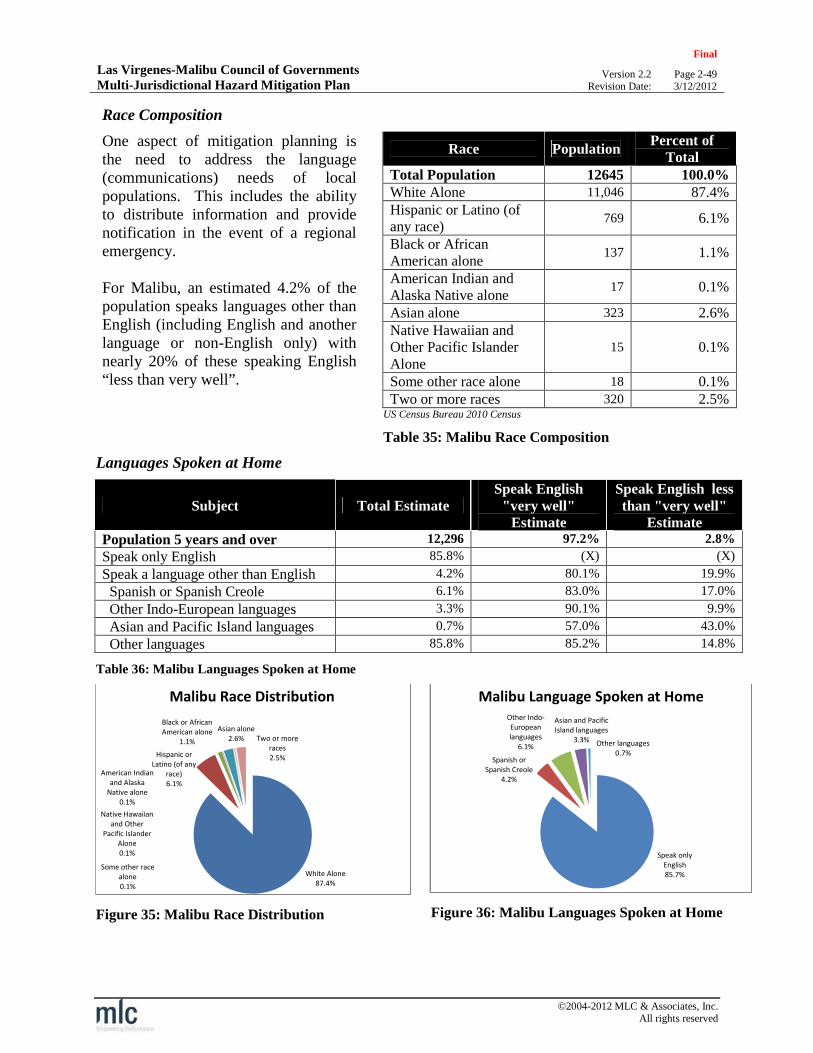
Las Virgenes-Malibu Council of GovernmentsMulti-Jurisdictional Hazard Mitigation Plan
Final
Version 2.2 Page 2-49Revision Date: 3/12/2012
©2004-2012 MLC & Associates, Inc.All rights reserved
Race Composition
One aspect of mitigation planning isthe need to address the language(communications) needs of localpopulations. This includes the abilityto distribute information and providenotification in the event of a regionalemergency.
For Malibu, an estimated 4.2% of thepopulation speaks languages other thanEnglish (including English and anotherlanguage or non-English only) withnearly 20% of these speaking English“less than very well”.
Race PopulationPercent of
TotalTotal Population 12645 100.0%White Alone 11,046 87.4%Hispanic or Latino (ofany race)
769 6.1%
Black or AfricanAmerican alone
137 1.1%
American Indian andAlaska Native alone
17 0.1%
Asian alone 323 2.6%Native Hawaiian andOther Pacific IslanderAlone
15 0.1%
Some other race alone 18 0.1%Two or more races 320 2.5%
US Census Bureau 2010 Census
Table 35: Malibu Race Composition
Languages Spoken at Home
Subject Total EstimateSpeak English
"very well"Estimate
Speak English lessthan "very well"
EstimatePopulation 5 years and over 12,296 97.2% 2.8%
Speak only English 85.8% (X) (X)
Speak a language other than English 4.2% 80.1% 19.9%
Spanish or Spanish Creole 6.1% 83.0% 17.0%
Other Indo-European languages 3.3% 90.1% 9.9%
Asian and Pacific Island languages 0.7% 57.0% 43.0%
Other languages 85.8% 85.2% 14.8%
Table 36: Malibu Languages Spoken at Home
Figure 35: Malibu Race Distribution Figure 36: Malibu Languages Spoken at Home
White Alone87.4%
Hispanic orLatino (of any
race)6.1%
Black or AfricanAmerican alone
1.1%
American Indianand Alaska
Native alone0.1%
Asian alone2.6%
Native Hawaiianand Other
Pacific IslanderAlone0.1%
Some other racealone0.1%
Two or moreraces2.5%
Malibu Race Distribution
Speak onlyEnglish85.7%
Spanish orSpanish Creole
4.2%
Other Indo-Europeanlanguages
6.1%
Asian and PacificIsland languages
3.3% Other languages0.7%
Malibu Language Spoken at Home

Las Virgenes-Malibu Council of GovernmentsMulti-Jurisdictional Hazard Mitigation Plan
Final
Version 2.2 Page 2-50Revision Date: 3/12/2012
©2004-2012 MLC & Associates, Inc.All rights reserved
Income Distribution
Household income is a factor for mitigationplanning since population groups in lowerincome ranges are less able to cope with theimpact of disasters.
Furthermore, the availability of householdfunds can have a direct impact on the level ofindividual and family hazard mitigationactivities and emergency preparedness.
While the mean household income in Malibuis over $236,370, there are a limited numberof households in Malibu with incomes lessthan $25,000, near the U.S. poverty level of$22,350 for a family of four as defined by the2011 HHS Poverty Guidelines, by the U.S.Department of Health & Human Services.
Income and Benefits (in 2009 Inflation-AdjustedDollars)
Estimate Percent
Total Household Income 4,673 100.0%
Less than $10,000 128 2.7%
$10,000 to $14,999 128 2.7%
$15,000 to $24,999 278 5.9%
$25,000 to $34,999 301 6.4%
$35,000 to $49,999 202 4.3%
$50,000 to $74,999 448 9.6%
$75,000 to $99,999 355 7.6%
$100,000 to $149,999 814 17.4%
$150,000 to $199,999 472 10.1%
$200,000 or more 1,547 33.1%
Median household income(dollars)
125,202 (X)
Mean household income(dollars)
236,370 (X)
Source U.S. Census Bureau 2006-2010 American Community SurveyEstimate
Table 37: Malibu Income and Benefits (2009Inflation Adjusted Dollars)
Figure 37: Malibu Income Distribution
128 128
278 301202
448355
814
472
1,547
0
200
400
600
800
1000
1200
1400
1600
1800
Nu
mb
er
of
Ho
use
ho
lds
Malibu Number of Households by Income Distribution

Las Virgenes-Malibu Council of GovernmentsMulti-Jurisdictional Hazard Mitigation Plan
Final
Version 2.2 Page 2-51Revision Date: 3/12/2012
©2004-2012 MLC & Associates, Inc.All rights reserved
Land Use
Malibu is a beachfront community with the majority of residents living along Pacific CoastHighway (PCH) or in small residential communities that gain primary access from PCH.Designated as State Route 1, PCH is the major four lane arterial roadway traversing the Cityfrom east to west. PCH is a major transportation corridor with thousands of daily commuters.Beach traffic substantially increases congestion along PCH during the summer months.
The Santa Monica Mountains serve as a natural boundary to the north. A number of residencesare interspersed throughout the Santa Monica Mountains along canyons and hillsides within amile or more inland. Furthermore, the City has experienced a great deal of ‘in-fill’ development,which has increased the population density, creating greater service loads on the existinginfrastructure including roads, water supplies, sewer services and storm drains. In-filldevelopment is defined as development of vacant or partially developed parcels which aresurrounded by or in close proximity to areas that are substantially or fully developed.
Housing CharacteristicsThe following housing statistics provide a summary of the numbers and types of housing unitsthat are at risk if a natural disaster or other catastrophic event were to occur in Malibu. Housingdata includes: Housing Occupancy, Housing Unit Change from 2000 to 2009, Number ofStructures Built by Year, Home Values, and Home Value Distribution. For Malibu, the numberof multi-unit structures has increased while the number of single structures has decreased since2000.
Housing Occupancy Estimate Percent
Total Housing Units 6,252 100.0%
Occupied housing units 4,673 74.7%
Vacant housing units 1,579 25.3%
Source U.S. Census Bureau 2006-2010 American Community Survey
Table 38: Malibu Housing Occupancy
Units In Structure 2010 2000 Change
EstimatedNumber
Percent ofUnits
NumberPercent of
UnitsDifference2010-2000
PercentChange
Total Housing Units 6,252 100.0% 6,955 100% (703) -10.1%
1-unit, detached 4,351 69.6% 5,191 74.6% (840) -16.2%
1-unit, attached 491 7.9% 974 14.0% (483) -49.6%
2 units 47 0.7% 7 0.1% 40 571.4%
3 or 4 units 177 2.8% 168 2.4% 9 5.4%
5 to 9 units 145 2.3% 126 1.8% 19 15.1%
10 to 19 units 193 3.1% 140 2.0% 53 37.9%
20 or more units 355 5.7% 349 5.0% 6 1.7%
Mobile home 493 7.9% 0 0.0% 493 N/A
Boat, RV, van, etc. 0 0.00% 0 0.0% - 0.0%Source: US Census Bureau 2006 - 2010 ACS and US Census Bureau 2000 Census
Table 39: Malibu Units in Structure Change from 2000 to 2010

Las Virgenes-Malibu Council of GovernmentsMulti-Jurisdictional Hazard Mitigation Plan
Final
Version 2.2 Page 2-52Revision Date: 3/12/2012
©2004-2012 MLC & Associates, Inc.All rights reserved
In terms of risk and disaster mitigation, olderstructures that have not been retrofitted orotherwise improved may be more susceptibleto damage or destruction due to age and thefact that older building codes were lessstringent than those required for newerstructures. As a result, the inventory of olderstructures is a consideration when developingmitigation plans.
In Malibu, 84.4% of structures (5,276) werebuilt prior to 1990 and 68.5% (4,283) before1980.
Year Structure Built Estimate Percent
Total housing units 6,252 100.0%
Built 2005 or later 138 2.2%
Built 2000 to 2004 271 4.3%
Built 1990 to 1999 567 9.1%
Built 1980 to 1989 993 15.9%
Built 1970 to 1979 1,498 24.0%
Built 1960 to 1969 1,207 19.3%
Built 1950 to 1959 868 13.9%
Built 1940 to 1949 435 7.0%
Built 1939 or earlier 275 4.4%
Source: U.S. Census Bureau 2006-2010 American Community Survey
Table 40: Year Structures Built in Malibu
Figure 38: Malibu Number of Structures Built by Year
0
200
400
600
800
1000
1200
1400
1600
Nu
mb
er
of
Stru
ctu
res
Malibu Number of Structures Built by Year
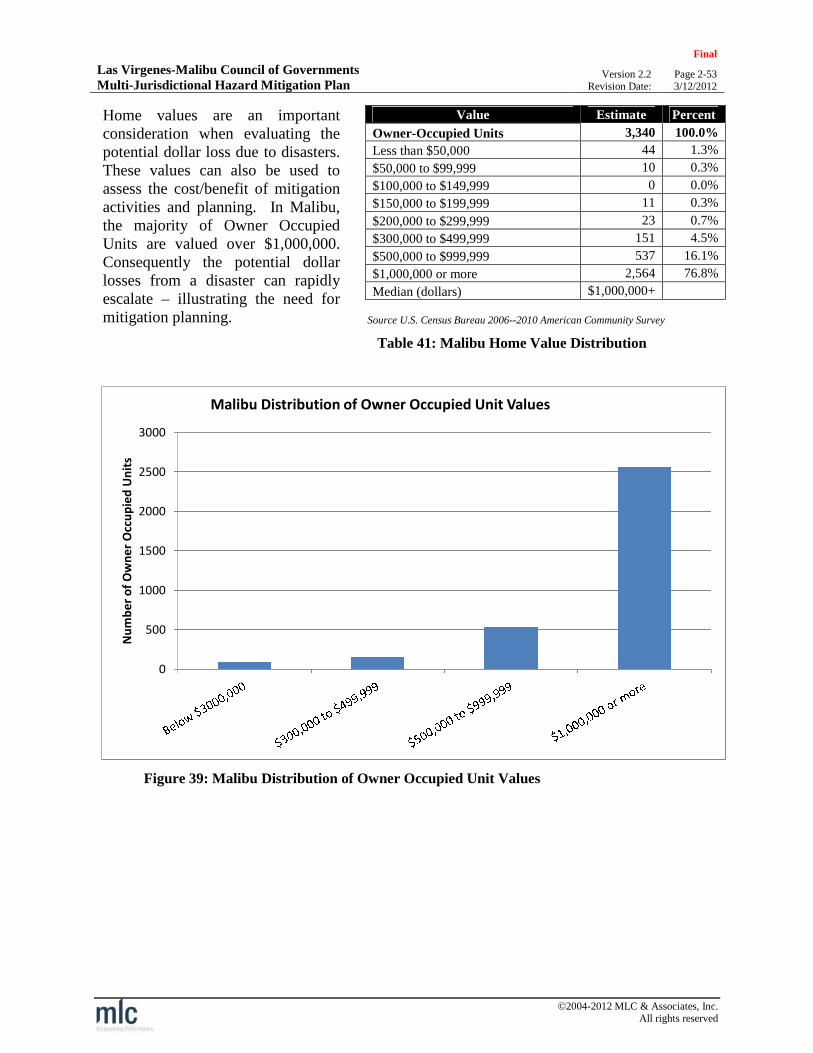
Las Virgenes-Malibu Council of GovernmentsMulti-Jurisdictional Hazard Mitigation Plan
Final
Version 2.2 Page 2-53Revision Date: 3/12/2012
©2004-2012 MLC & Associates, Inc.All rights reserved
Home values are an importantconsideration when evaluating thepotential dollar loss due to disasters.These values can also be used toassess the cost/benefit of mitigationactivities and planning. In Malibu,the majority of Owner OccupiedUnits are valued over $1,000,000.Consequently the potential dollarlosses from a disaster can rapidlyescalate – illustrating the need formitigation planning.
Value Estimate Percent
Owner-Occupied Units 3,340 100.0%
Less than $50,000 44 1.3%
$50,000 to $99,999 10 0.3%
$100,000 to $149,999 0 0.0%
$150,000 to $199,999 11 0.3%
$200,000 to $299,999 23 0.7%
$300,000 to $499,999 151 4.5%
$500,000 to $999,999 537 16.1%
$1,000,000 or more 2,564 76.8%
Median (dollars) $1,000,000+
Source U.S. Census Bureau 2006--2010 American Community Survey
Table 41: Malibu Home Value Distribution
Figure 39: Malibu Distribution of Owner Occupied Unit Values
0
500
1000
1500
2000
2500
3000
Nu
mb
er
of
Ow
ne
rO
ccu
pie
dU
nit
s
Malibu Distribution of Owner Occupied Unit Values
Las Virgenes-Malibu Council of GovernmentsMulti-Jurisdictional Hazard Mitigation Plan
Final
Version 2.2 Page 2-54Revision Date: 3/12/2012
©2004-2012 MLC & Associates, Inc.All rights reserved
Emergency Preparedness
The potential impacts of natural hazards associated with Malibu’s unique terrain makes itsenvironment and population vulnerable to natural disasters. Earthquakes, landslides, winterstorms and floods can take their toll on Malibu. However, the most dangerous and perennial ofhazards is wildfire. Driven by the dry Santa Ana winds in the summer months, wind speeds canreach up to 70 mph. As a result, small spot fires can quickly explode into huge firestormscapable of consuming entire communities.
Emergency Preparedness Program
In response to the numerous floods, fires, and storms experienced during the first decade ofincorporation, between 1991 and 2001, the City created an Emergency Preparedness Program totrain personnel and to develop an emergency response protocol in preparation for futuredisasters.
Services conducted under the Emergency Preparedness program include an annual trainingexercise to familiarize staff and volunteers with the functions of the Malibu EmergencyOperations Center (EOC) and their individual roles under various potential disaster scenarios.Under this program, the City has also implemented an emergency decal program for residents,designed to facilitate community access in the event of major road closures.
City of Malibu’s Highway Advisory Radio System (HARS)
The City of Malibu is licensed by the FCC to operate a Highway Advisory Radio System(HARS) along the Pacific Coast Highway (PCH) in Malibu. The system provides a continuousradio broadcast which can be received on 1620 AM along the coastline and the Pacific CoastHighway. The intention of the system is to provide advisories of traffic conditions or otheremergencies that may affect travelers along the PCH. In addition to emergency and road alerts,the system may be used to provide information on other public-safety related resources orincidents. The system is programmed by the City’s Emergency Services Coordinator.
Through the Community TV program, the City of Malibu maintains Channel 3 as a Governmentaccess channel to bring the most current community information to local cable subscribers.Cablecasts include live City Council and Planning Commission meetings, as well as tapedcoverage of community events.

Las Virgenes-Malibu Council of GovernmentsMulti-Jurisdictional Hazard Mitigation Plan
Final
Version 2.2 Page 2-55Revision Date: 3/12/2012
©2004-2012 MLC & Associates, Inc.All rights reserved
Public Involvement Groups
The City has over 60 homeowners associations that are very active in public services. In fact,residents sometimes hold Community Emergency Response Team (CERT) training meetings intheir homes.
In addition, the City sponsors the Malibu Volunteer Patrol (MVP), a group of residents trained toassist law enforcement personnel. The volunteers work various assignments including patrollingthe community, assisting with dissemination of information to the community and providingcommunity services. The involvement of members of the community working alongsideSheriff’s Department personnel improves the communication and understanding between the twogroups.
The City participates in the Community Emergency Response Team Program (CERT). Underthe CERT Program, volunteers are provided with a FEMA-approved 20 hour program thatinvolves communication with authorities in the event of a large scale emergency. The systemappoints neighborhood block captains and sector leaders who utilize radio communicationssystems to communicate with the City. The City holds CERT trainings four times per year.

Las Virgenes-Malibu Council of GovernmentsMulti-Jurisdictional Hazard Mitigation Plan
Final
Version 2.2 Page 2-56Revision Date: 3/12/2012
©2004-2012 MLC & Associates, Inc.All rights reserved
Westlake Village
Westlake Village is a master-planned community located on thewestern edge of Los Angeles County in the Conejo Valley. Itborders the City of Thousand Oaks and Ventura County to the westand the Santa Monica Mountains to the south. It is 40 miles westof downtown Los Angeles along the US Highway 101 corridor.With a total land area of 5.62 square miles, the communitysupports a population of approximately 8,270. Westlake Village iscomprised of a mixture of residential and commercial areas withapproximately 850 business and light industrial firms.
Brief History
The City of Westlake Village is located on a portion of the former Albertson Ranch, whosecattle-grazing operation on the land ended in the mid-1960’s when construction of WestlakeVillage commenced. The ranch was a portion of the former El Conejo land grant, the originalboundary lines that form the City’s southern and eastern limits today. In 1966 the AmericanHawaiian Steamship Company developed Westlake Village as a master-planned community.Responsibilities subsequently passed to the Prudential Insurance Company.
The original community straddled the Los Angeles-Ventura County line. The Ventura portionwas incorporated as part of the City of Thousand Oaks in 1968. However, the build-out of thetwo halves has proceeded in a coordinated and interlinked manner, relatively indifferent to thecorporate limits which separate them.
The City of Westlake Village was incorporated on December 11, 1981, as the 82nd city in LosAngeles County. As a master-planned community, Westlake Village is characterized by itswide, tree-lined boulevards, its cohesive, yet identifiable neighborhoods with interconnectedgreenbelts, its lakeside parks and promenades, and its diverse office and commercial centers.
The City of Westlake Village is a general law municipality, operating on a contract basis inwhich many of the day-to-day services of local government are provided by public and privateagencies. The residents of Westlake Village elect a five-member City Council to oversee Cityoperations and guide future development of the community. Council members are elected toserve a four-year term. Each year the Council selects one of its members to serve as Mayor andMayor Pro Tem.
Climate/Topography
The climate in Westlake Village is characterized by mild winters with temperatures ranging fromthe low 40’s to the high 60’s, and warm summers with temperatures ranging from the low 60’s tothe high 90’s. Average annual rainfall is 14.4 inches with the greatest portion of precipitationoccurring in the winter months. The City averages 900 feet above sea level, and is framed by theSimi Hills to the north and the Santa Monica Mountains to the south.
General CoordinatesLatitude 34° 8’ 31” NorthLongitude 118° 49’ 10” West
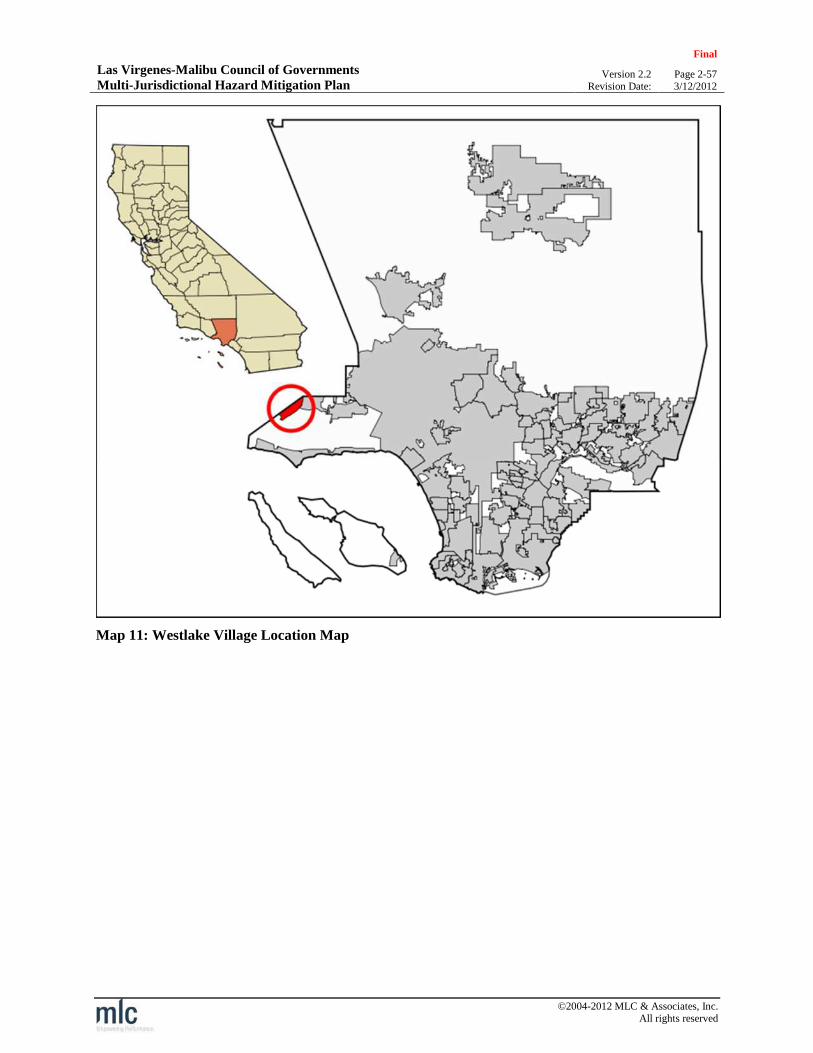
Las Virgenes-Malibu Council of GovernmentsMulti-Jurisdictional Hazard Mitigation Plan
Final
Version 2.2 Page 2-57Revision Date: 3/12/2012
©2004-2012 MLC & Associates, Inc.All rights reserved
Map 11: Westlake Village Location Map

Las Virgenes-Malibu Council of GovernmentsMulti-Jurisdictional Hazard Mitigation Plan
Final
Version 2.2 Page 2-58Revision Date: 3/12/2012
©2004-2012 MLC & Associates, Inc.All rights reserved
Economic Activity
There are approximately 850 commercial and light industrial firms within the Westlake VillageCity limits. The city is located along the “Technology Corridor” that runs along US Highway101 from Calabasas to the Oxnard plain. In addition, there are a number of business parks andthe city is home to several company headquarters including the Dole Food Company.
Westlake Village Principal Employers
Company EmployeesPercent of Total City
Employment
Bank of America 755 8.95%
Four Seasons Hotel 570 6.76%
Homestore, Inc. 450 5.33%
Guitar Center, Inc. 400 4.74%
State Farm Insurance 350 4.15%
Dole Food Co., Inc. 312 3.70%
Farmers Insurance 300 3.56%
Costco Wholesale Corp 300 3.56%
K-Swiss, Inc. 225 2.67%
Securities Security Service 250 2.96%
Total 3,912 46.37%
Total City Employment 8,436 100.00%
Source Westlake Village 2010 Comprehensive Annual Financial Report and SCAG Profile of the City of Westlake Village May 2011
Table 42: Westlake Village Principal Employers
Westlake Village Principal Property Tax Payers
CompanyTaxable Assessed
ValuePercent of Total City
Assessed ValueDole Food Company $173,545,792 5.87%
Westlake Wellbeing Properties $67,152,759 2.27%
Lindero Headquarters Company, Inc. $57,665,111 1.95%
Russell Ranch Road LLC $56,607,542 1.91%
Teachers Insurance & Annuity Associates $54,651,994 1.85%
Bank of America NA $49,330,000 1.67%
Arden Realty Limited Partnership $48,040,000 1.62%
CH Realty IV North Ranch Limited Partnership $39,223,080 1.33%
Guitar Center, Inc. $35,051,076 1.19%
First Security Bank $26,505,380 0.90%
Total $607,772,734 11.73%Total Property Tax Assessed Value $2,956,330,678Source Westlake Village 2010 Comprehensive Annual Financial Report
Table 43: Westlake Village Principal Property Tax Payers
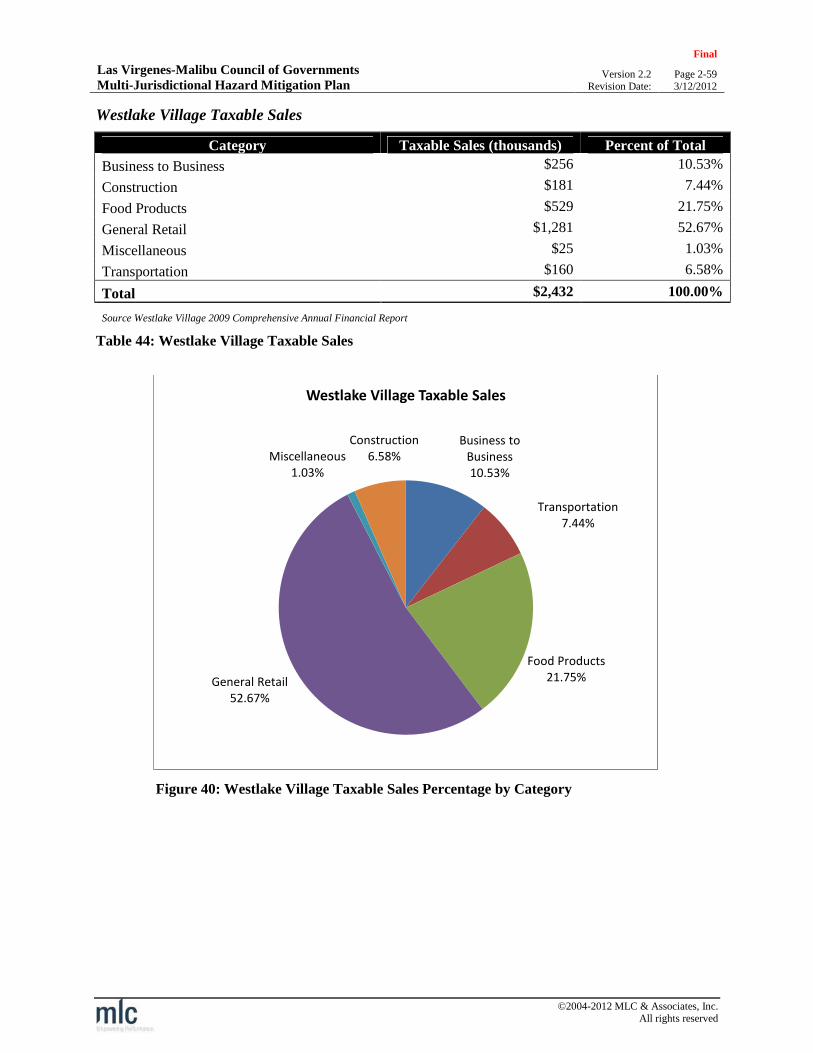
Las Virgenes-Malibu Council of GovernmentsMulti-Jurisdictional Hazard Mitigation Plan
Final
Version 2.2 Page 2-59Revision Date: 3/12/2012
©2004-2012 MLC & Associates, Inc.All rights reserved
Westlake Village Taxable Sales
Category Taxable Sales (thousands) Percent of Total
Business to Business $256 10.53%
Construction $181 7.44%
Food Products $529 21.75%
General Retail $1,281 52.67%
Miscellaneous $25 1.03%
Transportation $160 6.58%
Total $2,432 100.00%
Source Westlake Village 2009 Comprehensive Annual Financial Report
Table 44: Westlake Village Taxable Sales
Figure 40: Westlake Village Taxable Sales Percentage by Category
Business toBusiness10.53%
Transportation7.44%
Food Products21.75%General Retail
52.67%
Miscellaneous1.03%
Construction6.58%
Westlake Village Taxable Sales

Las Virgenes-Malibu Council of GovernmentsMulti-Jurisdictional Hazard Mitigation Plan
Final
Version 2.2 Page 2-60Revision Date: 3/12/2012
©2004-2012 MLC & Associates, Inc.All rights reserved
Population and Demographics
The following tables summarize the population and demographic groups at risk from a disaster inWestlake Village.
Sex and Age Distribution
Demographic Estimates
Figure 41: Westlake Village Female to MaleDistribution
The average age of residents in WestlakeVillage is 48.7 with females (51.3%)outnumbering males (48.7%). Mitigationplanning must consider the unique needs ofpopulation groups, for example those under15 years of age and those over 70 years ofage.
Sex and Age Estimate Percent
Total Population 8,270 100.0%
Male 4,025 48.7%Female 4,245 51.3%
Under 5 years 295 4.4%5 to 9 years 443 6.3%10 to 14 years 611 7.8%15 to 19 years 567 8.1%20 to 24 years 300 5.2%25 to 29 years 226 4.6%30 to 34 years 235 4.5%35 to 39 years 342 5.5%40 to 44 years 577 7.3%45 to 49 years 718 9.5%50 to 54 years 780 9.5%55 to 59 years 783 9.0%60 to 64 years 636 7.0%65 to 69 years 521 4.4%70 to 74 years 407 2.5%75 to 79 years 346 1.6%80 to 84 years 241 1.2%85 years and over 242 1.6%
Median age (years) 48.7Source U.S. Census Bureau 2010 Census
Table 45: Westlake Village Sex and Age Demographics
Figure 42: Westlake Village Age Distribution
0200400600800
Po
pu
lati
on
Nu
mb
er
Westlake VillageAge Distribution
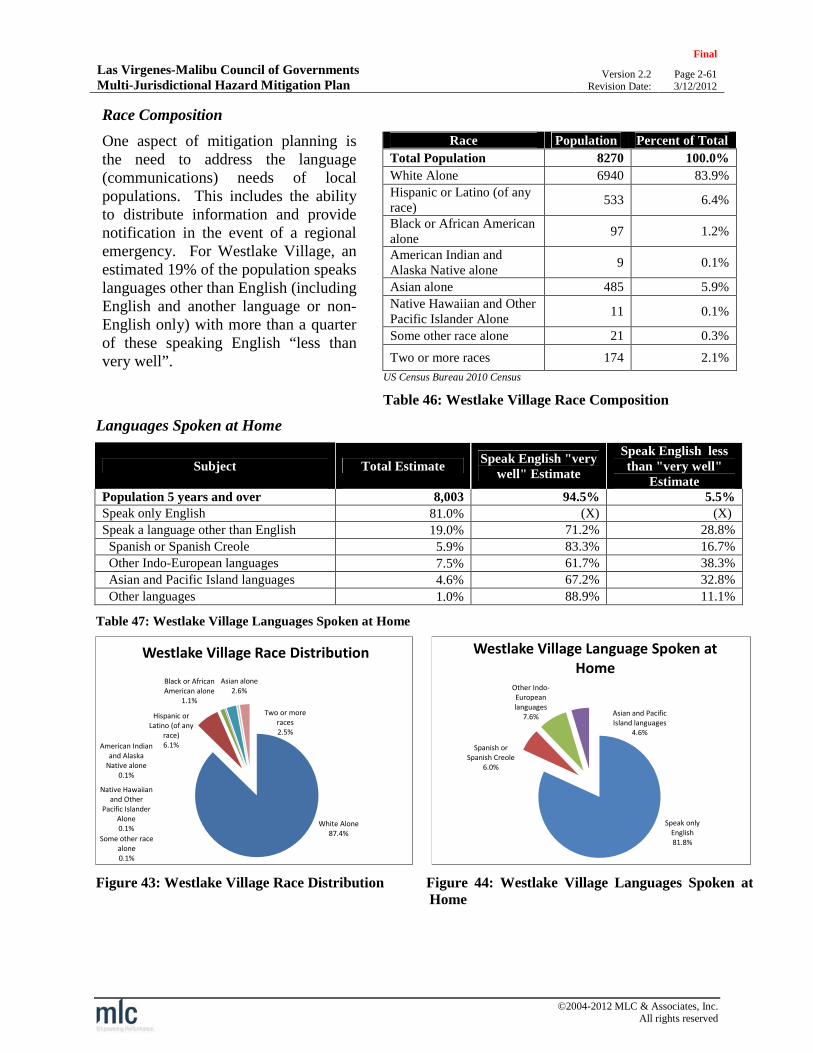
Las Virgenes-Malibu Council of GovernmentsMulti-Jurisdictional Hazard Mitigation Plan
Final
Version 2.2 Page 2-61Revision Date: 3/12/2012
©2004-2012 MLC & Associates, Inc.All rights reserved
Race Composition
One aspect of mitigation planning isthe need to address the language(communications) needs of localpopulations. This includes the abilityto distribute information and providenotification in the event of a regionalemergency. For Westlake Village, anestimated 19% of the population speakslanguages other than English (includingEnglish and another language or non-English only) with more than a quarterof these speaking English “less thanvery well”.
Race Population Percent of Total
Total Population 8270 100.0%
White Alone 6940 83.9%
Hispanic or Latino (of anyrace)
533 6.4%
Black or African Americanalone
97 1.2%
American Indian andAlaska Native alone
9 0.1%
Asian alone 485 5.9%
Native Hawaiian and OtherPacific Islander Alone
11 0.1%
Some other race alone 21 0.3%
Two or more races 174 2.1%
US Census Bureau 2010 Census
Table 46: Westlake Village Race Composition
Languages Spoken at Home
Subject Total EstimateSpeak English "very
well" Estimate
Speak English lessthan "very well"
EstimatePopulation 5 years and over 8,003 94.5% 5.5%Speak only English 81.0% (X) (X)
Speak a language other than English 19.0% 71.2% 28.8%
Spanish or Spanish Creole 5.9% 83.3% 16.7%
Other Indo-European languages 7.5% 61.7% 38.3%
Asian and Pacific Island languages 4.6% 67.2% 32.8%
Other languages 1.0% 88.9% 11.1%
Table 47: Westlake Village Languages Spoken at Home
Figure 43: Westlake Village Race Distribution Figure 44: Westlake Village Languages Spoken atHome
White Alone87.4%
Hispanic orLatino (of any
race)6.1%
Black or AfricanAmerican alone
1.1%
American Indianand Alaska
Native alone0.1%
Asian alone2.6%
Native Hawaiianand Other
Pacific IslanderAlone0.1%
Some other racealone0.1%
Two or moreraces2.5%
Westlake Village Race Distribution
Speak onlyEnglish81.8%
Spanish orSpanish Creole
6.0%
Other Indo-Europeanlanguages
7.6% Asian and PacificIsland languages
4.6%
Westlake Village Language Spoken atHome
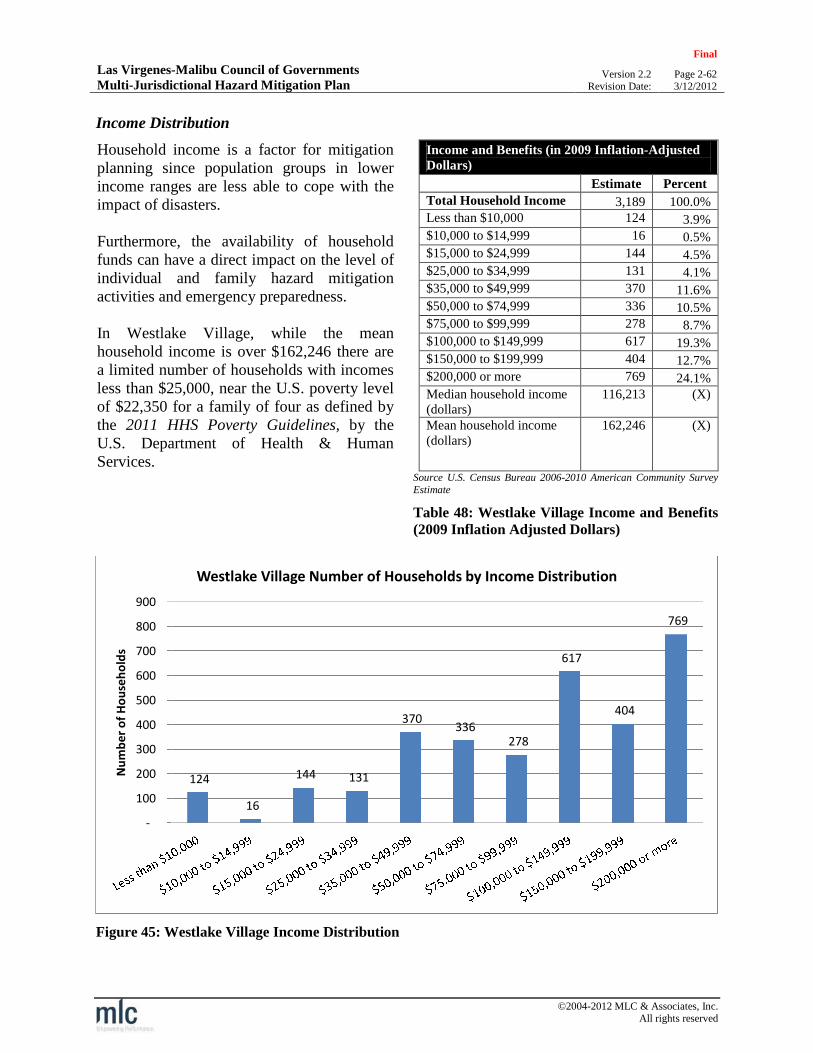
Las Virgenes-Malibu Council of GovernmentsMulti-Jurisdictional Hazard Mitigation Plan
Final
Version 2.2 Page 2-62Revision Date: 3/12/2012
©2004-2012 MLC & Associates, Inc.All rights reserved
Income Distribution
Household income is a factor for mitigationplanning since population groups in lowerincome ranges are less able to cope with theimpact of disasters.
Furthermore, the availability of householdfunds can have a direct impact on the level ofindividual and family hazard mitigationactivities and emergency preparedness.
In Westlake Village, while the meanhousehold income is over $162,246 there area limited number of households with incomesless than $25,000, near the U.S. poverty levelof $22,350 for a family of four as defined bythe 2011 HHS Poverty Guidelines, by theU.S. Department of Health & HumanServices.
Income and Benefits (in 2009 Inflation-AdjustedDollars)
Estimate Percent
Total Household Income 3,189 100.0%Less than $10,000 124 3.9%$10,000 to $14,999 16 0.5%$15,000 to $24,999 144 4.5%$25,000 to $34,999 131 4.1%$35,000 to $49,999 370 11.6%$50,000 to $74,999 336 10.5%$75,000 to $99,999 278 8.7%$100,000 to $149,999 617 19.3%$150,000 to $199,999 404 12.7%$200,000 or more 769 24.1%Median household income(dollars)
116,213 (X)
Mean household income(dollars)
162,246 (X)
Source U.S. Census Bureau 2006-2010 American Community SurveyEstimate
Table 48: Westlake Village Income and Benefits(2009 Inflation Adjusted Dollars)
Figure 45: Westlake Village Income Distribution
124
16
144 131
370336
278
617
404
769
-
100
200
300
400
500
600
700
800
900
Nu
mb
er
of
Ho
use
ho
lds
Westlake Village Number of Households by Income Distribution
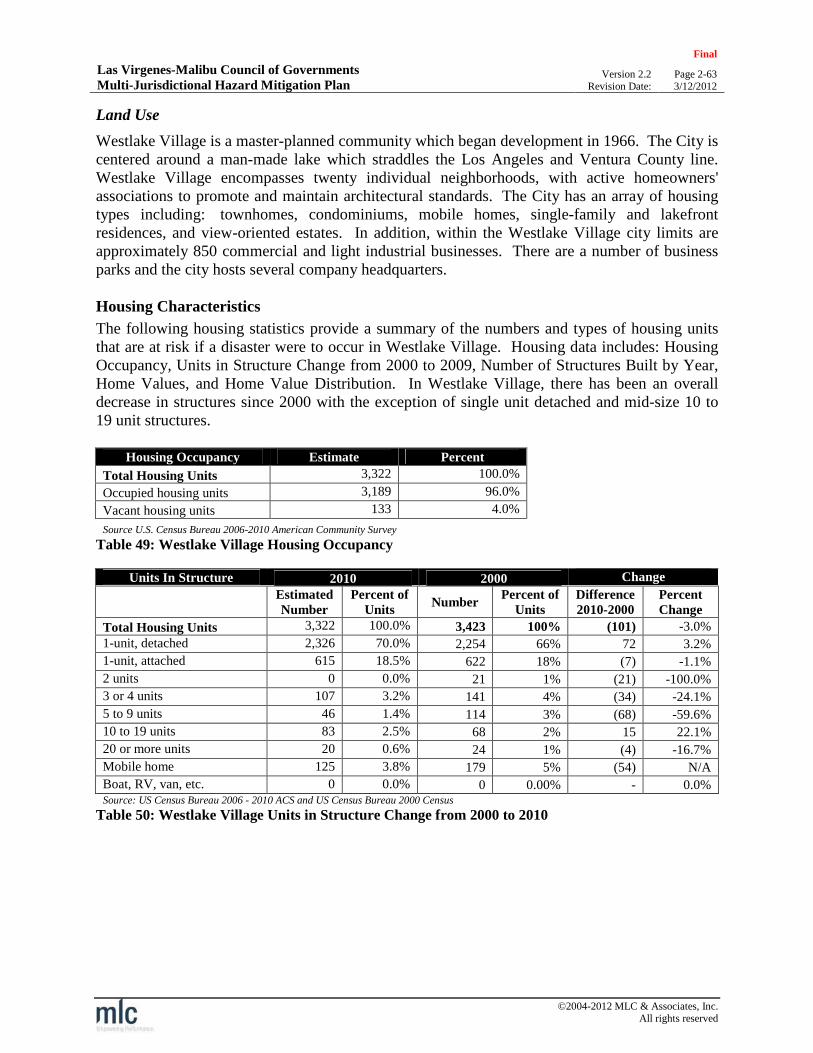
Las Virgenes-Malibu Council of GovernmentsMulti-Jurisdictional Hazard Mitigation Plan
Final
Version 2.2 Page 2-63Revision Date: 3/12/2012
©2004-2012 MLC & Associates, Inc.All rights reserved
Land Use
Westlake Village is a master-planned community which began development in 1966. The City iscentered around a man-made lake which straddles the Los Angeles and Ventura County line.Westlake Village encompasses twenty individual neighborhoods, with active homeowners'associations to promote and maintain architectural standards. The City has an array of housingtypes including: townhomes, condominiums, mobile homes, single-family and lakefrontresidences, and view-oriented estates. In addition, within the Westlake Village city limits areapproximately 850 commercial and light industrial businesses. There are a number of businessparks and the city hosts several company headquarters.
Housing Characteristics
The following housing statistics provide a summary of the numbers and types of housing unitsthat are at risk if a disaster were to occur in Westlake Village. Housing data includes: HousingOccupancy, Units in Structure Change from 2000 to 2009, Number of Structures Built by Year,Home Values, and Home Value Distribution. In Westlake Village, there has been an overalldecrease in structures since 2000 with the exception of single unit detached and mid-size 10 to19 unit structures.
Housing Occupancy Estimate Percent
Total Housing Units 3,322 100.0%
Occupied housing units 3,189 96.0%
Vacant housing units 133 4.0%
Source U.S. Census Bureau 2006-2010 American Community Survey
Table 49: Westlake Village Housing Occupancy
Units In Structure 2010 2000 Change
EstimatedNumber
Percent ofUnits
NumberPercent of
UnitsDifference2010-2000
PercentChange
Total Housing Units 3,322 100.0% 3,423 100% (101) -3.0%
1-unit, detached 2,326 70.0% 2,254 66% 72 3.2%
1-unit, attached 615 18.5% 622 18% (7) -1.1%
2 units 0 0.0% 21 1% (21) -100.0%
3 or 4 units 107 3.2% 141 4% (34) -24.1%
5 to 9 units 46 1.4% 114 3% (68) -59.6%
10 to 19 units 83 2.5% 68 2% 15 22.1%
20 or more units 20 0.6% 24 1% (4) -16.7%
Mobile home 125 3.8% 179 5% (54) N/A
Boat, RV, van, etc. 0 0.0% 0 0.00% - 0.0%Source: US Census Bureau 2006 - 2010 ACS and US Census Bureau 2000 Census
Table 50: Westlake Village Units in Structure Change from 2000 to 2010

Las Virgenes-Malibu Council of GovernmentsMulti-Jurisdictional Hazard Mitigation Plan
Final
Version 2.2 Page 2-64Revision Date: 3/12/2012
©2004-2012 MLC & Associates, Inc.All rights reserved
In terms of risk and disaster mitigation, olderstructures that have not been retrofitted orotherwise improved may be more susceptibleto damage or destruction due to age and thefact that older building codes were lessstringent than those required for newerstructures. As a result the inventory of olderstructures is a consideration when developingmitigation plans.
In Westlake Village, 81.1% of structures(2,694) were built prior to 1990 and 62.6%(2,081) before 1980.
Year Structure Built Estimate Percent
Total housing units 3,322 100.0%
Built 2005 or later 8 0.2%
Built 2000 to 2004 105 3.2%
Built 1990 to 1999 515 15.5%
Built 1980 to 1989 613 18.5%
Built 1970 to 1979 1,114 33.5%
Built 1960 to 1969 863 26.0%
Built 1950 to 1959 14 0.4%
Built 1940 to 1949 57 1.7%
Built 1939 or earlier 33 1.0%
Source: U.S. Census Bureau 2006-2010 American CommunitySurvey
Table 51: Year Structures Built in WestlakeVillage
Figure 46: Westlake Village Number of Structures Built by Year
0
200
400
600
800
1000
1200
Nu
mb
er
of
Stru
ctu
res
Westlake Village Number of Structures Built by Year

Las Virgenes-Malibu Council of GovernmentsMulti-Jurisdictional Hazard Mitigation Plan
Final
Version 2.2 Page 2-65Revision Date: 3/12/2012
©2004-2012 MLC & Associates, Inc.All rights reserved
Home values are an importantconsideration when evaluating thepotential dollar loss due todisasters. These values can also beused to assess the cost/benefit ofmitigation activities and planning.In Westlake Village, the majority ofOwner Occupied Units are valuedover $1,000,000. Consequently thepotential dollar losses from adisaster can rapidly escalate –illustrating the need for mitigationplanning.
Value Estimate Percent
Owner-Occupied Units 3,340 100.0%
Less than $50,000 44 1.3%
$50,000 to $99,999 10 0.3%
$100,000 to $149,999 0 0.0%
$150,000 to $199,999 11 0.3%
$200,000 to $299,999 23 0.7%
$300,000 to $499,999 151 4.5%
$500,000 to $999,999 537 16.1%
$1,000,000 or more 2,564 76.8%
Median (dollars) $1,000,000+
Source U.S. Census Bureau 2006--2010 American Community Survey
Table 52: Westlake Village Home Value Distribution
Figure 47: Westlake Village Distribution of Owner Occupied Unit Values
0
500
1000
1500
2000
2500
3000
Nu
mb
er
of
Ow
ne
rO
ccu
pie
dU
nit
s
Malibu Distribution of Owner Occupied Unit Values

Las Virgenes-Malibu Council of GovernmentsMulti-Jurisdictional Hazard Mitigation Plan
Final
Version 2.2 Page 2-66Revision Date: 3/12/2012
©2004-2012 MLC & Associates, Inc.All rights reserved
Emergency Preparedness
The City of Westlake Village contracts with the Los Angeles County Sheriff for local publicsafety services primarily through the Malibu/Lost Hills Sheriff Station. Fire protection isthrough the Los Angeles County Fire Protection District with Fire Station #144 providingsuppression, rescue, and fire prevention services. Westlake Village also provides EmergencyPreparedness information to the public via the Westlake Village website.
Standard Emergency Management System
The City of Westlake Village has adopted California’s Standardized Emergency ManagementSystem (SEMS) for managing the response to a multi-agency and multi-jurisdiction emergency.SEMS also serves to facilitate communications and coordination among all levels of the responsesystem and among all responding agencies.
Public Involvement Groups
Public input and participation plays an important role in Westlake Village’s emergencypreparedness efforts. Residents participate on advisory boards and committees (e.g., theEmergency Preparedness Event Committee) as well as the Westlake Village Disaster ResponseTeam.
Disaster Response Team
Since 1994 the City of Westlake Village has maintained a volunteer disaster response teamcomprised of local residents. The Westlake Village Disaster Response Team (WLVDRT) isactivated in the event of a disaster and functions to aid local neighborhoods and assist emergencyresponse personnel. An order for activation can come from the City Council, the City Manager,the Sheriff’s Department or the Fire Department.
The WLVDRT also provides community disaster preparedness education by conducting basictraining classes for residents. Residents who attend the basic training are better prepared toprotect themselves, their families, and their businesses in the event of a disaster. The intent isthat for every person who attends this training there will be one less person who will need aidduring a disaster.
Volunteers in Policing
The City of Westlake Village enhances local law enforcement services through the City’sVolunteers in Policing Program. The program consists of a core group of volunteers who aresponsored by the City of Westlake Village and are trained by the Malibu/Lost Hills Sheriff’sStation. Westlake Village provides a marked vehicle, uniforms, and specialized equipment. Theprogram volunteers provide a variety of services including patrolling neighborhoods andshopping centers, performing patrol checks of businesses, checking on the homes of residentswhen they are on vacation, and responding to related civilian requests. In addition, the volunteerpatrol members serve as a mobile Neighborhood Watch for the community.

Las Virgenes-Malibu Council of GovernmentsMulti-Jurisdictional Hazard Mitigation Plan
Final
Version 2.2 Page 2-67Revision Date: 3/12/2012
©2004-2012 MLC & Associates, Inc.All rights reserved
Email Notifications and/or RSS Feeds
The City of Westlake Village provides the public with the opportunity to subscribe to anautomated Email notification/RSS feed. The system allows the City to quickly disseminateinformation to the public.
WVTV
Westlake Village TV (Channel 10) provides a means for communicating to the public on aroutine basis as well as during emergencies. Streaming (live and archived) media is availablevia the City’s website.

Las Virgenes-Malibu Council of GovernmentsMulti-Jurisdictional Hazard Mitigation Plan
Final
Version 2.2 Page 3-1Revision Date: 3/12/2012
©2004-2012 MLC & Associates, Inc.All rights reserved
SECTION 3. RISK ASSESSMENT
The goal of mitigation is to reduce the future impacts of hazards. Hazards can result in injuriesand the loss of life, cause property damage, disrupt the local economy, and force the expenditureof large amounts of public and private funds to assist with recovery. In order to focus efforts onthe most likely and highest impact scenarios, mitigation must be based on a comprehensive RiskAssessment.
A Risk Assessment measures the potential loss from a hazard event by evaluating thevulnerability of buildings, infrastructure and people. It identifies the characteristics and potentialconsequences of hazards, how much of the community could be affected by a hazard, and theimpact on community assets. Risk Assessments consist of:
Hazard Identification and Risk Analysis
Vulnerability Analysis / Loss Estimates
Note: This Risk Assessment presents loss estimates and provides a foundation for evaluatingmitigation measures should a real hazard event occur. The loss estimates are intended to supportthe decision making process for mitigation efforts.
It is important to note that the loss estimates calculated for this Risk Assessment used availabledata and methodologies and are approximate. These estimates should be used to understand therelative risk from hazards and potential losses and are not intended to be predictive of preciseresults.
Uncertainties are inherent in any loss estimation methodology arising in part from incompletescientific knowledge concerning natural hazards and their effects on the built environment.Uncertainties also result from approximations and simplifications that are necessary in developingvulnerability estimates (e.g., risk of loss projections and relative likelihood of occurrence). Thesefactors can result in a range of uncertainty in loss estimates produced by this analysis.
Disaster History
Emergencies and disasters can cause damage to the Las Virgenes-Malibu Region and itsresidents, businesses, infrastructure and the environment. These disasters can cause fatalities orinjuries and expense in terms of response and recovery dollars.
The cities that comprise the Las Virgenes-Malibu Council of Governments have experiencednatural disasters in the past and continue to have the potential for future events. While the risk ofdisasters cannot be eliminated, the effects can be reduced through a well-organized publiceducation and awareness effort, preparedness and mitigation. In addition, communities must beprepared to provide efficient and effective response and recovery. Furthermore careful planningand collaboration among public agencies, private sector organizations, and citizens within thecommunity can minimize the losses that result from disasters.

Las Virgenes-Malibu Council of GovernmentsMulti-Jurisdictional Hazard Mitigation Plan
Final
Version 2.2 Page 3-2Revision Date: 3/12/2012
©2004-2012 MLC & Associates, Inc.All rights reserved
In order to illustrate the potential hazards to the region, a review of historical events can provide indicators for future threats to the area. Thetable below provides a summary of major disasters occurring in Los Angeles County since 1995.
Incident Period Hazard Type Disaster # Counties DeclaredFederal
DeclarationTotal Public Assistance
Grants
January 16 -February 6, 2010
Severe Winter Storms,Flooding, and Debris andMud Flows
FEMA-1884-DR Calaveras County, Imperial County, LosAngeles County, Riverside County, SanBernardino County, Siskiyou County.
3/8/2010 $15,604,176
November 13 - 28,2008
Wildfire FEMA-1810-DR Los Angeles County, Orange County, SantaBarbara
11/18/2008 $35,044,374
October 21, 2007 -March 31, 2008
Wildfire, flooding, mudflows, and debris flowsdirectly related to thewildfires
FEMA-1731-DR Los Angeles, Orange, Riverside, SanBernardino, San Diego, Santa Barbara, Ventura
10/24/2007 $170,094,288
January 11-17,2007
Severe Freeze FEMA-1689-DR Fresno, Imperial, Kern, Los Angeles, Monterey,Riverside, San Bernardino, San Diego, San LuisObispo, Santa Barbara, Tulare, Ventura
3/13/2007 approx. $23,000,000
February 16 - 23,2005
Severe Storms, Flooding,Landslides, and Mud andDebris Flows
FEMA-1585-DR Los Angeles, Orange, Riverside, Ventura 4/14/2005 $74,826,845
February 2, 1998 -April 30, 1998
California Severe WinterStorms and Flooding
FEMA-1203-DR Los Angeles and 40 additional counties 2/9/1998 not listed
February 13 - April19, 1995
Severe Winter Storms,Flooding, Landslides, MudFlows
FEMA-1046-DR Los Angeles and 57 additional counties 3/12/1995 not listed
Table 53: Los Angeles County Federal Declared Disasters from 1995-2010
Source: FEMA
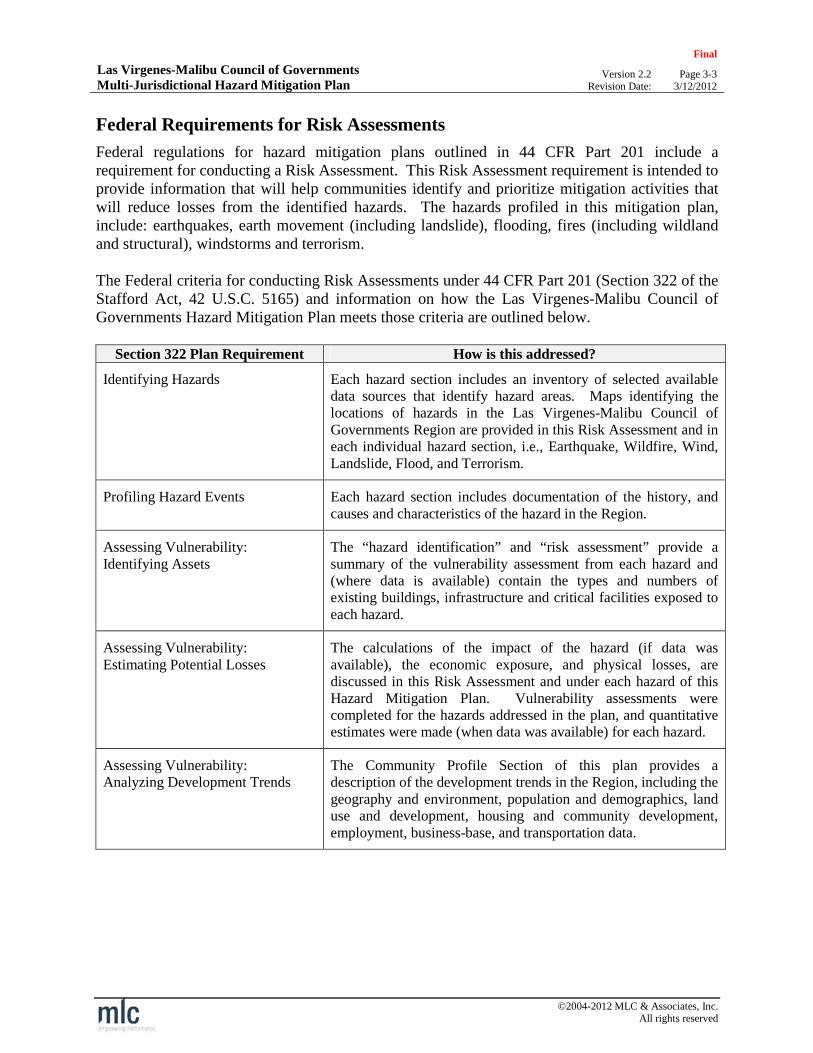
Las Virgenes-Malibu Council of GovernmentsMulti-Jurisdictional Hazard Mitigation Plan
Final
Version 2.2 Page 3-3Revision Date: 3/12/2012
©2004-2012 MLC & Associates, Inc.All rights reserved
Federal Requirements for Risk Assessments
Federal regulations for hazard mitigation plans outlined in 44 CFR Part 201 include arequirement for conducting a Risk Assessment. This Risk Assessment requirement is intended toprovide information that will help communities identify and prioritize mitigation activities thatwill reduce losses from the identified hazards. The hazards profiled in this mitigation plan,include: earthquakes, earth movement (including landslide), flooding, fires (including wildlandand structural), windstorms and terrorism.
The Federal criteria for conducting Risk Assessments under 44 CFR Part 201 (Section 322 of theStafford Act, 42 U.S.C. 5165) and information on how the Las Virgenes-Malibu Council ofGovernments Hazard Mitigation Plan meets those criteria are outlined below.
Section 322 Plan Requirement How is this addressed?
Identifying Hazards Each hazard section includes an inventory of selected availabledata sources that identify hazard areas. Maps identifying thelocations of hazards in the Las Virgenes-Malibu Council ofGovernments Region are provided in this Risk Assessment and ineach individual hazard section, i.e., Earthquake, Wildfire, Wind,Landslide, Flood, and Terrorism.
Profiling Hazard Events Each hazard section includes documentation of the history, andcauses and characteristics of the hazard in the Region.
Assessing Vulnerability:Identifying Assets
The “hazard identification” and “risk assessment” provide asummary of the vulnerability assessment from each hazard and(where data is available) contain the types and numbers ofexisting buildings, infrastructure and critical facilities exposed toeach hazard.
Assessing Vulnerability:Estimating Potential Losses
The calculations of the impact of the hazard (if data wasavailable), the economic exposure, and physical losses, arediscussed in this Risk Assessment and under each hazard of thisHazard Mitigation Plan. Vulnerability assessments werecompleted for the hazards addressed in the plan, and quantitativeestimates were made (when data was available) for each hazard.
Assessing Vulnerability:Analyzing Development Trends
The Community Profile Section of this plan provides adescription of the development trends in the Region, including thegeography and environment, population and demographics, landuse and development, housing and community development,employment, business-base, and transportation data.

Las Virgenes-Malibu Council of GovernmentsMulti-Jurisdictional Hazard Mitigation Plan
Final
Version 2.2 Page 3-4Revision Date: 3/12/2012
©2004-2012 MLC & Associates, Inc.All rights reserved
Hazard Identification and Risk Analysis
Hazard identification consists of (1) defining the study area in terms of scale and coverage; and(2) collecting and compiling a list of prevalent hazards in the study area to help narrow the focusof the analysis. The figure below depicts the study area and population density (Las Virgenes-Malibu COG jurisdictions and nearby communities).
Map 12: LVMCOG Study Area and Population Density
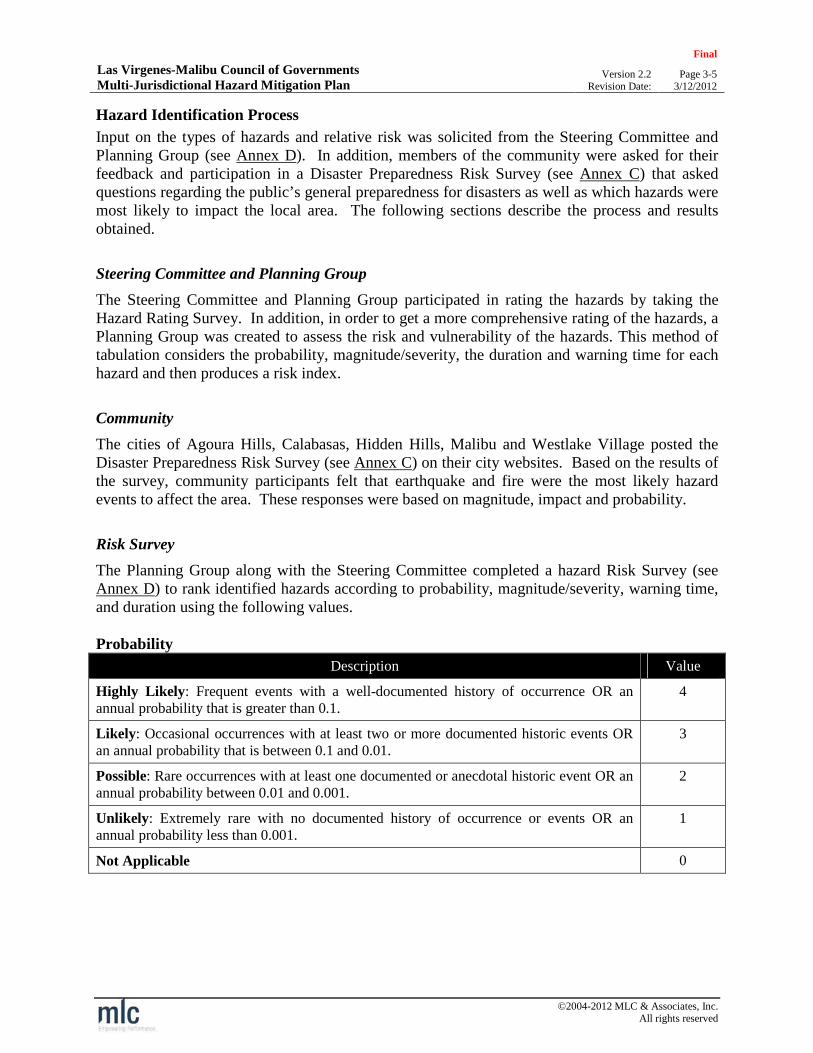
Las Virgenes-Malibu Council of GovernmentsMulti-Jurisdictional Hazard Mitigation Plan
Final
Version 2.2 Page 3-5Revision Date: 3/12/2012
©2004-2012 MLC & Associates, Inc.All rights reserved
Hazard Identification Process
Input on the types of hazards and relative risk was solicited from the Steering Committee andPlanning Group (see Annex D). In addition, members of the community were asked for theirfeedback and participation in a Disaster Preparedness Risk Survey (see Annex C) that askedquestions regarding the public’s general preparedness for disasters as well as which hazards weremost likely to impact the local area. The following sections describe the process and resultsobtained.
Steering Committee and Planning Group
The Steering Committee and Planning Group participated in rating the hazards by taking theHazard Rating Survey. In addition, in order to get a more comprehensive rating of the hazards, aPlanning Group was created to assess the risk and vulnerability of the hazards. This method oftabulation considers the probability, magnitude/severity, the duration and warning time for eachhazard and then produces a risk index.
Community
The cities of Agoura Hills, Calabasas, Hidden Hills, Malibu and Westlake Village posted theDisaster Preparedness Risk Survey (see Annex C) on their city websites. Based on the results ofthe survey, community participants felt that earthquake and fire were the most likely hazardevents to affect the area. These responses were based on magnitude, impact and probability.
Risk Survey
The Planning Group along with the Steering Committee completed a hazard Risk Survey (seeAnnex D) to rank identified hazards according to probability, magnitude/severity, warning time,and duration using the following values.
Probability
Description Value
Highly Likely: Frequent events with a well-documented history of occurrence OR anannual probability that is greater than 0.1.
4
Likely: Occasional occurrences with at least two or more documented historic events ORan annual probability that is between 0.1 and 0.01.
3
Possible: Rare occurrences with at least one documented or anecdotal historic event OR anannual probability between 0.01 and 0.001.
2
Unlikely: Extremely rare with no documented history of occurrence or events OR anannual probability less than 0.001.
1
Not Applicable 0

Las Virgenes-Malibu Council of GovernmentsMulti-Jurisdictional Hazard Mitigation Plan
Final
Version 2.2 Page 3-6Revision Date: 3/12/2012
©2004-2012 MLC & Associates, Inc.All rights reserved
Magnitude/Severity
Description Value
Catastrophic: Severe property damages (greater than 50% of critical and non-criticalfacilities and infrastructure). Injuries or illnesses result in permanent disability andmultiple deaths. Shut down of critical facilities for more than 1 month.
4
Critical: Moderate property damages (greater than 25% and less than 50% of critical andnon-critical facilities and infrastructure). Injuries or illnesses result in permanent disabilityand at least one death. Shut down of critical facilities for more than 1 week and less than 1month.
3
Limited: Slight property damages (greater than 5% and less than 25% of critical and non-critical facilities and infrastructure). Injuries or illnesses do not result in permanentdisability and there are no deaths. Moderate quality of life lost. Shut down of criticalfacilities for more than 1 day and less than 1 week.
2
Negligible: Negligible property damages (less than 5% of critical and non-critical facilitiesand infrastructure). Injuries or illnesses are treatable with first aid and there are no deaths.Negligible quality of life lost. Shut down of critical facilities for less than 24 hours.
1
Not Applicable 0
Warning Time
Description Value
Less than 6 hours or no warning 4
6 to 12 hours 3
12 to 24 hours 2
More than 24 hours 1
Not Applicable 0
Duration
Description Value
More than 1 week 4
Greater than 24 hours, up to 1 week 3
Greater than 6 hours, up to 24 hours 2
Less than 6 hours 1
Not Applicable 0
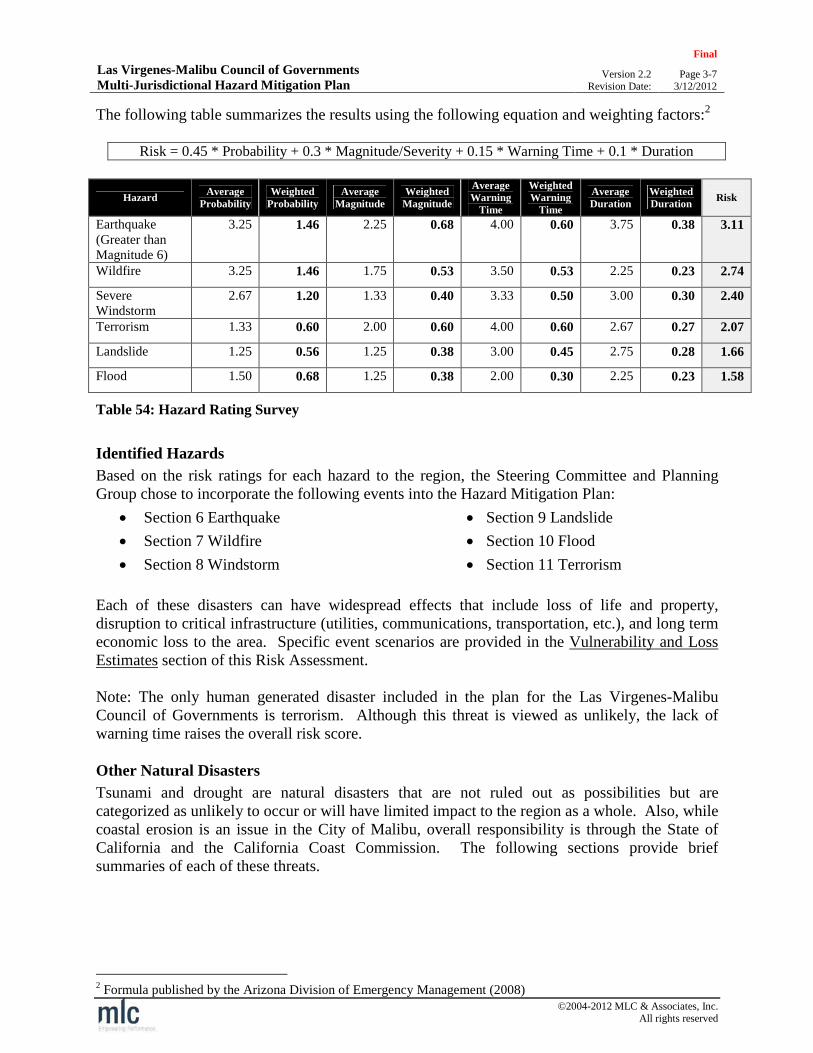
Las Virgenes-Malibu Council of GovernmentsMulti-Jurisdictional Hazard Mitigation Plan
Final
Version 2.2 Page 3-7Revision Date: 3/12/2012
©2004-2012 MLC & Associates, Inc.All rights reserved
The following table summarizes the results using the following equation and weighting factors:2
Risk = 0.45 * Probability + 0.3 * Magnitude/Severity + 0.15 * Warning Time + 0.1 * Duration
HazardAverage
ProbabilityWeighted
ProbabilityAverage
MagnitudeWeighted
Magnitude
AverageWarning
Time
WeightedWarning
Time
AverageDuration
WeightedDuration
Risk
Earthquake(Greater thanMagnitude 6)
3.25 1.46 2.25 0.68 4.00 0.60 3.75 0.38 3.11
Wildfire 3.25 1.46 1.75 0.53 3.50 0.53 2.25 0.23 2.74
SevereWindstorm
2.67 1.20 1.33 0.40 3.33 0.50 3.00 0.30 2.40
Terrorism 1.33 0.60 2.00 0.60 4.00 0.60 2.67 0.27 2.07
Landslide 1.25 0.56 1.25 0.38 3.00 0.45 2.75 0.28 1.66
Flood 1.50 0.68 1.25 0.38 2.00 0.30 2.25 0.23 1.58
Table 54: Hazard Rating Survey
Identified Hazards
Based on the risk ratings for each hazard to the region, the Steering Committee and PlanningGroup chose to incorporate the following events into the Hazard Mitigation Plan:
Section 6 Earthquake
Section 7 Wildfire
Section 8 Windstorm
Section 9 Landslide
Section 10 Flood
Section 11 Terrorism
Each of these disasters can have widespread effects that include loss of life and property,disruption to critical infrastructure (utilities, communications, transportation, etc.), and long termeconomic loss to the area. Specific event scenarios are provided in the Vulnerability and LossEstimates section of this Risk Assessment.
Note: The only human generated disaster included in the plan for the Las Virgenes-MalibuCouncil of Governments is terrorism. Although this threat is viewed as unlikely, the lack ofwarning time raises the overall risk score.
Other Natural Disasters
Tsunami and drought are natural disasters that are not ruled out as possibilities but arecategorized as unlikely to occur or will have limited impact to the region as a whole. Also, whilecoastal erosion is an issue in the City of Malibu, overall responsibility is through the State ofCalifornia and the California Coast Commission. The following sections provide briefsummaries of each of these threats.
2 Formula published by the Arizona Division of Emergency Management (2008)

Las Virgenes-Malibu Council of GovernmentsMulti-Jurisdictional Hazard Mitigation Plan
Final
Version 2.2 Page 3-8Revision Date: 3/12/2012
©2004-2012 MLC & Associates, Inc.All rights reserved
Tsunami
A tsunami has never occurred within the Las Virgenes-Malibu Region. Althoughthe City of Malibu is in close proximity to the Pacific Ocean, there is no record ofa tsunami or repercussions of such an event. State data shows that although theCity of Malibu would sustain some water inundation if a tsunami hits the SouthernCalifornia Coast, it would have little to no impact on the LVMCOG region as awhole.
To further mitigate the impact of a tsunami to the general public, the City ofMalibu has developed a tsunami information brochure and has designated severalTsunami Safe Areas and evacuation routes.
Tsunami Safe Areas Evacuation Routes
Malibu Bluffs Park Malibu Creek State Park Point Dume (Neighborhood and Elementary
School) Salvation Army Camps (behind Tapia Park)
Topanga Canyon Blvd. Malibu Canyon Road Kanan Road Encinal Canyon Road Mulholland Highway
Figure 48: Malibu CoastlinePhoto by: D. Searls

Las Virgenes-Malibu Council of GovernmentsMulti-Jurisdictional Hazard Mitigation Plan
Final
Version 2.2 Page 3-9Revision Date: 3/12/2012
©2004-2012 MLC & Associates, Inc.All rights reserved
Coastal Erosion
Erosion is an issue along the Malibu coast. Ingeneral, mitigation is the responsibility of theState of California and the California CoastalCommission though the City of Malibu hasimplemented a Local Coastal Program LocalImplementation Plan (adopted by the CaliforniaCoastal Commission 9/13/2002) and CoastalZone ordinance to reduce the threat of coastalerosion. Per City of Malibu, Code §10.4:
§10.4 A. Siting and design of new shorelinedevelopment and shoreline protectivedevices shall take into account anticipatedfuture changes in sea level. In particular, anacceleration of the historic rate of sea level rise shall be considered and its potential impacton beach erosion, shoreline retreat, and bluff erosion rates shall be evaluated.
§10.4 B. New development on a beach or oceanfront bluff shall be sited outside areas subjectto hazards (beach or bluff erosion, inundation, wave run-up) at any time during the fullprojected 100 year economic life of the development. If complete avoidance of hazard areasis not feasible, all new beach or oceanfront bluff development shall be elevated above thebase Flood Elevation (as defined by FEMA) and sited as far landward as possible to themaximum extent practicable. All development shall be setback a minimum of 10 feetlandward of the most landward surveyed mean high tide line. Whichever setback method ismost restrictive shall apply. Development plans shall consider hazards currently affecting theproperty as well as hazards that can be anticipated over the life of the structure.
See City of Malibu, Code §10.4 for additional erosion control requirements.
Figure 49: Malibu Coast

Las Virgenes-Malibu Council of GovernmentsMulti-Jurisdictional Hazard Mitigation Plan
Final
Version 2.2 Page 3-10Revision Date: 3/12/2012
©2004-2012 MLC & Associates, Inc.All rights reserved
Drought
Historical records of the last century do not show any significant loss of life or property to theLas Virgenes-Malibu Region because of a drought occurrence. The last devastating drought tohit Southern California was from 1862-1864, when the state lost nearly a quarter of its earningsand 40% of its livestock, mostly because of the dry Southern Region. (Leonard Pitt, Decline ofthe Californios: A Social History of the Spanish-Speaking Californias, 1846-1890, pg.247)
Figure 50: U.S. Seasonal Drought Outlook
Although Southern California is under constant threat of drought, there is no indication that aserious threat to life or property exists. Furthermore, recent conditions and predictions do notshow drought to be a major near-term concern in the Las Virgenes-Malibu Region (see U.S.Seasonal Drought Outlook figure above).
Nevertheless it is important to note that drought can have a secondary impact to the hydro-electric power generation capabilities of the entire western U.S. As a result, drought remains aconcern for the entire region.

Las Virgenes-Malibu Council of GovernmentsMulti-Jurisdictional Hazard Mitigation Plan
Final
Version 2.2 Page 3-11Revision Date: 3/12/2012
©2004-2012 MLC & Associates, Inc.All rights reserved
Human Generated and Technology Disasters
Power Outage
Power outages do occur occasionally so the risk of occurrence is somewhat likely. Electricalpower is supplied to the Las Virgenes-Malibu Region by Southern California Edison (SCE).Power outages can occur whenever there is a severe disruption to power generation facilities ordistribution network (for instance during a severe storm, an earthquake, or wildfire).
In addition, human error is a potential risk. On September 8, 2011 an Arizona Public Service(APS) employee is believed to have caused a major power outage that included Arizona andportions of Southern California including San Diego, Orange, and Imperial Counties. Theoutage impacted more than 5 million people. While the Las Virgenes-Malibu Region was notimpacted, this event demonstrates the potential for widespread power disruptions.
Finally, there is an ongoing risk of cyber-attack to the nation’s critical infrastructure. On August14, 2003, the MSBLAST worm (Blaster) and SoBig worms were suspected of causing a massiveblackout in the Northeastern Interconnect impacting 50 million customers from the mid-west tothe east coast.
Figure 51: NERC Interconnections
To mitigate the threat of power outage, SCE has an emergency preparedness program in place toaddress pre- and post-disaster planning needs. Additionally, they have included in their plans theneed to communicate with the Region during an outage. Finally, SCE continually assesses thevulnerability of their system to hazards and takes steps to mitigate the risk.
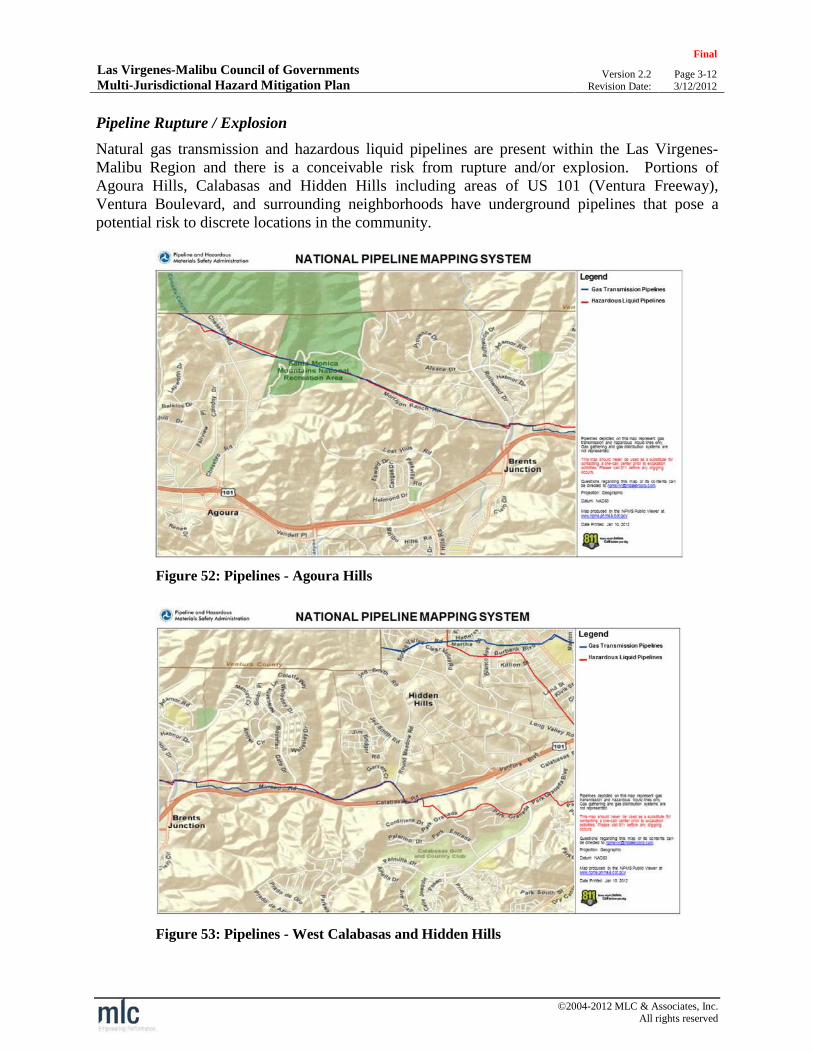
Las Virgenes-Malibu Council of GovernmentsMulti-Jurisdictional Hazard Mitigation Plan
Final
Version 2.2 Page 3-12Revision Date: 3/12/2012
©2004-2012 MLC & Associates, Inc.All rights reserved
Pipeline Rupture / Explosion
Natural gas transmission and hazardous liquid pipelines are present within the Las Virgenes-Malibu Region and there is a conceivable risk from rupture and/or explosion. Portions ofAgoura Hills, Calabasas and Hidden Hills including areas of US 101 (Ventura Freeway),Ventura Boulevard, and surrounding neighborhoods have underground pipelines that pose apotential risk to discrete locations in the community.
Figure 52: Pipelines - Agoura Hills
Figure 53: Pipelines - West Calabasas and Hidden Hills

Las Virgenes-Malibu Council of GovernmentsMulti-Jurisdictional Hazard Mitigation Plan
Final
Version 2.2 Page 3-13Revision Date: 3/12/2012
©2004-2012 MLC & Associates, Inc.All rights reserved
Figure 54: Pipelines - East Calabasas
The San Bruno, California natural gas transmission pipeline rupture and fire on September 9,2010 demonstrated the impact of this type of disaster to local populations. The pipeline operatedby Pacific Gas and Electric Company ruptured releasing 47.6 million standard cubic feet ofnatural gas and produced a crater 72 feet long and 26 feet wide.
The explosion and resulting fire killed 8people, left numerous injuries, destroyed38 homes and damaged 70.3 In addition,people in the surrounding neighborhoodhad to be evacuated until the dangersubsided. While catastrophic in terms oflives and property loss, a pipeline ruptureand/or explosion would be a localizedevent and not impact the Las Virgenes-Malibu Region as a whole. In terms ofregional impact, the most widespreaddisruption would occur if there weresignificant damage to US 101. Thiswould cause transportation issues for theentire area.
Figure 55: San Bruno Pipeline Explosion
Source: CalEMA
3NTSB Pipeline Accident Report, Pacific Gas and Electric Company Natural Gas Transmission Pipeline Rupture and Fire, San Bruno,
California, September 9, 2010 (NTSB Number: PAR-11-01, NTIS Number: PB2011-916501, Adopted: August 30, 2011).
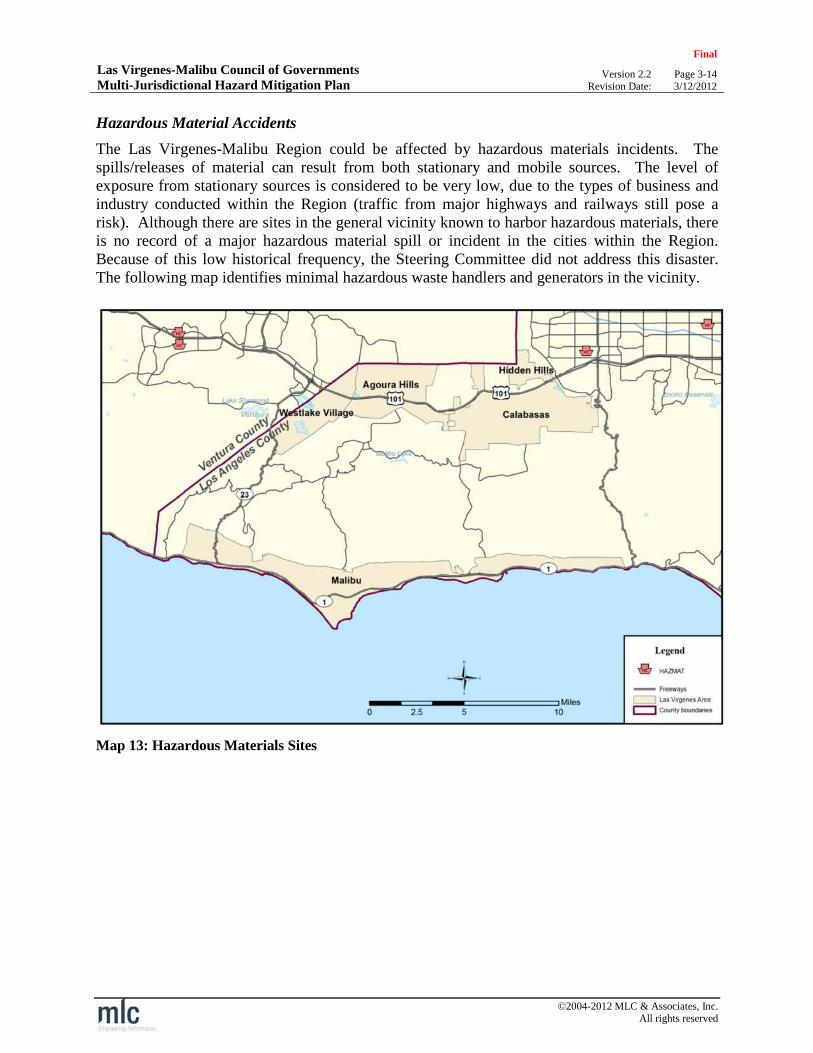
Las Virgenes-Malibu Council of GovernmentsMulti-Jurisdictional Hazard Mitigation Plan
Final
Version 2.2 Page 3-14Revision Date: 3/12/2012
©2004-2012 MLC & Associates, Inc.All rights reserved
Hazardous Material Accidents
The Las Virgenes-Malibu Region could be affected by hazardous materials incidents. Thespills/releases of material can result from both stationary and mobile sources. The level ofexposure from stationary sources is considered to be very low, due to the types of business andindustry conducted within the Region (traffic from major highways and railways still pose arisk). Although there are sites in the general vicinity known to harbor hazardous materials, thereis no record of a major hazardous material spill or incident in the cities within the Region.Because of this low historical frequency, the Steering Committee did not address this disaster.The following map identifies minimal hazardous waste handlers and generators in the vicinity.
Map 13: Hazardous Materials Sites
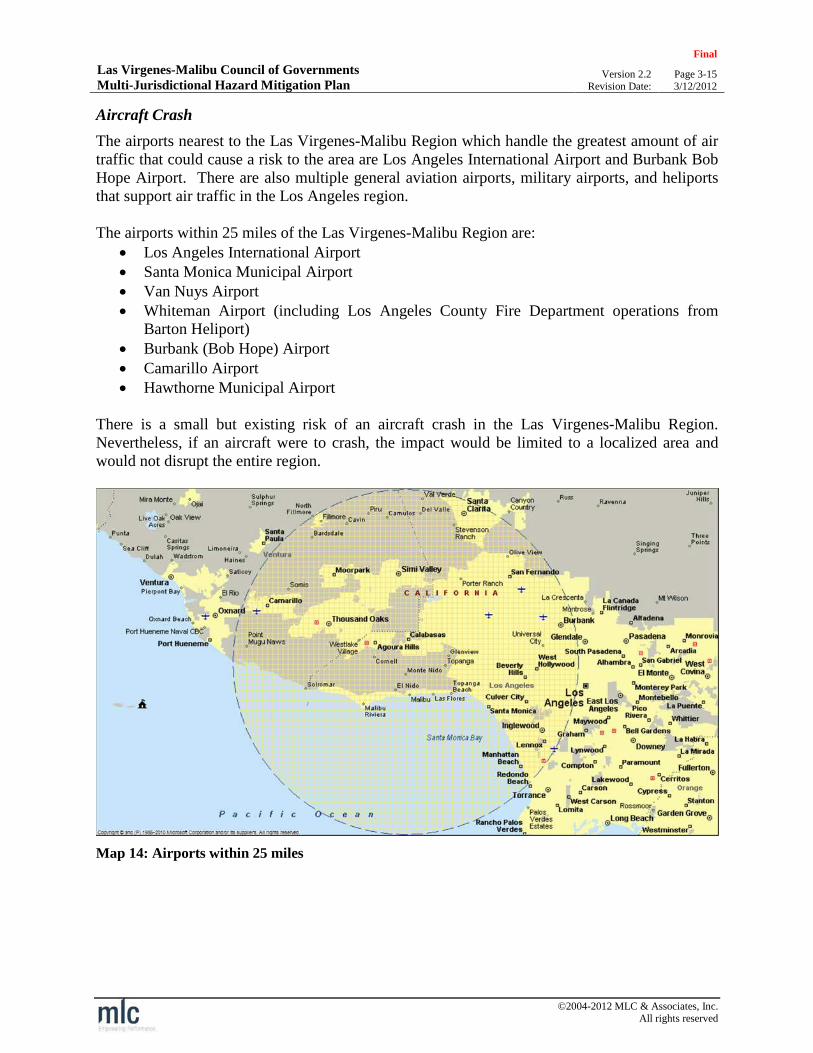
Las Virgenes-Malibu Council of GovernmentsMulti-Jurisdictional Hazard Mitigation Plan
Final
Version 2.2 Page 3-15Revision Date: 3/12/2012
©2004-2012 MLC & Associates, Inc.All rights reserved
Aircraft Crash
The airports nearest to the Las Virgenes-Malibu Region which handle the greatest amount of airtraffic that could cause a risk to the area are Los Angeles International Airport and Burbank BobHope Airport. There are also multiple general aviation airports, military airports, and heliportsthat support air traffic in the Los Angeles region.
The airports within 25 miles of the Las Virgenes-Malibu Region are: Los Angeles International Airport Santa Monica Municipal Airport Van Nuys Airport Whiteman Airport (including Los Angeles County Fire Department operations from
Barton Heliport) Burbank (Bob Hope) Airport Camarillo Airport Hawthorne Municipal Airport
There is a small but existing risk of an aircraft crash in the Las Virgenes-Malibu Region.Nevertheless, if an aircraft were to crash, the impact would be limited to a localized area andwould not disrupt the entire region.
Map 14: Airports within 25 miles
Las Virgenes-Malibu Council of GovernmentsMulti-Jurisdictional Hazard Mitigation Plan
Final
Version 2.2 Page 3-16Revision Date: 3/12/2012
©2004-2012 MLC & Associates, Inc.All rights reserved
Civil Unrest/Riot
Los Angeles County experienced the Los Angeles Civil Unrest in 1992 and the Watts Riots in1965. During these periods, the Las Virgenes-Malibu Region suffered no loss of life or property.
Similarly, during 2011“Occupy LA” and other civil protests were staged in Los Angeles Countyand across the U.S. While somewhat disruptive to the immediate vicinities and targeted sites, theLas Virgenes-Malibu Region was unaffected. As a result the actual risk of a riot or major civildisturbance is considered minimal.

Las Virgenes-Malibu Council of GovernmentsMulti-Jurisdictional Hazard Mitigation Plan
Final
Version 2.2 Page 3-17Revision Date: 3/12/2012
©2004-2012 MLC & Associates, Inc.All rights reserved
Vulnerability and Loss Estimates
Assessing vulnerability is a three step process. The first step is to identify existing structures andcritical facilities that are located within the hazard area. Government critical facilities are ofparticular concern because these buildings provide essential products and services to the generalpublic that are necessary to preserve the welfare and quality of life in the region and fulfillimportant public safety, emergency response, and/or disaster recovery functions (see CriticalFacilities and Infrastructure Matrix for a listing of key sites).
Once existing structures and critical facilities are identified, the next step is to include anestimate of losses for the identified asset. Estimating potential loss involves assessing thedamage, injuries, and financial costs likely to be sustained in a geographic area over a givenperiod of time. This level of analysis involves using mathematical models.
The two measurable components of risk analysis are magnitude of the harm that may result andthe likelihood of the harm occurring. Describing vulnerability in terms of dollar losses providesthe community and the state with a common framework in which to measure the effects ofhazards on assets. The last step in assessing the Region’s vulnerability to hazards is to analyzedevelopment trends in the Region.
Critical Facilities and Infrastructure Overview
Critical facilities and infrastructure are resources that are vital to the continued delivery of keygovernment services or that may significantly impact the public’s ability to recover from anemergency. For example, each city within the Las Virgenes-Malibu Council of Governmentsmaintains and operates separate City Halls and departments. In order to provide Continuity ofOperations (COOP) and Continuity of Government (COG) each city has also developed theirown Emergency Operations Centers (EOCs). The following lists are provided to illustrate thecritical and essential facilities within the LVMCOG area:
Los Angeles County Sherriff’s Stations Los Angeles County Fire Stations Las Virgenes Water District Critical Facilities and Infrastructure Matrix
Los Angeles County Sheriff’s Station
The LVMCOG region’s Malibu/Lost Hills Sheriff’s station is located in Calabasas. This stationserves the western portion of Los Angeles County, which is a blend of residential, rural,mountain, beach and recreational areas. The cities served by this station include Agoura Hills,Calabasas, Hidden Hills, Malibu, and Westlake Village as well as the unincorporatedcommunities of Chatsworth Lake Manor, Malibu Lake, Topanga, and West Hills.
LOS ANGELES COUNTY SHERIFF
Malibu/Lost Hills Station 27050 Agoura Road, Calabasas, CA 91301
Table 55: Las Virgenes-Malibu COG Area Sheriff's Station
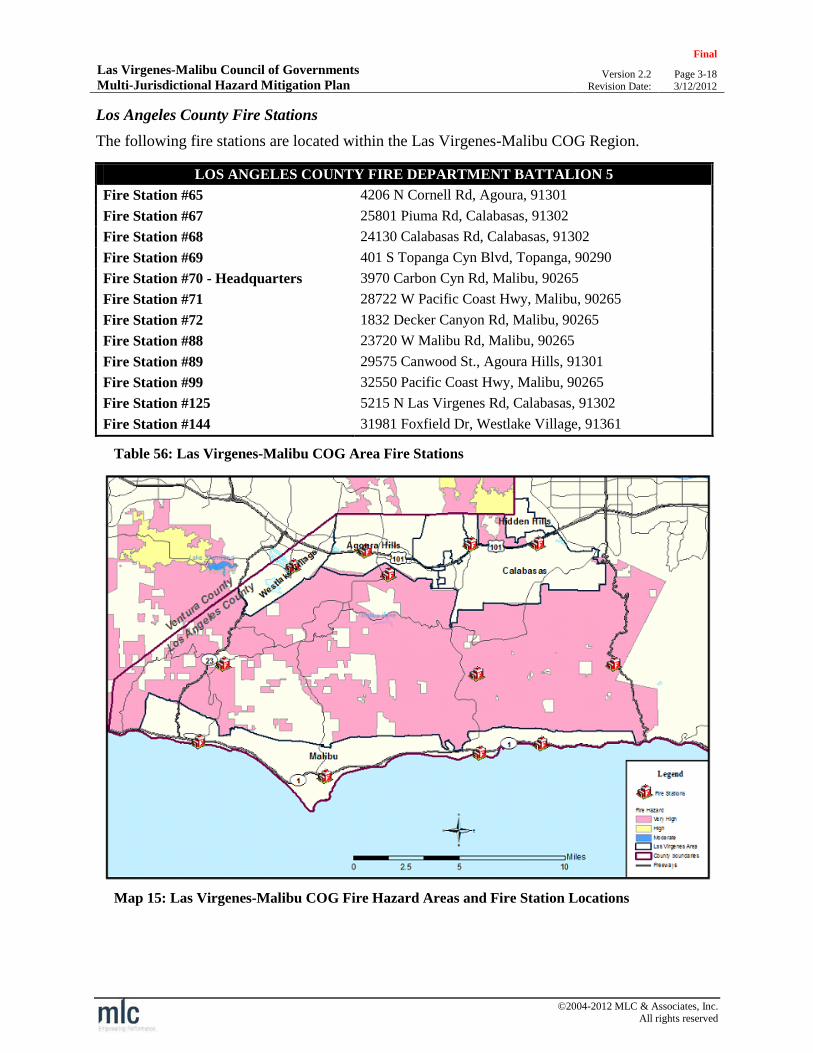
Las Virgenes-Malibu Council of GovernmentsMulti-Jurisdictional Hazard Mitigation Plan
Final
Version 2.2 Page 3-18Revision Date: 3/12/2012
©2004-2012 MLC & Associates, Inc.All rights reserved
Los Angeles County Fire Stations
The following fire stations are located within the Las Virgenes-Malibu COG Region.
LOS ANGELES COUNTY FIRE DEPARTMENT BATTALION 5
Fire Station #65 4206 N Cornell Rd, Agoura, 91301
Fire Station #67 25801 Piuma Rd, Calabasas, 91302
Fire Station #68 24130 Calabasas Rd, Calabasas, 91302
Fire Station #69 401 S Topanga Cyn Blvd, Topanga, 90290
Fire Station #70 - Headquarters 3970 Carbon Cyn Rd, Malibu, 90265
Fire Station #71 28722 W Pacific Coast Hwy, Malibu, 90265
Fire Station #72 1832 Decker Canyon Rd, Malibu, 90265
Fire Station #88 23720 W Malibu Rd, Malibu, 90265
Fire Station #89 29575 Canwood St., Agoura Hills, 91301
Fire Station #99 32550 Pacific Coast Hwy, Malibu, 90265
Fire Station #125 5215 N Las Virgenes Rd, Calabasas, 91302
Fire Station #144 31981 Foxfield Dr, Westlake Village, 91361
Table 56: Las Virgenes-Malibu COG Area Fire Stations
Map 15: Las Virgenes-Malibu COG Fire Hazard Areas and Fire Station Locations

Las Virgenes-Malibu Council of GovernmentsMulti-Jurisdictional Hazard Mitigation Plan
Final
Version 2.2 Page 3-19Revision Date: 3/12/2012
©2004-2012 MLC & Associates, Inc.All rights reserved
Las Virgenes Municipal Water District
The Las Virgenes Municipal Water District (LVMWD) serves the cities of Agoura Hills,Calabasas, Hidden Hills and Westlake Village (the City of Malibu is served by Los AngelesCounty Water District 29) They have 24 water tanks and 24 pumping stations, 10,000 acre-footLas Virgenes Reservoir, and the Westlake Village Filtration Plat.
The Las Virgenes Reservoir dam islocated at 2860 Three Springs Drive,Westlake Village. The water filtrationplant is located at 32601 TorchwoodPlace, Westlake Village. Water is alsopurchased from the Metropolitan WaterDistrict of Southern California (MWD).
The LVMWD takes precautions tosecure their facilities including fencingsites and securing facilities withalarms. Major facilities have securityaccess gates locked 24/7 and a securitycompany monitors and responds toalarms.
The district has operating and responseprocedures to ensure that any potentialinterruption of services will be as shortas possible. Further, the district hascompleted a Vulnerability Assessmentas required by federal law to assess andmitigate any potential security issues.
Map 16: Las Virgenes Municipal Water District ServiceArea
The Critical Facilities and Infrastructure Matrix on the following page provides a summary ofkey governmental, utility, commercial, cultural, and historical sites in the region. Anunderstanding of critical facilities and infrastructure provides a basis for modeling current andfuture events and assists in focusing mitigation efforts.

Las Virgenes-Malibu Council of GovernmentsMulti-Jurisdictional Hazard Mitigation Plan
Final
Version 2.2 Page 3-20Revision Date: 3/12/2012
©2004-2012 MLC & Associates, Inc.All rights reserved
Critical Facilities and Infrastructure Matrix
The following locations have been identified by the individual cities within the Las Virgenes- Malibu COG as essential due to the impact of a disasteron the public (e.g., large public meeting places), economy, or key infrastructure. The Critical Infrastructure Sectors listed are based on HomelandSecurity Presidential Directive 7 (HSPD-7).
Critical InfrastructureSectors
Description Agoura Hills Calabasas Hidden Hills MalibuWestlakeVillage
Agriculture and Food Farming, livestock, poultry, food distribution,etc.
N/A N/A N/A N/A Dole Foods
Banking and Finance Banks, thrifts, credit unions, insurers,securities brokers/dealers, investmentcompanies, financial services, etc. IncludesBank / Financial headquarters, loan processingcenters, credit card processing centers, datacenters
N/A Bank of America N/A N/A Bank of America
Chemical Industry Chemical manufacturers, pharmaceutical,consumer products, agricultural chemicals, etc.
N/A N/A N/A N/A N/A
Commercial Facilities Public Assembly (e.g., arenas, stadiums,aquariums, zoos, museums, conventioncenters), Sports Leagues (e.g., professionalsports leagues and federations) Gaming (e.g.,casinos), Lodging (e.g., hotels, motels,conference centers), Outdoor Events (e.g.,theme and amusement parks, fairs,campgrounds, parades), Entertainment andMedia (e.g., motion picture studios, broadcastmedia), Real Estate (e.g., office/apartmentbuildings, condominiums, mixed-use facilities,self-storage) and, Retail (e.g., retail centersand districts, shopping malls)
Civic Center Recreation Center
Auto Row Civic Center The Commons
(retail, food,entertainment)
CommunityCenter (not cityowned)
Civic Center Zuma Beach
Evacuation Area
Civic CenterCostcoFour Seasons
Hotel andLongevity Center
Residence InnWestlake Market
PlaceWestlake Village
Inn
Communications Terrestrial, satellite, and wireless transmissionsystems (major hubs, transmission/receptioncenters, etc.)
CharterCommunications
LVUSD & CityAntennas
City CERT Antenna(Kimberly Peak)
N/A N/A N/A Time WarnerBuilding AgouraRoad, Fiber Opticstrunk Line parallelto 101 freewayand La Tienda
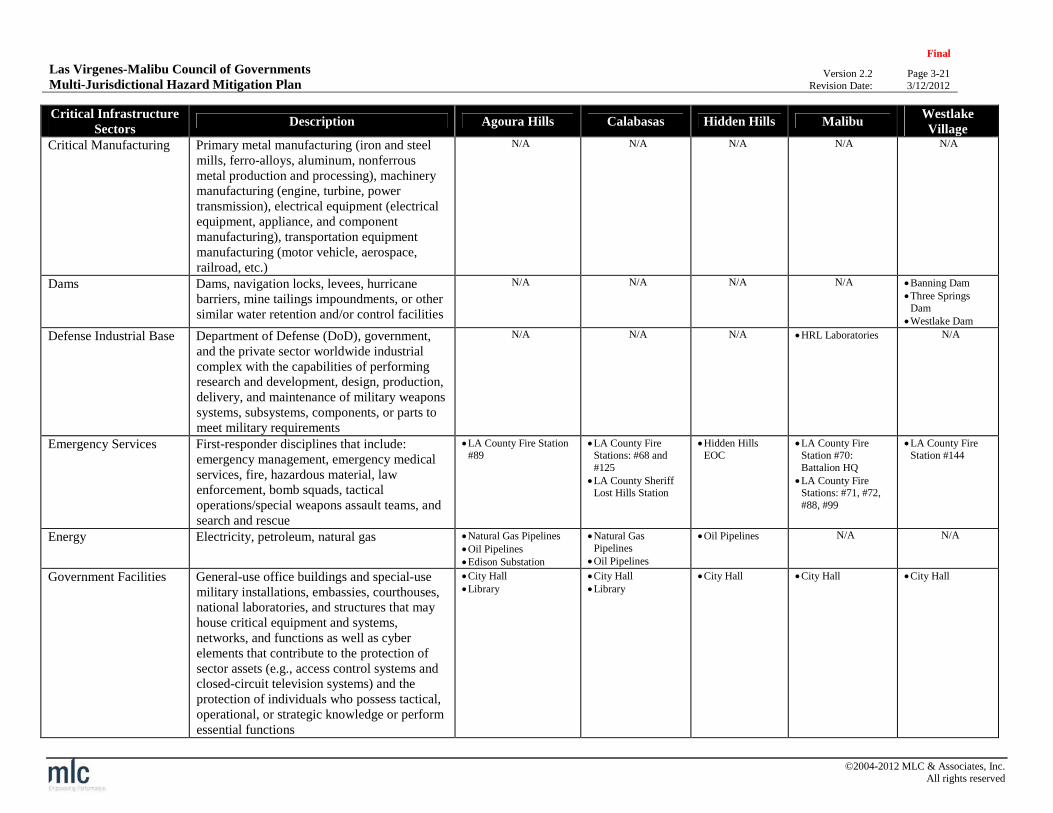
Las Virgenes-Malibu Council of GovernmentsMulti-Jurisdictional Hazard Mitigation Plan
Final
Version 2.2 Page 3-21Revision Date: 3/12/2012
©2004-2012 MLC & Associates, Inc.All rights reserved
Critical InfrastructureSectors
Description Agoura Hills Calabasas Hidden Hills MalibuWestlakeVillage
Critical Manufacturing Primary metal manufacturing (iron and steelmills, ferro-alloys, aluminum, nonferrousmetal production and processing), machinerymanufacturing (engine, turbine, powertransmission), electrical equipment (electricalequipment, appliance, and componentmanufacturing), transportation equipmentmanufacturing (motor vehicle, aerospace,railroad, etc.)
N/A N/A N/A N/A N/A
Dams Dams, navigation locks, levees, hurricanebarriers, mine tailings impoundments, or othersimilar water retention and/or control facilities
N/A N/A N/A N/A Banning DamThree Springs
DamWestlake Dam
Defense Industrial Base Department of Defense (DoD), government,and the private sector worldwide industrialcomplex with the capabilities of performingresearch and development, design, production,delivery, and maintenance of military weaponssystems, subsystems, components, or parts tomeet military requirements
N/A N/A N/A HRL Laboratories N/A
Emergency Services First-responder disciplines that include:emergency management, emergency medicalservices, fire, hazardous material, lawenforcement, bomb squads, tacticaloperations/special weapons assault teams, andsearch and rescue
LA County Fire Station#89
LA County FireStations: #68 and#125LA County Sheriff
Lost Hills Station
Hidden HillsEOC
LA County FireStation #70:Battalion HQLA County Fire
Stations: #71, #72,#88, #99
LA County FireStation #144
Energy Electricity, petroleum, natural gas Natural Gas PipelinesOil PipelinesEdison Substation
Natural GasPipelinesOil Pipelines
Oil Pipelines N/A N/A
Government Facilities General-use office buildings and special-usemilitary installations, embassies, courthouses,national laboratories, and structures that mayhouse critical equipment and systems,networks, and functions as well as cyberelements that contribute to the protection ofsector assets (e.g., access control systems andclosed-circuit television systems) and theprotection of individuals who possess tactical,operational, or strategic knowledge or performessential functions
City HallLibrary
City HallLibrary
City Hall City Hall City Hall

Las Virgenes-Malibu Council of GovernmentsMulti-Jurisdictional Hazard Mitigation Plan
Final
Version 2.2 Page 3-22Revision Date: 3/12/2012
©2004-2012 MLC & Associates, Inc.All rights reserved
Critical InfrastructureSectors
Description Agoura Hills Calabasas Hidden Hills MalibuWestlakeVillage
Information Technology Public and private sector information systemsincluding the Internet
N/A N/A N/A City Hall N/A
National Monumentsand Icons
Listed in the National Register of HistoricPlaces, List of National Historic Landmarks,icons, or other recognized physical structures,objects, or geographic sites
Reyes Adobe HistoricalSite
N/A N/A N/A N/A
Nuclear Reactors,Materials, and Waste
Nuclear power plants; non-power nuclearreactors used for research, testing, andtraining; nuclear materials used in medical,industrial, and academic settings; nuclear fuelfabrication facilities; decommissioningreactors; and the transportation, storage, anddisposal of nuclear material and waste
N/A N/A N/A N/A N/A
Postal & Shipping High volume processing facilities, deliveryunits, collection locations, retail operations,transport vehicles, postal/delivery informationand communications networks
N/A N/A N/A N/A N/A
Healthcare and PublicHealth
Public and private hospitals and healthcarefacilities
N/A N/A N/A N/A N/A
Transportation Aviation, highways, maritime transportation,mass transit, pipeline systems, and rail
101 FreewayPipelines (see Energy)
101 FreewayNatural Gas and Oil
Pipelines (seeEnergy)
101 Freeway Highway 1 PCH 101 Freeway
Water Drinking water and waste water Water Storage Tanks Las Virgenes MalibuWD HQ
N/A Water StorageTanks
Three SpringsReservoir
Other Other locations not otherwise defined N/A Round MeadowElementary School(not city owned)
N/A N/A N/A
Table 57: Critical Facilities and Infrastructure Matrix