Embed Size (px)
Citation preview

2016 Community Report
Las Vegas
http://tru.unm.edu/Crash-Reports/Community-Reports/
For the purposes of this report, data are compiled by the University of New Mexico, Geospatial and Population Studies, Traffic
Research Unit (TRU), on behalf of the New Mexico Department of Transportation (NMDOT). Data in this report may differ from that
in other data sources, such as the Federal Fatality Analysis Reporting System (FARS), due to the timing of publications and rules for
how data are compiled and maintained in Federal vs. State databases. If you have questions regarding this report, please contact the
Traffic Safety Division at 505-827-0427.
Produced for the New Mexico Department of Transportation, Traffic Safety Division, Traffic Records Bureau,
Under Contract 5801 by the University of New Mexico, Geospatial and Population Studies, Traffic Research Unit
Distributed in compliance with New Mexico Statute 66-7-214as a reference source regarding New Mexico traffic crashes
12/20/2017
Page 1

Las VegasCommunity Report
Sources
Aggravated DWI – A driver arrested for 1) driving with a BAC of 0.16 or higher, 2) driving under the influence of alcohol
or drugs and causing bodily injury to a human being as a result, or 3) driving under the influence of alcohol or drugs and
refusing to submit to a BAC test at the time of arrest for DWI.
Alcohol-involved Crash – A crash for which the Uniform Crash Report indicated that 1) a DWI citation was issued, 2)
alcohol was a contributing factor, or 3) a person in control of a vehicle (including a pedestrian or pedalcyclist) was
suspected of being under the influence of alcohol.
Alcohol-involved Driver – A person in control of a vehicle who was cited for DWI or indicated on the Uniform Crash
Report as being either suspected or determined by testing to be under the influence of alcohol. There can be multiple
alcohol-involved drivers in a single alcohol-involved crash.
Crash – A reported incident on a public roadway involving one or more motor vehicles that resulted in death, personal
injury, or at least $500 in property damage. Crashes on private property (such as a parking lot) are not included.
DWI Arrest (Citation) – In this report, a DWI arrest (a.k.a. a DWI citation) is a driver arrested for either DWI or
aggravated DWI. New Mexico’s legal limit for presumption of driving while intoxicated (DWI) is 0.08 for non-
commercial drivers older than 21 years of age, 0.04 for commercial vehicle drivers, and 0.02 for drivers younger than
21 years of age.
DWI Conviction – A driver convicted of driving under the intoxicating influence of alcohol, narcotics, or pathogenic
drugs, including aggravated DWI.
Fatal Crash – A crash in which at least one person was killed. More than one person can be killed in a single fatal crash.
Fatalities – The number of people killed in a crash. The terms “killed” and “deaths” are synonymous with “fatalities.” A
fatality is crash-related if it occurs at the time of the crash or if the person(s) involved in the crash dies within 30 days.
Injury Crash – A reported crash in which at least one person was injured. Injury crashes involve at least one suspected
serious injury (Class A), suspected minor injury (Class B), or possible injury (Class C). Fatal crashes are not included.
Missing Data – An indication that the applicable field on the UCR form was left blank or contained an invalid code.
Starting with crashes that occurred in 2012, improvements in the identification of missing data in the NMDOT crash
database led to an increase in the reported amount of missing data.
Pedalcyclist – A person riding a mechanism of transport that is powered solely by pedals (a.k.a. bicyclist).
Pedestrian – A person on foot, walking, running, jogging, hiking, sitting or lying down who is involved in a motor vehicle
traffic crash.
Definitions
Crash Data – New Mexico Department of Transportation, Traffic Safety Division, Traffic Records Bureau, Traffic Crash
Database, as of the report date below. Crash data are compiled using NMDOT Uniform Crash Reports (UCR), submitted
by law enforcement agencies in the state, for any incident on a public roadway involving one or more motor vehicles
that resulted in death, injury, or at least $500 in property damage. These reports are processed by the NMDOT Traffic
Records Bureau and analyzed by the University of New Mexico, Geospatial and Population Studies, Traffic Research
Unit (TRU).
DWI Citation Tracking System (CTS) – New Mexico Taxation and Revenue Department (NM TRD), Motor Vehicle Division
(MVD), DWI Citation Tracking System (CTS), as of December 2017. Repeat offenders are identified by the combination
of account key, arrest date, and citation number. County data are based upon the county where the arrest took place.
City data are based upon the city where the offender resides.
Urban Areas – New Mexico Department of Transportation, Asset Management and Planning, 2010 U.S. Census
Urbanized Area Boundaries, NMDOT-Adjusted, and U.S. Census Urban Clusters, August 21, 2013. In crashes before
2013, “urban” was defined as a town or city with a population of at least 2,500 people.
Produced for the NMDOT, Traffic Safety Division, Traffic Records Bureau, under Contract 5801
by the University of New Mexico, Geospatial and Population Studies, Traffic Research Unit
12/20/2017
Page 2

Las VegasCommunity Report
2007 1 67 212 280 1 9 7 17
2008 5 70 209 284 3 11 11 25
2009 1 65 269 335 1 5 11 17
2010 2 64 239 305 1 6 13 20
2011 2 58 319 379 1 7 17 25
2012 3 53 251 307 3 4 15 22
2013 0 59 208 267 0 11 16 27
2014 1 77 246 324 1 8 9 18
2015 1 91 283 375 0 9 11 20
2016 1 87 249 337 1 5 9 15
Figure 1: Alcohol-involved Fatal and Injury Crashes Compared with
Non-alcohol-involved Fatal and Injury Crashes in Las Vegas, 2007-2016
Table 1: Total Crashes and Alcohol-involved Crashes by Crash Severity in Las Vegas, 2007-2016
TotalYear
Total Crashes Alcohol-involved Crashes
Fatal Injury
Property
Damage
Only
Total Fatal Injury
Property
Damage
Only
10 14 6 7 8 7 11 9 9 6
58 61
60 59 52
49 48 69
83 82
68 75
66 66 60
56 59
78
92 88
0
30
60
90
120
2007 2008 2009 2010 2011 2012 2013 2014 2015 2016
Alcohol-involved Fatal and Injury Crashes Non-alcohol-involved Fatal and Injury Crashes
Produced for the NMDOT, Traffic Safety Division, Traffic Records Bureau, under Contract 5801
by the University of New Mexico, Geospatial and Population Studies, Traffic Research Unit
12/20/2017
Page 3

Las VegasCommunity Report
2012 2013 2014 2015 2016
January 21 22 21 36 33 27
February 15 21 20 25 30 22
March 20 19 29 38 29 27
April 36 16 28 24 21 25
May 30 27 32 24 29 28
June 31 20 26 25 23 25
July 23 26 23 30 29 26
August 21 25 15 24 27 22
September 24 32 23 45 33 31
October 34 26 33 23 33 30
November 23 13 43 41 18 28
December 29 20 31 40 32 30
Total Crashes 307 267 324 375 337 322
2012 2013 2014 2015 2016
January 2 4 3 1 3 3
February 3 2 2 1 1 2
March 2 0 1 4 2 2
April 3 2 3 1 1 2
May 2 4 2 2 0 2
June 1 2 0 0 3 1
July 0 5 2 3 0 2
August 0 3 0 1 1 1
September 3 1 1 1 1 1
October 1 2 1 3 1 2
November 1 0 2 1 1 1
December 4 2 1 2 1 2
Total Crashes 22 27 18 20 15 20
Table 2: Crashes by Month in Las Vegas, 2012-2016
Table 3: Alcohol-involved Crashes by Month in Las Vegas, 2012-2016
MonthAlcohol-involved Crashes 5-Year
Average
MonthCrashes 5-Year
Average
Produced for the NMDOT, Traffic Safety Division, Traffic Records Bureau, under Contract 5801
by the University of New Mexico, Geospatial and Population Studies, Traffic Research Unit
12/20/2017
Page 4

Las VegasCommunity Report
Figure 3: Alcohol-involved Crashes by Hour in Las Vegas, 2016
Figure 2: Crashes by Hour in Las Vegas, 2016
* In 2016, Las Vegas had 0 alcohol-involved crashes for which hour data were missing.
* In 2016, Las Vegas had 8 crashes for which hour data were missing.
5 4 4 2 1 2
4
14 15 12
23
17
29 31
29 27
23 23
27
14
7 6 3
7
0
10
20
30
40
50
12 a.m. 2 a.m. 4 a.m. 6 a.m. 8 a.m. 10 a.m. 12 p.m. 2 p.m. 4 p.m. 6 p.m. 8 p.m. 10 p.m.
1 1 1
0 0 0 0 0 0
1 1
0 0 0
2
1
0
1
2
0
1 1
0
2
0
1
2
3
4
5
12 a.m. 2 a.m. 4 a.m. 6 a.m. 8 a.m. 10 a.m. 12 p.m. 2 p.m. 4 p.m. 6 p.m. 8 p.m. 10 p.m.
Produced for the NMDOT, Traffic Safety Division, Traffic Records Bureau, under Contract 5801
by the University of New Mexico, Geospatial and Population Studies, Traffic Research Unit
12/20/2017
Page 5

Las VegasCommunity Report
2012 2013 2014 2015 2016
Sunday 7 7 0 0 1 3
Monday 1 5 3 2 2 3
Tuesday 1 4 1 3 1 2
Wednesday 0 4 2 3 3 2
Thursday 1 2 4 3 3 3
Friday 12 3 2 5 3 5
Saturday 0 2 6 4 2 3
Total Crashes 22 27 18 20 15 20
2012 2013 2014 2015 2016
Sunday 4 5 9 6 11 7
Monday 9 13 10 18 10 12
Tuesday 13 9 18 12 12 13
Wednesday 5 8 8 21 15 11
Thursday 9 11 7 14 12 11
Friday 12 10 16 14 16 14
Saturday 4 3 10 7 12 7
Total Crashes 56 59 78 92 88 75
2012 2013 2014 2015 2016
Sunday 0 1 1 0 1 1
Monday 2 2 0 1 0 1
Tuesday 3 1 0 1 0 1
Wednesday 1 3 2 0 2 2
Thursday 1 0 1 1 1 1
Friday 3 3 1 1 1 2
Saturday 1 0 1 0 2 1
Total Crashes 11 10 6 4 7 8
Day of WeekPedestrian and Pedalcyclist Crashes 5-Year
Average
Table 5: Fatal and Injury Crashes by Day of Week in Las Vegas, 2012-2016
Day of WeekFatal and Injury Crashes 5-Year
Average
Table 4: Alcohol-involved Crashes by Day of Week in Las Vegas, 2012-2016
Day of WeekAlcohol-involved Crashes 5-Year
Average
Table 6: Pedestrian and Pedalcyclist Crashes by Day of Week in Las Vegas, 2012-2016
Produced for the NMDOT, Traffic Safety Division, Traffic Records Bureau, under Contract 5801
by the University of New Mexico, Geospatial and Population Studies, Traffic Research Unit
12/20/2017
Page 6
Las VegasCommunity Report
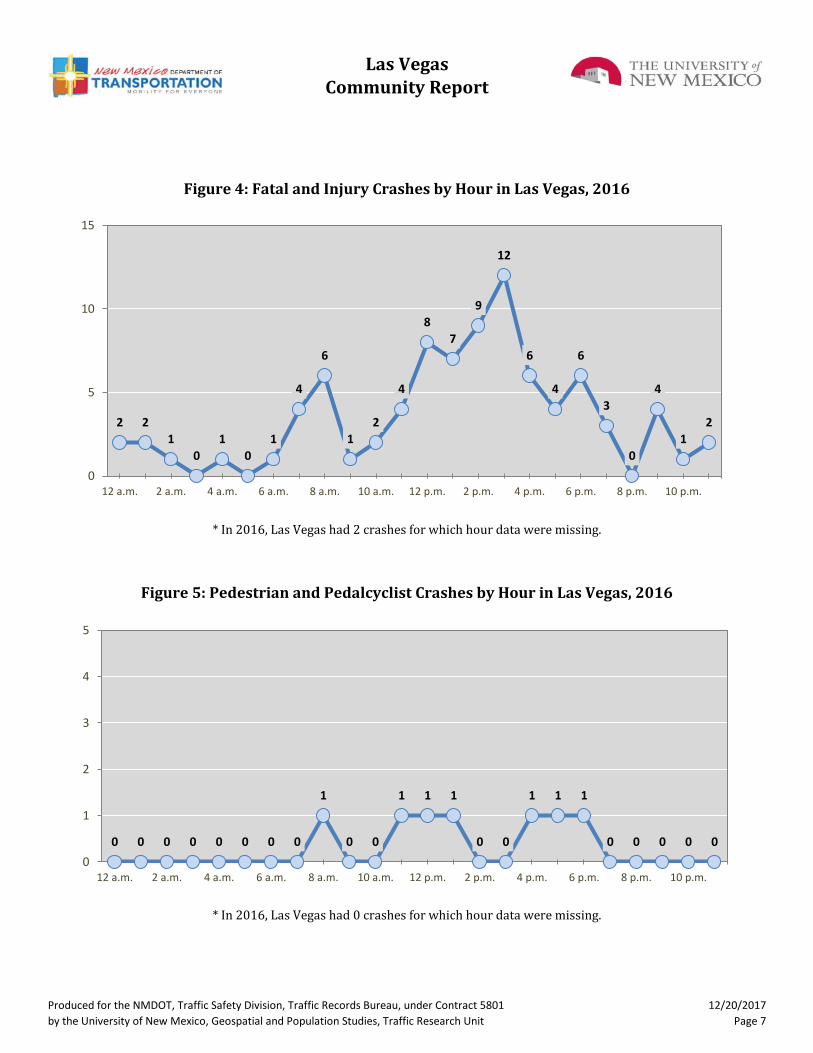
Figure 5: Pedestrian and Pedalcyclist Crashes by Hour in Las Vegas, 2016
Figure 4: Fatal and Injury Crashes by Hour in Las Vegas, 2016
* In 2016, Las Vegas had 2 crashes for which hour data were missing.
* In 2016, Las Vegas had 0 crashes for which hour data were missing.
2 2
1
0
1
0
1
4
6
1
2
4
8
7
9
12
6
4
6
3
0
4
1
2
0
5
10
15
12 a.m. 2 a.m. 4 a.m. 6 a.m. 8 a.m. 10 a.m. 12 p.m. 2 p.m. 4 p.m. 6 p.m. 8 p.m. 10 p.m.
0 0 0 0 0 0 0 0
1
0 0
1 1 1
0 0
1 1 1
0 0 0 0 0
0
1
2
3
4
5
12 a.m. 2 a.m. 4 a.m. 6 a.m. 8 a.m. 10 a.m. 12 p.m. 2 p.m. 4 p.m. 6 p.m. 8 p.m. 10 p.m.
Produced for the NMDOT, Traffic Safety Division, Traffic Records Bureau, under Contract 5801
by the University of New Mexico, Geospatial and Population Studies, Traffic Research Unit
12/20/2017
Page 7
Las VegasCommunity Report
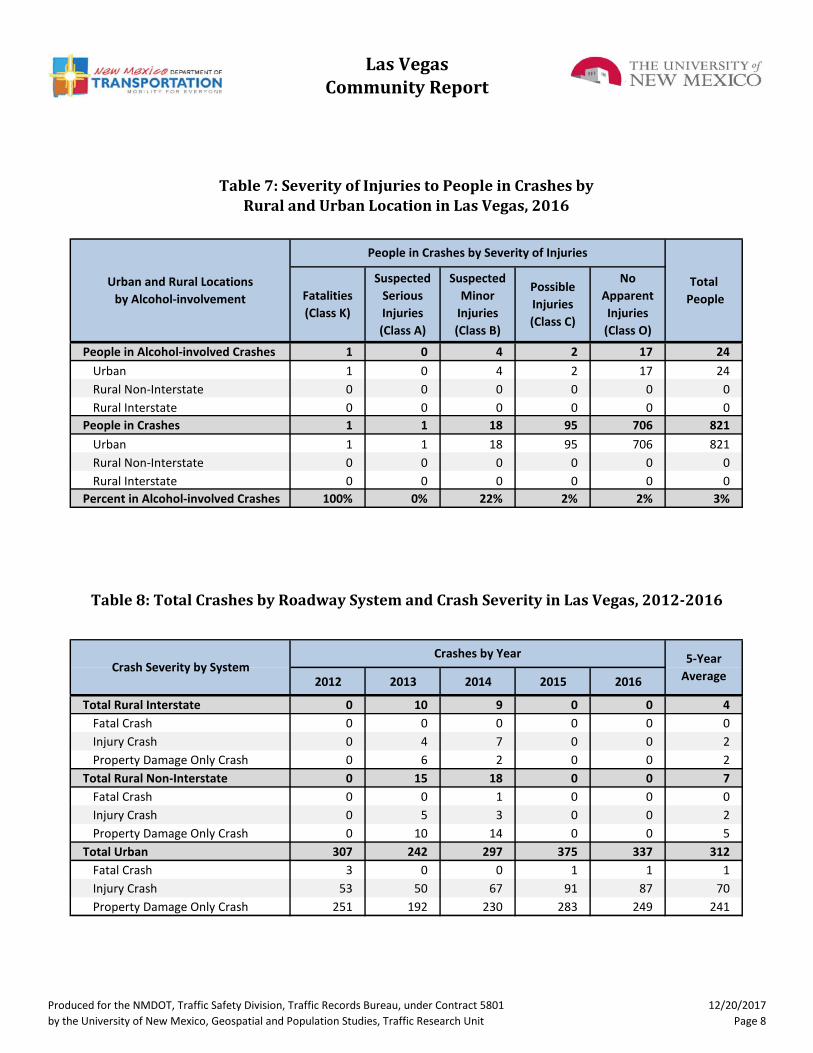
People in Alcohol-involved Crashes 1 0 4 2 17 24
Urban 1 0 4 2 17 24
Rural Non-Interstate 0 0 0 0 0 0
Rural Interstate 0 0 0 0 0 0
People in Crashes 1 1 18 95 706 821
Urban 1 1 18 95 706 821
Rural Non-Interstate 0 0 0 0 0 0
Rural Interstate 0 0 0 0 0 0
Percent in Alcohol-involved Crashes 100% 0% 22% 2% 2% 3%
2012 2013 2014 2015 2016
Total Rural Interstate 0 10 9 0 0 4
Fatal Crash 0 0 0 0 0 0
Injury Crash 0 4 7 0 0 2
Property Damage Only Crash 0 6 2 0 0 2
Total Rural Non-Interstate 0 15 18 0 0 7
Fatal Crash 0 0 1 0 0 0
Injury Crash 0 5 3 0 0 2
Property Damage Only Crash 0 10 14 0 0 5
Total Urban 307 242 297 375 337 312
Fatal Crash 3 0 0 1 1 1
Injury Crash 53 50 67 91 87 70
Property Damage Only Crash 251 192 230 283 249 241
Table 7: Severity of Injuries to People in Crashes by Rural and Urban Location in Las Vegas, 2016
Fatalities
(Class K)
Suspected
Serious
Injuries
(Class A)
Suspected
Minor
Injuries
(Class B)
Possible
Injuries
(Class C)
No
Apparent
Injuries
(Class O)
People in Crashes by Severity of Injuries
Crash Severity by SystemCrashes by Year 5-Year
Average
Urban and Rural Locations
by Alcohol-involvement
Total
People
Table 8: Total Crashes by Roadway System and Crash Severity in Las Vegas, 2012-2016
Produced for the NMDOT, Traffic Safety Division, Traffic Records Bureau, under Contract 5801
by the University of New Mexico, Geospatial and Population Studies, Traffic Research Unit
12/20/2017
Page 8

Las VegasCommunity Report
2012 2013 2014 2015 2016
Animal 3 5 9 6 5 6
Fixed Object 24 13 36 28 27 26
Other (Non-Collision) 3 2 5 2 3 3
Other (Object) 4 10 9 11 5 8
Other Vehicle 204 170 220 277 233 221
Overturn/Rollover 11 18 14 3 5 10
Parked Vehicle 36 29 15 24 20 25
Pedalcyclist 6 2 3 2 1 3
Pedestrian 7 7 3 3 6 5
Railroad Train 0 0 0 0 0 0
Rollover 0 0 0 3 2 1
Vehicle on Other Road 5 5 3 4 3 4
Missing Data 4 6 7 12 27 11
Total Crashes 307 267 324 375 337 322
2012 2013 2014 2015 2016
Bus 1 3 6 0 2 2
Motorcycle 6 9 4 8 5 6
Passenger 282 224 258 334 305 281
Pedalcyclist 5 3 3 2 1 3
Pedestrian 7 8 3 2 7 5
Pickup 155 103 95 120 126 120
Semi 13 6 12 11 9 10
Van/SUV/4WD 73 62 97 88 110 86
Other Vehicle 10 25 29 49 8 24
Missing Data 27 53 99 103 69 70
Total Vehicles 579 496 606 717 642 6081 Pedestrians and pedalcyclists are counted as non-motorized vehicles, when involved in a crash with
a motor vehicle. See Page 17 for data on drivers of non-motorized vehicles in crashes (i.e.
pedestrians and pedalcyclists).
Vehicle Type1Vehicles in Crashes by Vehicle Type 5-Year
Average
Table 9: Total Crashes by Crash Classification in Las Vegas, 2012-2016
Crash ClassificationTotal Crashes by Year 5-Year
Average
Table 10: Vehicles in Crashes by Vehicle Type in Las Vegas, 2012-2016
Produced for the NMDOT, Traffic Safety Division, Traffic Records Bureau, under Contract 5801
by the University of New Mexico, Geospatial and Population Studies, Traffic Research Unit
12/20/2017
Page 9
Las VegasCommunity Report
BusMotor-
cyclePassenger Pickup Semi
Van
4WD
SUV
Other
Vehicle
Missing
Data
15-19 0 1 33 14 0 10 5 6 69
20-24 0 0 50 11 0 9 0 8 78
25-29 0 2 30 13 0 9 0 1 55
30-34 0 1 25 5 1 6 0 0 38
35-39 0 0 12 6 0 13 0 2 33
40-44 0 1 19 12 2 9 0 2 45
45-49 1 0 16 9 0 1 1 5 33
50-54 0 0 9 9 1 10 0 2 31
55-59 0 0 17 7 4 8 0 3 39
60-64 0 0 17 5 0 5 1 1 29
65-69 1 0 17 10 0 10 0 3 41
70 + 0 0 25 12 0 8 1 5 51
Missing Data 0 0 35 13 1 12 0 31 92
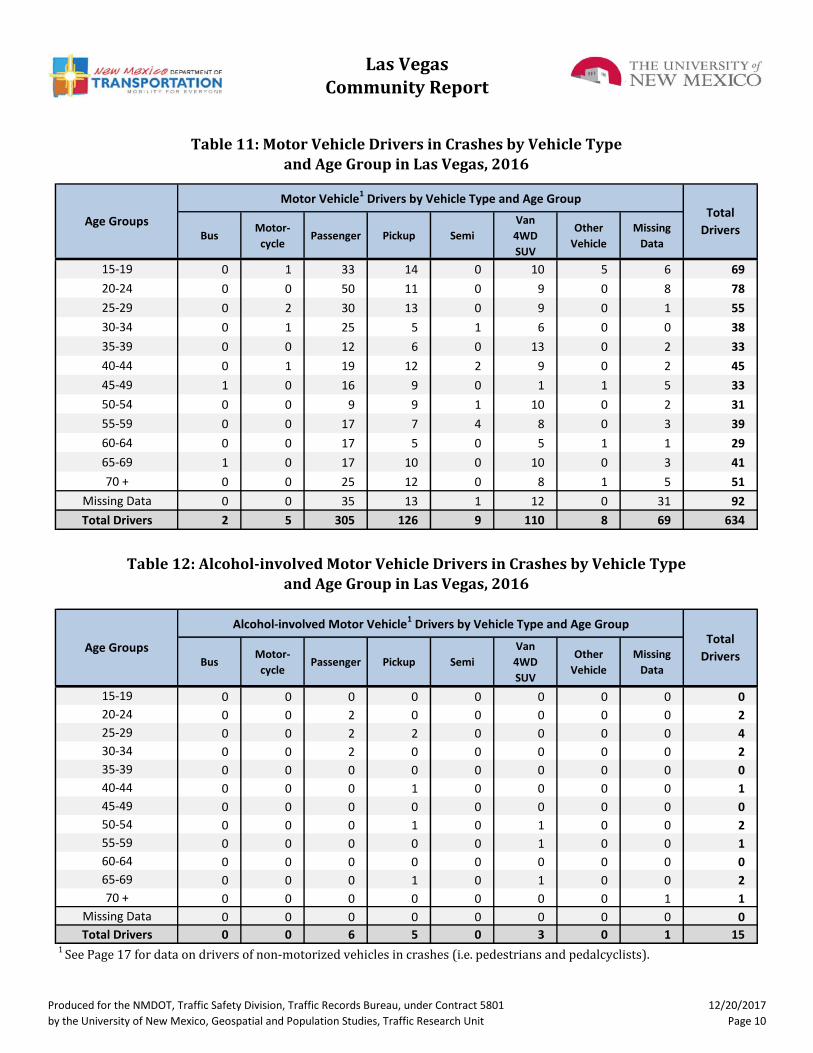
Total Drivers 2 5 305 126 9 110 8 69 634
BusMotor-
cyclePassenger Pickup Semi
Van
4WD
SUV
Other
Vehicle
Missing
Data
15-19 0 0 0 0 0 0 0 0 0
20-24 0 0 2 0 0 0 0 0 2
25-29 0 0 2 2 0 0 0 0 4
30-34 0 0 2 0 0 0 0 0 2
35-39 0 0 0 0 0 0 0 0 0
40-44 0 0 0 1 0 0 0 0 1
45-49 0 0 0 0 0 0 0 0 0
50-54 0 0 0 1 0 1 0 0 2
55-59 0 0 0 0 0 1 0 0 1
60-64 0 0 0 0 0 0 0 0 0
65-69 0 0 0 1 0 1 0 0 2
70 + 0 0 0 0 0 0 0 1 1
Missing Data 0 0 0 0 0 0 0 0 0
Total Drivers 0 0 6 5 0 3 0 1 15
Age Groups
Alcohol-involved Motor Vehicle1 Drivers by Vehicle Type and Age GroupTotal
Drivers
1 See Page 17 for data on drivers of non-motorized vehicles in crashes (i.e. pedestrians and pedalcyclists).
Table 11: Motor Vehicle Drivers in Crashes by Vehicle Type and Age Group in Las Vegas, 2016
Age Groups
Motor Vehicle1 Drivers by Vehicle Type and Age GroupTotal
Drivers
Table 12: Alcohol-involved Motor Vehicle Drivers in Crashes by Vehicle Type and Age Group in Las Vegas, 2016
Produced for the NMDOT, Traffic Safety Division, Traffic Records Bureau, under Contract 5801
by the University of New Mexico, Geospatial and Population Studies, Traffic Research Unit
12/20/2017
Page 10
Las VegasCommunity Report
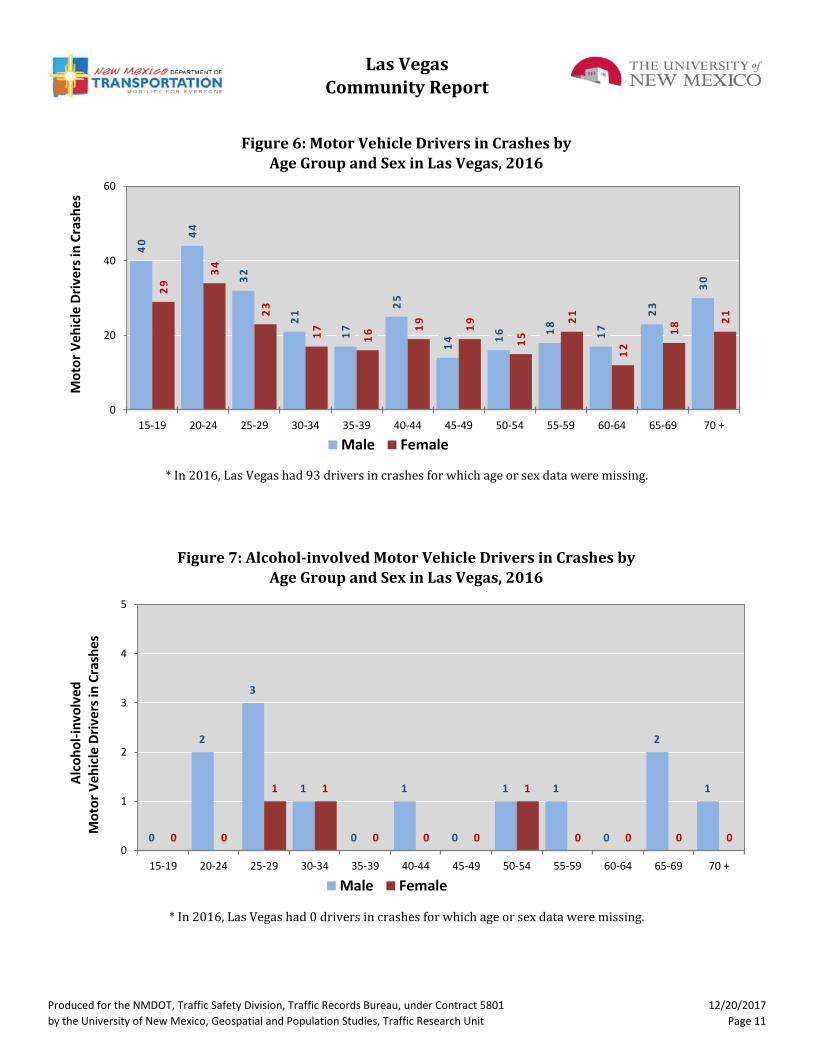
Figure 7: Alcohol-involved Motor Vehicle Drivers in Crashes by Age Group and Sex in Las Vegas, 2016
Figure 6: Motor Vehicle Drivers in Crashes by Age Group and Sex in Las Vegas, 2016
* In 2016, Las Vegas had 93 drivers in crashes for which age or sex data were missing.
* In 2016, Las Vegas had 0 drivers in crashes for which age or sex data were missing.
40
44
32
21
17
25
14
16
18
17
23
30
29
34
23
17
16
19
19
15
21
12
18
21
0
20
40
60
15-19 20-24 25-29 30-34 35-39 40-44 45-49 50-54 55-59 60-64 65-69 70 +
Mo
tor
Veh
icle
Dri
vers
in C
rash
es
Male Female
0
2
3
1
0
1
0
1 1
0
2
1
0 0
1 1
0 0 0
1
0 0 0 0 0
1
2
3
4
5
15-19 20-24 25-29 30-34 35-39 40-44 45-49 50-54 55-59 60-64 65-69 70 +
Alc
oh
ol-
invo
lved
M
oto
r V
ehic
le D
rive
rs in
Cra
shes
Male Female
Produced for the NMDOT, Traffic Safety Division, Traffic Records Bureau, under Contract 5801
by the University of New Mexico, Geospatial and Population Studies, Traffic Research Unit
12/20/2017
Page 11

Las VegasCommunity Report
2012 2013 2014 2015 2016
15 0 0 0 0 0 0
16 0 0 0 0 0 0
17 3 0 1 0 0 4
18 0 0 0 0 0 0
19 1 0 0 2 0 3
20 0 3 0 2 1 6
Total Drivers 4 3 1 4 1 13
Male Female Male Female
15 5 2 7 8% 0 0 0 0%
16 4 3 7 8% 0 0 0 0%
17 11 7 18 20% 0 0 0 0%
18 13 10 23 26% 0 0 0 0%
19 7 7 14 16% 0 0 0 0%
20 13 7 20 22% 1 0 1 100%
Total Drivers 53 36 89 100% 1 0 1 100%
1 For analysis of drivers under age 21, when the driver age or sex are not identified on the crash report (typically hit-
and-run drivers), the driver data are considered unreliable and are excluded from the analysis.
Table 13: Alcohol-involved Motor Vehicle Drivers Under 21 (Ages 15-20) in Crashes in Las Vegas, 2012-2016
Table 14: Motor Vehicle Drivers Under 21 (Ages 15-20) in Crashes by Age, Sex and Alcohol-involvement in Las Vegas, 2016
Age1Year 5-Year
Total
Sex SexAge1 Percent of
Total
Total
Drivers
Total Drivers Alcohol-involved Drivers
Total
Drivers
Percent of
Total
Produced for the NMDOT, Traffic Safety Division, Traffic Records Bureau, under Contract 5801
by the University of New Mexico, Geospatial and Population Studies, Traffic Research Unit
12/20/2017
Page 12
Las VegasCommunity Report
Human 2 132 370 504
Driver Inattention 0 48 132 180
Failed to Yield Right of Way 0 23 44 67
Following Too Closely 0 14 41 55
Other Improper Driving 0 7 24 31
Excessive Speed 1 7 15 23
Improper Backing 0 1 19 20
Made Improper Turn 0 3 16 19
Speed Too Fast for Conditions 0 6 11 17
Alcohol Involved 1 5 9 15
Improper Overtaking 0 1 13 14
Passed Stop Sign 0 4 10 14
Avoid No Contact - Vehicle 0 4 8 12
Drove Left Of Center 0 3 6 9
Improper Lane Change 0 1 7 8
Disregarded Traffic Signal 0 1 6 7
Drug Involved 0 1 4 5
Vehicle Skidded Before Brake 0 0 3 3
Pedestrian Error 0 2 0 2
Avoid No Contact - Other 0 1 0 1
Driverless Moving Vehicle 0 0 1 1
Failed to Yield to Police Vehicle 0 0 1 1
Cell Phone 0 0 0 0
Failed to Yield to Emergency Vehicle 0 0 0 0
High Speed Pursuit 0 0 0 0
Texting 0 0 0 0
Vehicle 0 1 8 9
Inadequate Brakes 0 1 4 5
Defective Steering 0 0 2 2
Other Mechanical Defect 0 0 2 2
Defective Tires 0 0 0 0
Environment 0 1 1 2
Road Defect 0 0 1 1
Traffic Control Not Functioning 0 1 0 1
Low Visibility Due to Smoke 0 0 0 0
Other 0 76 220 296
None 0 48 148 196
Other - No Driver Error 0 28 72 100
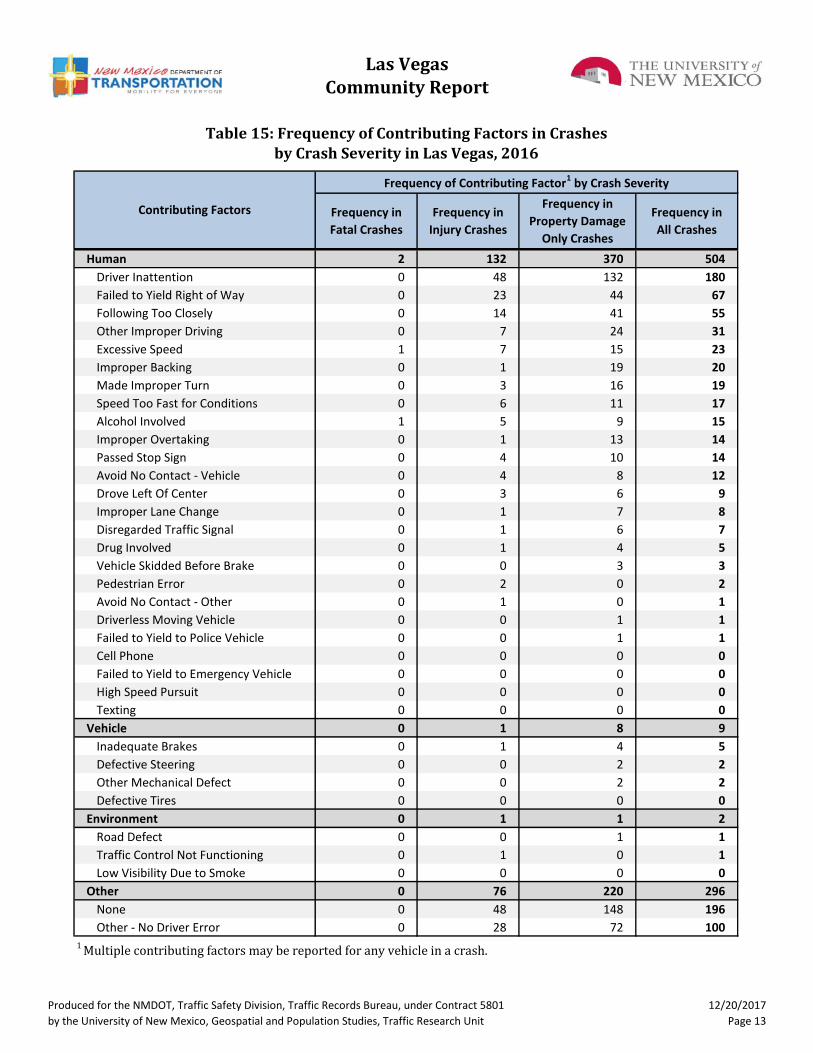
Table 15: Frequency of Contributing Factors in Crashesby Crash Severity in Las Vegas, 2016
1 Multiple contributing factors may be reported for any vehicle in a crash.
Contributing Factors Frequency in
Fatal Crashes
Frequency in
Injury Crashes
Frequency in
Property Damage
Only Crashes
Frequency in
All Crashes
Frequency of Contributing Factor1 by Crash Severity
Produced for the NMDOT, Traffic Safety Division, Traffic Records Bureau, under Contract 5801
by the University of New Mexico, Geospatial and Population Studies, Traffic Research Unit
12/20/2017
Page 13
Las VegasCommunity Report
Animal 0 0 0 0 7 7
Fixed Object 0 1 2 5 29 37
Other (Non-Collision) 0 0 1 0 2 3
Other (Object) 0 0 0 0 8 8
Other Vehicle 0 0 5 68 535 608
Overturn/Rollover 0 0 4 2 4 10
Parked Vehicle 0 0 0 1 43 44
Pedalcyclist 0 0 0 1 1 2
Pedestrian 0 0 1 6 8 15
Railroad Train 0 0 0 0 0 0
Rollover 1 0 0 2 0 3
Vehicle on Other Road 0 0 4 0 7 11
Missing Data 0 0 1 10 62 73
Total People 1 1 18 95 706 821
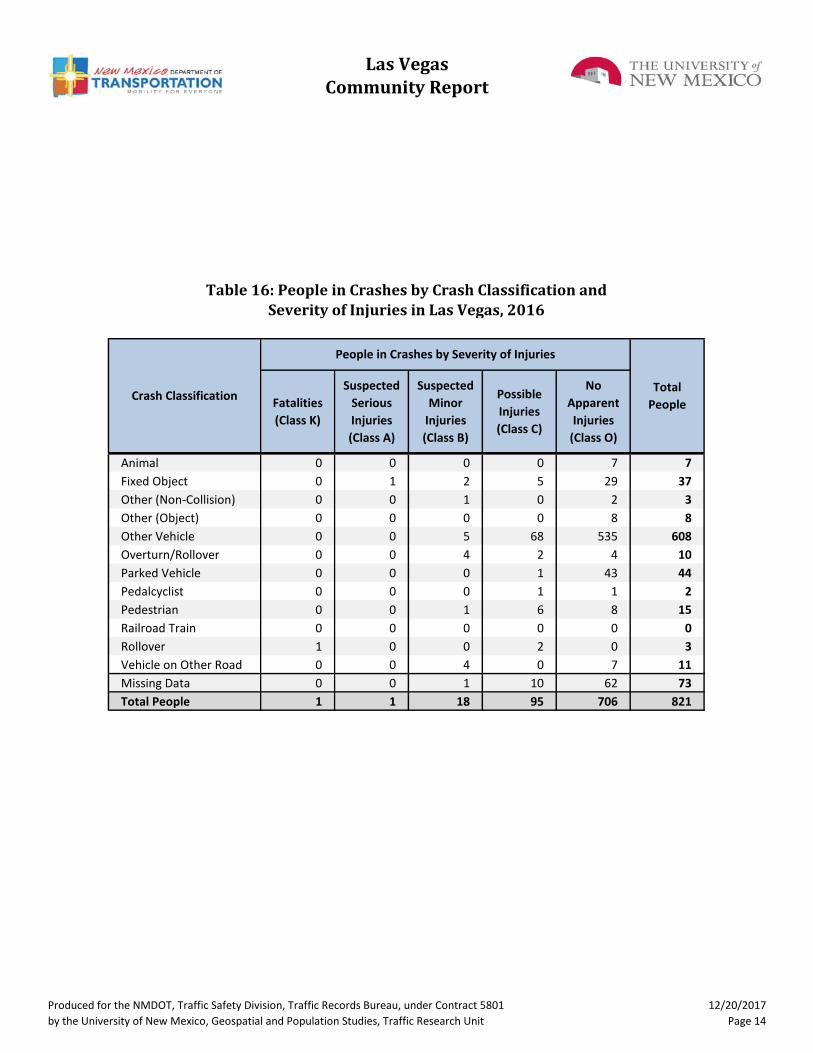
Table 16: People in Crashes by Crash Classification and Severity of Injuries in Las Vegas, 2016
People in Crashes by Severity of Injuries
Crash ClassificationTotal
PeopleFatalities
(Class K)
Suspected
Serious
Injuries
(Class A)
Suspected
Minor
Injuries
(Class B)
Possible
Injuries
(Class C)
No
Apparent
Injuries
(Class O)
Produced for the NMDOT, Traffic Safety Division, Traffic Records Bureau, under Contract 5801
by the University of New Mexico, Geospatial and Population Studies, Traffic Research Unit
12/20/2017
Page 14

Las VegasCommunity Report
MalePercent of
MaleFemale
Percent of
Female
0-4 0 0% 0 0% 0
5-9 0 0% 0 0% 0
10-14 0 0% 0 0% 0
15-19 0 0% 0 0% 0
20-24 2 100% 0 0% 2
25-29 0 0% 1 100% 1
30-34 0 0% 0 0% 0
35-39 0 0% 0 0% 0
40-44 0 0% 0 0% 0
45-49 0 0% 0 0% 0
50-54 0 0% 0 0% 0
55-59 0 0% 0 0% 0
60-64 0 0% 0 0% 0
65-69 0 0% 0 0% 0
70 + 0 0% 0 0% 0
Missing Data 0 0% 0 0% 0
Total People 2 100% 1 100% 3
Figure 8: Seatbelt Use by People in Crashes with Fatal or Suspected Serious Injuries in Las Vegas, 2012-2016
1 People injured are in one of three categories: suspected serious injury, suspected minor injury, or possible injury.2 Excludes people in or on buses, heavy trucks, motorcycles, or ATVs.
Table 17: Killed or Injured Unbelted People in Crashes by Sex and Age Group in Las Vegas, 2016
Age Groups
Unbelted People Killed or Injured 1,2
Total
People
55%
100% 100%
50%
45%
100%
50%
0%
25%
50%
75%
100%
2012 2013 2014 2015 2016Percent Belted Percent Unbelted Percent Missing Data
Produced for the NMDOT, Traffic Safety Division, Traffic Records Bureau, under Contract 5801
by the University of New Mexico, Geospatial and Population Studies, Traffic Research Unit
12/20/2017
Page 15

Las VegasCommunity Report
Figure 9: People in Crashes by Age Group and Sex in Las Vegas, 2016
* In 2016, Las Vegas had 100 people in crashes for which age or sex data were missing.
* In 2016, Las Vegas had 3 people in alcohol-involved crashes for which age or sex data were missing.
Figure 10: People in Alcohol-involved Crashes by Age Group and Sex in Las Vegas, 2016
0
0
0
2
2
3
1
0
2
0
1
1
0
2
1
0
0
0
0
1
2
1
0
0
0
2
0
0
0
0
0
2
4
6
0-4 5-9 10-14 15-19 20-24 25-29 30-34 35-39 40-44 45-49 50-54 55-59 60-64 65-69 70 +
Pe
op
le in
Alc
oh
ol-
invo
lved
Cra
she
s
Male Female
16
11
12
56
54
36
23
18
29
16
18
18
19
23
34
9
9
8
40
48
32
20
18
25
22
20
24
14
22
27
0
25
50
75
0-4 5-9 10-14 15-19 20-24 25-29 30-34 35-39 40-44 45-49 50-54 55-59 60-64 65-69 70 +
Pe
op
le in
Cra
shes
Male Female
Produced for the NMDOT, Traffic Safety Division, Traffic Records Bureau, under Contract 5801
by the University of New Mexico, Geospatial and Population Studies, Traffic Research Unit
12/20/2017
Page 16

Las VegasCommunity Report
2012 2013 2014 2015 2016
0-4 1 0 0 0 0 1
5-9 0 2 1 1 1 5
10-14 2 2 2 0 1 7
15-19 4 0 1 0 1 6
20-24 3 0 0 0 1 4
25-29 1 1 0 0 1 3
30-34 0 0 0 1 0 1
35-39 0 0 0 0 0 0
40-44 0 0 0 0 0 0
45-49 0 0 1 0 0 1
50-54 0 0 0 1 0 1
55-59 1 0 0 1 1 3
60-64 0 1 0 0 1 2
65-69 0 1 0 0 0 1
70 + 0 0 1 0 1 2
Missing Data 0 4 0 0 0 4
Total People 12 11 6 4 8 41
Total Pedalcyclists 0 0 0 1 0 1
Involved 0 0 0 0 0 0
Not Involved 0 0 0 1 0 1
Total Pedestrians 0 0 1 6 0 7
Involved 0 0 0 0 0 0
Not Involved 0 0 1 6 0 7
Total People 0 0 1 7 0 8
1 Pedestrians and pedalcyclists are counted as non-motorized vehicles, when involved in a crash with a motor vehicle.
Table 18: Pedestrians and Pedalcyclists in Crashes by Age Group in Las Vegas, 2012-2016
Possible
Injuries
(Class C)
No
Apparent
Injury
(Class O)
Alcohol
Involvement
Pedestrians and Pedalcyclists1 in Crashes
Total
PeopleFatalities
(Class K)
Suspected
Serious
Injuries
(Class A)
Suspected
Minor
Injuries
(Class B)
Table 19: Pedestrians and Pedalcyclists in Crashes by Alcohol Involvement and Severity of Injuries in Las Vegas, 2016
Age GroupsPedestrians and Pedalcyclists1 in Crashes 5-Year
Total
People
Produced for the NMDOT, Traffic Safety Division, Traffic Records Bureau, under Contract 5801
by the University of New Mexico, Geospatial and Population Studies, Traffic Research Unit
12/20/2017
Page 17

Las VegasCommunity Report
Figure 11: DWI Arrests of Las Vegas Residents Throughout the State, Showing First and Repeat DWI Arrests, 2012-2016
Figure 12: DWI Convictions of Las Vegas Residents Throughout the State, Showing First and Repeat DWI Convictions, 2012-2016
*Values are based upon the year of the conviction.
*Values are based upon the year of the arrest.
50 44 37
24 28
54 53
49
42 25
104 97 86
66 53
0
40
80
120
2012 2013 2014 2015 2016
Co
nvi
ctio
ns
First DWI Convictions Repeat DWI Convictions Total DWI Convictions
61 57 46 40 43
77 80 78
73 54 138 137
124 113
97
0
50
100
150
2012 2013 2014 2015 2016
Arr
ests
First DWI Arrests Repeat DWI Arrests Total DWI Arrests
Produced for the NMDOT, Traffic Safety Division, Traffic Records Bureau, under Contract 5801
by the University of New Mexico, Geospatial and Population Studies, Traffic Research Unit
12/20/2017
Page 18

Las VegasCommunity Report
2012 2013 2014 2015 2016
Sunday 25 22 21 19 19 21
Monday 14 20 10 17 14 15
Tuesday 14 16 9 14 7 12
Wednesday 13 11 16 9 10 12
Thursday 12 12 22 11 10 13
Friday 26 23 17 18 16 20
Saturday 34 33 29 25 21 28
Total Arrests 138 137 124 113 97 122
Figure 13: DWI Arrests by Hour of Las Vegas Residents Throughout the State, 2016
* In 2016, Las Vegas had 9 arrests for which hour data were missing.
Table 20: DWI Arrests by Day of Week of Las Vegas Residents Throughout the State, 2012-2016
Day of WeekYear 5-Year
Average
10
12
7
0 0 1
0 0
2 2 1
4
2 2
5 6
1 1
3
1
6 5
6
11
0
6
12
18
12 a.m. 2 a.m. 4 a.m. 6 a.m. 8 a.m. 10 a.m. 12 p.m. 2 p.m. 4 p.m. 6 p.m. 8 p.m. 10 p.m.
Produced for the NMDOT, Traffic Safety Division, Traffic Records Bureau, under Contract 5801
by the University of New Mexico, Geospatial and Population Studies, Traffic Research Unit
12/20/2017
Page 19

Las VegasCommunity Report
2012 2013 2014 2015 2016
15-19 8 2 3 4 7
20-24 19 22 16 11 10
25-29 13 11 6 5 8
30-34 6 7 6 5 4
35-39 4 2 2 4 3
40-44 3 4 6 2 1
45-49 4 4 2 3 1
50-54 3 2 0 2 4
55-59 0 1 2 1 2
60-64 0 1 2 1 1
65-69 0 1 0 0 1
70 + 1 0 1 1 1
Missing Data 0 0 0 1 0
Total Drivers 61 57 46 40 43
2012 2013 2014 2015 2016
15-19 0 0 0 2 0
20-24 7 6 7 10 2
25-29 7 10 14 5 5
30-34 12 12 12 19 4
35-39 7 10 13 7 9
40-44 13 11 10 9 2
45-49 10 15 5 7 15
50-54 9 6 6 4 4
55-59 7 5 4 4 6
60-64 3 1 3 4 3
65-69 2 4 4 1 3
70 + 0 0 0 1 1
Missing Data 0 0 0 0 0
Total Drivers 77 80 78 73 54
1 Values are based upon the year of the arrest.
Table 21: Driver First DWI Arrests by Age Group of Las Vegas Residents Throughout the State, 2012-2016
Age GroupsDriver First DWI Arrests1
Age GroupsDriver Repeat DWI Arrests1
Table 22: Driver Repeat DWI Arrests by Age Group of Las Vegas Residents Throughout the State, 2012-2016
1 Values are based upon the year of the arrest.
Produced for the NMDOT, Traffic Safety Division, Traffic Records Bureau, under Contract 5801
by the University of New Mexico, Geospatial and Population Studies, Traffic Research Unit
12/20/2017
Page 20
Las VegasCommunity Report
2012 2013 2014 2015 2016
15-19 4 4 1 1 1
20-24 16 18 13 9 7
25-29 10 7 2 6 7
30-34 3 4 8 1 4
35-39 4 3 2 1 2
40-44 3 2 6 1 2
45-49 5 2 3 1 3
50-54 2 2 0 0 1
55-59 1 0 1 2 0
60-64 1 1 0 1 0
65-69 0 0 1 0 0
70 + 0 1 0 0 1
Missing Data 1 0 0 1 0
Total Drivers 50 44 37 24 28
2012 2013 2014 2015 2016
15-19 0 0 0 1 0
20-24 3 3 5 5 3
25-29 5 6 13 1 3
30-34 9 7 6 14 0
35-39 5 7 4 5 3
40-44 10 5 6 8 1
45-49 9 11 4 4 7
50-54 6 6 5 1 3
55-59 6 3 1 0 1
60-64 1 2 1 3 3
65-69 0 3 4 0 1
70 + 0 0 0 0 0
Missing Data 0 0 0 0 0
Total Drivers 54 53 49 42 25
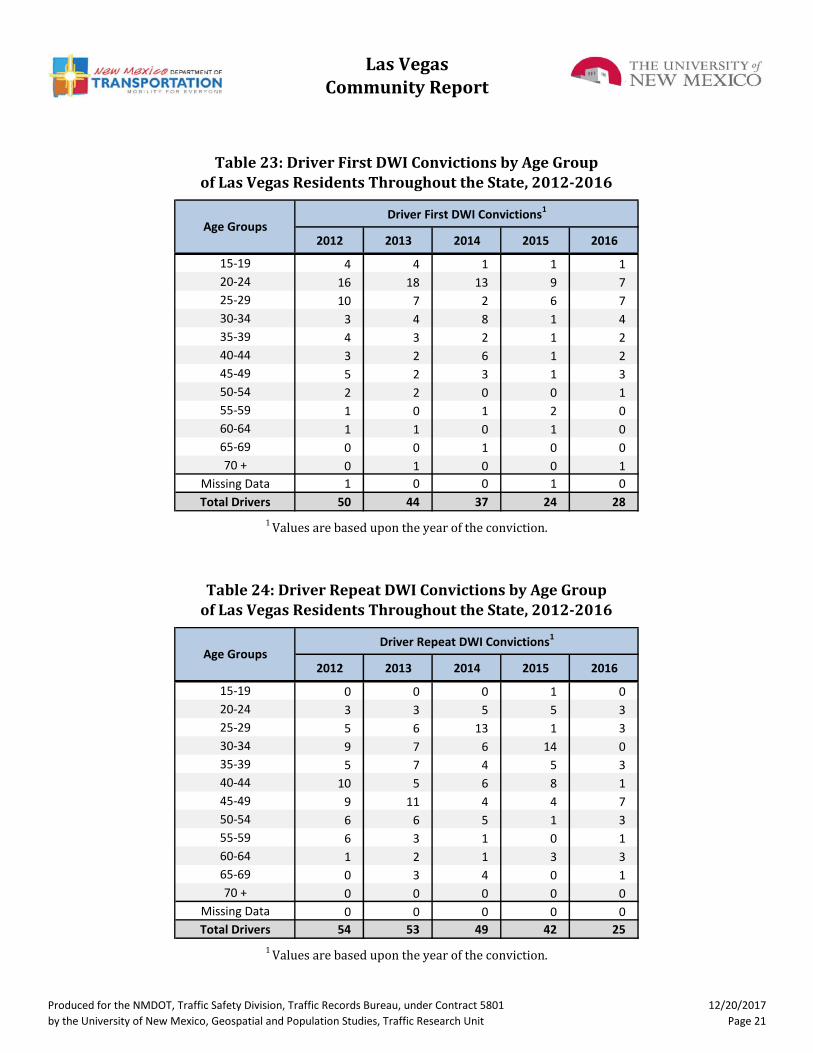
1 Values are based upon the year of the conviction.
Table 23: Driver First DWI Convictions by Age Group of Las Vegas Residents Throughout the State, 2012-2016
Table 24: Driver Repeat DWI Convictions by Age Group of Las Vegas Residents Throughout the State, 2012-2016
Age GroupsDriver Repeat DWI Convictions1
Age GroupsDriver First DWI Convictions1
1 Values are based upon the year of the conviction.
Produced for the NMDOT, Traffic Safety Division, Traffic Records Bureau, under Contract 5801
by the University of New Mexico, Geospatial and Population Studies, Traffic Research Unit
12/20/2017
Page 21

Las VegasCommunity Report
Court Disposition of
DWI Arrest1 Las Vegas StatewidePercent of
Statewide
Total DWI Arrests 97 10,344 0.9%
DWI Arrests Resulting in
Convictions48 5,541 0.9%
DWI Arrests Resulting in
Dismissals2 6 1,512 0.4%
DWI Arrests Awaiting
Disposition43 3,291 1.3%
1
2
Las Vegas Statewide
DWI Conviction 155 157 -2
DWI Dismissal 174 179 -5
These are the number of DWI arrests in 2016 and whether the case resulted in a
conviction or dismissal, or is still awaiting court disposition, as reported in the NM MVD
Citation Tracking System (CTS) as of December 2017.
Table 25: Court Disposition of DWI Arrests for the State and of Las Vegas Residents Throughout the State, 2016
Table 26: Average Number of Days from Date of DWI Arrest to Date of Court Disposition for the State and of Las Vegas Residents Throughout the State, 2016
For this table, a very small number of "not guilty" rulings may be included in the category
Dismissals.
Court Disposition
Deviation from
Statewide
Average
Average Number of Days
Produced for the NMDOT, Traffic Safety Division, Traffic Records Bureau, under Contract 5801
by the University of New Mexico, Geospatial and Population Studies, Traffic Research Unit
12/20/2017
Page 22

Las VegasCommunity Report
2012 51 54 13 20 138
2013 35 49 30 23 137
2014 29 39 19 37 124
2015 31 47 10 25 113
2016 23 25 6 43 97
*Table 27 contains the values used to calculate percentages shown in Figure 14.
Table 27: Court Disposition of DWI Arrests of Las Vegas Residents Throughout the State, 2012-2016
Figure 14: Court Dispositions by Percentage of DWI Arrests of Las Vegas Residents Throughout the State, 2012-2016
1 Values are based upon the year of the arrest.
First DWI
Conviction
Repeat DWI
ConvictionDismissed
Awaiting
Disposition
Year of DWI
Arrest1
Total DWI
Arrests
Court Disposition
37% 26% 23% 27% 24%
39%
36% 31%
42%
26%
9%
22%
15%
9%
6%
14% 17%
30% 22%
44%
138 137 124 113 97
0%
25%
50%
75%
100%
2012 2013 2014 2015 2016
First DWI Conviction Repeat DWI Conviction Dismissed Awaiting Disposition Total DWI Arrests
Produced for the NMDOT, Traffic Safety Division, Traffic Records Bureau, under Contract 5801
by the University of New Mexico, Geospatial and Population Studies, Traffic Research Unit
12/20/2017
Page 23