Embed Size (px)
Citation preview

579International Archives of Photogrammetry and Remote Sensing. Vol. XXXIII, Part B4. Amsterdam 2000.
LARGE SCALE MARS MAPPING AND ROVER LOCALIZATION
USING DESCENT AND ROVER IMAGERY
Rongxing LI*, Fei MA
*, Fengliang XU
*, Larry MATTHIES
**, Clark OLSON
**, Yaling XIONG
**
* Department of Civil and Environmental Engineering and Geodetic Science, The Ohio State University470 Hitchcock Hall, 2070 Neil Avenue, Columbus, OH 43210, USA
[email protected]** Jet Propulsion Laboratory, California Institute of Technology
Pasadena, California 91109, USAHYPERLINKHYPERLINK
Working Group IV/2
KEY WORDS: Bundle Adjustment, Rover Localization, Mars Mapping, Descent Imagery, Rover Imagery.
ABSTRACT
The exploration of Mars by landing robotics requires large-scale mapping of the Martian surface and accurate roverlocalization. The resolution of the obiter imagery is too low to provide terrain information for the rover to traverse theMartian surface safely. Future MSP (Mars Surveyor Program) exploration missions will extend the rover explorationrange from the landing center region to an area of 10kmx10km. This calls for high precision largescale mapping androver localization with an accuracy of up to 0.1%. This paper presents a method of large-scale mapping and roverlocalization using descent and rover imagery. A set of descent imagery and rover stereo imagery, collected during afield test at Silver Lake, CA, in May 1999, is integrated into a bundle adjustment system to localize the rover position. Itis demonstrated that rover localization with a RMS of 0.14m, 0.08m and 0.34m in the x, y and z direction, respectively,for a distance of up to 500m, and 0.23m, 0.21m and 0.46m within 1.5km can be achieved. This apparently meets theobjective of controlling the rover navigation error within 0.1% (1m for 1km).
1 INTRODUCTION
The Mars exploration architecture often consists of an orbiter, lander, and rover. Accurate navigation and localization ofthe over relative to the lander are needed so that the rover may safely traverse the Martian surface and communicatewith the lander as far away as, for example, 10 km from the lander. This calls for high precision, large-scale mapping ofthe surface and rover localization with an accuracy of up to 0.1% (Matthies, et al. 1997; Li, et al. 2000). The resolutionof the obiter imagery is too low to provide the needed terrain information. The current navigation data, obtained from aheading sensor, an odometer and other sensors with an error of approximately 10% of the distance from the lander is notsufficient for this task. The unique characteristics of the descent imagery that will be available in the future missionsmotivate the use of orbital data, descent images, and rover images for accurate rover localization (Matthies, et al. 1997).
The Mars Pathfinder has successfully conducted a near-lander rover mission. The rover Sojourner provided powerfulclose-range tools for microscale rock investigation, soil research and other scientific objectives within an area of about10m x 10m from the lander. As part of the Mars Surveyor 2001 mission, it is planned that the Marie Curie rover, whichis very similar to the Pathfinder Sojourner Rover, will be sent to Mars. In the 2003 and 2005 Mars Missions, the roverFIDO, a prototype of the Mars Sample Return rovers, will carry the integrated Athena Science Payload to Mars.Research was carried out on rover localization using several different methods. Volpe et al. (1995) used a coloredcylinder to provide reasonably accurate position and heading information for the rover within a 10 meter range at anaccuracy of typically 5o for heading and 5% for distance. Another approach tested maximum likelihood estimationtechniques for performing rover self-localization in natural terrain by matching range maps (Olson, et al. 1998). Thistechnique can find the best position in some discretization of the pose space and does not require an initial estimate ofthe rover position.
This paper discusses large-scale surface mapping and rover localization using descent and rover imagery based onphotogrammetric methods. First of all, a set of descent images at different resolutions is used to construct a DEM bydetermining the descent imagery orientation parameters. The descent images taken from above 5000m to several metersabove the ground have a hierarchy of resolutions (from coarse to fine), which match those of the orbital imagery and theground lander and rover images. This makes descent imagery extremely valuable to scientists for mission planning andto engineers for operating the rover. Specifically, for rover localization, the descent imagery provides an effective way
Rongxing Li
580 International Archives of Photogrammetry and Remote Sensing. Vol. XXXIII, Part B4. Amsterdam 2000.
to enhance the geometry by integrating orbital, descent and lander/rover images to form an image network. Traditionalaerial triangulation is performed on pairs or strips of horizontal imagery at nearly the same altitude and with large areasof overlapping. Here, in contrast, we analyze and test bundle adjustment on descent imagery at several differentresolutions. Second, the rover image locations and orientations are precisely determined within the network using anextended bundle adjustment. The combined data set of descent and rover images ensures that rover locations fartheraway from the lander will be determined at an accuracy close to those near the lander.
We present the results of rover localization tests using descent and rover imagery acquired at the field test site at SilverLake, CA, in May 1999 (Li, et al. 2000). Different adjustment models have been used to localize the rover, in whichground control points, tie points, camera calibration parameters, and various distortion parameters were taken intoaccount. Using the bundle adjustment system we developed, we are able to integrate the descent imagery and roverimagery to achieve a RMS of 0.14m, 0.08m and 0.34m in the x, y and z directions, respectively, for a distance of up to500m, and 0.23m, 0.21m and 0.46m within 1.5km. The objective of controlling the navigation error within 0.1% (1mfor 1km) is apparently met.
2 DATA ACQUISITION AND PREPROCESSING
Descent imaging systems have been successfully used for lunar exploration to provide impressive views of moon. Infuture Mars exploration missions, the Mars Decent Imager (MARDI), will acquire data during the moments leading upto the touchdown, from the time that the spacecraft's heat shield falls away until the spacecraft reaches the surface(Malin Space Science Systems 2000). MARDI will be able to image the landing site at an interesting set of resolutionsover a wide field of view (FOV). MARDI will be a crucial link between the orbiter and lander observations, providingthe context for planning the traverses of the rovers that will roam around, looking for interesting geologic features tostudy. MARDI has a focal length of 7.135mm, a FOV of 73.4deg and an image size 1024X1024 pixels. The first imagewill be taken at 5000m height. The resolutions vary from 8.65m per pixel to 9mm per pixel.
Radial lens distortion is the dominant distortion in the descent imagery. Suppose r is the distance of a point on the
image from the principal point, rδ is the radial lens distortion, k1, k2, k3, k4 are the coefficients of the radial lens
distortion, the correction of radial lens distortion is rkrkrkrkr 7
4
53
321 +++=δ . Decentering distortion is
another kind of lens distortion that appears in descent imagery. Suppose x, y are coordinates of a point on the image,
xδ and yδ are decentering distortion corrections in the x and y directions, p1and p
2 are coefficients of the decentering
distortion, the correction for decentering lens distortion in the x direction should be xypxyrpx 22
1 22 ++=
δ , and
in the y direction xypyrpy1
2
222 2 ++=
δ . Since the descent imagery will be taken starting at an altitude of
5000m, the correction for the Martian curvature will be needed. If H is the imaging height, R the Martian radius (3397
km equatorial radius, 3375 polar radius), f the MARDI focal length, and c
rδ the correction for Martian curvature, then
fR
rHr
c 2
3
2=δ .
EMBEDEMBEDEMBEDEMBEDThe field test at Silver Lake, CA conducted in 1999 is described in detail in (Li et al., 2000). 15 descent images andseveral sets of FIDO Navcam imagery at 5m, 500m and 1.5km away from the descent center were acquired. Thedistortion of the descent imagery is up to 10 pixels. The distortion of the Navcam imagery is about 0.5 pixel to 1 pixel.
3 A PHOTOGRAMMETRIC MODELING FOR HANDLING DESCENT
IMAGERY
3.1 Potential of the Descent Imagery
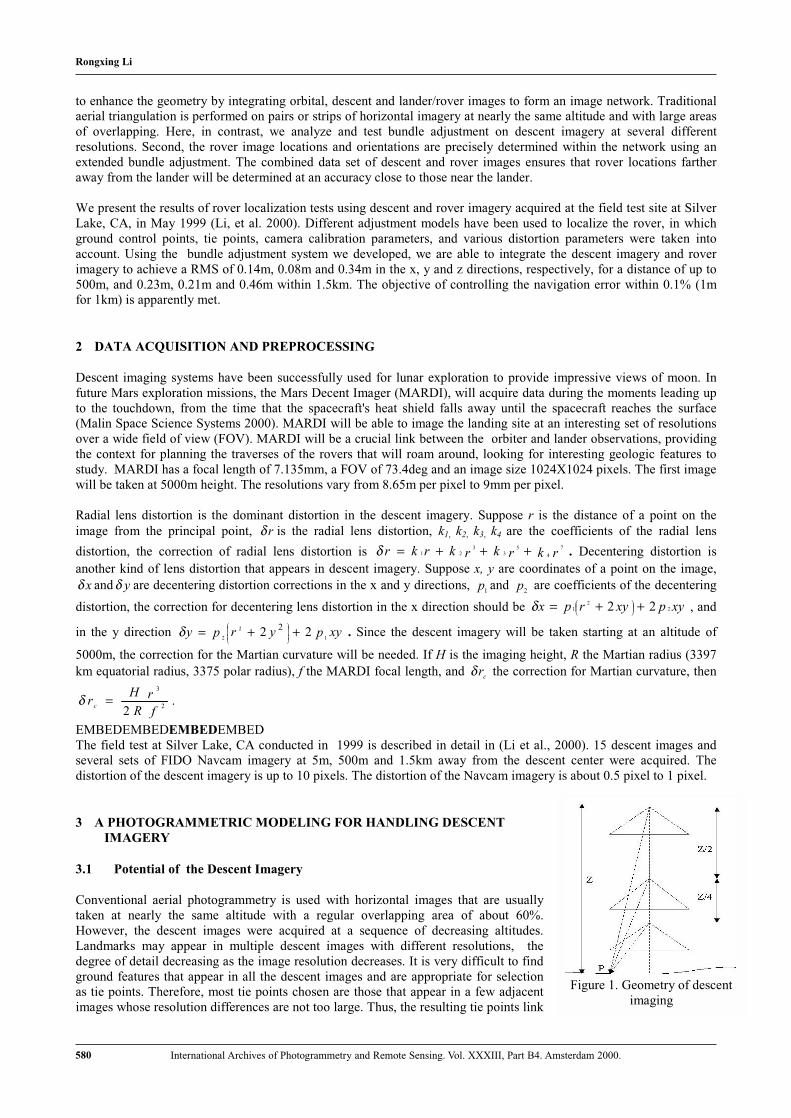
Conventional aerial photogrammetry is used with horizontal images that are usuallytaken at nearly the same altitude with a regular overlapping area of about 60%.However, the descent images were acquired at a sequence of decreasing altitudes.Landmarks may appear in multiple descent images with different resolutions, thedegree of detail decreasing as the image resolution decreases. It is very difficult to findground features that appear in all the descent images and are appropriate for selectionas tie points. Therefore, most tie points chosen are those that appear in a few adjacentimages whose resolution differences are not too large. Thus, the resulting tie points link
Figure 1. Geometry of descentimaging
Rongxing Li
581International Archives of Photogrammetry and Remote Sensing. Vol. XXXIII, Part B4. Amsterdam 2000.
the descent image sequence hierarchically in the vertical direction.
In the ideal situation, the descent imagery can be treated as vertical photography (Wolf, 1983), and so the rotation
matrix can be simplified:
333231
232221
131211
mmm
mmm
mmm
=
−
100
0cossin
0sincos
κκκκ
. Based on the collinearity equations:
( ) ( ) ( )( ) ( ) ( )ZZmYYmXXm
ZZmYYmXXmx
OPOPOP
OPOPOP
pf
−+−+−
−+−+−−=
333231
131211
and ( ) ( ) ( )( ) ( ) ( )ZZmYYmXXm
ZZmYYmXXmyOPOPOP
OPOPOP
pf
−+−+−−+−+−
−=333231
232221 , any two descent images
that share the same feature point can theoretically determine the location of the corresponding 3-D position. Supposethe descent image orientation parameters are fixed, we linearize the collinear equations:
( )( ) ( )( ) ( )( ) PoppPopPopx dZZZxdYZZfdXZZfvp
−+−+−= //sin/cos κκ
( )( ) ( )( ) ( )( ) PoppPopPopy dZZZydYZZfdXZZfvp
−+−+−−= //cos/sin κκ
From the geometry of vertical photography, we also know that ( )( )OPpP ZZfxX −−= / and
( )( )OPpP ZZfyY −−= / . Therefore, the higher the imaging altitude oZ is, the lower the accuracies of PZ , PX and
PY are. Furthermore, with the increase of imaging altitude, the descent imagery resolution becomes lower, and also the
low accuracy of image measurement leads to the lower accuracies of PZ , PX and PY .
Figure 1 illustrates the geometry of the descent imagery. From any two consecutive descent images, there should beenough tie points to determine the image orientation parameters. With a set of consecutive descent images, a bundleadjustment with enough tie points hierarchically distributed in the vertical direction leads to a high accuracy that is evenclose to that achievable by horizontal image blocks.
3.2 Least squares adjustment of a free descent image network
In the environment of a Mars landing site, there will be no ground control. The maximum global orientation availablemay include an approximate lander location, and an azimuth pointing to a landmark defined in the latest global Marscontrol network with a point accuracy of 750m (Zeitler et al. 2000). So the network computation should be performedas a free network. In our experiment, a local coordinate system is constructed. Because the rover position can be relatedto the lander, the origin of the local coordinate system should be the lander location. In the bundle adjustment model weapply three constraints: scale, azimuth, and zenith that can be supplied by a landmark relative to the lander. Suppose Xo,Yo and Zo are the coordinates of the lander position which will be set to (0,0,0) in the local coordinate system, XE, YE andZE are cooridnates of a landmark, and D is the distance between them, then the scale constraint is given as
( ) ( ) ( ) 2222DZZYYXX OBOBOB =−+−+− . Suppose the azimuth and zenith of the landmark in the local coordinates are
β and α , then the zenith constraint and azimuth constraint are represented by
( ) ( ) ( )( ) β=−+−−− 22
/tan 1OBOBOB YYXXZZ and ( ) ( )( ) α=−−−
OBOB XXYY /tan1
. The network is
solved by an extended least squares adjustment. The measurements of image points with weight P constitute
observation equations PLAXV ,−= with the constraints represented as WHX = . Applying the least squares
principle, )1
2min( ∑=
m
iv i
where vi are residual of each of the measurements and minimum norm )1
2min( ∑=
n
ix i
where xi
are unknowns solution, the solution is as follows,
( ) ( ) ( )( )
−+= −−
−− PLANHWHNHHPLANX TTTT
1
(1)
( ))(/1
min 20 Nrankm
m
irsqrt i −
∑=
=σ (2)
Rongxing Li

582 International Archives of Photogrammetry and Remote Sensing. Vol. XXXIII, Part B4. Amsterdam 2000.
( )
−=Σ −−
−−−
NHHNHHNNTT
X
120σ (3)
where the normal equation N is decomposed into the full matrices U and V, and the diagonal matrix D as
VDUPAANTT ⋅⋅== ,
=
d n
d
d
D
0
2
01
�
, and the rank of N is counted as the number of di >0, the generalized
inverse of N is calculated by
⋅
⋅=−
UddiagVN
T
j
1 .
3.3 Experiment Results
The 10 descent images shown in Figure 2 with imaging heights ranging from 1085m to 8m were selected to conduct abundle adjustment using the above algorithm. The imaging camera has a focal length of 51.7mm and a field of view of62o. The image size is 4096X4096 pixels.
Within the imaging area, 22 GCPs that have known three dimensionalcoordinates from the DGPS survey were used as check points. Asillustrated in Figure 3, the GCPs are distributed symmetrically aroundthe descent center G1 and the alternative center of G15 in order toevaluate their effect on the accuracy of the network. 72 tie points weremanually selected and hierarchically distributed in the verticaldirection. A local coordinate system was constructed with the descentcenter G1 as the origin. In order to formulate the three constraints:scale, azimuth, and zenith, G20 was supplied as a landmark relative toG1. Another 9 GCPs (G2, G3, G4, G5, G6, G7, G8, G9 and G12)which are covered by at least 2 of these 10 descent images wereselected as check points.
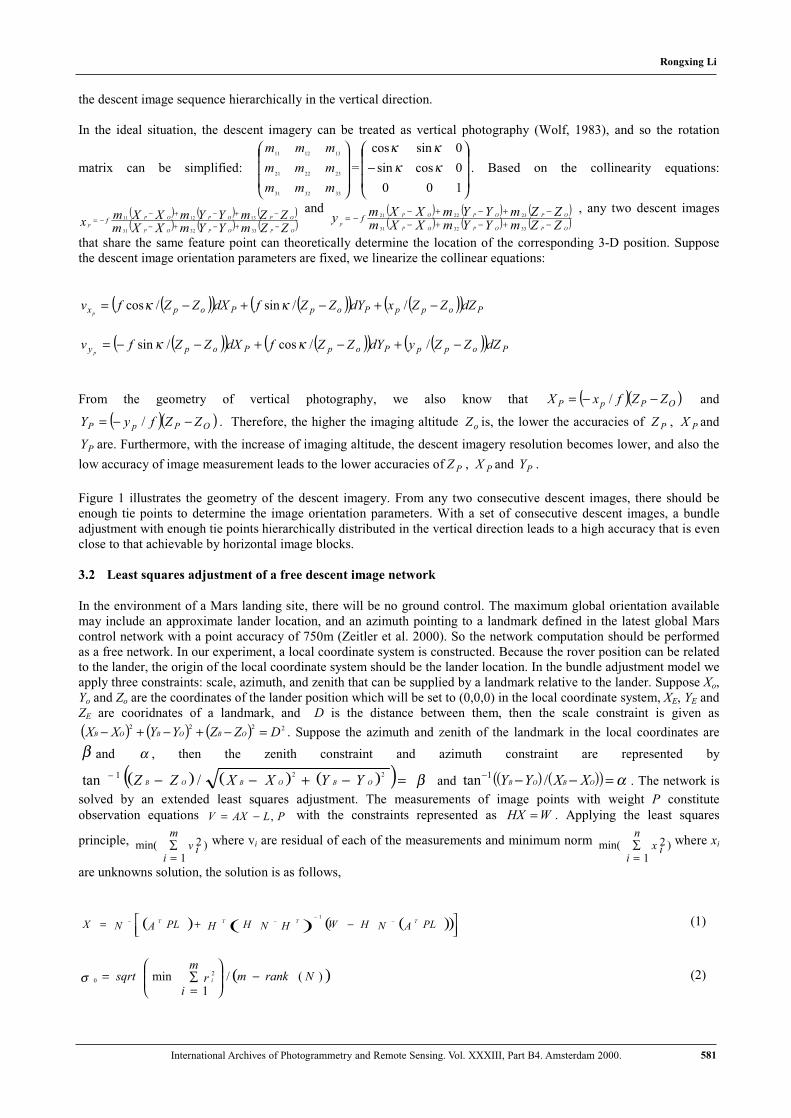
Table 1 lists estimated standard deviations of the exterior orientationparameters of the descent images. The computational results show thatthe standard deviations of the exterior orientation parameters of the descending imagery increase as the altitudeincreases. Comparing this with the results of the bundle adjustment tested on the same 10 descent images but withground control points (Table 2 of Li, et al. 2000), it can be seen that the standard deviations of the exterior orientationparameters exhibit the same tendency as the imaging altitude increases. The results are nearly the same in terms ofaccuracy, but the accuracy of the exterior orientation parameters of higher altitude images in the free network is slightly
Figure 2. A set of descent images
Figure 3. Distribution of ground control
points
Rongxing Li
583International Archives of Photogrammetry and Remote Sensing. Vol. XXXIII, Part B4. Amsterdam 2000.
improved. This demonstrates that the bundle adjustment on descent images without ground control can achieve thesame accuracy as that with ground control and the accuracy is more evenly distributed. The comparison also tells us thatthe accuracy of the exterior orientation parameters of the descending imagery depends on the structure of the networkand the distribution of tie points.
Photo-ID ∆X
(m)∆Y
(m)∆Z
(m)∆ω
(min:sec)∆φ
(min:sec)∆κ
(min:sec)
Altitude(m)
P1 0.031 0.031 0.036 12:6.4 12:53.7 2:9.8 8
P2 0.058 0.054 0.035 10:28.7 11:13.0 1:42.7 18
P3 0.089 0.086 0.046 9:6.8 9:23.7 1:34.8 32
P4 0.112 0.095 0.053 5:50.8 6:56.0 1:19.3 55P5 0.214 0.169 0.080 4:30.3 5:50.0 0:58.9 127
P6 0.241 0.194 0.087 4:32.7 5:47.4 1:2.5 143
P7 0.355 0.285 0.116 4:7.7 5:26.3 0:53.4 227
P8 0.356 0.270 0.141 4:14.9 5:29.8 1:1.2 219
P9 0.390 0.506 0.175 2:53.1 2:15.5 0:49.0 589
P10 0.774 0.660 0.336 2:6.6 2:21.6 0:47.3 1085Table 1. Standard deviations of exterior orientation parameters of the descent imagery
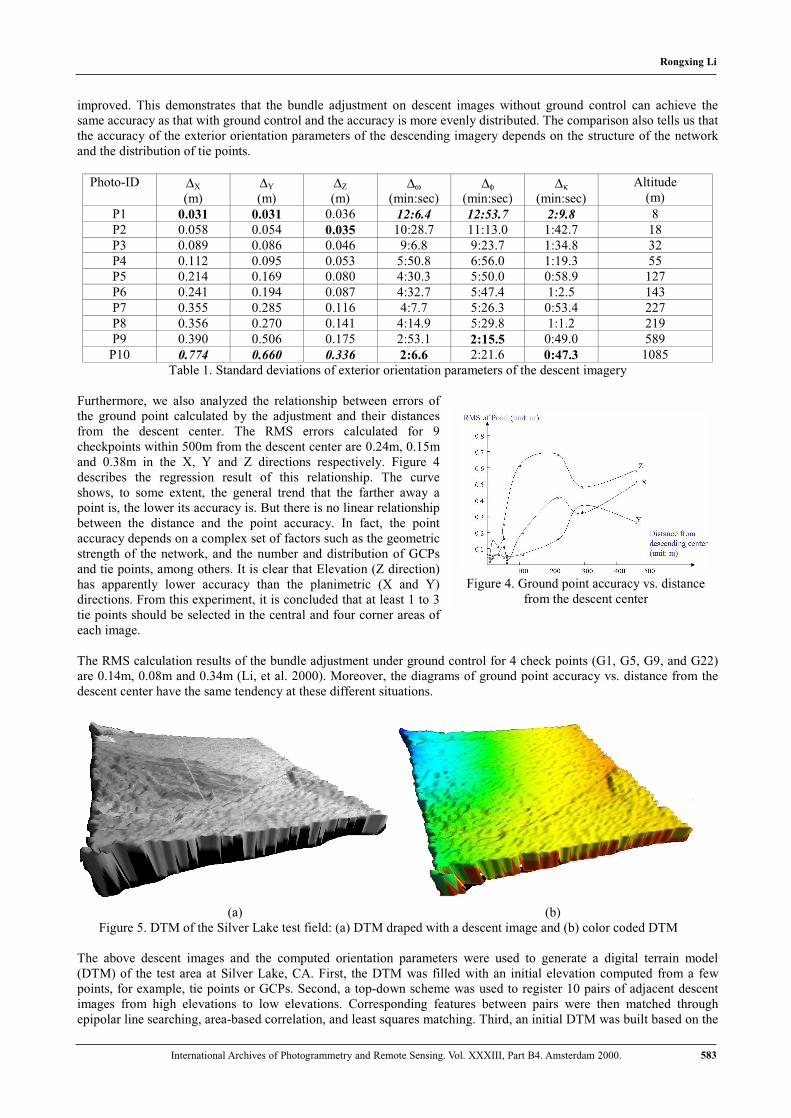
Furthermore, we also analyzed the relationship between errors ofthe ground point calculated by the adjustment and their distancesfrom the descent center. The RMS errors calculated for 9checkpoints within 500m from the descent center are 0.24m, 0.15mand 0.38m in the X, Y and Z directions respectively. Figure 4describes the regression result of this relationship. The curveshows, to some extent, the general trend that the farther away apoint is, the lower its accuracy is. But there is no linear relationshipbetween the distance and the point accuracy. In fact, the pointaccuracy depends on a complex set of factors such as the geometricstrength of the network, and the number and distribution of GCPsand tie points, among others. It is clear that Elevation (Z direction)has apparently lower accuracy than the planimetric (X and Y)directions. From this experiment, it is concluded that at least 1 to 3tie points should be selected in the central and four corner areas ofeach image.
The RMS calculation results of the bundle adjustment under ground control for 4 check points (G1, G5, G9, and G22)are 0.14m, 0.08m and 0.34m (Li, et al. 2000). Moreover, the diagrams of ground point accuracy vs. distance from thedescent center have the same tendency at these different situations.
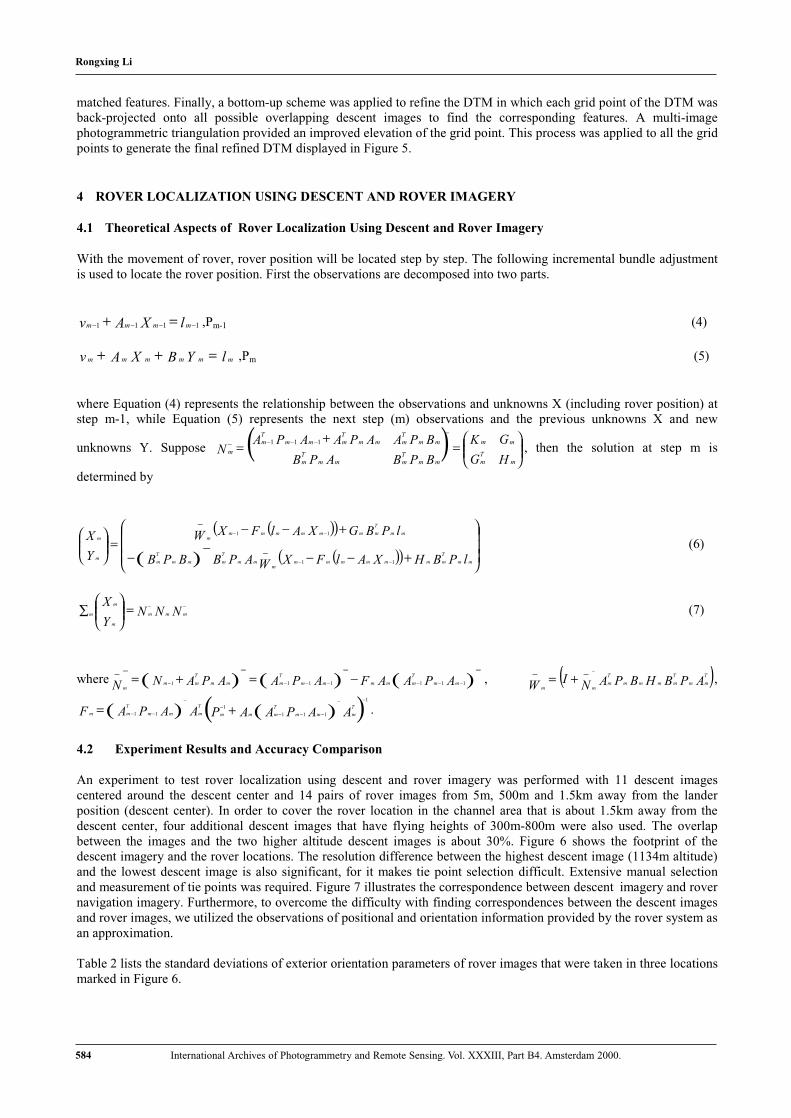
(a) (b)Figure 5. DTM of the Silver Lake test field: (a) DTM draped with a descent image and (b) color coded DTM
The above descent images and the computed orientation parameters were used to generate a digital terrain model(DTM) of the test area at Silver Lake, CA. First, the DTM was filled with an initial elevation computed from a fewpoints, for example, tie points or GCPs. Second, a top-down scheme was used to register 10 pairs of adjacent descentimages from high elevations to low elevations. Corresponding features between pairs were then matched throughepipolar line searching, area-based correlation, and least squares matching. Third, an initial DTM was built based on the
Figure 4. Ground point accuracy vs. distancefrom the descent center
Rongxing Li
584 International Archives of Photogrammetry and Remote Sensing. Vol. XXXIII, Part B4. Amsterdam 2000.
matched features. Finally, a bottom-up scheme was applied to refine the DTM in which each grid point of the DTM wasback-projected onto all possible overlapping descent images to find the corresponding features. A multi-imagephotogrammetric triangulation provided an improved elevation of the grid point. This process was applied to all the gridpoints to generate the final refined DTM displayed in Figure 5.
4 ROVER LOCALIZATION USING DESCENT AND ROVER IMAGERY
4.1 Theoretical Aspects of Rover Localization Using Descent and Rover Imagery
With the movement of rover, rover position will be located step by step. The following incremental bundle adjustmentis used to locate the rover position. First the observations are decomposed into two parts.
lXAv mmmm 1111 −−−− =+ ,Pm-1 (4)
lYBXAv mmmmmm =++ ,Pm (5)
where Equation (4) represents the relationship between the observations and unknowns X (including rover position) atstep m-1, while Equation (5) represents the next step (m) observations and the previous unknowns X and new
unknowns Y. Suppose ( )
=
+= −−−
−
−
HG
GK
BPBAPB
BPAAPAAPAN
mTm
mm
mmTmmm
Tm
mmTmmm
Tmmm
Tm
m
111, then the solution at step m is
determined by
( )( )
( ) ( )( )
+−−−
−
+−−=
−−
−−
−
−
lPBHXAlFXWAPBBPB
lPBGXAlFXW
Y
X
mm
T
mmmmmmmm
mm
T
mmm
T
m
mm
T
mmmmmmmm
m
m
11
11
(6)
NNNY
Xmmmm
m
m −−=∑
(7)
where ( ) ( ) ( )APAAFAPAAPANN mm
T
mmmmm
T
mmm
T
mmm
1111111 −−−−−−−
−−−− −−=+= , ( )APBHBPAN
IW
T
mm
T
mmmm
T
mmm
−− −
+= ,
( ) ( )( )AAPAAPAAPAFT
mmm
T
mmm
T
mmm
T
mm 111
1
1
11 −−−
−−
−
−−
−
+= .
4.2 Experiment Results and Accuracy Comparison
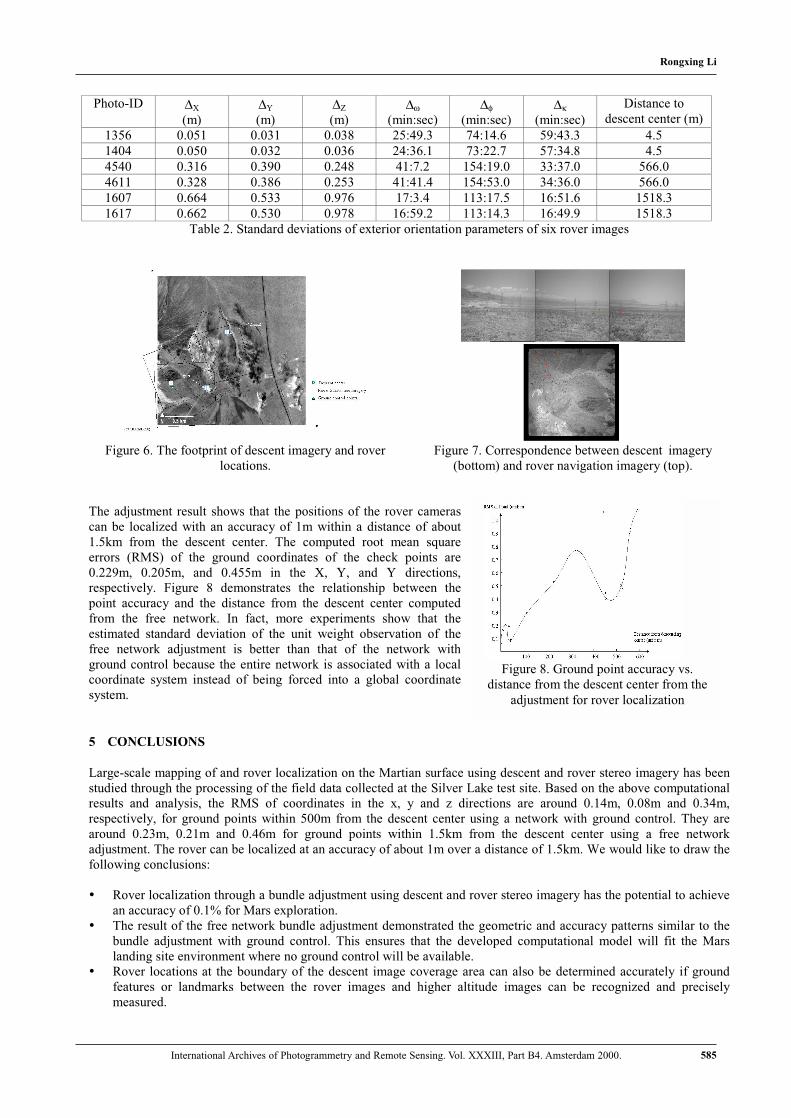
An experiment to test rover localization using descent and rover imagery was performed with 11 descent imagescentered around the descent center and 14 pairs of rover images from 5m, 500m and 1.5km away from the landerposition (descent center). In order to cover the rover location in the channel area that is about 1.5km away from thedescent center, four additional descent images that have flying heights of 300m-800m were also used. The overlapbetween the images and the two higher altitude descent images is about 30%. Figure 6 shows the footprint of thedescent imagery and the rover locations. The resolution difference between the highest descent image (1134m altitude)and the lowest descent image is also significant, for it makes tie point selection difficult. Extensive manual selectionand measurement of tie points was required. Figure 7 illustrates the correspondence between descent imagery and rovernavigation imagery. Furthermore, to overcome the difficulty with finding correspondences between the descent imagesand rover images, we utilized the observations of positional and orientation information provided by the rover system asan approximation.
Table 2 lists the standard deviations of exterior orientation parameters of rover images that were taken in three locationsmarked in Figure 6.
Rongxing Li
585International Archives of Photogrammetry and Remote Sensing. Vol. XXXIII, Part B4. Amsterdam 2000.
Photo-ID ∆X
(m)∆Y
(m)∆Z
(m)∆ω
(min:sec)∆φ
(min:sec)∆κ
(min:sec)
Distance todescent center (m)
1356 0.051 0.031 0.038 25:49.3 74:14.6 59:43.3 4.5
1404 0.050 0.032 0.036 24:36.1 73:22.7 57:34.8 4.5
4540 0.316 0.390 0.248 41:7.2 154:19.0 33:37.0 566.0
4611 0.328 0.386 0.253 41:41.4 154:53.0 34:36.0 566.0
1607 0.664 0.533 0.976 17:3.4 113:17.5 16:51.6 1518.3
1617 0.662 0.530 0.978 16:59.2 113:14.3 16:49.9 1518.3Table 2. Standard deviations of exterior orientation parameters of six rover images
Figure 6. The footprint of descent imagery and roverlocations.
Figure 7. Correspondence between descent imagery(bottom) and rover navigation imagery (top).
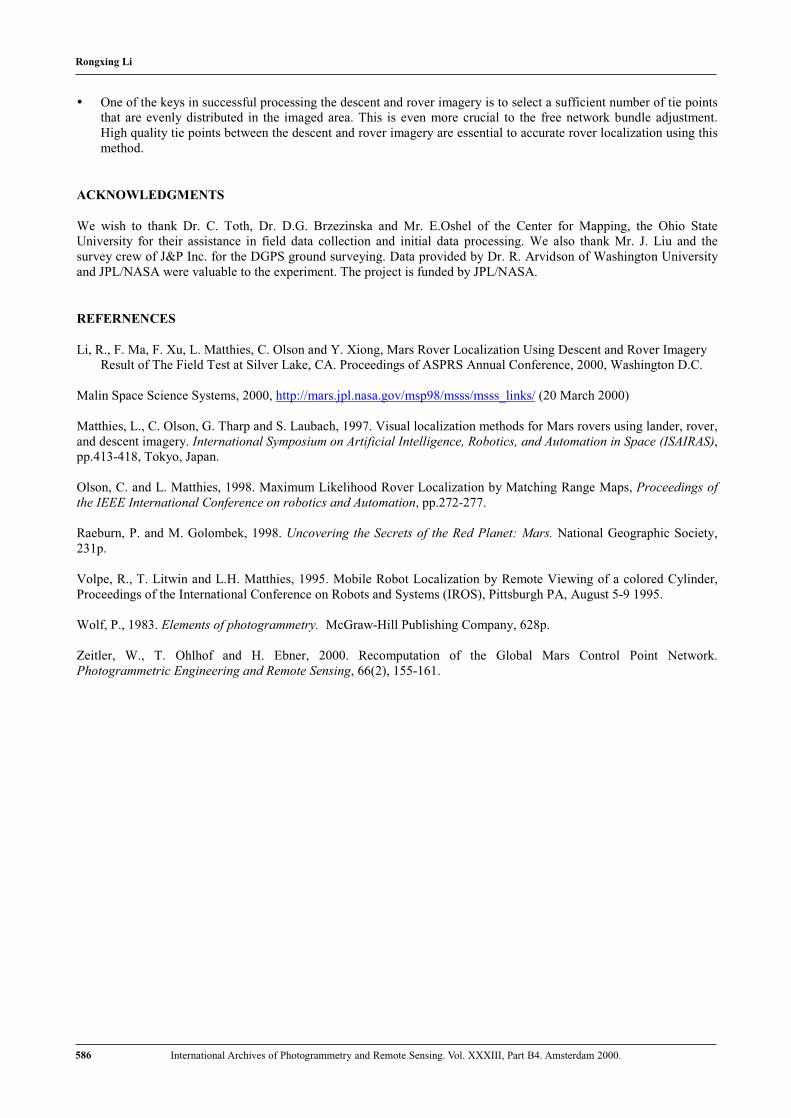
The adjustment result shows that the positions of the rover camerascan be localized with an accuracy of 1m within a distance of about1.5km from the descent center. The computed root mean squareerrors (RMS) of the ground coordinates of the check points are0.229m, 0.205m, and 0.455m in the X, Y, and Y directions,respectively. Figure 8 demonstrates the relationship between thepoint accuracy and the distance from the descent center computedfrom the free network. In fact, more experiments show that theestimated standard deviation of the unit weight observation of thefree network adjustment is better than that of the network withground control because the entire network is associated with a localcoordinate system instead of being forced into a global coordinatesystem.
5 CONCLUSIONS
Large-scale mapping of and rover localization on the Martian surface using descent and rover stereo imagery has beenstudied through the processing of the field data collected at the Silver Lake test site. Based on the above computationalresults and analysis, the RMS of coordinates in the x, y and z directions are around 0.14m, 0.08m and 0.34m,respectively, for ground points within 500m from the descent center using a network with ground control. They arearound 0.23m, 0.21m and 0.46m for ground points within 1.5km from the descent center using a free networkadjustment. The rover can be localized at an accuracy of about 1m over a distance of 1.5km. We would like to draw thefollowing conclusions:
� Rover localization through a bundle adjustment using descent and rover stereo imagery has the potential to achievean accuracy of 0.1% for Mars exploration.
� The result of the free network bundle adjustment demonstrated the geometric and accuracy patterns similar to thebundle adjustment with ground control. This ensures that the developed computational model will fit the Marslanding site environment where no ground control will be available.
� Rover locations at the boundary of the descent image coverage area can also be determined accurately if groundfeatures or landmarks between the rover images and higher altitude images can be recognized and preciselymeasured.
Figure 8. Ground point accuracy vs.distance from the descent center from the
adjustment for rover localization
Rongxing Li
586 International Archives of Photogrammetry and Remote Sensing. Vol. XXXIII, Part B4. Amsterdam 2000.
� One of the keys in successful processing the descent and rover imagery is to select a sufficient number of tie pointsthat are evenly distributed in the imaged area. This is even more crucial to the free network bundle adjustment.High quality tie points between the descent and rover imagery are essential to accurate rover localization using thismethod.
ACKNOWLEDGMENTS
We wish to thank Dr. C. Toth, Dr. D.G. Brzezinska and Mr. E.Oshel of the Center for Mapping, the Ohio StateUniversity for their assistance in field data collection and initial data processing. We also thank Mr. J. Liu and thesurvey crew of J&P Inc. for the DGPS ground surveying. Data provided by Dr. R. Arvidson of Washington Universityand JPL/NASA were valuable to the experiment. The project is funded by JPL/NASA.
REFERNENCES
Li, R., F. Ma, F. Xu, L. Matthies, C. Olson and Y. Xiong, Mars Rover Localization Using Descent and Rover Imagery Result of The Field Test at Silver Lake, CA. Proceedings of ASPRS Annual Conference, 2000, Washington D.C.
Malin Space Science Systems, 2000, http://mars.jpl.nasa.gov/msp98/msss/msss_links/ (20 March 2000)
Matthies, L., C. Olson, G. Tharp and S. Laubach, 1997. Visual localization methods for Mars rovers using lander, rover,and descent imagery. International Symposium on Artificial Intelligence, Robotics, and Automation in Space (ISAIRAS),pp.413-418, Tokyo, Japan.
Olson, C. and L. Matthies, 1998. Maximum Likelihood Rover Localization by Matching Range Maps, Proceedings of
the IEEE International Conference on robotics and Automation, pp.272-277.
Raeburn, P. and M. Golombek, 1998. Uncovering the Secrets of the Red Planet: Mars. National Geographic Society,231p.
Volpe, R., T. Litwin and L.H. Matthies, 1995. Mobile Robot Localization by Remote Viewing of a colored Cylinder,Proceedings of the International Conference on Robots and Systems (IROS), Pittsburgh PA, August 5-9 1995.
Wolf, P., 1983. Elements of photogrammetry. McGraw-Hill Publishing Company, 628p.
Zeitler, W., T. Ohlhof and H. Ebner, 2000. Recomputation of the Global Mars Control Point Network.Photogrammetric Engineering and Remote Sensing, 66(2), 155-161.
Rongxing Li