Embed Size (px)
Citation preview

ORIGINAL PAPER
Large scale land investments and food security in agropastoral areasof Ethiopia
Adugna Eneyew Bekele1,2 & Liesbeth Dries2 & Wim Heijman2,3& Dusan Drabik2
Received: 29 August 2019 /Accepted: 7 December 2020# The Author(s) 2021
AbstractIn Ethiopia, large scale land investments have been expanding into pastoral regions. However, little is known about the conse-quences of these investments on the food security of the pastoral community. Using Living Standard Measurement Survey dataof the World Bank, we find that, on average, about 32% of the respondents from the (agro-)pastoral regions are food insecure.After controlling for confounders, proximity to large scale land investments is associated with additional food intake of up to745 kcal per day per adult compared to the households located farther away from a large scale land investment. Proximity to largescale land investment has no significant effect on the coping strategies based food security. For households located in proximityto a large scale land investment, food intake significantly increases with access to roads and markets. Proximity to a large scaleland investment has a positive effect on household food consumption not necessarily because of direct benefits from large scaleland investments, but due to land and soil quality near the large scale land investments.
Keywords Foodsecurity .Largescale land investment . Sugarplantations .Livelihoods .Pastoralism .Propensity scorematching
1 Introduction
Pastoralism and agro-pastoralism are predominant productionsystems in the arid and semi-arid drylands of Africa. About 25million pastoralists and 200 million agro-pastoralists live inSub-Saharan Africa (SNV 2012). Pastoralists mainly dependon livestock production, while agro-pastoralists depend onlivestock and crop production for their livelihoods. Ethiopiahas one of the largest (agro-)pastoralist areas in East Africa,covering 61% of its drylands. Livestock contributes to thelivelihoods of 60% - 70% of the Ethiopian population(Halderman 2004). The country also has the largest livestock
population on the African continent (Aklilu and Catley 2014).Despite this considerable livestock resource, Ethiopia is oneof the most food-insecure countries in the world.
Areas used for (agro-)pastoralism suffer from several chal-lenges, including insufficient rainfall and droughts, resultingin perishing livestock, losses of human lives, and environmen-tal degradation (Headey et al. 2014). Agro-pastoralists remainamong the poorest groups of the population (FDRE 2013).Poverty in the (agro-)pastoral regions is also a result of polit-ical, social, and economic marginalization (FAREH 2011;Maxwell and Wiebe 1998; Pavanello 2009). Ethiopian pasto-ralists have limited access to social services, infrastructure,and education (Halderman 2004). Poverty reduction andachieving food security in (agro-)pastoral regions is one ofthe main development priorities for Ethiopia (Devereux andSussex 2000). Despite economic growth in the last decade andthe government’s attempts to address food security, the latterremains a major problem. Over 30% of the Ethiopian popula-tion is below the nationally defined food poverty line at the2200 kcal (kcal) per capita, and 40% of households are foodenergy deficient (CSA 2014).
The Growth and Transformation Plan of Ethiopia aspires tomake the country a lower middle-income country by 2025. Itconsiders large scale land investments (LSLIs) to be a vitaltool for developing the pastoral areas (Keeley 2014). About
* Adugna Eneyew [email protected]; [email protected]
1 Department of Rural Development & Agricultural Extension,College of Agriculture and Veterinary Medicine Jimma University,Jimma, Ethiopia
2 Department of Social Sciences, Agricultural Economics & RuralPolicy Group,Wageningen University & Research,Wageningen, theNetherlands
3 Department of Economics, Czech University of Life SciencesPrague, Prague, Czech Republic
https://doi.org/10.1007/s12571-020-01131-x
/ Published online: 25 January 2021
Food Security (2021) 13:309–327

three million hectares in lowland regions have been leased toprivate and state-owned commercial agricultural interestssince January 2005 (Beirne 2014; Keeley 2014). With theseinvestments, lands with good pasture, water, and wildlife weretaken to create national parks and state-owned and privatefarms. For instance, in the Rift Valley, Karrayu and Afarrangelands have been chosen for sugar cane plantations. Asa result, the original grazing land of the Karrayu pastoralistsdeclined from 150,000 ha to 40,000 ha, while Afar and SouthOmo pastoralists lost over 90,000 ha and 245,000 ha, respec-tively. Many argue that the replacement of pasture land withirrigated arable land has jeopardized pastoral livelihoods(Pavanello 2009; Said 1994; Schmidt and Pearson 2016).Others say that the area available to pastoralists is still sub-stantial, and that sugar plantations will, therefore, not have amajor impact on local livelihoods (e.g., land acquired for sug-ar plantation in Omo Kuraz takes 245,000 ha out of445,501 ha (Nixon 2013)).
Large scale land investments may positively affect liveli-hoods by generating local employment opportunities, accessto irrigation, and technologies. However, they may also ag-gravate the access to grazing lands by displacing pastoralistsfrom their pastures or preventing their access to dry seasongrazing, resulting in a negative impact on livelihoods. If peo-ple directly lose their land without compensation or adequateresettlement, they will likely become worse off and morefood-insecure (Keeley 2014). The impact of LSLI on house-hold food security in Ethiopia is, however, not yet fully un-derstood. The available empirical studies on the effect of largefarms on food security in Ethiopia mainly focus on the cropfarmers (Daniel et al. 2018; Moreda 2017; Dheressa 2013;Shete and Rutten 2015; Dye 2015; Ali et al. 2018). There isno quantitative research yet conducted in the pastoral context.Therefore, this study investigates the impact of large scaleland investments on food security of (agro)-pastoral house-holds in Ethiopia. The paper makes two contributions. First,it provides an insight into the effect of proximity to LSLI onpastoral household food security, one of the most debatedissues. Second, it applies multiple food security indicatorsfor its multiple dimensions and robust econometric modelsto address endogeneity and causal effects. In the next sections,we present the conceptual framework, methodology, results,discussion, and conclusions.
2 Conceptual framework
Assessing the impact of large scale land investments on foodsecurity requires a conceptual framework that shows their in-teractions. Therefore, we have adopted the SustainableLivelihood Framework (SLF). The SLF was first introducedin 1987 by the World Commission on Environment andDevelopment (Krantz 2001). Livelihood consists of the
capabilities, assets, and activities required by livelihoods(Chambers and Conway 1992). A livelihood is sustainablewhen people cope with and recover from stress and shocks,maintain or enhance their capabilities and assets, and providesustainable livelihood opportunities for the next generation(Chambers and Conway 1992; DFID 1999).
The SLF (Fig. 1) contains five components: context, assets,policies and institutions, livelihood strategies, and livelihoodoutcomes (DFID 1999). The arrows indicate the direction ofinfluence and linkages from one component to the other. Thecontext indicates trends and shocks in individuals’, house-holds’ and communities’ external environment that affect peo-ple’s livelihoods (e.g., conflict, illnesses, floods, droughts,pests, diseases) (Serrat 2017). Livelihood assets are the re-sources on which people depend to carry out their livelihoodstrategies. These include human (education, skills, labour,health), natural (land, forest, water), physical (livestock, roads,markets), financial (savings, credit, income) and social (net-works and connections) capital (Serrat 2017). Policies andinstitutions are the formal and informal rules that enable orhinder access to assets, especially land and livelihood strate-gies (Kébé and Muir 2008). Livelihood strategies are therange of activities that people undertake to make a living suchas intensification, migration, pastoralism, and non-pastoral ac-tivities (Serrat 2017; Scoones 1998). Livelihood strategieslead to livelihood outcomes. Outcomes can relate to income,well-being, vulnerability, food security, and sustainable use ofnatural resources (DFID 1999; Ellis 2000; Kébé and Muir2008).
Food security can be seen as one of the livelihood out-comes in the SLF. It refers to access by all at all times toenough and nutritious foods for a healthy and active life(FAO 1996). At the household level, food security showsthe ability of families to secure enough food to achieve dietaryneeds (Maxwell 1995; Maxwell and Frankenberger 1995).Access to food is related to the control of households overassets such as land, water, and labor. In the context of thisstudy, the policies and institutions dimension of the SLF de-scribes the policies and institutions that influence households’access to assets. For instance, LSLIs result from the state tak-ing pasture land for the production of sugar, which is drivenby development policy. As a result, pastoralists’ access to landbecomes restricted, which in turn can affect livelihood out-comes, such as the level of food security.
The advantages of applying the SLF to food security stud-ies are three-fold. First, it helps to understand the sources ofvulnerability to food insecurity. Second, it gives an insightinto livelihood sustainability or the long-term situation withan emphasis on enhancing capabilities. Third, it helps to ex-plore the coping strategies undertaken by households to re-spond to exogenous shocks (Burchi and De Muro 2016).There is a growing consensus on the usefulness of livelihoodapproaches to the analysis of food insecurity (Devereux et al.
310 A.E. Bekele et al.

2004; Burchi and De Muro 2016; Hussein 2002; Slater andYeudall 2015). The SLF is appropriate to study food securitybecause it comprehensively combines the key compo-nents of factors that influence household food security,including policies leading to LSLI. Henceforth, the SLFhelps to identify the explanatory variables used in theempirical analysis. This study will seek an answer totwo questions: what are the effects of proximity toLSLI on household food security in agropastoral areas?And what are the possible determinants of householdfood security in agropastoral areas affected by largescale land investments?
3 Data and methodology
3.1 Description of the study areas
The main (agro-)pastoral areas in Ethiopia are Afar Somalia,part of Oromia and Southern Nations Nationalities PeoplesRegion (SNNPR), Gambella, and Benishangul regions.According to the Central Statistics Agency of Ethiopia(CSA), 61% of Ethiopia’s land area hosts over 15 millionagro-pastoralists (CSA 2007). The country is ranked first inAfrica by the number of livestock (ILRI 2017), and the pas-toral regions host over 42% of the livestock (Ibrahim 2016).Figure 2 shows the map of the study areas, the location ofLSLIs, and the households. We include 12 zones of majoragropastoral regions in our study: Jigjiga, Liben, and
Shinile, Afar zone 1 and zone 3, Borana, Guji, Karrayu,Bale, and Hararghe, south Omo and Nuer zones. Table 1 givesthe total population and the percentage of pastoralism for thezones in the study area.
From our study, more than 80.7% of the respondents relyon livestock as a primary source of food and income, while23.1% solely depend on livestock (pure pastoralists), 67.2%depend on both livestock and crop (agro-pastoralists). Fewhouseholds (3.7%) also solely depend on crop production;6.0% of households also engage in non-pastoral economicactivities.
3.2 Data and sampling
We used data from the Living Standard Measurement Survey(LSMS) for Ethiopia for the years 2011/12, 2013/14, and2015/16. The LSMS is a Rural Socio-Economic Survey froma collaborative project between the Central Statistical Agencyof Ethiopia and the World Bank (CSA 2017). A two-stageprobability sampling technique is used in the survey to selectenumeration areas and households. Face-to-face interviewswere conducted by trained enumerators using a structuredquestionnaire. The data covers a range of topics, includingdemography, education, health, savings, labor, welfare, agri-culture, food security, and shocks (CSA 2017). We extracteddata for the agropastoral zones listed in Table 1. A total of2106 households are included in this analysis. We used thehousehold coordinates to calculate the distance of each house-hold to sugar plantations. We targeted sugar plantations
Fig. 1 Sustainable livelihoods conceptual framework for the study adapted from the Department for international Development of the United Kingdom(DFID 1999)
311Large scale land investments and food security in agropastoral areas of Ethiopia

because a lot of rangeland has been allocated to sugar planta-tions and their expansions in recent years (Behnke and Kerven2013). Moreover, the location of sugar plantations can easilybe detected compared to other large scale farms.
3.3 Methodology
Our objective is to assess whether households differ in theirlevel of food security based on their proximity to LSLI. Theproximity of land to LSLI may not be random. The location ofLSLI depends critically on the availability of suitable land andwater resources (Lay and Nolte 2017; Deininger and Byerlee
2010). As the availability of natural resources may also affecthouseholds’ food security, this may lead to biased estimatesbecause of endogeneity. Since the assignment of householdsto the treatment and control groups is not random, the estima-tion of the effect of treatment may be biased by confoundingfactors (Becker and Ichino 2002) . Confounding variables arevariables that have a potential effect on household food secu-rity and large scale land investments. Propensity scorematching (PSM) is used to avoid this problem of endogeneity,as suggested by several authors (Haji and Legesse 2017; Sheteand Rutten 2015; Bishop 2015). We classify respondents asbeing ‘treated,’ based on their distance to LSLI, considering
Agro-pastoral zones
Fig. 2 Map of the study areasdeveloped by authors based onEthiopian Shape files 2013
312 A.E. Bekele et al.

livestock mobility (up to 150 km1). The untreated householdslive at least 150 km away from an LSLI.
PSM2 constructs a statistical comparison group that is basedon a model of the probability of participating in the treatment Tconditional on observed characteristics X, or the propensityscore (Khandker et al. 2009; Rosenbaum and Rubin 1983)
P Xð Þ ¼ Pr T ¼ 1jXð Þ: ð1Þ
Our goal is to estimate the average treatment effect on thetreated (ATT), which is the effect of LSLI proximity on house-hold food security. The ATT is computed by matching LSLIand non-LSLI households that are closest in terms of theirpropensity scores. According to Becker and Ichino (2002)andHeinrich et al. (2010), the ATT can be estimated as follows:
ATT ¼ E T=1 ¼ 1ð Þ ¼ E Y=1ð Þ=D ¼ 1�−E Y 0ð Þ=D ¼ 1ð Þ; ð2Þ
where E(Y/1)/D = 1 represents the expected food security out-come of LSLI households, and E(Y(0)/D = 1) denotes the coun-terfactual food security of non-LSLI households.
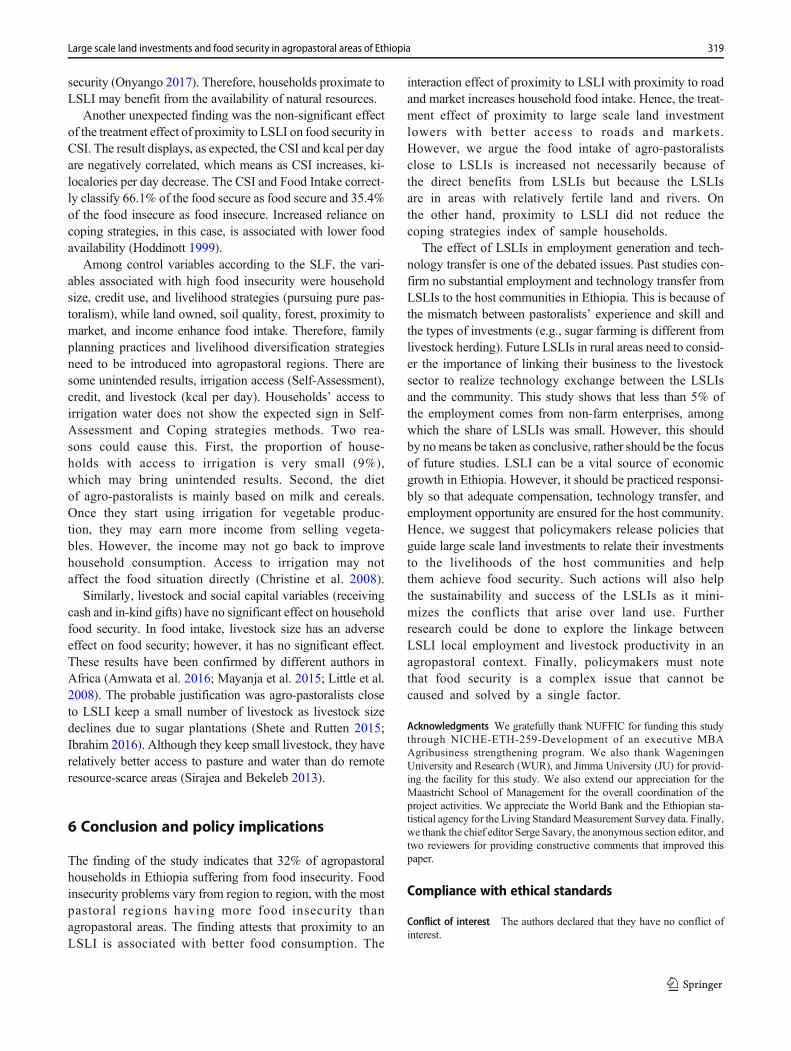
Different matching methods can be used for treated andcontrol households based on the propensity score (Khandkeret al. 2009; Heinrich et al. 2010). To select the best matchingalgorithm, we considered sample size, the number of insignif-icant variables and small pseudo-R2 after matching, and thelowest mean standardized bias. Our results indicate that thekernel matching estimator with a bandwidth of 0.08 is the bestmatching algorithm because of lower bias and improvedbalancing quality (Appendix Table 6, Table 7, Table 8,Appendix Fig. 3).
We also estimate a random effects model, controlling forconfounding variables that may explain households’ proxim-ity to LSLI, such as the availability of natural resources, aswell as their food security. A random effects model is usefulwhen there is no omitted variable bias, and when a fixed effectmodel cannot be used because of missing variation insome variables, which is our case. We exhaustively in-cluded variables according to the SLF to reduce omittedvariable bias. Hence, the random effects model will al-low us to evaluate if proximity to an LSLI increases foodsecurity or not (Baltagi 2008; Do et al. 2019). Moreover, the
random effect model helps to identify the determinants of foodsecurity.
In our random effects model estimation, the dependent var-iable is household food security in each survey year (yit). Theindependent variables (Xit) include indicators of households’proximity to large scale land investments and other control var-iables, ritand mit indicates interaction variables of distance toroad and market respectively for each household and year. Theparameters βxr and βXmmeasure the interaction between x and rand x and m. The general model specification will then be:
yit ¼ μþ αi þ xitβx þ βxr xitritð Þ þ βXm xitmitð Þ þ εit; ð3Þwhere αi is the i
th individual effect that is constant over timeand εit is the error term, IID (μ, σ2ε) (Verbeek 2008).
Before running the panel regressions, we conducted diag-nostic tests for multicollinearity (Appendix Table 11) and nor-mality (Appendix Fig. 4) and found no problems withmulticollinearity. The Breusch and Pagan Lagrangian multi-plier tests also show a random effects model is appropriate(Appendix Table 12). Random effects models are estimatedusing the logistic (REL) and generalized least squares (GLS)estimation procedures.
3.4 Dependent variables: household food security
Food security is a multi-dimensional concept, and a combina-tion of both “subjective” and “objective” indicators is recom-mended (Maliwichi et al. 2012; Maxwell et al. 2014). There isno one gold standard in measuring food security. Therefore,we use three indicators of household food security thatare available from the LSMS data: Food Intake, Self-Assessment (SA), and Coping Strategies Index (CSI).
1 LSLI limits pastoralists’ access to grazing and pastoralists travel long dis-tance between 50 km to 250 km in search of pasture and water during dryseasons (Elias 2008). Further, we have confirmed that camel travel up to450 km during severe dry seasons. The LSLIs (sugar plantations) took be-tween 200 km2 and 2500 km2 of land. We conduct sensitivity analysis bychoosing the cut points at the 50 km, 100 km, and 150 km locations. Thetreatment effects consistently increase from the 50 km to 250 km cut points.Considering livestock mobility and optimal statistical comparisons, we choosethe 150 km cut point to assess the treatment effect of LSLIs.2 We chose to match propensity scores using the first wave (2012) and main-tain those groups for the other waves to avoid variation in the propensity scoresover time (Kupzyk and Beal 2017).
Table 1 The study zones and their populations
Region Zone Population % pastoralism
Afar Zone-1 525,028 90
Afar Zone-3 248,357 90
Oromia East Shoa (Fentale) 1,685,465 11
Oromia W/Hararge 2,260,649 28
Oromia E/Hararge 3,286,338 12
Oromia Bale 1,703,762 42
Oromia Borena 1,162,879 85
Oromia Guji 1,680,859 85
Somalia Shinille 546,168 90
Somalia Jijiga 1,158,309 90
Somalia Liben 643,673 90
SNNPR South Omo 675,333 85
Gambella Nuer 138,640 85
Total 15,715,460 68
Source: Central Statistical Agency (CSA 2014) and authors’ calculations(2019)
313Large scale land investments and food security in agropastoral areas of Ethiopia

Food Intake measures the number of calories consumedby household members over seven days (Hoddinott1999). SA is the subjective self-assessment of eachhousehold of their food security (Maxwell 1996). CSI indi-cates the strategies people use to cope with a shortfall in food(Maxwell et al. 2003).
The principal person responsible for preparing meals in thehousehold was asked how much food is prepared and servedover seven days to determine Food Intake. We first convertedthe amount of food consumed into kilocalories using the foodcomposition table from the Ethiopian Health and NutritionResearch Institute (EHNRI 1997). Second, we calculated thekilocalories of food consumed per adult per day. Third, wecompared the estimated daily caloric intake to the minimumdaily subsistence requirement 2200 kcal per adult set by theEthiopian Government (FAO 2013; FSS 2002). Finally, wecategorised households into food secure (those who consumedat least 2200 kcal per day per adult) and food insecure (thosewho did not meet the minimum requirement of 2200 kcal perday per adult).
To determine the Self-Assessment measure of food securi-ty, respondents were asked to assess their own food securitystatus. The household head was asked whether there wasenough food (either through own production or through pur-chases from the market) over the last 12 months to sufficientlyfeed the family. Households who reported that they hadenough food were considered as food secure, while thosewho reported shortages were considered food insecure.
The third indicator asks about households’ coping strate-gies. Respondents were asked about what they do when theydo not have enough food and do not have money to buy it.Coping strategies relate to a short run and immediate responseto a lack of food. CSI is an indicator of food access and cap-tures food security indirectly by measuring behaviour relatedto food consumption (Maxwell et al. 2003; Maxwell andCaldwell 2008). It directly captures notions of adequacy andvulnerability (Hoddinott 1999). Seven universally validatedcoping strategies were included in the LSMS data(Appendix Table 9). We adopted universal severity weightsof Maxwell and Caldwell (2008)3 for each coping strategy todetermine the CSI (Maxwell and Caldwell 2008). The CSIwas calculated by summing up the product of the frequencyof each coping strategy and severity weight per household.The higher the value of the CSI, the more severe the problemof food insecurity (Maxwell et al. 2003). Accordingly, a zeroCSI score means that a household is food secure and a CSIscore above zero means that some food insecurity exists.
The dependent variable, food security, is specified as adummy, which is 1 for a food secure household and 0 other-wise. In food intake, we use 1 for households that consumed atleast 2200 kcal/day/adult, 0 otherwise; in self-assessment 1 forhouseholds who reported being food secure, 0 otherwise; andin CSI, 1 for households with zero CSI, and 0 otherwise. Wespecified a continuous variable for two food security indica-tors, such as the kilocalories per day per adult and CSI. As thekcal/day/adult increases, household food security improves,while as CSI increases, it worsens.
3.5 Independent variables
The primary independent variable of interest is LSLI. In thePSM model, LSLI will be the treatment variable, and it takesthe value of one for households located within a 150 km dis-tance from an LSLI, namely a sugar plantation. LSLI takes thevalue zero for households that live at least 150 km away fromLSLI. Accordingly, 37% of the households live less than150 km from an LSLI. In the estimation of the random effects,the treatment variable, proximity to the LSLIs is included as akey independent variable.
Other independent variables included in the estimation arederived from the conceptual framework of sustainable liveli-hoods presented in Fig. 1. We used the FAO classification oflivelihood assets under different livelihood components(Carloni and Crowley 2005). Summary statistics for thosevariables are provided in Appendix Table 10. The key naturalassets include the size of land owned, percentage of a forest,soil quality, and access to irrigation. The average area of landowned was 0.9 ha. Land owned indicates the area owned byhouseholds and is expected to have a positive relationshipwith food security. Irrigation refers to access to irrigation wa-ter by the household. Irrigation is also the main determinant oftreatment because LSLI will be attracted by the availability ofnatural resources; however, only 9% of the households haveaccess to irrigation. The average forest cover in the villagewas9.2%, while the soil quality was poor for 37% of the respon-dents. The percentage of forestlands in the village and the soilquality, as rated by the household, are expected to positivelyinfluence both the treatment variable and food security of ruralhouseholds.
Human capital variables include age, gender, and educationof the household head and household size. The average age ofthe household head is 45 years, and he or she has 1.7 years ofeducation. Age and education capture knowledge and experi-ence and are expected to positively affect household foodsecurity (Iftikhar and Mahmood 2017). About 77.5% of thehouseholds are headed by men. In the pastoral context, menoften have a more dominant and decisive role than women.Hence, we expect food security to be higher for householdsheaded by men than those led by women (gender). Householdsize, measured as the total number of family members living
3 The weights are (1.0) for eating less preferred/expensive foods, (2.0) forborrowing food or relying on help from friends and relatives, (1.0) for limitingportion sizes at meal times, (3.0) for limiting adult intake so that small childrencan eat and (1.0) reducing the number of meals per day.
314 A.E. Bekele et al.

in the household, may affect household food security nega-tively as more members of a family demand more food(Onyango 2017). A household has five members on average.
We consider livestock and distance to road and markets asthe essential physical assets affecting pastoral livelihoods. Theaverage size of livestock owned by the respondents was 6.4tropical livestock units. Local people use an animal for insur-ance against risks, as a source of income and food (Carloniand Crowley 2005). Livestock ownership is hypothesized tohave a positive impact on household food security. Proximityto rural roads and markets eases transactions of livestock andlivestock by-products and, hence, is expected to enhancehousehold food security (Dercon and Hoddinott 2005). Theaverage distance to roads is 23.7 km and to markets 86 km.This implies households’ access to markets is very challeng-ing. A study in Zambia found that LSLIs are located nearmarkets and infrastructure (Lay et al. 2018).
Financial assets such as credit use and household incomehelp pastoralists to access inputs and food and are expected toimprove household food security (Carloni and Crowley2005). The average annual household income was 5312.84Ethiopian birrs, while only 17.9% of households had accessto credit. Whether a household received cash or in-kind giftsfrom relatives or friends is a sign of social capital and helpsthem to cope with food shortages and hence improves foodsecurity. About 10% of the households have received recipro-cal in kind or cash gifts.
Participation in institutional services such as extension pro-grams can improve livestock and crop productivity and hencefood security. However, only 16.4 of the pastoral householdshave access to extension services. Drought is a context vari-able taking a value of 1 if the household reports the incidenceof drought during the survey year and 0 otherwise. About39.3% of the respondents encountered drought. Drought isexpected to negatively influence food security as it is knownto perpetually affect East African pastoralists (Fre andTesfagergis 2013). The variable livelihoods represents house-holds’ livelihood strategies and takes the value 1 for purepastoralism and 0 otherwise. Accordingly, 23% of the respon-dents were pure pastoralists. We expect pastoralists to be morevulnerable to food insecurity, and we hypothesize a negativeeffect of this variable on food security.
4 Results
4.1 Food security status of surveyed households
Table 2 shows the shares of food-secure and food-insecurehouseholds in the sample based on the three measures of foodsecurity and for the three sample years. Based on the foodintake and self–assessment approach, on average, 34% ofagropastoral households were food insecure. Using the CSI,
on average, 27% of households adopted coping strategies andhence experienced a certain level of food insecurity. Overall,the share of food-insecure households in the agropastoralareas in our sample was 32%,which is higher than the nationalaverage of 29.6% in 2016 (FAO 2013).
A higher proportion of pastoral households thanagropastoral households are food insecure based on FoodIntake and Self-Assessment measures (Table 2). Pure pasto-ralists rely on the consumption of livestock products and thepurchase of grain from the local market, while agro-pastoralists use their crop produce to supplement consump-tion. The daily caloric intake is the highest for non-farminghouseholds, followed by crop only households. Pastoralistshave the lowest amount of caloric intake. Similarly, pure pas-toralists have the highest CSI, which indicates that food inse-curity is more severe for pure pastoral than for other livelihoodstrategies.
4.2 Propensity score matching results
Propensity score matching is used to estimate the effect ofLSLI on food security while controlling for confounders thatcan affect household proximity to LSLI as well as the level offood security. About 15 variables were included as potentialconfounders using the data collected fromWave 1 (AppendixTable 5). The logistic regressions fit the data well at the 1%probability level of the likelihood ratio’s chi-square distribu-tion. The results show that the percentage of the forest, thenumber of livestock owned, the distance between market androads, and household income negatively influence the proba-bility of being treated, whereas extension participation andexposure to drought positively impact the probability of beingtreated. These results imply that households in areas withmore forest, and those who own more livestock and earnhigher income are less likely to be treated. Similarly, a longerdistance to market and road makes it less likely that a house-hold is located near an LSLI. The statistically significant neg-ative effect of distance to market and roads might be becauseLSLI sites are improving access to the market. Livestock own-ership also has a significantly negative effect on household’sproximity to LSLIs, implying that households with larger herdsizes are farther from LSLIs. On the contrary, the more accessto extension and the more exposure to drought entails a highprobability of being treated. Against our expectation, soilquality, irrigation access, and demographic variables do notstatistically significantly predict the likelihood of a house-hold’s proximity to LSLI.
Table 3 shows the results for the food security of treatedand control households before and after matching. The resultsshow significant differences in food security between house-holds that live in the vicinity of an LSLI (treated) and moreremote households (control), except for the measure of FoodIntake after matching. The effect of proximity to LSLI on food
315Large scale land investments and food security in agropastoral areas of Ethiopia
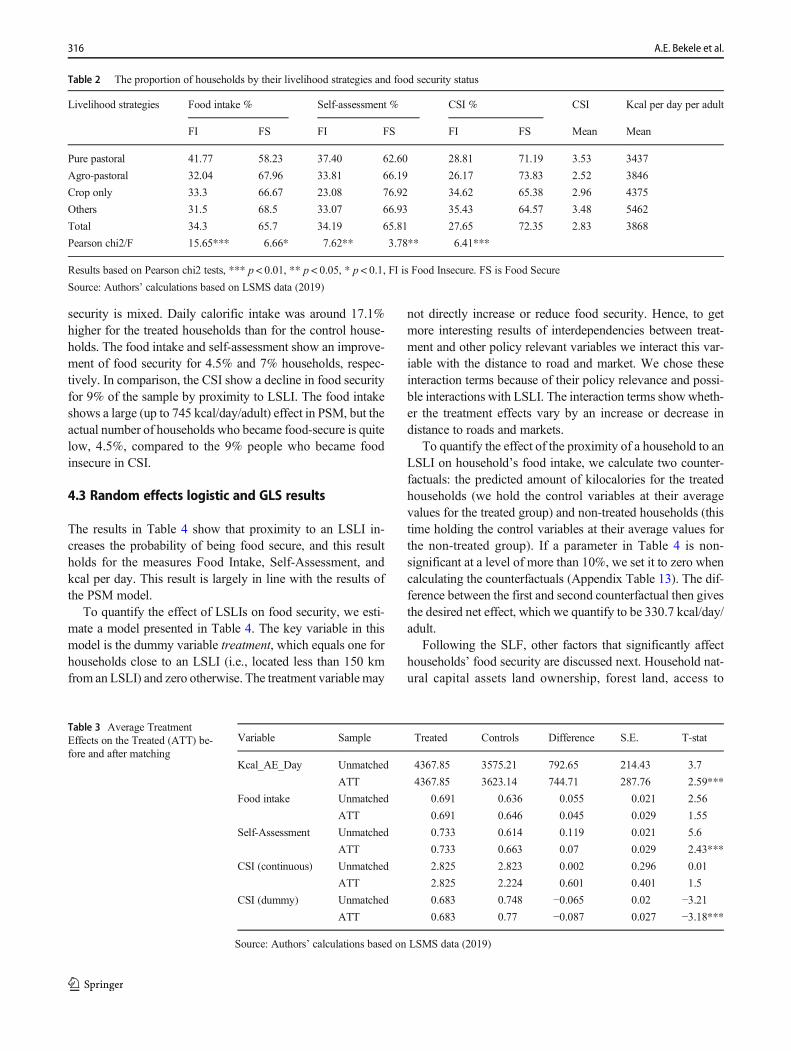
security is mixed. Daily calorific intake was around 17.1%higher for the treated households than for the control house-holds. The food intake and self-assessment show an improve-ment of food security for 4.5% and 7% households, respec-tively. In comparison, the CSI show a decline in food securityfor 9% of the sample by proximity to LSLI. The food intakeshows a large (up to 745 kcal/day/adult) effect in PSM, but theactual number of households who became food-secure is quitelow, 4.5%, compared to the 9% people who became foodinsecure in CSI.
4.3 Random effects logistic and GLS results
The results in Table 4 show that proximity to an LSLI in-creases the probability of being food secure, and this resultholds for the measures Food Intake, Self-Assessment, andkcal per day. This result is largely in line with the results ofthe PSM model.
To quantify the effect of LSLIs on food security, we esti-mate a model presented in Table 4. The key variable in thismodel is the dummy variable treatment, which equals one forhouseholds close to an LSLI (i.e., located less than 150 kmfrom an LSLI) and zero otherwise. The treatment variable may
not directly increase or reduce food security. Hence, to getmore interesting results of interdependencies between treat-ment and other policy relevant variables we interact this var-iable with the distance to road and market. We chose theseinteraction terms because of their policy relevance and possi-ble interactions with LSLI. The interaction terms showwheth-er the treatment effects vary by an increase or decrease indistance to roads and markets.
To quantify the effect of the proximity of a household to anLSLI on household’s food intake, we calculate two counter-factuals: the predicted amount of kilocalories for the treatedhouseholds (we hold the control variables at their averagevalues for the treated group) and non-treated households (thistime holding the control variables at their average values forthe non-treated group). If a parameter in Table 4 is non-significant at a level of more than 10%, we set it to zero whencalculating the counterfactuals (Appendix Table 13). The dif-ference between the first and second counterfactual then givesthe desired net effect, which we quantify to be 330.7 kcal/day/adult.
Following the SLF, other factors that significantly affecthouseholds’ food security are discussed next. Household nat-ural capital assets land ownership, forest land, access to
Table 2 The proportion of households by their livelihood strategies and food security status
Livelihood strategies Food intake % Self-assessment % CSI % CSI Kcal per day per adult
FI FS FI FS FI FS Mean Mean
Pure pastoral 41.77 58.23 37.40 62.60 28.81 71.19 3.53 3437
Agro-pastoral 32.04 67.96 33.81 66.19 26.17 73.83 2.52 3846
Crop only 33.3 66.67 23.08 76.92 34.62 65.38 2.96 4375
Others 31.5 68.5 33.07 66.93 35.43 64.57 3.48 5462
Total 34.3 65.7 34.19 65.81 27.65 72.35 2.83 3868
Pearson chi2/F 15.65*** 6.66* 7.62** 3.78** 6.41***
Results based on Pearson chi2 tests, *** p < 0.01, ** p < 0.05, * p < 0.1, FI is Food Insecure. FS is Food Secure
Source: Authors’ calculations based on LSMS data (2019)
Table 3 Average TreatmentEffects on the Treated (ATT) be-fore and after matching
Variable Sample Treated Controls Difference S.E. T-stat
Kcal_AE_Day Unmatched 4367.85 3575.21 792.65 214.43 3.7
ATT 4367.85 3623.14 744.71 287.76 2.59***
Food intake Unmatched 0.691 0.636 0.055 0.021 2.56
ATT 0.691 0.646 0.045 0.029 1.55
Self-Assessment Unmatched 0.733 0.614 0.119 0.021 5.6
ATT 0.733 0.663 0.07 0.029 2.43***
CSI (continuous) Unmatched 2.825 2.823 0.002 0.296 0.01
ATT 2.825 2.224 0.601 0.401 1.5
CSI (dummy) Unmatched 0.683 0.748 −0.065 0.02 −3.21ATT 0.683 0.77 −0.087 0.027 −3.18***
Source: Authors’ calculations based on LSMS data (2019)
316 A.E. Bekele et al.
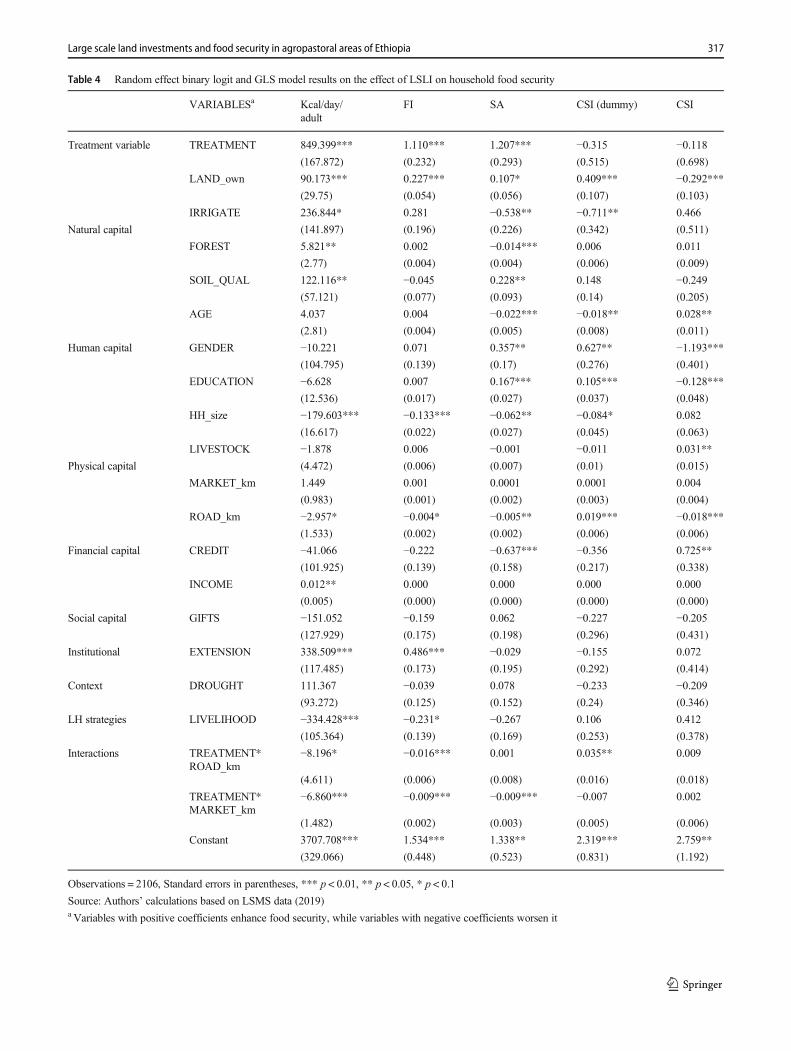
Table 4 Random effect binary logit and GLS model results on the effect of LSLI on household food security
VARIABLESa Kcal/day/adult
FI SA CSI (dummy) CSI
Treatment variable TREATMENT 849.399*** 1.110*** 1.207*** −0.315 −0.118(167.872) (0.232) (0.293) (0.515) (0.698)
LAND_own 90.173*** 0.227*** 0.107* 0.409*** −0.292***(29.75) (0.054) (0.056) (0.107) (0.103)
IRRIGATE 236.844* 0.281 −0.538** −0.711** 0.466
Natural capital (141.897) (0.196) (0.226) (0.342) (0.511)
FOREST 5.821** 0.002 −0.014*** 0.006 0.011
(2.77) (0.004) (0.004) (0.006) (0.009)
SOIL_QUAL 122.116** −0.045 0.228** 0.148 −0.249(57.121) (0.077) (0.093) (0.14) (0.205)
AGE 4.037 0.004 −0.022*** −0.018** 0.028**
(2.81) (0.004) (0.005) (0.008) (0.011)
Human capital GENDER −10.221 0.071 0.357** 0.627** −1.193***(104.795) (0.139) (0.17) (0.276) (0.401)
EDUCATION −6.628 0.007 0.167*** 0.105*** −0.128***(12.536) (0.017) (0.027) (0.037) (0.048)
HH_size −179.603*** −0.133*** −0.062** −0.084* 0.082
(16.617) (0.022) (0.027) (0.045) (0.063)
LIVESTOCK −1.878 0.006 −0.001 −0.011 0.031**
Physical capital (4.472) (0.006) (0.007) (0.01) (0.015)
MARKET_km 1.449 0.001 0.0001 0.0001 0.004
(0.983) (0.001) (0.002) (0.003) (0.004)
ROAD_km −2.957* −0.004* −0.005** 0.019*** −0.018***(1.533) (0.002) (0.002) (0.006) (0.006)
Financial capital CREDIT −41.066 −0.222 −0.637*** −0.356 0.725**
(101.925) (0.139) (0.158) (0.217) (0.338)
INCOME 0.012** 0.000 0.000 0.000 0.000
(0.005) (0.000) (0.000) (0.000) (0.000)
Social capital GIFTS −151.052 −0.159 0.062 −0.227 −0.205(127.929) (0.175) (0.198) (0.296) (0.431)
Institutional EXTENSION 338.509*** 0.486*** −0.029 −0.155 0.072
(117.485) (0.173) (0.195) (0.292) (0.414)
Context DROUGHT 111.367 −0.039 0.078 −0.233 −0.209(93.272) (0.125) (0.152) (0.24) (0.346)
LH strategies LIVELIHOOD −334.428*** −0.231* −0.267 0.106 0.412
(105.364) (0.139) (0.169) (0.253) (0.378)
Interactions TREATMENT*ROAD_km
−8.196* −0.016*** 0.001 0.035** 0.009
(4.611) (0.006) (0.008) (0.016) (0.018)
TREATMENT*MARKET_km
−6.860*** −0.009*** −0.009*** −0.007 0.002
(1.482) (0.002) (0.003) (0.005) (0.006)
Constant 3707.708*** 1.534*** 1.338** 2.319*** 2.759**
(329.066) (0.448) (0.523) (0.831) (1.192)
Observations = 2106, Standard errors in parentheses, *** p < 0.01, ** p < 0.05, * p < 0.1
Source: Authors’ calculations based on LSMS data (2019)a Variables with positive coefficients enhance food security, while variables with negative coefficients worsen it
317Large scale land investments and food security in agropastoral areas of Ethiopia

irrigation, and soil quality had a positive effect on householdfood intake, This result is supported by many findings in ruralEthiopia (Asefach and Nigatu 2007; Bogale and Korf 2007;Devereux and Sussex 2000; Feleke et al. 2003; Moreda 2018;Feleke et al. 2005; Bogale and Shimelis 2009; Christine et al.2008). But forest land and irrigation access have negativeeffects in the Self-Assessment.
Among the human capital assets, the household head’seducation and gender have a positive effect on food securityin CSI (dummy) and Self-Assessment. This is in line withIftikhar and Mahmood (2017). The age of household headsignificantly reduces food security in Self-Assessment andCSI (dummy). This is in line with the findings of Sirajea andBekeleb (2013). Household size has a significant negativeeffect on the probability of households’ food security in allfood security measures. Mannaf and Uddin (2012) andOnyango (2017) report similar findings.
Among physical capital, the number of livestock does notsignificantly affect households’ food intake, although it re-duces food intake. In CSI, livestock size significantly in-creases food insecurity. A study fromKenya also reported thathouseholds with more livestock are more food insecure(Amwata et al. 2016). As the distance to the major road in-creases, household food security significantly decreasesexcept in CSI. Distance to the market did not have asignificant effect on household food security except ininteraction terms.
Financial assets have mixed effects on food security.Household income has a positive but small effect on food se-curity in kilocalories per day. Contrary to expectation, credituse harms food security (Self-Assessment, CSI). A possibleexplanation may be that credit is taken especially by vulnerablehouseholds who want to cover immediate expenditure needsrather than using the loan for investments. Participation in theextension program (Institutions) has a significantly pos-itive effect on household food intake. Finally, pursuingpure pastoralism as a livelihood strategy significantlyimpacts daily kcal food intake. This implies that purepastoralists are more vulnerable to food insecurity thanagro-pastoralists.
5 Discussion
This study has investigated the impact of proximity to LSLIon food security of agropastoral households in Ethiopia. Wefound that proximity to LSLI positively influences householdfood security in all measurement methods except CSI. Theaverage treatment on the treated of propensity score estima-tion revealed that proximity to LSLI increases food intake byup to 745 kcal per day per adult. This implies that food avail-ability and utilization increases by proximity to LSLI. Therandom model interaction effect of proximity to LSLI with
distance to road andmarkets shows that the treated householdshave obtained 330.7 kcal/day/adult extra compared to the non-treated ones. The effect of proximity to LSLI decreases withincreasing access to roads and markets. This is because treatedhouseholds have more access to roads and markets than con-trol households. We do not find proximity to LSLI, particu-larly sugar plantations to harm household food intake as it hasbeen claimed by different authors in Ethiopia (Dheressa 2013;Moreda 2017; Shete and Rutten 2015) at least by two foodsecurity indicators out of three (Self-Assessment & FoodIntake). On the contrary, the CSI method does not indicate asignificant effect of treatment on household food securitywhen interaction terms are included. The differences in theeffect between CSI and other food security measures can beexpected since the indicators measure different dimensions offood security. In particular, the likelihood of misconception ofhouseholds while responding to coping strategies questions isexpected (Maxwell et al. 2014; Hoddinott 1999).
Once we make sure that LSLIs have a significantly positiveeffect on the household food security at least by two foodsecurity measures, now the most appealing question is, “whatare the channels of the effect of LSLI on food security?” Thereare no specific data in the LSMS on LSLI and their effect onlocal communities to answer this question. The only incom-plete data we have in LSMS is employment opportunities ofhouseholds in different enterprises (including LSLIs). Wefound that only fewer than 5% of agropastoral householdswere employed in different enterprises during the study pe-riods. In this regard, we suggest that the effects of LSLI on theemployment of the agropastoral communities need to beassessed separately. Recent studies suggest that technologytransfer from LSLI to the community did not happen inEthiopia (Moreda 2018; Lay et al. 2018). In pastoral areas,we also expect that there could be no or little technologytransfer due to the mismatch between the types of LSLIs thatare entirely crop-based (cotton, and sugar cane) whilst thedominant livelihood of rural communities is livestock-based.
As we cannot rule out whether the increase in food intakefor treated households is driven by LSLI or not, our averagetreatment on the treated result should be interpreted cautious-ly. The fact that the proximity to LSLI affects food securitypositively does not necessarily mean households have benefit-ed from the presence of LSLIs. To understand the potentialeffects of an LSLI on the host community, we run an interac-tion effect of the treatment variable with road and marketaccess. The finding shows that the effect of proximity toLSLI varies by households’ proximity to roads and markets.We also interpret the result in association with significantconfounding variables from our regression. Land ownership,forest, and soil quality positively impact Food Intake. InEthiopia, LSLIs are also located in areas with rivers and richalluvial soils (Nicol and Otulana 2014). Variation in naturalresource availability could also influence household food
318 A.E. Bekele et al.
security (Onyango 2017). Therefore, households proximate toLSLI may benefit from the availability of natural resources.
Another unexpected finding was the non-significant effectof the treatment effect of proximity to LSLI on food security inCSI. The result displays, as expected, the CSI and kcal per dayare negatively correlated, which means as CSI increases, ki-localories per day decrease. The CSI and Food Intake correct-ly classify 66.1% of the food secure as food secure and 35.4%of the food insecure as food insecure. Increased reliance oncoping strategies, in this case, is associated with lower foodavailability (Hoddinott 1999).
Among control variables according to the SLF, the vari-ables associated with high food insecurity were householdsize, credit use, and livelihood strategies (pursuing pure pas-toralism), while land owned, soil quality, forest, proximity tomarket, and income enhance food intake. Therefore, familyplanning practices and livelihood diversification strategiesneed to be introduced into agropastoral regions. There aresome unintended results, irrigation access (Self-Assessment),credit, and livestock (kcal per day). Households’ access toirrigation water does not show the expected sign in Self-Assessment and Coping strategies methods. Two rea-sons could cause this. First, the proportion of house-holds with access to irrigation is very small (9%),which may bring unintended results. Second, the dietof agro-pastoralists is mainly based on milk and cereals.Once they start using irrigation for vegetable produc-tion, they may earn more income from selling vegeta-bles. However, the income may not go back to improvehousehold consumption. Access to irrigation may notaffect the food situation directly (Christine et al. 2008).
Similarly, livestock and social capital variables (receivingcash and in-kind gifts) have no significant effect on householdfood security. In food intake, livestock size has an adverseeffect on food security; however, it has no significant effect.These results have been confirmed by different authors inAfrica (Amwata et al. 2016; Mayanja et al. 2015; Little et al.2008). The probable justification was agro-pastoralists closeto LSLI keep a small number of livestock as livestock sizedeclines due to sugar plantations (Shete and Rutten 2015;Ibrahim 2016). Although they keep small livestock, they haverelatively better access to pasture and water than do remoteresource-scarce areas (Sirajea and Bekeleb 2013).
6 Conclusion and policy implications
The finding of the study indicates that 32% of agropastoralhouseholds in Ethiopia suffering from food insecurity. Foodinsecurity problems vary from region to region, with the mostpastoral regions having more food insecurity thanagropastoral areas. The finding attests that proximity to anLSLI is associated with better food consumption. The
interaction effect of proximity to LSLI with proximity to roadand market increases household food intake. Hence, the treat-ment effect of proximity to large scale land investmentlowers with better access to roads and markets.However, we argue the food intake of agro-pastoralistsclose to LSLIs is increased not necessarily because ofthe direct benefits from LSLIs but because the LSLIsare in areas with relatively fertile land and rivers. Onthe other hand, proximity to LSLI did not reduce thecoping strategies index of sample households.
The effect of LSLIs in employment generation and tech-nology transfer is one of the debated issues. Past studies con-firm no substantial employment and technology transfer fromLSLIs to the host communities in Ethiopia. This is because ofthe mismatch between pastoralists’ experience and skill andthe types of investments (e.g., sugar farming is different fromlivestock herding). Future LSLIs in rural areas need to consid-er the importance of linking their business to the livestocksector to realize technology exchange between the LSLIsand the community. This study shows that less than 5% ofthe employment comes from non-farm enterprises, amongwhich the share of LSLIs was small. However, this shouldby nomeans be taken as conclusive, rather should be the focusof future studies. LSLI can be a vital source of economicgrowth in Ethiopia. However, it should be practiced responsi-bly so that adequate compensation, technology transfer, andemployment opportunity are ensured for the host community.Hence, we suggest that policymakers release policies thatguide large scale land investments to relate their investmentsto the livelihoods of the host communities and helpthem achieve food security. Such actions will also helpthe sustainability and success of the LSLIs as it mini-mizes the conflicts that arise over land use. Furtherresearch could be done to explore the linkage betweenLSLI local employment and livestock productivity in anagropastoral context. Finally, policymakers must notethat food security is a complex issue that cannot becaused and solved by a single factor.
Acknowledgments We gratefully thank NUFFIC for funding this studythrough NICHE-ETH-259-Development of an executive MBAAgribusiness strengthening program. We also thank WageningenUniversity and Research (WUR), and Jimma University (JU) for provid-ing the facility for this study. We also extend our appreciation for theMaastricht School of Management for the overall coordination of theproject activities. We appreciate the World Bank and the Ethiopian sta-tistical agency for the Living StandardMeasurement Survey data. Finally,we thank the chief editor Serge Savary, the anonymous section editor, andtwo reviewers for providing constructive comments that improved thispaper.
Compliance with ethical standards
Conflict of interest The authors declared that they have no conflict ofinterest.
319Large scale land investments and food security in agropastoral areas of Ethiopia

Appendix
Table 5 Logistic regression of factors affecting the probability oftreatment
VARIABLES Coef. se
LAND_own 0.027 0.079
IRRIGATE 0.229 0.357
FOREST −0.032*** 0.008
SOIL_QUAL 0.194 0.135
AGE −0.007 0.006
GENDER 0.018 0.241
EDUCATION 0.024 0.03
HH_size 0.049 0.037
LIVESTOCK −0.04** 0.016
MARKET_km −0.005*** 0.002
ROAD_km −0.016*** 0.005
INCOME −0.00005** 0.00002
EXTENSION 1.23*** 0.286
DROUGHT 2.127*** 0.196
LIVELIHOOD 0.13 0.247
Constant −0.71 0.482
Number of obs 713
LR chi2(15) = 224.57
Prob > chi2 =0.000
Pseudo R2 =0.238
Log likelihood = −358.70319
*** p < 0.01, ** p < 0.05, * p < 0.1
Table 6 Selection of matchingalgorithm Caliper Number of insignificant
variablesPsudo R2 Sample
matchedMean Bias
Caliper (Radius 0.03) 11 0.010 1463 4.1
Caliper (Radius 0.06) 11 0.020 1463 5.9
Caliper (Radius 0.08) 10 0.023 1464 5.8
Caliper (Radius 0.1) 11 0.026 1464 6.3
Nearest neighbour without replacement 10 0.015 2033 4.4
Nearest neighbour with replacement 8 0.011 2033 4.8
Kernel (bandwidth 0.01) 8 0.004 2033 2.7
Kernel (bandwidth 0.08) 9 0.005 2033 2.6
Kernel (bandwidth 0.1) 9 0.004 2033 2.7
Kernel (bandwidth 0.25) 9 0.014 2033 5.1
Table 7 Matching quality of thepropensity score matching Sample Ps R2 LR chi2 p>chi2 Mean Bias Med Bias B R %Var
Unmatched 0.127 341.41 0.000 18.7 16.1 87.0* 0.49* 55
Matched 0.004 8.97 0.879 3.1 2.6 15.4 1.12 55
320 A.E. Bekele et al.
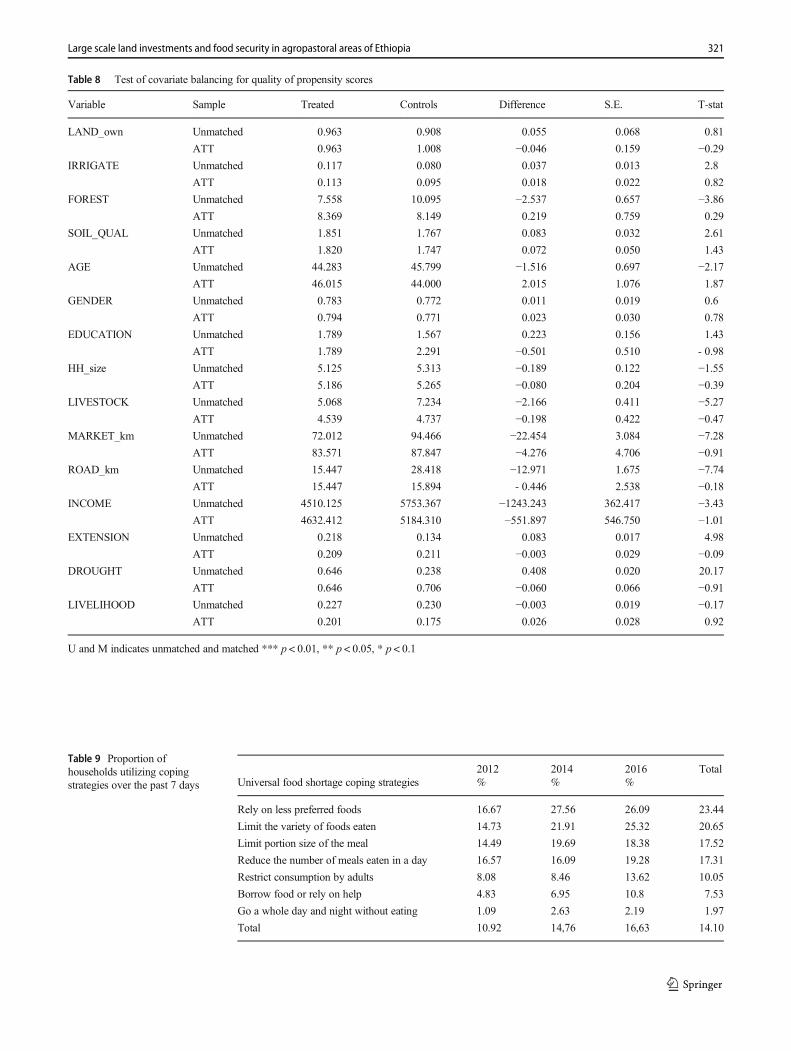
Table 8 Test of covariate balancing for quality of propensity scores
Variable Sample Treated Controls Difference S.E. T-stat
LAND_own Unmatched 0.963 0.908 0.055 0.068 0.81
ATT 0.963 1.008 −0.046 0.159 −0.29IRRIGATE Unmatched 0.117 0.080 0.037 0.013 2.8
ATT 0.113 0.095 0.018 0.022 0.82
FOREST Unmatched 7.558 10.095 −2.537 0.657 −3.86ATT 8.369 8.149 0.219 0.759 0.29
SOIL_QUAL Unmatched 1.851 1.767 0.083 0.032 2.61
ATT 1.820 1.747 0.072 0.050 1.43
AGE Unmatched 44.283 45.799 −1.516 0.697 −2.17ATT 46.015 44.000 2.015 1.076 1.87
GENDER Unmatched 0.783 0.772 0.011 0.019 0.6
ATT 0.794 0.771 0.023 0.030 0.78
EDUCATION Unmatched 1.789 1.567 0.223 0.156 1.43
ATT 1.789 2.291 −0.501 0.510 - 0.98
HH_size Unmatched 5.125 5.313 −0.189 0.122 −1.55ATT 5.186 5.265 −0.080 0.204 −0.39
LIVESTOCK Unmatched 5.068 7.234 −2.166 0.411 −5.27ATT 4.539 4.737 −0.198 0.422 −0.47
MARKET_km Unmatched 72.012 94.466 −22.454 3.084 −7.28ATT 83.571 87.847 −4.276 4.706 −0.91
ROAD_km Unmatched 15.447 28.418 −12.971 1.675 −7.74ATT 15.447 15.894 - 0.446 2.538 −0.18
INCOME Unmatched 4510.125 5753.367 −1243.243 362.417 −3.43ATT 4632.412 5184.310 −551.897 546.750 −1.01
EXTENSION Unmatched 0.218 0.134 0.083 0.017 4.98
ATT 0.209 0.211 −0.003 0.029 −0.09DROUGHT Unmatched 0.646 0.238 0.408 0.020 20.17
ATT 0.646 0.706 −0.060 0.066 −0.91LIVELIHOOD Unmatched 0.227 0.230 −0.003 0.019 −0.17
ATT 0.201 0.175 0.026 0.028 0.92
U and M indicates unmatched and matched *** p < 0.01, ** p < 0.05, * p < 0.1
Table 9 Proportion ofhouseholds utilizing copingstrategies over the past 7 days
2012 2014 2016 TotalUniversal food shortage coping strategies % % %
Rely on less preferred foods 16.67 27.56 26.09 23.44
Limit the variety of foods eaten 14.73 21.91 25.32 20.65
Limit portion size of the meal 14.49 19.69 18.38 17.52
Reduce the number of meals eaten in a day 16.57 16.09 19.28 17.31
Restrict consumption by adults 8.08 8.46 13.62 10.05
Borrow food or rely on help 4.83 6.95 10.8 7.53
Go a whole day and night without eating 1.09 2.63 2.19 1.97
Total 10.92 14,76 16,63 14.10
321Large scale land investments and food security in agropastoral areas of Ethiopia

Table 10 Summary statistics of the independent variables and expected sign
SLF elements Variable Measurement Mean/% Std. Dev. Min Max Expected sign
Treatment Variable LSLI_km Kilometre 214.57 126.57 12 482
<150 km 1 if <150 km, 0, otherwise 0.37 0.483 0 1
Natural LAND_own Hectare 0.935 1.501 0 26.2 +
IRRIGATE 1 if access, 0 otherwise 0.092 0.289 0 1 +
BUSH % 34.919 29.297 0 100 +
FOREST % 9.214 14.604 0 95 +
SOIL_QUAL 1=Poor 0.37 0.708 1 3 +
2=Fair 0.461
3=Good 0.169
AGE Years 45.168 15.373 17 97 +
Human GENDER (1=male, 0 Female) 0.775 0.418 0 1 +
EDUCATION Years of schooling 1.668 3.475 0 17 +
HH_size Number 5.237 2.681 1 15 –
Physical LIVESTOCK Tlu 6.434 9.114 0 85.5 +
MARKET_km Kilometre 86.068 68.893 0.5 283.3 _
ROAD_km Kilometre 23.675 37.367 0 271 _
Financial CREDIT 1 if access, 0 otherwise 0.179 0.384 0 1 +
INCOME Ethiopian Birr 5312.84 8016.68 0 75,010 +
Social GIFTS 1 if yes, 0 otherwise 0.101 0.301 0 1 +
Policies & Institutions EXTENSION 1 if yes, 0 otherwise 0.1639 0.37 0 1 +
Context DROUGHT 1 if yes, 0 otherwise 0.3933 0.489 0 1 –
Livelihood strategies LIVELIHOOD 1 for pastoral, 0 otherwise 0.2301 0.421 0 1 –
Source: Authors’ calculations based on LSMS data (2019)
Table 11 Multicollinearity diagnostics
VIF SQRT VIF Tolerance R-squared
LSLI_km 1.46 1.21 0.685 0.315
LAND_own 1.25 1.12 0.797 0.203
IRRIGATE 1.07 1.04 0.931 0.069
FOREST 1.04 1.02 0.961 0.039
SOIL_QUAL 1.02 1.01 0.983 0.017
AGE 1.1 1.05 0.911 0.089
GENDER 1.14 1.07 0.874 0.126
EDUCATION 1.13 1.06 0.887 0.113
HH_size 1.2 1.1 0.834 0.167
LIVESTOCK 1.09 1.05 0.913 0.087
MARKET_km 1.35 1.16 0.739 0.261
ROAD_km 1.56 1.25 0.639 0.361
CREDIT 1.04 1.02 0.964 0.037
INCOME 1.11 1.05 0.900 0.100
GIFTS 1.01 1.01 0.986 0.014
EXTENSION 1.23 1.11 0.813 0.187
DROUGHT 1.25 1.12 0.799 0.201
LIVELIHOOD 1.23 1.11 0.816 0.184
Mean VIF 1.18
Table 12 Breusch and Pagan Lagrangian multiplier test for randomeffects
var sd=sqrt(Var)
Kcal per day 3,462,476 1860.77
e 2,726,749 1651.29
u 361,059.1 600.882
chibar2(01) = 14.85
Test: Var(u) =0
Prob > chibar2 = 0.0001***
322 A.E. Bekele et al.
Table13
The
interactioneffectof
LSL
Iwith
distance
toroad
andmarketo
nhouseholdfood
security
Variable
Coefficient
(setto
0if
significance
>10%)
Average
valueof
the
variableforthetreated
group
Average
valueof
the
variableforthenon-treated
group
Predicted
valueo
fkcalfortreaded
Predicted
valueof
kcalfornon-treaded
The
neteffecto
fLSL
I
TREATMENT
849.399
1.000
0.000
849.399
0.000
849.399
LAND_own
90.173
0.954
0.905
86.025
81.607
4.418
IRRIG
ATE(1/0)
236.844
0.117
0.079
27.616
18.753
8.863
FOREST
5.821
7.547
10.124
43.932
58.933
−15.001
SOIL_Q
UAL
122.116
1.851
1.768
226.036
215.901
10.136
AGE
0.000
44.160
45.760
0.000
0.000
0.000
GENDER(M
en)
0.000
0.780
0.771
0.000
0.000
0.000
EDUCATIO
N0.000
1.810
1.590
0.000
0.000
0.000
HH_size
−179.603
5.101
5.316
−916.156
−954.771
38.615
LIV
EST
OCK(TLU)
0.000
5.100
7.200
0.000
0.000
0.000
MARKET_km
0.000
71.447
94.414
0.000
0.000
0.000
ROAD_km
−2.957
15.567
28.370
−46.034
−83.894
37.860
CREDIT
(1/0)
0.000
0.186
0.176
0.000
0.000
0.000
INCOME
0.012
4540.578
5764.229
54.487
69.171
−14.684
GIFTS(1/0)
0.000
1.910
1.890
0.000
0.000
0.000
EXTENSION(1/0)
338.509
0.215
0.133
72.779
45.022
27.758
DROUGHT(1/0)
0.000
0.648
0.238
0.000
0.000
0.000
LIV
ELIH
OOD(1/0)
−334.428
0.229
0.232
−76.584
−77.587
1.003
TREATMENTxROAD_km
−8.196
15.567
0.000
−127.586
0.000
−127.586
TREATMENTxMARKET_km
−6.860
71.447
0.000
−490.106
0.000
−490.106
Neteffect
−296.192
−626.867
330.675
323Large scale land investments and food security in agropastoral areas of Ethiopia

Open Access This article is licensed under a Creative CommonsAttribution 4.0 International License, which permits use, sharing, adap-tation, distribution and reproduction in any medium or format, as long asyou give appropriate credit to the original author(s) and the source, pro-vide a link to the Creative Commons licence, and indicate if changes weremade. The images or other third party material in this article are includedin the article's Creative Commons licence, unless indicated otherwise in acredit line to the material. If material is not included in the article'sCreative Commons licence and your intended use is not permitted bystatutory regulation or exceeds the permitted use, you will need to obtainpermission directly from the copyright holder. To view a copy of thislicence, visit http://creativecommons.org/licenses/by/4.0/.
References
Aklilu, Y., & Catley, A. (2014). Pastoral livestock trade and growth inEthiopia. Future agricultures, policy brief (72). Future AgriculturesConsortium Secretariat at the University of Sussex, Brighton, UK.
Ali, D., Deininger, K., & Harris, A. (2018). Does large farm establish-ment create benefits for neighboring smallholders? Evidence fromEthiopia. (pp. 4). Washingiton DC: World Bank.
Amwata, D. A., Nyariki, D. M., & Musimba, N. R. (2016). Factorsinfluencing pastoral and agropastoral household vulnerability tofood insecurity in the drylands of Kenya: a case study of Kajiadoand Makueni counties. Journal of International Development,28(5), 771–787.
Asefach, A., & Nigatu, R. (2007). Correlates of household food security indensely populated areas of southern Ethiopia: does the household struc-ture matter? Studies on Home and Community Science, 1(2), 85–91.
Baltagi, B. (2008). Econometric analysis of panel data. Wiley.Becker, S. O., & Ichino, A. (2002). Estimation of average treatment
effects based on propensity scores. The Stata Journal, 2(4), 358–377. https://doi.org/10.1177/1536867x0200200403.
Behnke, R. H., & Kerven, C. (2013). Counting the costs: Replacingpastoralism with irrigated agriculture in the Awash Valley, north-eastern Ethiopia: IIED London.
Beirne, J. (2014). Gilgel Gibe III: Dam-induced displacement in Ethiopiaand Kenya. In F. Gemenne, P. Brücker, & D. Ionesco (Eds.), Thestate of environmental migration 2014 (p. 215:234). IOM, specialsection.
Bishop, D. (2015). Livelihoods in Zimbabwe: Evaluation of food securityand strengthening livelihood options. Effectiveness review series2013/14: Zimbabwe – Management Response of Oxfam GB.
Bogale, A., & Korf, B. (2007). To share or not to share? (non-)violence,scarcity and resource access in Somali region, Ethiopia. The Journalof Development Studies, 43(4), 743–765. https://doi.org/10.1080/00220380701260093.
Bogale, A., & Shimelis, A. (2009). Household level determinants of foodinsecurity in rural areas of Dire Dawa, eastern Ethiopia. AfricanJournal of Food, Agriculture, Nutrition and Development, 9(9).
Burchi, F., & De Muro, P. (2016). From food availability to nutritionalcapabilities: advancing food security analysis. Food Policy, 60, 10–19.
Carloni, A. S., & Crowley, E. L. (2005). Rapid guide for missions:Analysing local institutions and livelihoods: Guidelines (Vol. 1).Rome: Food & Agriculture Organization of the United States.
Chambers, R.,&Conway,G. (1992). Sustainable rural livelihoods: Practicalconcepts for the 21st century. Institute of Development Studies (UK).
Christine, J., Willibald, L., Dominik, R., Michael, H., Awulachew, S. B.,& Hagos, F. (2008). Impact of irrigation on livelihood and foodsecurity in the modern Hare River Irrigation Scheme in SouthernEthiopia. IWMI (No. 614-2040800). https://publications.iwmi.org/pdf/H044076.pdf.
CSA (2007). Population and housing census 2007 report. Central StatisticalAgency.
CSA (2014). Comprehensive food security and vulnerability analysisEthiopia. UN World Food Programme and the Central StatisticalAgency (CSA) of Ethiopia, Addis Abeba.
CSA (2017). Ethiopia Socioeconomic Survey (ESS). Basic InformationDocument on Living Standards Measurement Study (LSMS),World Bank. Wave Three (2015/2016).
Daniel, A., Klaus, D., & Anthony, H. (2018). Does large farm establish-ment create benefits for neighboring smallholders? Evidence fromEthiopia. [Policy Brief]. Lnad Governance (3), 4.
0 .2 .4 .6 .8 1Propensity Score
Untreated Treated
Fig. 3 Distribution of propensity score between treatment and controlgroups
0
0 2000 4000 6000 8000Fitted values
Fig. 4 Normality of residuals
324 A.E. Bekele et al.

Deininger, K., & Byerlee, D. (2010). The rise of large-scale farms in land-abundant developing countries: Does it have a future. In ConferenceAgriculture for Development-Revisited, University of California atBerkeley. October (pp. 1-2).
Dercon, S., & Hoddinott, J. (2005). Livelihoods, growth, and links tomarket towns in 15 Ethiopian villages.
Devereux, S., & Sussex, I. (2000). Food insecurity in Ethiopia: A discus-sion paper for DFID. Institute for Development Studies. https://www.ids.ac.uk/download.php?file=files/FoodSecEthiopia4.pdf.
Devereux, S., Baulch, B., Hussein, K., Shoham, J., & Wilcock, D. (2004).Improving the analysis of food insecurity. Food insecurity measure-ment, livelihoods approaches and policy: Applications in FIVIMS. InImproving the analysis of food insecurity. Food insecurity measure-ment, livelihoods approaches and policy: applications in FIVIMS:FIVIMS.
DFID. (1999). In DFID (Ed.), Sustainable livelihoods guidance sheets.London.
Dheressa, D. K. (2013). The socio-economic and environmental impactsof large scale (agricultural) land acquisition on local livelihoods: Acase study in Bako Tibe Woreda of Oromia region, Ethiopia. MScThesis. Centre for Development and the Environment University ofOslo Blindern, Norway.
Do,T.L.,Nguyen,T.T.,&Grote,U. (2019).Nonfarmemploymentandhouse-hold food security: evidence from panel data for rural Cambodia. FoodSecurity, 11(3), 703–718. https://doi.org/10.1007/s12571-019-00929-8.
Dye, J. (2015). Food Security & Large-Scale Land Acquisitions: Thecases of Tanzania and Ethiopia. University of Cincinnati.
EHNRI. (1997). Kilo calories of different food groups. Ethiopian Healthand Nutrition Research Institute/EHNRI/.
Elias, E. (2008). Pastoralists in southern Ethiopia: Dispossession, Access toResources and Dialogue with Policy Makers. DCG Report No. 53.
Ellis, F. (2000). Rural livelihoods and diversity in developing countries.Oxford University Press.
FAO (1996). Rome declaration on world food security and world foodsummit plan of action. From 13-17 November 1996, Rome Italy.http://www.fao.org/3/w3613e/w3613e00.htm.
FAO (2013). Comprehensive Africa agriculture development Programme(CAADP) east and Central Africa regional CAADP nutrition pro-gram development workshop nutrition country paper – EthiopiaDRAFT February 2013.
FAREH, A. M. (2011). Opportunities and challenges in implementingpoverty reduction policies in pastoral communities: A case studyfrom the Somali regional state, Ethiopia (Doctoral dissertation).Ritsumeikan Asia Pacific University. https://core.ac.uk/download/pdf/60537386.pdf.
FDRE (2013). Pastoral community development project PCDP-3.Regional pastoral livelihood resilience project (RPLRP) social as-sessment report. Addis Ababa, Ethiopia. Available at http://documents1.worldbank.org/curated/en/361031468030840773/pdf/IPP6640PCDP0II000PUBLIC00Box379843B.pdf.
Feleke, S., Kilmer, R. L., & Gladwin, C. (2003). Determinants of foodsecurity in southern Ethiopia. A selected paper presented at theannual meetings of the American Agricultural EconomicsAssociation, July 27-30, Montreal, Canada. https://doi.org/10.22004/ag.econ.22010.
Feleke, S. L., Kilmer, R., & Gladwin, C. H. (2005). Determinants of foodsecurity in southern Ethiopia. Agricultural Economics, 33, 351–363.https://doi.org/10.1111/j.1574-0864.2005.00074.x.
Fre, Z., & Tesfagergis, B. (2013). Economic contribution of pastoral andagro pastoral production to food security and livelihoods systems inAfrica: The case of eastern Sudan, Eritrea and Western Ethiopia inthe horn of Africa. Ethiopian e-journal For Research andInnovation Foresight, 5, 14–31.
FSS (2002). Poverty and Poverty Policy in Ethiopia. Food SecurityStrategy (FSS). Special Issue of Consultation Papers on Poverty
No.7. . Addis Ababa, Ethiopia: Proceeding of the workshop orga-nized by Forum for social Studies.
Haji, J., & Legesse, B. (2017). Impact of sedentarization program on thelivelihood and food security of Ethiopian pastoralists. Journal ofArid Environments, 136, 45–53. https://doi.org/10.1016/j.jaridenv.2016.10.007.
Halderman, M. (2004). The political economy of pro-poor policy-makingin Ethiopia. Pro-poor livestock policy initiative. FAO PPLPI work-ing paper 19. http://www.fao.org/ag/againfo/programmes/en ….
Headey, D., Taffesse, A. S., & You, L. (2014). Diversification and develop-ment in pastoralist Ethiopia.World Development, 56, 200–213.
Heinrich, C., Maffioli, A., & Vázquez, G. (2010). A primer for applyingpropensity-score matching. Impact-evaluation guidelines technicalnotes no. IDB-TN-161. Inter-American Development Bank.
Hoddinott, J. (1999). Choosing outcome indicators of household foodsecurity: Citeseer.
Hussein, K. (2002). The relevance of livelihoods approaches to foodinsecurity measurement. ELDIS/IDS.
Ibrahim, J. (2016). Socio-economic effect of Tendaho sugar cane planta-tion on the pastoral livelihood of Afar National Regional State. St.Mary’s University.
Iftikhar, S., & Mahmood, H. Z. (2017). Human capital development andfood security nexus: An empirical appraisal from districts of Punjabprovince. Journal of Food and Drug Research, 1(1).
ILRI (2017). Ethiopia livestock sector analysis. Developed by theEthiopia Ministry of Livestock and Fisheries and the InternationalLivestock Research Institute Livestock master plan team.
Kébé, M., & Muir, J. (2008). The sustainable livelihoods approach: Newdirections in west and Central African small-scale fisheries.Achieving poverty reduction through responsible fisheries: lessonsfrom West and Central Africa, FAO Fisheries and AquacultureTechnical Paper(513), 5-22.
Keeley, J. (2014). Large-scale land deals in Ethiopia: Scale, trends,features and outcomes to date. International Institute forEnvironment and Development (iied).
Khandker, S., Koolwal G, B., & Samad, H. (2009). Handbook on impactevaluation: Quantitative methods and practices. The World Bank.
Krantz, L. (2001). The sustainable livelihood approach to poverty reduc-tion. SIDA. Division for Policy and Socio-Economic Analysis, 44.
Kupzyk, K. A., & Beal, S. J. (2017). Advanced issues in propensityscores: longitudinal and missing data. The Journal of EarlyAdolescence, 37(1), 59–84.
Lay, J., & Nolte, K. (2017). Determinants of foreign land acquisitions inlow-and middle-income countries. Journal of EconomicGeography, 18(1), 59–86.
Lay, J., Nolte, K., & Sipangule, K. (2018). Large-scale farms and small-holders: Evidence from Zambia. GIGA Working Papers.
Little, P. D., McPeak, J., Barrett, C. B., & Kristjanson, P. (2008).Challenging orthodoxies: understanding poverty in pastoral areasof East Africa. Development and Change, 39(4), 587–611.
Maliwichi, L., Oni, S., & Obadire, O. (2012). An investigation into thefactors affecting food availability, choices and nutritional adequacyof smallholder farming households under irrigation and drylandfarming in Vhembe district of Limpopo, province, South Africa.African Journal of Agricultural Research, 7(25), 3653–3664.
Mannaf, M., & Uddin, M. T. (2012). Socioeconomic factors influencingfood security status of miaze growing households in selected areasof Bogra district. Bangladesh Journal of Agricultural Economics,35(1–2), 177–187. https://doi.org/10.22004/ag.econ.196772.
Maxwell, D. G. (1995). Alternative food security strategy: A householdanalysis of urban agriculture in Kampala. World Development,23(10), 1669–1681. https://doi.org/10.1016/0305-750X(95)00073-L.
Maxwell, S. (1996). Food security: A post-modern perspective. FoodPolicy, 21(2), 155–170. https://doi.org/10.1016/0306-9192(95)00074-7.
325Large scale land investments and food security in agropastoral areas of Ethiopia
Maxwell, S., & Frankenberger, T. (1995). Household food security:Concepts, indicators, measurements: A technical review (pp. 280).New York: UNICEF.
Maxwell, D., & Wiebe, K. D. (1998). Land tenure and food security: Areview of concepts, evidence, and methods, 129. Land TenureCenter, University of Wisconsin-Madison.
Maxwell, D., & Caldwell, R. (2008). The coping strategies index: A toolfor rapid measurement of household food security and the impact offood aid programs in humanitarian emergencies field methods man-ual second edition. Cooperative for Assistance and ReliefEverywhere, Inc.
Maxwell, D., Watkins, B., Wheeler, R., & Collins, G. (2003). The copingstrategies index: A tool for rapidly measuring food security and theimpact of food aid programs in emergencies. Nairobi: CARE Easternand Central Africa Regional Management Unit and the World FoodProgramme Vulnerability Assessment and Mapping Unit.
Maxwell, D., Vaitla, B., & Coates, J. (2014). How do indicators of house-hold food insecurity measure up? An empirical comparison fromEthiopia. Food Policy, 47, 107–116. https://doi.org/10.1016/j.foodpol.2014.04.003.
Mayanja, M., Rubaire-Akiiki, C., Greiner, T., & Morton, J. (2015).Characterising food insecurity in pastoral and agro-pastoral commu-nities in Uganda using a consumption coping strategy index.Pastoralism, 5(1), 11.
Moreda, T. (2017). Large-scale land acquisitions, state authority and indige-nous local communities: insights fromEthiopia. ThirdWorldQuarterly,38(3), 698–716. https://doi.org/10.1080/01436597.2016.1191941.
Moreda, T. (2018). The right to food in the context of large-scale landinvestment in Ethiopia. Third World Quarterly, 1–22.
Nicol, A., &Otulana,M. (2014). ContestedMargins, Complex Pathways:The Afar Triangle in the Horn of Africa Working Paper 094. www.future-agricultures.org
Nixon, L. G. (2013). Implications of government-led large-scale land andwater acquisitions: On local communities livelihoods in Ethiopia:- acase of Omo-Kuraz sugarcane development project at lower OmoValley. The Hague: Master of Arts in Development Studies.
Onyango, O. D. (2017). Assessing the factors influencing food and live-lihood security among pastoral communities in Turkana County,Kenya, University of Nairobi. University of Nairobi.
Pavanello, S. (2009). Pastoralists’ vulnerability in the horn of Africa:Exploring political marginalisation, donors’ policies and cross-border issues–literature review. Humanitarian Policy Group(HPG) Overseas Development Institute London, UK.
Rosenbaum, P. R., & Rubin, D. B. (1983). The central role of the pro-pensity score in observational studies for causal effects. Biometrika,70(1), 41–55.
Said, A. (1994). Pastoralism and the state policies in mid-awash valley:The case of the Afar. Ethopia: Nordiska Afrikainstitutet.
Schmidt, M., & Pearson, O. (2016). Pastoral livelihoods under pressure:ecological, political and socioeconomic transitions in Afar(Ethiopia). Journal of Arid Environments, 124, 22–30.
Scoones, I. (1998). Sustainable rural livelihoods: a framework foranalysis. IDS working papers,72. https://www.ids.ac.uk/publications/sustainable-rural-livelihoods-a-framework-for-analysis/.
Serrat, O. (2017). The sustainable livelihoods approach. In Knowledgesolutions (pp. 21-26): Springer.
Shete, M., & Rutten, M. (2015). Impacts of large-scale farming on localcommunities’ food security and income levels–empirical evidencefrom Oromia region, Ethiopia. Land Use Policy, 47, 282–292.
Sirajea, I., & Bekeleb, A. (2013). Assessment of food insecurity andcoping mechanisms among pastoral households of Afar national
regional state: the case of Chifra district, Ethiopia. EthiopianJournal of Agricultural Sciences, 23(1–2), 145–156.
Slater, J., & Yeudall, F. (2015). Sustainable livelihoods for food andnutrition security in Canada: a conceptual framework for publichealth research, policy, and practice. Journal of hunger & environ-mental nutrition, 10(1), 1–21.
SNV (2012). Improved livelihoods for pastoralists. SNV (Netherlandsdevelopment organization) practice brief, issue 2. https://snv.org/cms/sites/default/files/explore/download/improved_livelihoods_for_pastoralists.pdf.
Verbeek, M. (2008). A guide to modern econometrics. Wiley.
Adugna Eneyew Bekele is a lec-turer at Jimma University Collegeof Agriculture & VeterinaryMedicine (JUCAVM), Ethiopiaa n d a P hD c a n d i d a t e i nAgricultural Economics and RuralPolicy group at WageningenUniversity and Research (WUR),the Netherlands. His research areasincludes food and nutrition securi-ty, value chain and market analy-sis, sustainable livelihoods, climatechange and impact assessments.He has several publications on in-ternational journals in subjects
mentioned above. He has attended several international courses includingrural entrepreneurships, monitoring and evaluation of food and nutritionprograms, value chain analysis and leadership. Currently he is doing hisPhD research on the “Drivers of change in Ethiopian agro-pastoral liveli-hoods in Ethiopia”.
Liesbeth Dries is AssociateProfessor at the AgriculturalEconomics andRural Policy groupat Wageningen University &Research, The Netherlands. Shejoined Wageningen University &Research after holding positionsas a Lecturer in Agribusiness atLincoln University, New Zealandand as Assistant Professor inAgricultural and Food Policy atthe Katholieke UniversiteitLeuven, Belgium. Her research fo-cuses on the organization of agri-food supply chains and contractual
arrangements targeting sustainable practices. She acted as a consultant forvarious international organizations including the European Parliament; theEuropean Training Foundation; European Bank for Reconstruction andDevelopment; Food and Agriculture Organization of the UN; EuropeanCommission; World Bank.
326 A.E. Bekele et al.

Wim Heijman (1953) receivedMSc degrees respectively inE c o n o m i c s a n d H um a nGeog r a phy f r om Ti l b u rgUniversity and the University ofUtrecht in the Netherlands. He re-ceived his PhD degree fromWageningen University. In 2000he was appointed Professor ofRegional Economics at the latteruniversity. His major researchtopics and areas of education arerural development, landscape eco-nomics, and the assessment of theregional economic impact of tour-
ism. Prof. Heijman was awarded honorary doctor’s degrees by theUniversity of Debrecen in 1999 and the Slovak University of Agriculturein Nitra (2016). In 2004, 2014, 2015 and 2016 he received honorary pro-fessor titles from the Czech University of Life Sciences in Prague, theMongolian University of Life Sciences in Ulaanbaatar, Stavropol StateAgrarian University (Russia), and Belgorod State Agricultural University(Russia) respectively.
Dušan Drabik is an AssistantProfessor in the AgriculturalEconomics and Rural Policy(AEP) Group at WageningenUniversity, The Netherlands. Hisr e s e a r c h i n t e r e s t s a r e i nAgricultural, Environmental, andApplied Welfare Economics.Dušan has published widely onthe market and environmental ef-fects of biofuel policies in severalparts of the world and on foodcommodity prices in the biofuelera. He is interested in the devel-o pmen t o f t h e Eu r o p e a n
bioeconomy and how the land markets in Central and Eastern Europedetermine the agricultural production structure in those countries.
327Large scale land investments and food security in agropastoral areas of Ethiopia