Embed Size (px)
Citation preview

BioMed CentralBMC Evolutionary Biology
ss
Open AcceResearch articleLarge-scale genomic 2D visualization reveals extensive CG-AT skew correlation in bird genomesXuegong Deng1,2, Ilkka Havukkala3 and Xuemei Deng*1Address: 1State Key Laboratory of Agrobiotechnology & the Key laboratory of Animal Genetics and Breeding of the Ministry of Agriculture, China Agricultural University, Beijing 100094, China, 2Northeastern University, College of Science, Shenyang, 110004, China and 3Auckland University of Technology, Knowledge Engineering and Discovery Research Institute, Auckland, New Zealand
Email: Xuegong Deng - [email protected]; Ilkka Havukkala - [email protected]; Xuemei Deng* - [email protected]
* Corresponding author
AbstractBackground: Bird genomes have very different compositional structure compared with otherwarm-blooded animals. The variation in the base skew rules in the vertebrate genomes remainspuzzling, but it must relate somehow to large-scale genome evolution. Current research is inclinedto relate base skew with mutations and their fixation. Here we wish to explore base skewcorrelations in bird genomes, to develop methods for displaying and quantifying such correlationsat different scales, and to discuss possible explanations for the peculiarities of the bird genomes inskew correlation.
Results: We have developed a method called Base Skew Double Triangle (BSDT) for exhibitingthe genome-scale change of AT/CG skew as a two-dimensional square picture, showing base skewsat many scales simultaneously in a single image. By this method we found that most chickenchromosomes have high AT/CG skew correlation (symmetry in 2D picture), except for somemicrochromosomes. No other organisms studied (18 species) show such high skew correlations.This visualized high correlation was validated by three kinds of quantitative calculations withoverlapping and non-overlapping windows, all indicating that chicken and birds in general have aspecial genome structure. Similar features were also found in some of the mammal genomes, butclearly much weaker than in chickens. We presume that the skew correlation feature evolved nearthe time that birds separated from other vertebrate lineages. When we eliminated the repeatsequences from the genomes, the AT and CG skews correlation increased for some mammalgenomes, but were still clearly lower than in chickens.
Conclusion: Our results suggest that BSDT is an expressive visualization method for AT and CGskew and enabled the discovery of the very high skew correlation in bird genomes; this peculiarityis worth further study. Computational analysis indicated that this correlation might be acompositional characteristic, present not only in chickens, but also remained or developed in somemammals during evolution. Special aspects of bird metabolism related to e.g. flight may be thereason why birds evolved or retained the skew correlation. Our analysis also indicated thatrepetitive DNA sequence elements need to be taken into account in studying the evolution of thecorrelation between AT and CG skews.
Published: 23 November 2007
BMC Evolutionary Biology 2007, 7:234 doi:10.1186/1471-2148-7-234
Received: 9 July 2007Accepted: 23 November 2007
This article is available from: http://www.biomedcentral.com/1471-2148/7/234
© 2007 Deng et al; licensee BioMed Central Ltd. This is an Open Access article distributed under the terms of the Creative Commons Attribution License (http://creativecommons.org/licenses/by/2.0), which permits unrestricted use, distribution, and reproduction in any medium, provided the original work is properly cited.
Page 1 of 10(page number not for citation purposes)

BMC Evolutionary Biology 2007, 7:234 http://www.biomedcentral.com/1471-2148/7/234
BackgroundAccording to Chargaff's second parity rule, the two com-plementary nucleotides will have similar frequencies incomplete single stranded DNA (A = T, C = G) [1]. How-ever, local violations of this parity rule have beenobserved in all known organisms and in bacteria [2]. ThusAT skew (A-T)/(A+T) and CG skew (C-G)/(G+C) can varywildly in local genome scales. The base skews have beenfound closely related to genome function domains, suchas the origin of replication, gene distribution, transcrip-tion and replication direction in bacteria [3-5], plants [6]and mammals [7-9]. An intriguing question is, do the twonucleotide skews (for AT and CG) correlate with eachother? Actually, the AT and CG skew are often discussedsimultaneously [10,11]. Correlations between AT and CGskews in bacterial genomes and in organellar genomes arealso mentioned in several reports [12,13]. Touchon et al.found that TA and GC skews in the coding strand forintronic regions (repeat masked) in human are correlated,and the correlation value is around 0.61 [14]. Thus study-ing the relation between the AT/CG skews is equallyimportant as the variability in the two skews, and bothmay have evolutionary meaning for genome composi-tion. The correlations between AT skew and CG skew inhigher organisms were generally studied in sets of seg-ments in coding regions or noncoding regions, such asintrons and some repeat elements which representselected or neutral mutations, respectively [15]. Suchstudies have focused more on mutation mechanisms[7,8,15]. However, the skew correlations have seldombeen considered in whole genome or chromosome scale.
In earlier research, CG-skews have normally been ana-lyzed by using cumulative skew diagrams [10,15].Recently, AT and CG skews were analyzed simultaneouslyby Touchon et al [9], who calculated cumulative totalskew as sum of AT and CG skews over 1 kb non-overlap-ping windows, enabling prediction of replication originsin mammalian genomes. Software for visualization of GCskew for circular bacterial genomes has been developed[16]. Another similar package is Genome Diagram [17],but methods for larger genomes are needed. We devel-oped a new method enabling handy large-scale visualiza-tion and analysis of AT and CG skews for whole genomesand large eukaryotic chromosomes, which is very inform-ative. This new method of 2-D color visualization can rep-resent AT skew and CG skew of all segments up to totallength or multiple of 1/1024 of the whole genome in asingle figure. We call the tool Base Skew Double Triangle(BSDT). After drawing BSDT images of eukaryotic chro-mosomes, we found that for chicken and other bird chro-mosomes, the correlations between the two skews showup very clearly and are also quantitatively very high (cor-relation over 0.95), while such high values are not reachedin chromosomes of any other eukaryote species. We then
used further two quantitative methods and different win-dow steps to validate these correlations.
Compared to mammals, chicken/bird genomes havemore compact structure, with higher gene density, fewerrepeat sequences and specific base skew structure [18,19].Masking out repetitive sequences prior to analysis from allgenomes showed that the level of skew correlation is stillhigher in birds. We think this has some biological andevolutionary meaning, still to be unraveled. From theincrease in correlation values after masking repeats, itseems to be a feature related to evolution of the non-repeat component of the genomes. Our 2-D visualizationmethod is considered to be useful in the study and com-parison of nucleotide skews at different scales in variousgenomes in understanding this phenomenon and its evo-lution in the phylogenetic tree.
ResultsBSDTs for eukaryote chromosomesOur new 2-D color visualization representing AT and CGskews was used, as described in methods, to draw theBSDT pictures (see Methods and Figure 1) for 379 chro-mosomes of 19 fully sequenced species and two bird spe-cies for which extensive genomic scaffold sequences wereavailable. All the BSDT pictures can be found at our web-site, under link of BSDT Examples[20]. Visual inspectionalready shows that the bird chromosomes have the mostsymmetrical BSDTs, even at large scale. The symmetryphenomenon suggests that there is a high correlationbetween AT and CG skew in chicken and other birds whenoverlapping windows are used to slide through the wholeDNA sequence. The visual symmetry was validated bythree quantitative calculations of correlations.
CNCL – a quantitative index of skew correlationConstant Number Correlation Level (abbreviated asCNCL) was defined to depict the symmetry degree ofBSDTs (see Methods) by calculating correlation of the twobase skews at many scales. The degree of the correlationbetween AT and CG skews was quantitatively validated bythe calculation of CNCL using overlapping windows. Twoindexes are important for this definition. First, each DNAsequence is divided into 1024 equal segments (1024 foreasy fitting on a computer screen); all analysis for CNCLof BSDT pictures is based on this division. Secondly, thestep length of overlapping sliding windows is expressedby parameter β.
We calculated the CNCL values for all genome data inTable 1 for β = 2, 5, 10, 20, 50 by equation (5). Figure 2shows the CNCL values for 60 datasets with the highestcorrelations, using β = 20. It is remarkable, that chickenchromosomes and the pooled genomic scaffoldsequences of two bird species have clearly the highest cor-
Page 2 of 10(page number not for citation purposes)

BMC Evolutionary Biology 2007, 7:234 http://www.biomedcentral.com/1471-2148/7/234
Relation between AT and CG skews correlation level (skew correlation) and chromosome sizeFigure 2Relation between AT and CG skews correlation level (skew correlation) and chromosome size. Bird data is shown by open symbols, other eukaryotes by closed symbols. Data included: 60 highest CNCL values of all species, cf. Table 2. Left and right arrow: zebrafinch and turkey data points, respectively, other open symbols are all chicken data.
BSDT example of one chromosome of chicken and pufferfishFigure 1BSDT example of one chromosome of chicken and pufferfish. A is the BSDT of chicken chromosome 5. B is the BSDT of puff-erfish chromosome 3. The lower left triangle of each figure represents the AT skew, and the upper right triangle represents the CG skew. The clear correlation of AT and CG skews in chicken chromosome 5 is evident as symmetry across the diagonal. Most chicken chromosomes show such high symmetry in BSDT and all high symmetry BSDTs among eukaryotes belong to chicken.
Page 3 of 10(page number not for citation purposes)
relation level by CNCL value ordering. The calculated val-

BMC Evolutionary Biology 2007, 7:234 http://www.biomedcentral.com/1471-2148/7/234
Page 4 of 10(page number not for citation purposes)
Table 1: Genomic data analyzed, total 19 species, with 379 chromosomes and 2 genomic scaffolds.
Organism Latin name Number of chr---size Data source*
human Homo sapiens 24---2920 Mb UCSC (hg18)chimpanzee Pan troglodytes 25---2870 Mb UCSC(panTro2)dog Canis familiaris 39---2300 Mb UCSC(canFam2)horse Equus caballus 32---2097 Mb UCSC (equCab1)cow Bos taurus 30---1650 Mb UCSC(bosTau2)mouse Mus musculus 21---2470 Mb UCSC(mm8)rat Rattus norvegicus 22---2560 Mb UCSC(rn4)opossum Monodelphis domestica 10---3420 Mb UCSC(monDom4)chicken Gallus gallus 32---984 Mb UCSC(galGal3)turkey Meleagris gallopavo 28 scaffolds---5.8 Mb NCBI zebrafinch Taeniopygia guttata 92 scaffolds---12.7 Mb NCBIstickleback Gasterosteus aculeatus 24---738 Mb UCSC (gasAcu1)medaka Oryzias latipes 21---408 Mb UCSC (oryLat1)pufferfish Tetraodon nigroviridis 21---211 Mb UCSC(tetNig1)zebrafish Danio rerio 26---1040 Mb UCSC(danRer4)mosquito Anopheles gambiae 6---274 Mb UCSC(anoGam1)fruitfly Drosophila yakuba 6---161 Mb UCSC(droYak2)nematode Caenorhabditis elegans 6---97.5 Mb UCSC(ce2)thale cress Arabidopsis thaliana 5---114 Mb TAIR(2004)rice Oryza sativa 12---364 Mb BGIyeast Saccharomyces cerevisiae 17---11.7 Mb ENSEMBL(2007)
*UCSC reference to [21], NCBI reference to [25], TAIR reference to [26], BGI reference to [27], and ENSEMBL reference to [28].
Table 2: The distribution of all chromosomes/scaffolds by correlation level CNCL at β = 20.
Start* 1.00 0.949 0.899 0.849 0.799 0.699 0.599 0.399 0.199 -0.199 -0.399 -0.599 -0.700 TotalEnd* 0.950 0.900 0.850 0.800 0.700 0.600 0.400 0.200 0.00 0.00 -0.200 -0.400 -0.600
Chicken 17 7 1 1 1 2 3 32Turkey 1 1
Zebrafinch 1 1Dog 5 9 13 7 5 39
Horse 5 2 12 8 4 1 32Human 2 1 7 7 3 2 1 1 24Chimp 3 7 4 4 5 1 1 25Cow 2 3 9 10 5 1 30Rat 2 5 8 5 2 22
Mouse 2 5 7 6 1 21Zebrafish 1 5 7 5 4 1 1 2 26Medaka 3 8 6 3 3 1 24
Rice 1 6 2 2 1 12Mosquito 1 3 1 1 6Fruitfly 1 1 3 1 6
Pufferfish 1 1 5 6 4 4 21Stickleback 3 3 7 3 5 21
Yeast 2 3 5 3 4 17Opossum 2 1 1 3 3 10
Thale cress 1 3 1 5Nematode 1 1 1 3 6Total chr. 17 9 13 18 48 50 55 58 37 28 23 22 3 381
Total random** 34 132 218 235 152 29 800
*Start and end means the range of correlation, the number in table means how many chromosomes/scaffolds have AT/CG skew correlation number between start and end. For example, there are 17 chicken chromosomes having AT/CG skew correlation between 0.95 and 1.00. We can see in this table that birds have higher skew correlation, and no other species reach this level of correlation.**CNCL distribution of the 800 random sequences. Detailed CNCL data of these random sequences are listed in supplemental materials (file: CNCL for randoms and chromsomes.xls under link of reference) [20].

BMC Evolutionary Biology 2007, 7:234 http://www.biomedcentral.com/1471-2148/7/234
ues can be seen in Table 2.
We also find that, for other vertebrates, a high correlationlevel is not common, though most vertebrates tend tohave higher positive correlations than other lower eukary-otes. In Table 2, we list the distribution of CNCL for allsequenced eukaryotes. Most opossum chromosomes haveunexpectedly negative CNCL, as do pufferfish chromo-somes. Nematode has a relatively high negative correla-tion between AT and CG skews. In a control test, 800 = 5× 16 × 10 CNCLs of random sequences are calculated,with length of 1 Mb, 3 Mb, 10 Mb, 30 Mb, 100 Mb (5scales) and GC percent of 35%, 36%~50% (16 levels) and10 repeats for each combination of length scale and GCpercent, as listed in Table 2 and details supplied in supple-mental file (CNCL for randoms and chromsomes.xlsunder link of reference in our website [20]). In all the ran-dom control sequences, 98.5% of the |CNCL| values areunder 0.5, 92.1% |CNCL| < 0.4, 79% |CNCL| < 0.3,56.6% |CNCL| < 0.2, and 30.4% |CNCL| < 0.1. Comparedto the random controls, only warmblooded animalCNCLs can be far from randomness but not for all theirchromosomes. Chicken and other birds are the only spe-cies in which correlation can reach 0.90 (all chicken mac-rochromosomes are over 0.95) and the exceptions are allchicken microchromosomes.
Table 2 shows only the case β = 20, however, extensive cal-culations indicated that different settings of β do not affectthe results significantly. We have:
for all conceivable combinations of all species (not bird),and all chromosomes, β1 = 2, 5, 10, 20, 50, β2 = 2, 5, 10,20, 50 and n = 1 ~ 14, 18 ~20, 23, 24, 26. Thus our con-clusion is that for calculation of CNCL in any scale,chicken chromosomes consistently display distinctlyhigher correlation compared to other eukaryotes. Here,the segmentation to 1024 parts is only a choice for visualconvenience. BSDT is a useful visual observation method,by which we can easily see which genome areas are ofinterest in terms of skew correlations.
CWCL – a generalization of CNCLIt could be thought that the skew correlations might notrepresent a common measurement scale, because theDNA sequences are not of same size, because all aredivided into 1024 segments. For this reason, we define anew value CWCL (Constant Window Correlation Level),which does not limit the number of windows to 1024, butlimits the window length. In other words, windownumber for a constant window length replaces 1024. Thisway we can compare the different genomes in the samescale. The advantage of CWCL is that any two CWCL canbe compared in the same scale, though it is not visualizedin a common scale square.
We have calculated this standardized scale
values for all data, β = 2, 5, 10, 20, 50 and window-length= 2 k, 10 k. This allows comparisons in same scalebetween chromosomes and species. Since there are somany possible combinations of beta and window length(WL), all the results cannot be listed here. Table 3 onlylists the number of chicken chromosomes that rank high-est in correlation for any parameter combination. For
example, when β = 5 and window-length = 2 k, 25 topCWCL values belong to chicken. The conclusion of Table3 is quite similar with equation (1), but this calculation ismore intuitive, as we are comparing two sequences in thesame scale.
Non-overlapping windows based calculationIntuition and general knowledge suggests that symmetri-cal phenomena should happen in comparatively largescale, but in small scale, random fluctuations should bedominant. The question is from what scale the chicken/bird genome begins to exhibit its high correlationbetween skews, or in other words, how its variationchanges with the increase of scale. Figure 3A–C shows therelationships between window-sizes and correlation val-ues, using non-overlapping windows. All chromosomesof chicken are drawn in green, for easy comparison withhuman in red and dog in blue.
It is obvious from Figure 3A that for most chicken chro-mosomes, the correlation between AT and CG skew rap-
CNCL CNCLβ β1 2
chicken-chr. n species-chromosomes> (1)
CWCLspecies chrβ
− *
Table 3: The number of chicken chromosomes that rank highest in correlation for different parameter combinations.
β = 2 β = 5 β = 10 β = 20 β = 50
WL = 2 k 24 25 25 25 26WL = 10 k 26 26 26 27 27
WL is the window length and β has the same meaning as in equation 4 for CNCL. The number in table means how many chicken chromosomes have top-ranked AT/CG skew correlation among all data in Table 1 with parameter combination of window length and β. For example, when window length is 2 k and β = 2, 25 chicken chromosomes have top-ranked correlation values when comparing all chromosomes in Table 1.
Page 5 of 10(page number not for citation purposes)

BMC Evolutionary Biology 2007, 7:234 http://www.biomedcentral.com/1471-2148/7/234
Page 6 of 10(page number not for citation purposes)
Relation between CG-AT skews correlation (vertical -axis) and window size from 1 kb to 200 kb (horizontal -axis)Figure 3Relation between CG-AT skews correlation (vertical -axis) and window size from 1 kb to 200 kb (horizontal -axis). Each line represents a change of AT/CG correlation of a chromosome with the change of window size. Green: chicken; blue: dog; red: human. A: unmasked genomic data, B: repeats-masked genome data. C: intergenic parts masked genome data.

BMC Evolutionary Biology 2007, 7:234 http://www.biomedcentral.com/1471-2148/7/234
idly increases to a high level (0.9 at 40 kb and 0.95 at 200kb or higher), the exceptions being the microchromo-somes. For all human and dog chromosomes, none canreach correlation level of 0.8, even at the scale of 200 kb,at the right end of Figure 3A. We can also see that dog hasslightly higher correlation level than human, as alreadyseen in the previous analysis of CNCL and CWCL. Thisseems a species-specific difference. A very interesting phe-nomenon is that all chicken chromosomes begin at posi-tive correlation level, and all chromosomes of human anddog at negative correlation level at small window sizes.Also, some chromosomes in all species differ significantlyfrom the species specific trend (e.g. lowest curve forhuman in right panel of Figure 3).
When we eliminated the repeat sequences from the threeanimal genomes using the standard repeat-maskedsequences from the public databases (downloaded fromUCSC [21]), the correlations clearly increase in humanand dog, and slightly also in chicken, although theyalready were at a very high level (Figure 3B). This madeboth dog and human skew correlation levels more similarto each other and closer to that of birds. However, birdchromosome value correlations still stand clearly apart,suggesting that other factors in addition to repeats areresponsible for the special characteristic of skew correla-tion in birds. We also eliminated the intergenic sequencesfrom the three animal genomes using the Genescan genedata in UCSC (see Figure 3C). We only see slight differ-ences between Figure 3C and Figure 3A, but the change isfar from that which occurred when masked the repeatsequences. This indicates that the skew correlation in thegene related regions is not significantly different from thatin the whole genome.
Discussion and ConclusionIn this study, we introduced a new visualization methodof BSDT to display the changing rules of AT and CG skewsin the genome. The visual symmetry in BSDT means highcorrelation level between AT and CG skews, and high vis-ual symmetry in large scale appeared only in the BSDTs ofbird chromosomes. This indicates bird genomes have avery special compositional structure in base skew com-pared to other species. We validated this estimation byother two quantitative methods, confirming that onlybird genomes can reach a high correlation level (0.95).Other species, such as dog, horse and human can alsoreach a relatively high level (0.8), far from randomsequence expectation. However, such high correlations donot appear in rodents and fishes, especially, opossum hasan unexpected and unexplained negative correlation. Wethink this phenomenon is intriguing evolutionarily. Threequestions arise: 1) When did this high correlation appearin the vertebrate phylogeny tree? 2) Have birds increasedthis symmetry due to some evolutionary pressure or have
other species lost it (from reptilian ancestors)? 3) Whythere are so clear species-specific differences, even withinmammals? The high correlation between AT and CGskews is likely to be prevalent in other bird genomes aswell, as zebrafinch and turkey genome data showed a verysimilar picture. The details of the phylogenetic distribu-tion and evolution of this correlation awaits access tomore genomic data from further species of birds, mam-mals and primitive vertebrates, like reptiles.
When the skew correlation is higher than 0.95, we cannearly say that the AT and CG skews change concomi-tantly. Most chicken larger chromosomes can reach thislevel at large scale, and for other animals, we can only saythey also have tendency to increase in larger scale. Thebase skew correlation is only a mathematical concept, butwhen it is far from random state, it must have a biologicalexplanation to maintain it. There are so many vertebratebranches, but why this phenomenon occurred only in thefew branches in birds? We have analyzed current genomedata, from birds, canines, ungulates, primates, rodents,fishes and marsupials. It is unknown whether the highcorrelation occurred early, vanishing in marsupials, orwhether it occurred reappeared in canines, ungulates, pri-mates etc. at a relatively high level. We need to search forthe common ancestor for the high skew correlation state.
It is difficult to judge when birds might have gained suchhigh base skew correlation, either before or after the sepa-ration between mammals and birds. New primitive mam-mal, marsupial, reptile and amphibian data might clarifythis. While waiting for such data, we can study further therole of repeat sequences, as well as the history of newlyinserted sequences in the evolution process [22,23]. Itcould be that the high correlation phenomenon occurredvery early in the vertebrate phylogeny tree, at least beforethe separating point of bird and mammal, and then waslost to some extent in mammals. Alternatively, this traitappeared separately in birds and mammals and wasstrengthened further in the bird branch. We favor the firstalternative.
We may need to improve the methods of finding andmasking repeat sequences for robust analysis of data fromreptiles and common ancestors of mammals and birds. Itseems a small number of large-scale recombination eventscannot cause an extensive change in skew correlation.Point mutations also cannot be the main reason, since itis a relatively short time for this change in vertebrate phy-logeny tree, but mutations maybe a contributing factor.We assume the main reason that most mammals lost thecorrelation to some extent was numerous random inser-tions of small sequences with a high difference in AT andCG skew. Such events could involve interspersed repeats,tandem repeats, transposable elements, etc. If we can
Page 7 of 10(page number not for citation purposes)

BMC Evolutionary Biology 2007, 7:234 http://www.biomedcentral.com/1471-2148/7/234
eliminate such repeats in mammal in a clean manner,mammals may show even higher AT/CG skew correlation,then being more similar to the ancestral genome. Theserepeats have changed during evolution, and were perhapsnot captured well enough by the repeat masking proce-dure used in the public domain databases, from which weretrieved our repeat masked data.
As we know, avian genomes are commonly smaller andhave fewer repetitive elements than other amniotes andthat seems a key adaptation for flight [24]. We can alsoimagine, for the same goal of extremely efficient cellmetabolism, birds may adopt a highly organized compo-sitional genome structure, including or reflected in highAT and CG skew correlation. We expect this history to beunraveled soon after more complete genomes are pub-lished. It is unknown what possible advantages does thesimilar AT and CG skew give to the species to managetheir genetic information, but it may involve having geneswith similar constitution near each other for easier globalcontrol mechanisms.
MethodsThe definition of BSDTThe aim of this method is to visualize how the AT and CGskews change and correlate at all scales in a single imagefor a whole chromosomes. For convenient display oncomputer screens, we limit the square scale as 1024 ×1024 pixels (choice of 1024 is handy for display on ordi-nary computer screen, but one can choose any otherscale). First, we divide the DNA sequence into 1024 equalsize windows Wi, all possible continuous segments com-posed with Wi can be denoted as:
i.e. the segments from the beginning of window Wm-1 tothe end of window Wn. Then, we denote the base skews of
AT and CG of all these segments Hm,n as and
, and the whole genome skew denoted as skew
denoted as:
λ = |(A - T)/(A + T)| + |(C - G)/(C + G))| (3)
in which A, T, C, G are the number of these nucleotides inthe whole sequence. Next, we map the two base skews
and of Hm,n at two symmetrical pixels
(m, n) and (n, m) in the square with a color function, inorder to get a color square representation for each DNAsequence. This color function is shown in Table 4 and thecorresponding color scale in Figure 4. For all points of thematrix we draw (m, n) and (n, m) (at the symmetry posi-
tion) with color ( ) and color ( ) for m ≤ n ≤
1024.
Using the color scheme in Table 4 we thus get a colorsquare representation for base skews of any DNAsequence, as shown in Figure 1A–B. This square consistsof two triangles, separated by the diagonal, the bottom-left for the AT skew and the top-right for CG skew. We callthese images Base Skew Double Triangles (BSDT). Thestructure of these images is explained further below. Sinceeach point in the square represents base skew of a differ-ent subsequence, 1,0242/2 = 524,288 segments are shownin one triangle. This display with a suitable color scalinghighlights very clearly and continuously the changes in ATand CG skews at different scales and in different locationsof the DNA sequence.
What can we see in BSDT?
When observing a BSDT image (see Figure 1), followingitems are important: 1) Any point pair ((m, n) and (n, m),m < n) in the square represents a sub-sequence Hm,n and
the color at these pair points represent base skews
and the similar colors (in Figure 4) of
the two points represent the correlation of two base skews.
H Wm ni
i m
n
, == −1∪ (2)
Skewm nAT
,
Skewm nCG
,
Skewm nAT
, Skewm nCG
,
Skewm nAT
, Skewm nCG
,
Skewm nAT
, Skewm nCG
,
The chromatogram (color scale) drawn using the color function of Table 4Figure 4The chromatogram (color scale) drawn using the color function of Table 4. The numbers at the bottom correspond to the skew value, for example 26.0 means when base skew is 26.0λ, the color in BSDT is deep green.
Page 8 of 10(page number not for citation purposes)
BMC Evolutionary Biology 2007, 7:234 http://www.biomedcentral.com/1471-2148/7/234
2) The skew level of any segment displayed in the BSDTshows strong negative skews as deep blue, changing viablack color at no skew to deep green for strong positiveskews (see color scale in Figure 4). 3) The closer the pointsto the diagonal, the smaller the sub-sequence scale it rep-resents. 4) The symmetrical color pattern across the diag-onal means correlation of CG skew and AT skew of thatgenome area. 4) By comparing the color changes alongthe diagonal direction we can observe local deviations inskews and their correlations. It is noteworthy, that in thecorners furthest from the diagonal (= largest genomicscale) the skew is less (color is often pink or yellow, thatis, closer to black portion in the middle of the color scale).
The definition of constant number correlation level of BSDTThe visual observation clearly supports the conclusionthat the correlation between the AT skew and CG skew isvery high for most large chromosomes of chicken at anyscale. However, adequate quantitative analysis of this vis-ual observation (BSDT) is necessary. For this we calculatecorrelation as follows:
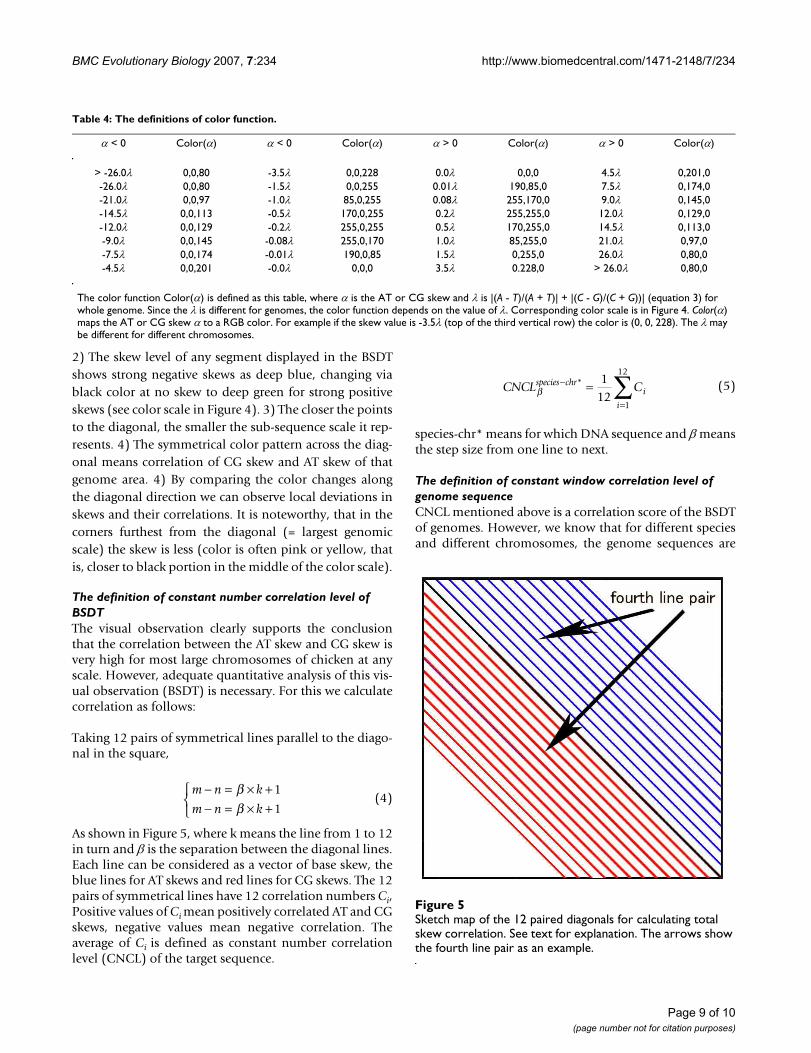
Taking 12 pairs of symmetrical lines parallel to the diago-nal in the square,
As shown in Figure 5, where k means the line from 1 to 12in turn and β is the separation between the diagonal lines.Each line can be considered as a vector of base skew, theblue lines for AT skews and red lines for CG skews. The 12pairs of symmetrical lines have 12 correlation numbers Ci,Positive values of Ci mean positively correlated AT and CGskews, negative values mean negative correlation. Theaverage of Ci is defined as constant number correlationlevel (CNCL) of the target sequence.
species-chr* means for which DNA sequence and β meansthe step size from one line to next.
The definition of constant window correlation level of genome sequenceCNCL mentioned above is a correlation score of the BSDTof genomes. However, we know that for different speciesand different chromosomes, the genome sequences are
m n k
m n k
− = × +− = × +
ββ
1
1(4)
CNCL Cspecies chri
i
β−
=
= ∑* 112
1
12
(5)
Sketch map of the 12 paired diagonals for calculating total skew correlationFigure 5Sketch map of the 12 paired diagonals for calculating total skew correlation. See text for explanation. The arrows show the fourth line pair as an example.
Table 4: The definitions of color function.
α < 0 Color(α) α < 0 Color(α) α > 0 Color(α) α > 0 Color(α)
> -26.0λ 0,0,80 -3.5λ 0,0,228 0.0λ 0,0,0 4.5λ 0,201,0-26.0λ 0,0,80 -1.5λ 0,0,255 0.01λ 190,85,0 7.5λ 0,174,0-21.0λ 0,0,97 -1.0λ 85,0,255 0.08λ 255,170,0 9.0λ 0,145,0-14.5λ 0,0,113 -0.5λ 170,0,255 0.2λ 255,255,0 12.0λ 0,129,0-12.0λ 0,0,129 -0.2λ 255,0,255 0.5λ 170,255,0 14.5λ 0,113,0-9.0λ 0,0,145 -0.08λ 255,0,170 1.0λ 85,255,0 21.0λ 0,97,0-7.5λ 0,0,174 -0.01λ 190,0,85 1.5λ 0,255,0 26.0λ 0,80,0-4.5λ 0,0,201 -0.0λ 0,0,0 3.5λ 0.228,0 > 26.0λ 0,80,0
The color function Color(α) is defined as this table, where α is the AT or CG skew and λ is |(A - T)/(A + T)| + |(C - G)/(C + G))| (equation 3) for whole genome. Since the λ is different for genomes, the color function depends on the value of λ. Corresponding color scale is in Figure 4. Color(α) maps the AT or CG skew α to a RGB color. For example if the skew value is -3.5λ (top of the third vertical row) the color is (0, 0, 228). The λ may be different for different chromosomes.
Page 9 of 10(page number not for citation purposes)

BMC Evolutionary Biology 2007, 7:234 http://www.biomedcentral.com/1471-2148/7/234
quite different in total length. So the window length willbe different, even though we can compare the CNCLs bychoosing different parameter β values. For standardizedcomparison of chromosomes of different sizes, we definea new constant window correlation level (CWCL), where,compared with CNCL in last section, factor 1024 isreplaced by
Window-number = genome-length/window-length
So CNCL is the absolute scale (1/1024 fraction of chro-mosome) correlation level of BSDT images and CWCL isthe standardized scale correlation level. The arithmetic inCWCL is as for CNCL, but m, n < Window-number (not
be 1024). CWCL is denoted as , species-
chr* and β has the same meaning as in equations (5) forCNCL.
MaterialsThe eukaryotic genomic data was sampled as shown inTable 1. Full chromosome sequences were used, except inturkey and zebrafinch, for which pooled scaffolds of 100–300 kb downloaded from NCBI were used in the absenceof full genome data.
AbbreviationsBase Skew Double Triangle is abbreviated as BSDT, CNCLmeans Constant Number Correlation Level, CWCL isabbreviation of Constant Window Correlation Level, andWL is window length in this paper.
Authors' contributionsXgD invented the visualization method, carried out calcu-lation of parameters and drafted the manuscript. IH par-ticipated in resourcing and exploring the data, statisticalanalysis, literature review and modification of the manu-script. XmD conceived of the study, and participated in itsdesign and writing. All authors read and approved thefinal manuscript.
AcknowledgementsThis work was funded by the State Major Basic Research Development Pro-gram (2006CB102100), National Natural Science Foundation of China (No. 30471233), and National High Technology Research and Development Pro-gram of China (No.2001AA222191) for Deng Xuemei. The Auckland Uni-versity of Technology, Knowledge Engineering and Discovery Institute in Auckland, New Zealand is thanked for facilities for Ilkka Havukkala.
References1. Sueoka N: Intra-strand parity rules of DNA base composition
and usage biases of synonymous codons. J Mol Evol 1995,40:318-325.
2. Nikolaou C, Almirantis Y: A study on the correlation of nucle-otide skews and the positioning of the origin of replication:different modes of replication in bacterial species. NucleicAcids Res 2005, 33:6816-6822.
3. Bell SJ, Forsdyke DR: Deviations from Chargaff's second parityrule correlate with direction of transcription. J Theor Biol 1999,197:63-76.
4. Lao PJ, Forsdyke DR: Thermophilic bacteria strictly obey Szy-balski's transcription direction rule and politely purine-loadRNAs with both adenine and guanine. Genome Res 2000,10:228-236.
5. McLean MJ, Wolfe KH, Devine KM: Base composition skews, rep-lication orientation, and gene orientation in 12 prokaryotegenomes. J Mol Evol 1998, 47:691-6.
6. Fujimori S, Washio T, Tomita M: GC-compositional strand biasaround transcription start sites in plants and fungi. BMCGenomics 2005, 6:26. doi:10.1186/1471-2164-6-26.
7. Green P, Ewing B, Miller W, Thomas PJ, NISC Comparative Sequenc-ing Program, Green ED: Transcription-associated mutationalasymmetry in mammalian evolution. Nat Genet 2003,33:514-517.
8. Majewski J: Dependence of Mutational Asymmetry on Gene-Expression Levels in the Human Genome. Am J Hum Genet2003, 73:688-692.
9. Touchon M, Nicolay S, Audit B, Brodie of Brodie EB, d'Aubenton-Carafa Y, Arneodo A, Thermes C: Replication-associated strandasymmetries in mammalian genomes: Toward detection ofreplication origins. PNAS 2005, 102:9836-9841.
10. Grigoriev A: Analyzing genomes with cumulative skew dia-grams. Nucleic Acids Res 1998, 26:2286-2290.
11. Touchon M, Arneodo1 A, d'Aubenton-Carafa Y, Thermes C: Tran-scription-coupled and splicing-coupled strand asymmetriesin eukaryotic genomes. Nucleic Acids Res 2004, 32:4969-4978.
12. Nikolaou C, Almirantis Y: A study on the correlation of nucle-otide skews and the positioning of the origin of replication:different modes of replication in bacterial species. NucleicAcids Res 2005, 33:6816-6822.
13. Nikolaou C, Almirantis Y: Deviations from Chargaff's secondparity rule in organellar DNA Insights into the evolution oforganellar genomes. Gene 2006, 381:34-41.
14. Touchon M, Nicolay S, Arneodo A, d' Aubenton-Carafa Y, ThermesC: Transcription- coupled TA and GC strand asymmetries inthe human genome. FEBS Lett 2003, 555:579-582.
15. Frank AC, Lobry JR: Asymmetric substitution patterns: areview of possible underlying mutational or selective mech-anisms. Gene 1999, 238:65-77.
16. Ghai R, Hain T, Chakraborty T: GenomeViz: visualizing micro-bial genomes. BMC Bioinformatics 2004, 5:198.
17. Pritchard L, White JA, Birch PR, Toth IK: GenomeDiagram: apython package for the visualization of large-scale genomicdata. Bioinformatics 2006, 22:616-617.
18. Schmutz J, Grimwood J: Genomes:Fowl sequence. Nature 2004,432:679-680.
19. International Chicken Genome Sequencing Consortium: Sequenceand comparative analysis of the chicken genome provideunique perspectives on vertebrate evolution. Nature 2004,432:695-716.
20. The BSDT software and examples [http://www.hpcurve.com]21. UCSC Genome Bioinformatics [http://hgdown
load.cse.ucsc.edu/downloads.html]22. Shapiro JA, von Sternberg R: Why repetitive DNA is essential to
genome function. Biol Rev 2005, 80:227-250.23. von Sternberg R, Shapiro JA: How repeated retroelements for-
mat genome function. Cytogenet Genome Res 2005, 110:108-16.24. Hughes AL, Hughes MK: Small genomes for better flyers. Nature
1995, 377:391.25. NCBI Nucleotide [http://www.ncbi.nlm.nih.gov/sites/entrez]26. Arabidopsis Biological Resource Center [ftp://ftp.arabidop
sis.org/home/tair/Sequences/whole_chromosomes]27. RISE- Rice Information System [ftp://ftp.genomics.org.cn/pub/
ricedb/SynVs9311/9311/Sequence/Chromosome]28. ENSEMBL Downloads [http://www.ensembl.org/info/data/down
load.html]
CWCLspecies chrβ
− *
Page 10 of 10(page number not for citation purposes)