Embed Size (px)
Citation preview

With a record-large processing tomato crop anticipated and assuming yields for other processing vegetables at least match the average of the past 3 years, output of the five leading processing vegetables could approach the 1999 record high of 19.2 million short tons— about a tenth above last year’s strong production. As a result, some easing of processed-vegetable wholesale prices is anticipated this fall. In July, wholesale prices for canned vegetables (including juices) were running 13 percent above a year ago, while frozen vegetables were selling for 14 percent more. This summer (largely July-September), area for harvest of 12 selected fresh-market vegetables (including nonstorage bulb onions) is forecast to decline 1 percent from a year ago to 282,800 acres. Increased area for snap beans, carrots, and sweet corn was more than offset by reductions for head lettuce, cauliflower, and summer nonstorage onions. Assuming average weather, shipping-point prices for fresh-market vegetables (which rose 8 percent last summer), are currently expected to average 2 to 7 percent below a year earlier during the 2009 summer quarter. The 2009 fall potato crop is expected to remain near the 376 million hundredweight (cwt) of a year earlier. Although supplies will likely tighten going into next year, prices received by U.S. potato growers are expected to average below a year earlier during the 2009/10 season. In 2008/09, the preliminary nominal dollar marketing year average price for all potatoes was a record high $9.46 per cwt—up 26 percent from the prior year. Despite prospects for reduced dry bean supplies in the year ahead, continued sluggish foodservice demand, potentially slower export movement, and a general easing of field crop prices will likely place downward pressure on dry bean prices in 2010. Assuming favorable harvest weather, prices for most classes of dry beans are expected to average below the very strong levels of 2008/09. The weak economy, sluggish foodservice demand, and overall lower discretionary spending has led to declining harvested acreage and stocks of fresh and dried herbs and spices. Economic Research Service estimates that 80,000 acres of herbs and spices will be grown in 2008, a 27-percent decline from the previous year.
Vegetables and Melons Outlook Gary Lucier [email protected] Michelle Da Pra [email protected] Large Processing Vegetable Crop Anticipated
VGS-334 Aug. 27, 2009
Contents Industry Overview Fresh-Market Vegetables Melons Processing Vegetables Potatoes Dry Edible Beans Dry Peas & Lentils Mushrooms Herbs and Spices Contacts & Links Appendix Tables Web Sites Veg. & Melons Potatoes Tomatoes Dry Beans U.S. Trade Data Market News NASS Statistics Organics Transportation -------------- The next release is October 22, 2009. -------------- Approved by the World Agricultural Outlook Board.

Industry Overview
2 Vegetables and Melons Outlook/VGS-334/August 27, 2009
Economic Research Service, USDA
Fresh vegetables: Although harvested area for summer storage onions (the primary source of bulb onions during the fall and winter) is expected to be up 1 percent this year, it will be second only to 2008 as the lowest harvested area since 1992. Unless yields approach record highs, this year’s storage-onion crop is not expected to change much from last year’s 55.3 million cwt. This crop transitions from a summer nonstorage onion crop which totaled 10.6 million cwt—up 3 percent from a year earlier despite a 9-percent drop in harvested area. This summer, given steady area for harvest, good yields fostered by moderate summer temperatures, and sluggish demand due to the elevated unemployment rate, fresh vegetable prices are generally expected to average below the levels of a year ago. Melons: This summer (largely July-September), area for harvest of the three leading melon crops was estimated to be 87,900 acres—slightly less than a year earlier. Area is expected to be down for watermelon and honeydews but a bit higher for cantaloup. Although cantaloup area was steady in California, growers in the southeast (Georgia and South Carolina) planted more area, accounting for all the acreage gain. Lower melon shipments and elevated prices in June caused by weather-delayed maturity, gave way to stronger volume and easier prices in July. Processing vegetables: Processors of the five leading vegetables (tomatoes, sweet corn, snap beans, green peas, and cucumbers for pickles) have contracted 1.23 million acres in 2009—up 6 percent from a year earlier. Contracts typically cover 98 percent of the acreage for the five major processing vegetables. Despite reduced water availability in California, contract area for tomatoes, the single largest processing vegetable in terms of output was up 11 percent from a year earlier due to strong export demand and favorable tomato product wholesale prices. Current conditions favor strong yields and a large crop—both here and abroad. Potatoes: The 2009 fall potato crop was planted on 932,900 acres, up slightly from a year earlier but second only to 2008 as the smallest fall area since 1951. Acreage was unchanged or higher in 14 of the 19 fall-crop States including Idaho (up 5 percent) where area a year ago tied with 1980 as the smallest since 1972. Across all four seasons in 2009, harvested area is projected to total 1.05 million acres—up slightly from a year earlier. Reflecting sluggish foodservice movement and the general easing of commodity prices, reported June prices for fresh-market potatoes averaged 30-percent below the strong 18.61 cents per pound of a year earlier. Dry edible beans: U.S. dry bean area for harvest was estimated to be down 4 percent to 1.39 million acres. Given August acreage estimates by class and expectations for average yields, production is expected to decline for most of the major bean classes. Despite a smaller crop, sluggish demand and reduced pressure from competing crops are expected to drop the 2009/10 all dry bean price down from the preliminary $37.70/cwt of a year ago to near the respectable 2007/08 level of $28.80/cwt. Dry peas and lentils: According to USDA estimates, projected harvested area for dry peas is down 1 percent from a year earlier, while lentil harvested area is expected to jump 52 percent. Although carryover stocks are low and export demand good, dry pea and lentil prices are expected to average below their 2008/09 levels. Mushrooms: Intended agaricus bed and tray production area for the 2009/10 season is forecast to rise slightly from a year earlier to 135 million square feet. Assuming average yields, 2009/10 mushroom output could also increase slightly.

3 Vegetables and Melons Outlook/VGS-334/August 27, 2009
Economic Research Service, USDA
Table 1--U.S. vegetable industry at a glance, 2006-09 Item Unit 2006 2007 2008 2009 1/
Area harvested 1,000 ac. 7,139 6,852 6,668 6,781 Vegetables: Fresh & melons 1,000 ac. 1,830 1,784 1,733 1,710 Processing 1,000 ac. 1,253 1,249 1,226 1,275 Potatoes 1,000 ac. 1,120 1,122 1,046 1,048 Dry beans 1,000 ac. 1,532 1,479 1,445 1,392 Other 2/ 1,000 ac. 1,404 1,217 1,219 1,356
Production Mil. cw t 1,285 1,332 1,279 1,311 Vegetables: Fresh & melons Mil. cw t 461 459 450 445 Processing Mil. cw t 318 356 350 380 Potatoes Mil. cw t 441 445 413 415 Dry beans Mil. cw t 24 26 26 24 Other 2/ Mil. cw t 42 46 41 46Crop value $ mil. 16,601 17,385 18,813 18,197 Vegetables: Fresh & melons $ mil. 10,151 10,048 10,410 10,425 Processing $ mil. 1,371 1,651 1,901 1,950 Potatoes $ mil. 3,209 3,340 3,899 3,550 Dry beans $ mil. 554 749 975 705 Mushrooms $ mil. 889 961 963 957 Other 2/ $ mil. 427 636 665 610Unit value 3/ $/cw t 12.91 13.05 14.71 13.88 Vegetables: Fresh & melons $/cw t 22.03 21.87 23.13 23.43 Processing $/cw t 4.31 4.64 5.44 5.13 Potatoes $/cw t 7.31 7.51 9.46 8.56 Dry beans $/cw t 22.10 28.80 37.70 28.94 Other 2/ $/cw t 31.66 34.42 39.36 33.77Trade Imports $ mil. 7,275 7,921 8,515 8,325 Vegetables: Fresh & melons $ mil. 4,091 4,433 4,605 4,450 Processing 4/ $ mil. 1,748 1,916 2,170 2,225 Potatoes & products $ mil. 856 908 997 950 Dry beans $ mil. 84 107 155 145 Other 5/ $ mil. 496 556 588 555 Exports $ mil. 4,233 4,621 5,414 5,385 Vegetables: Fresh & melons $ mil. 1,624 1,741 1,852 1,885 Processing 4/ $ mil. 860 942 1,220 1,245 Potatoes & products $ mil. 950 1,051 1,186 1,155 Dry beans $ mil. 211 199 317 290 Other 5/ $ mil. 588 686 839 810Per capita use Pounds 430 434 420 431 Vegetables: Fresh & melons Pounds 175 174 171 171 Processing Pounds 116 118 115 123 Potatoes & products Pounds 124 125 119 121 Dry beans Pounds 6 7 6 6 Other 2/ Pounds 10 10 10 10
1/ ERS forecasts. 2/ Includes sw eet potatoes, dry peas, lentils, and mushrooms (except for crop value). 3/ Ratio of total value to total production. 4/ Includes canned, frozen, and dried. Excludes potatoes, pulses, and mushrooms. 5/ Other includes mushrooms, dry peas, lentils, sw eet potatoes, and vegetable seed. All trade data are on a calendar-year basis. Note: Cw t = hundredw eight, a unit of measure equal to 100 pounds.Sources: Derived by ERS using data from USDA, National Agricultural Statistics Service, Crop Production, Acreage, Agricultural Prices, Crop Values, Mushrooms, and Potatoes; and from U.S. trade data of the U.S. Dept. of Commerce, U.S. Census Bureau.

4 Vegetables and Melons Outlook/VGS-334/August 27, 2009
Economic Research Service, USDA
Figure 1 Point-of-first-sale (farm) price for fresh-market vegetables
Source: USDA, National Agricultural Statistics Service, Agricultural Prices.
10
20
30
40
50
60
70
Jan. Mar. May July Sep. Nov.
BroccoliCents/pound
2007
2009
2008
0102030405060
Jan. Mar. May July Sep. Nov.
Sweet cornCents/pound
2008
2007
2009
010203040506070
Jan. Mar. May July Sep. Nov.
CeleryCents/pound
2009
2007
2008
0
10
20
30
40
50
Jan. Mar. May July Sep. Nov.
CucumbersCents/pound
2008
2007
2009
05
1015202530354045
Jan. Mar. May July Sep. Nov.
Head lettuceCents/pound
2008
2009
2007
0
10
20
30
40
50
60
Jan. Mar. May July Sep. Nov.
OnionsCents/pound
2009
2007
2008
0
20
40
60
80
100
120
Jan. Mar. May July Sep. Nov.
Snap beansCents/pound
2008
2007
2009
0
15
30
45
60
75
90
Jan. Mar. May July Sep. Nov.
TomatoesCents/pound
2008
2009
2007

Fresh-Market Vegetables
5 Vegetables and Melons Outlook/VGS-334/August 27, 2009
Economic Research Service, USDA
Summer Acreage Down Slightly This summer (largely July-September), area for harvest of 12 selected fresh-market vegetables (including nonstorage bulb onions) is forecast to decline 1 percent from a year ago to 282,800 acres. Increased area for snap beans, carrots, and sweet corn was more than offset by reductions for head lettuce, cauliflower, and summer nonstorage onions. Reduced summer area follows declines in both the winter (down 5 percent) and spring vegetable seasons (down 4 percent). While summer acreage was only down slightly, the cool weather which has persisted in many areas has slowed crop maturity but has generally been beneficial for quality and yields. Given little change in area from last summer, no severe weather (e.g., hurricanes), average or better yields, and sluggish foodservice demand, supplies will likely be adequate for most fresh vegetables this summer. Growers in California, accounting for 45 percent of this year’s summer-season vegetable area (down from 47 percent a year earlier), reduced acreage nearly 5 Table 2--Summer-season fresh-market vegetable area 1/
Change Item 2006 2007 2008 2009 2008-09
--Acres-- PercentSnap beans 18,700 17,600 15,300 16,800 10Broccoli 32,000 31,000 30,000 29,500 -2Cabbage 12,000 14,100 12,600 11,800 -6Carrots 17,900 19,200 18,500 19,100 3Cauliflower 9,000 8,800 8,600 7,900 -8Celery 6,000 6,100 6,200 6,000 -3Sweet corn 97,500 98,900 98,600 101,000 2Cucumbers 3,900 4,000 3,700 4,000 8Head lettuce 46,600 38,000 37,000 34,000 -8Bell pepper 3,200 3,100 3,100 3,300 6Tomatoes 35,900 34,000 32,500 31,700 -2Onions, bulb 2/ 20,100 20,200 19,400 17,700 -9
Total 302,800 295,000 285,500 282,800 -1
1/ Selected crops for harvest largely during July-September. 2/ Summer nonstorage bulb onions.Source: USDA, National Agricultural Statistics Service, Vegetables.
5075
100125150175200225250275
Jan07 July07 Jan08 July08 Jan09 July09Month and year
Figure 2U.S. fresh vegetables: Monthly commercial grower price index, 2007-09
Index, 1992-94=100
Source: USDA, NASS, Agricultural Prices .
6 Vegetables and Melons Outlook/VGS-334/August 27, 2009
Economic Research Service, USDA
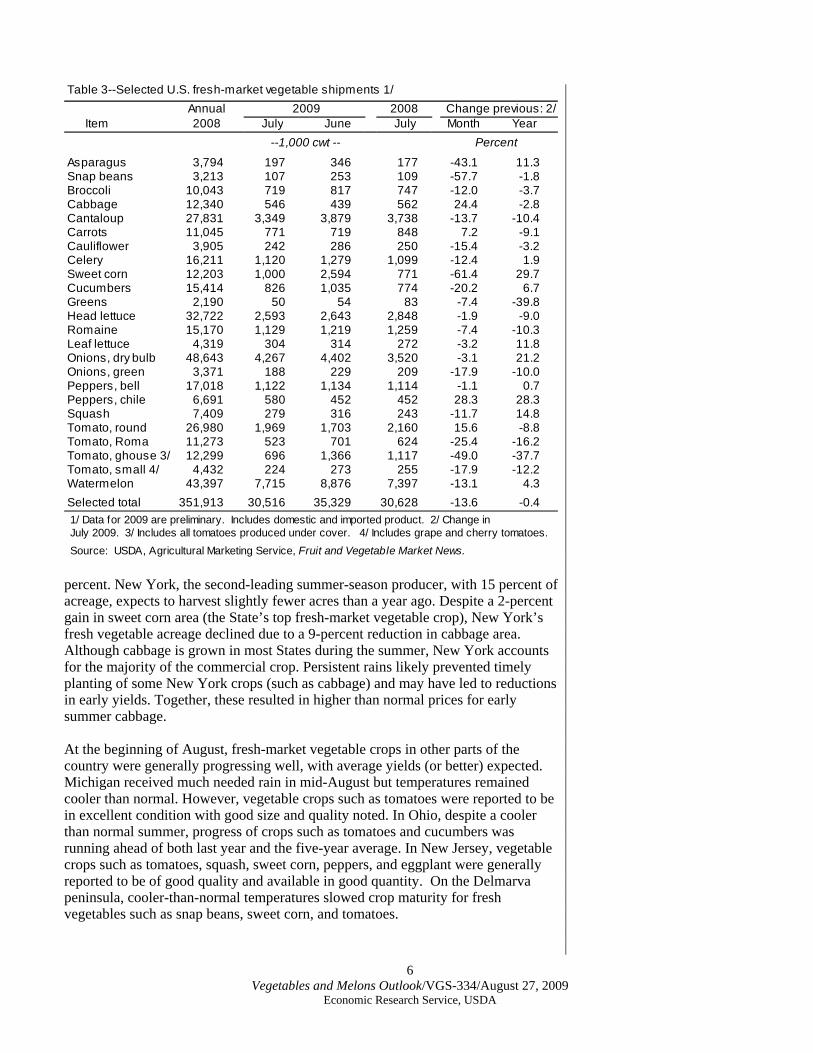
Table 3--Selected U.S. fresh-market vegetable shipments 1/Annual 2009 2008 Change previous: 2/
Item 2008 July June July Month Year --1,000 cwt -- Percent
Asparagus 3,794 197 346 177 -43.1 11.3Snap beans 3,213 107 253 109 -57.7 -1.8Broccoli 10,043 719 817 747 -12.0 -3.7Cabbage 12,340 546 439 562 24.4 -2.8Cantaloup 27,831 3,349 3,879 3,738 -13.7 -10.4Carrots 11,045 771 719 848 7.2 -9.1Cauliflower 3,905 242 286 250 -15.4 -3.2Celery 16,211 1,120 1,279 1,099 -12.4 1.9Sweet corn 12,203 1,000 2,594 771 -61.4 29.7Cucumbers 15,414 826 1,035 774 -20.2 6.7Greens 2,190 50 54 83 -7.4 -39.8Head lettuce 32,722 2,593 2,643 2,848 -1.9 -9.0Romaine 15,170 1,129 1,219 1,259 -7.4 -10.3Leaf lettuce 4,319 304 314 272 -3.2 11.8Onions, dry bulb 48,643 4,267 4,402 3,520 -3.1 21.2Onions, green 3,371 188 229 209 -17.9 -10.0Peppers, bell 17,018 1,122 1,134 1,114 -1.1 0.7Peppers, chile 6,691 580 452 452 28.3 28.3Squash 7,409 279 316 243 -11.7 14.8Tomato, round 26,980 1,969 1,703 2,160 15.6 -8.8Tomato, Roma 11,273 523 701 624 -25.4 -16.2Tomato, ghouse 3/ 12,299 696 1,366 1,117 -49.0 -37.7Tomato, small 4/ 4,432 224 273 255 -17.9 -12.2Watermelon 43,397 7,715 8,876 7,397 -13.1 4.3Selected total 351,913 30,516 35,329 30,628 -13.6 -0.4 1/ Data for 2009 are preliminary. Includes domestic and imported product. 2/ Change in July 2009. 3/ Includes all tomatoes produced under cover. 4/ Includes grape and cherry tomatoes. Source: USDA, Agricultural Marketing Service, Fruit and Vegetable Market News. percent. New York, the second-leading summer-season producer, with 15 percent of acreage, expects to harvest slightly fewer acres than a year ago. Despite a 2-percent gain in sweet corn area (the State’s top fresh-market vegetable crop), New York’s fresh vegetable acreage declined due to a 9-percent reduction in cabbage area. Although cabbage is grown in most States during the summer, New York accounts for the majority of the commercial crop. Persistent rains likely prevented timely planting of some New York crops (such as cabbage) and may have led to reductions in early yields. Together, these resulted in higher than normal prices for early summer cabbage. At the beginning of August, fresh-market vegetable crops in other parts of the country were generally progressing well, with average yields (or better) expected. Michigan received much needed rain in mid-August but temperatures remained cooler than normal. However, vegetable crops such as tomatoes were reported to be in excellent condition with good size and quality noted. In Ohio, despite a cooler than normal summer, progress of crops such as tomatoes and cucumbers was running ahead of both last year and the five-year average. In New Jersey, vegetable crops such as tomatoes, squash, sweet corn, peppers, and eggplant were generally reported to be of good quality and available in good quantity. On the Delmarva peninsula, cooler-than-normal temperatures slowed crop maturity for fresh vegetables such as snap beans, sweet corn, and tomatoes.

7 Vegetables and Melons Outlook/VGS-334/August 27, 2009
Economic Research Service, USDA
Assuming continued sluggish economic activity and weak demand, summer-season fresh-market vegetable prices are likely to average below the relatively strong levels of the past year. During the summer quarter of 2008 (July-September), prices received by growers and shippers of fresh-market vegetables and melons were the highest nominal dollar summer season prices on record. Assuming average weather, shipping-point prices for fresh-market vegetables (which rose 8 percent last summer), are currently expected to average 2 to 7 percent below a year earlier during the summer quarter. Slightly Larger Onion Crop Expected Harvested area for all onions is expected to total 151,510 acres in 2009—down 1 percent from 2008 and the smallest harvested area since the early 1990s. While area Table 4—U.S. quarterly grower (point-of-first-sale) prices, 2008-09
2008 2009 ChangeCommodity Second Third Fourth First Second Third * Fourth * 2nd Q 1/
Cents/pound Percent
Asparagus 96.93 -- -- 79.80 118.43 104.00 -- 22.2Broccoli 35.63 31.47 44.13 40.27 35.27 33.00 41.00 -1.0Cantaloup 21.70 14.07 27.40 -- 17.35 14.00 28.00 -20.0Carrots 27.70 25.50 25.03 25.20 25.50 25.00 24.00 -7.9Cauliflower 47.53 36.97 40.63 49.47 44.00 36.00 38.00 -7.4Celery 27.17 15.47 17.00 26.60 15.50 13.00 16.50 -43.0Sweet corn 20.77 27.60 25.57 43.53 27.33 26.00 25.00 31.6Cucumbers 27.47 25.77 37.43 39.10 23.97 27.00 34.00 -12.7Lettuce, head 18.27 22.13 25.07 21.87 21.63 19.00 24.00 18.4Onions, dry bulb 17.37 10.41 11.77 7.45 19.97 15.00 10.50 15.0Snap beans 48.67 72.90 55.40 64.13 48.33 72.00 62.00 -0.7Tomatoes, field 50.80 31.97 45.53 34.50 49.93 35.00 49.00 -1.7
All vegetables 2/ 156 153 162 154 162 146 164 3.8
-- = not available. * = ERS forecast. 1/ Change in 2nd-quarter 2009 over 2nd-quarter 2008. 2/ Price index w ith base period of 1990-92 (the period w hen the index equaled 100).
Source: Derived by ERS from USDA, National Agricultural Statistics Service, Agricultural Prices.
0
50
100
150
200
250
300
350
J-07 M M J-07 S N J-08 M M J-08 S N J-09 M M J-09051015202530354045505560Shipments Price at first sale point
Figure 3Fresh sweet corn: Monthly shipments & price at first sale point, 2007-09 1/
Mil. lbs Cents/lb
1/ This price is frequently represented by the f.o.b. shipping point price. Source: USDA, National Agricultural Statistics Service and Market News Service.

8 Vegetables and Melons Outlook/VGS-334/August 27, 2009
Economic Research Service, USDA
Table 5--Fresh vegetables: Consumer price indexes 1/ 2009 2008 Change previous:
Item July June July Month Year ---------------- Index ---------------- ---- Percent ----
Food at home 213.8 214.8 215.8 -0.5 -0.9 Food away from home 223.3 223.2 216.4 0.1 3.2 Fresh vegetables 294.6 296.9 313.8 -0.8 -6.1 Potatoes 326.2 322.0 347.0 1.3 -6.0 Tomatoes, all 301.4 304.0 330.7 -0.9 -8.9 Lettuce, all 269.7 277.0 276.6 -2.7 -2.5 Other vegetables 293.1 296.0 312.0 -1.0 -6.1
1/ Index base is 1982/84=100. Source: U.S. Dept. of Labor, Bureau of Labor Statistics (http://w w w .bls.gov/data/home.htm). for both the spring and summer nonstorage crops declined from a year earlier, area for harvest of summer storage onions is expected to be up 1 percent from last year. With cool weather predominating in most areas, yield for both the 2009 spring (up 6 percent) and summer nonstorage (up 12 percent) crops each averaged well above a year earlier. If realized, this summer’s estimated nonstorage onion yield of 599 cwt would shatter the 2005 record by 6 percent. Thus, with strong yields outweighing reduced area, production was higher for both spring season (up 1 percent) and summer nonstorage onions. Despite a 9 percent drop in harvested area, the summer nonstorage onion crop totaled an estimated 10.6 million cwt—up 3 percent from a year earlier. Although harvested area for summer storage onions (the primary source of bulb onions during the fall and winter) is expected to be a bit higher this year, it will be second only to 2008 as the lowest harvested area since 1992. Although storage onion acreage is lower this decade than in the 1990s, production has remained strong because of higher average yields. During 2004-08, U.S. storage onion yields averaged 18-percent above those of 1994-98. Higher yields reflect such things as improved production practices and the shifting of acreage to higher yielding States such as Washington and Oregon. Given weather favorable to onion production in key growing areas, storage yields are expected to follow the lead of the spring and summer crops. Although the 5-year average would place storage yield at 509 cwt per acre (down 3 percent from a year earlier), it may be a stretch to reach the 2004 record high of 540 cwt per acre. However, aside from some hail damage in places such as Colorado, growing conditions in storage onion States appear to favor at least matching the 525 cwt (the third highest on record) of a year earlier. Thus, this year’s storage onion crop could total 1-3 percent above the 55.3 million cwt of a year ago. The first estimate of storage onion yield and production will be released by USDA in the October 2 Vegetables report. During the second quarter (Apr.-June), onion prices as measured at the point of first sale (largely the shipping-point price) averaged $19.97 per cwt, up 15 percent from a year earlier but 13 percent lower than the average of the previous 3 years. During the second quarter, fresh-market shipments of bulb onions declined 3 percent from a year earlier, with all the decline occurring during April and May. Volume picked up in June (up 8 percent) and remained above a year earlier in July (up 2 percent). However, despite greater market volume, U.S. average onion prices at the shipping point remained well above a year earlier in both June and July. At retail, while the advertised price for sweet (less pungent) yellow onions averaged 7-percent below a year earlier during June and July, the price for a 3-pound bag of yellow onions averaged 6 percent above a year earlier. Onion prices are expected to decline

9 Vegetables and Melons Outlook/VGS-334/August 27, 2009
Economic Research Service, USDA
seasonally in the months ahead. Onion prices this fall are currently expected to average modestly lower than a year earlier but will depend chiefly on the size of storage crop and any unforeseen changes in domestic and foreign demand. Fresh Imports Steady The volume of fresh vegetable (excluding potatoes and melons) imports declined less than 1 percent during the first half (Jan.-June) of the 2009 calendar year (table 6). The value of those imports dropped 9 percent from a year earlier led by onions (down 18 percent), tomatoes (down 9 percent), chile peppers (down 21 percent), and garlic (down 51 percent). Although import volume from Mexico was up 2 percent largely because of tomatoes, volume from each of the other top sources declined including Canada (down 12 percent), Costa Rica (down 10 percent), China (down 5 percent), and Honduras (down 5 percent). Costa Rica supplies mostly tropical vegetables such as cassava, dasheens, and yams, while imports from China routinely consist largely of garlic, which was down 6 percent due to increased demand and reduced production in China. Together, Mexico and Canada accounted for 90 percent of U.S. fresh-market vegetable import volume during the first half of 2009. The average unit value of all imported fresh vegetables declined 8 percent from a year earlier during January-June. The average value of fresh imports from Mexico was down 10 percent and unit value down just 1 percent on imports shipped from Canada. In 2008, imports accounted for a record 20 percent of all fresh vegetable (excluding melons and potatoes) disappearance, with little change expected in 2009 as both imports and domestic production remain steady. Table 6--Selected fresh-market vegetable trade volume, 2007-09 1/
2008 January - June Change Item Annual 2007 2008 2009 2008-09
------------------------------- 1,000 cwt --------------------------- PercentExports, fresh: Onions, dry bulb 6,120 2,297 2,158 2,167 0 Lettuce, head 3,380 1,712 1,613 1,400 -13 Lettuce, other 4,662 2,300 2,376 2,350 -1 Tomatoes 3,751 1,630 1,714 1,712 0 Broccoli 3,031 1,727 1,744 1,508 -14 Carrots 2,751 1,553 1,648 1,502 -9 Celery 2,559 1,509 1,455 1,405 -3 Other 10,608 6,320 6,899 6,740 -2 Total 36,861 19,049 19,607 18,784 -4Imports, fresh: Tomatoes, all 24,611 15,498 15,793 16,201 3 Cucumbers 10,980 6,335 6,896 7,027 2 Onions, dry bulb 7,142 5,450 3,762 3,259 -13 Peppers, sweet 7,309 4,464 4,600 4,675 2 Squash 2/ 5,658 3,490 3,357 3,327 -1 Peppers, chile 6,283 2,424 3,111 2,795 -10 Asparagus, all 3,083 1,300 1,509 1,773 17 Other 23,624 12,288 12,721 12,530 -2 Total 88,690 51,248 51,749 51,587 0
1/ Excludes melons, potatoes, mushrooms, dry pulses, and sw eet potatoes. 2/ Excludes chayote. Source: Prepared by ERS using data from U.S. Department of Commerce, U.S. Census Bureau.

Melons
10 Vegetables and Melons Outlook/VGS-334/August 27, 2009
Economic Research Service, USDA
Summer Acreage Steady This summer (largely July-September), area for harvest of the three leading melon crops was estimated to be 87,900 acres—slightly less than a year earlier. Area is expected to be down for watermelon and honeydews but a bit higher for cantaloup. Although cantaloup area was steady in California, growers in the southeast (Georgia and South Carolina) planted more area, accounting for all the acreage gain. Water-melon is the top melon crop during the summer in terms of acreage and shipment volume. Watermelon area for harvest was down this summer, with growers in Georgia reducing watermelon area for the third consecutive year. Despite record high average watermelon prices in 2008 (up 13-percent from a year earlier), some of Georgia’s area could have shifted into cantaloup this year. This reflects much more attractive prices for cantaloup (also record-highs) over the past few years in the State and strong demand in general for eastern-grown cantaloup. According to USDA’s Market News Service, total melon shipments ran 5 percent below a year earlier during the peak May-July period due in part to slow crop development caused by cool spring weather. As crops matured, shipment volume improved and by July was stronger than a year earlier for seedless watermelon (up 11 percent). However, shipments of cantaloup and honeydew remained below a year earlier—consistent with the reduction in acreage and lower yields. As reported by USDA’s Market News Service, U.S. average advertised retail prices for cantaloups have remained around $2.00 each this summer. Average retail prices for seedless watermelon declined seasonally each month since peaking at the start of the domestic season at $5.49 each—falling to $4.19 in August. Until weakening in August to $2.71 each, honeydew melon retail prices had hovered around $3.00 since early spring. Table 7--Summer-season fresh-market melon area 1/
Change Item 2006 2007 2008 2009 2008-09
--Acres-- Percent
Cantaloup 34,500 31,300 28,200 28,900 2Honeydew 11,800 11,400 10,700 10,200 -5Watermelon 54,700 53,000 49,200 48,800 -1
Total 101,000 95,700 88,100 87,900 01/ Selected crops for harvest largely during July-September.Source: USDA, National Agricultural Statistics Service, Vegetables. Table 8--U.S. fresh-market melons: Import volume, January - June
Annual January - June Change Item 2008 2007 2008 2009 2008-09
--1,000 cwt-- Percent
Cantaloups 9,310 8,256 7,529 8,261 10 Watermelon, all 10,571 7,330 8,743 7,834 -10 Seedless 9,203 5,905 7,539 6,336 -16 Honeydew & other 4,066 2,929 2,918 2,652 -9 Total 23,947 18,515 19,191 18,747 -2
Source: Prepared by ERS using data from U.S. Department of Commerce, U.S. Census Bureau.

Processing Vegetables
11 Vegetables and Melons Outlook/VGS-334/August 27, 2009
Economic Research Service, USDA
Area for Harvest Up 6 Percent In 2009, contract area for harvest of the five major processing vegetables (tomatoes, sweet corn, snap beans, green peas, and cucumbers) is expected to total 1.23 million acres—up 6 percent from a year ago. Contract production accounted for 99 percent of the output of the five leading processing vegetables last year. The California tomato crop is progressing well, with favorable weather resulting in good quality and strong yields to this point in the season. With a record-large processing tomato crop anticipated and yields for other processing vegetables that at least match the average of the past 3 years, output of the eleven leading processing vegetables could total more than 19 million short tons—up 10 percent from last year’s strong production. As a result, some easing of processed vegetable wholesale prices is anticipated this fall. In July, wholesale prices for canned vegetables (including juices) were running 13 percent above a year ago, while frozen vegetables were selling for 14 percent more. This year, contract area destined for canned vegetables rose 10 percent as gains were realized for each of the 5 major crops. With the exception of snap beans (up 6 percent), contract area is up at least 10 percent for each canning vegetable. The increase in canning vegetable contracts reflects relatively low stocks for sweet corn and green peas and higher wholesale prices for canned vegetables across the board. According to industry data, retail volume for canned vegetables was down in 2008 and continued to decline during the first quarter of 2009. Despite conventional wisdom, although unemployment was rising, consumers appear to have continued purchasing relatively more expensive frozen alternatives (corn, beans, peas) in 2008 since retail movement of these products increased last year. However, as the employment picture darkened early in 2009, the retail volume of both canned and frozen vegetables turned lower during the first quarter of 2009. This drop in volume may have reflected price resistance by cash-strapped consumers as average prices for both canned and frozen vegetables continued to rise into mid-2009. Weak demand for canned vegetables continued into the second quarter with volume reported to be down 1 percent across all canned products. However, second quarter retail sales volume for frozen vegetables reportedly increased 4 percent from a year earlier, continuing the experience of 2008. Table 9--Contract plantings of selected processing crops 1/
Contract plantings Change Item 2006 2007 2008 2009 p 2008-09
------------------------- 1,000 acres ------------------------- Percent
Canning 811.8 798.8 760.6 839.8 10 Tomatoes 297.7 316.3 296.3 327.7 11 Sweet corn 197.6 180.0 177.8 195.0 10 Snap beans 139.7 129.8 129.8 137.3 6 Green peas 90.6 80.8 77.5 86.0 11 Cucumbers 86.2 91.9 79.1 93.8 19
Freezing 385.8 402.6 398.0 391.9 -2 Sweet corn 196.8 200.1 186.0 198.9 7 Snap beans 66.8 75.0 73.4 62.7 -15 Green peas 122.2 127.5 138.6 130.4 -6
Total 1,197.6 1,201.4 1,158.5 1,231.7 6 p = NASS July estimate of contract area for harvest. 1/ Excludes open market plantings.
Source: USDA, National Agricultural Statistics Service, Vegetables.

12 Vegetables and Melons Outlook/VGS-334/August 27, 2009
Economic Research Service, USDA
Table 10--Processing vegetables: Consumer and producer price indexes 1/ 2009 2008 Change previous:
Item July June July Month Year --------------- Index -------------- ------ Percent -----
Consumer Price Indexes (12/97=100) Processed fruits and vegetables 150.3 150.9 140.5 -0.4 7.0 Canned vegetables 165.9 165.5 148.1 0.2 12.1 Frozen vegetables (1982-84=100) 201.0 199.5 193.1 0.8 4.1 Dry beans, peas, lentils 178.7 179.0 162.6 -0.2 9.9 Olives, pickles, relishes 134.3 135.1 135.1 -0.6 -0.6
Producer Price Indexes (1982=100) Canned vegetables and juices 171.3 171.3 153.3 0.0 11.7 Pickles and products 211.0 211.0 203.9 0.0 3.5 Tomato catsup and sauces 2/ 155.1 154.8 145.4 0.2 6.7 Canned dry beans 152.2 151.5 143.1 0.5 6.4 Vegetable juices 2/ 125.1 127.4 118.6 -1.8 5.5 Frozen vegetables 177.4 178.6 158.8 -0.7 11.7 Frozen vegetable combinations 4/ 116.5 116.8 115.7 -0.3 0.7 Dried/dehy. fruit & vegetables 196.5 196.4 195.0 0.1 0.8 Spices 3/ 188.1 188.3 177.7 -0.1 5.9
-- = not available. 1/ Not seasonally adjusted. 2/ Index base year is 1987. 3/ Index base year is 1991. 4/ Index base is Dec. 1990. Source: U.S. Dept. of Labor, Bureau of Labor Statistics (http://w w w .bls.gov/data/home.htm). Contract area for pickling cucumbers was estimated to have risen 19 percent but this crop also annually features the lowest percentage of area contracted. In any given year, processors also purchase 10-20,000 acres of additional cucumbers on the open market (likely from contract growers planting extra area), depending on the yields in contract fields, processor stocks, and general market conditions. In contrast, processors rarely purchase open market acres of green peas and sweet corn. Also, some pickling cultivars are increasingly being sold fresh in the open market to supermarkets for use in home pickling or for fresh slicing (they have thin skins and have garnered a consumer following). However, the fresh-market sale of pickling cucumbers remains a relatively small portion of total sales. As for most canned vegetables, sluggish demand remains a key problem. The retail volume for pickles was lower than a year earlier in 2008 and continued to decline during the first quarter of 2009. Among the three major frozen vegetables (sweet corn, snap beans, and green peas), processors responded to shrinking inventories of sweet corn by contracting for 7 percent more area. Despite attractive wholesale prices, processors reduced area devoted to snap beans and green peas because of larger production last fall, which led to rising inventories. On January 1, green pea stocks were the highest since 2001, while cold storage holdings of snap beans were the largest since 1992 and the third largest on record. Despite the increased stocks, the recession did not have a discernable impact on disappearance of these 2 crops in 2008. Per capita disappearance (includes both food at-home and away-from-home) of snap beans used for freezing remained steady at 2.1 pounds in 2008, while use of green peas also remained relatively flat at 1.8 pounds per person. However, disappearance of sweet corn used to make frozen products, which had been trending higher since 2003, dropped 16 percent in 2008 to 8.4 pounds per person. Some of this may have reflected weaker use by restaurants since the foodservice industry has been hit hard by the recession. Consumers apparently did not substitute other forms of sweet corn for frozen as use of canned corn declined from the previous year and fresh sweet corn use remained steady in 2008.

13 Vegetables and Melons Outlook/VGS-334/August 27, 2009
Economic Research Service, USDA
0
100
200
300
400
500
600
700
1990 1995 2000 2005 2006 2007 2008 2009
Wisconsin Washington OregonMinnesota Others
Figure 4U.S. green peas for processing: Production, 1990-2009
1,000 tons
Source: USDA, National Agricultural Statistics Service, Vegetables (2009 is contract only ).
Green Pea Output Declines The first estimate of 2009 contract production for processing green peas indicated a 3-percent decline from a year earlier to 400,920 short tons (1 short ton equals 2000 pounds). Estimated contract area for harvest was up 1 percent from a year earlier. Virtually all green peas are produced under contract. Yields were expected to decline 4 percent (to 1.89 short tons) from last year and 9 percent from the 2007 record high. In Washington, area for harvest is expected to jump 13 percent to the highest level since 2000 and push the State past Minnesota as the top producer of processing green peas. Despite above average temperatures this season, green pea yields in Washington were expected to be up 1 percent from a year earlier and remain the highest in the nation—38 percent above the national average. As a result, production in Washington was expected to be the highest since 1995—14 percent above last year and 29 percent of the national processing green pea crop. The next production estimate for processing vegetables is scheduled to be released in USDA’s September 4 Vegetables report. Processed Exports Up During the first half of 2009, the value of processed vegetable exports (excluding potatoes and mushrooms) increased 3 percent to $607 million. Canada (36 percent of value), Japan (12 percent), Mexico (8 percent), Italy (5 percent), and Taiwan (4 percent) have been the top five foreign markets for canned, frozen, and dehydrated vegetables this year. In terms of value, tomato paste was the top processed vegetable export (excluding potatoes) during the first 6 months of 2009, followed by tomato sauces, and canned sweet corn. Although the order changes, these three products have annually been the top processed exports since 2003. If potatoes were included in this analysis (potatoes are discussed separately due to the scope of the crop), frozen french fries would dominate at $322 million in 2009. Excluding potatoes, U.S. exports of frozen vegetables declined 11 percent during January-June. Reduced exports of miscellaneous and mixed vegetables (a category that covers 62 percent of frozen vegetables) outweighed gains in snap beans (up 45

14 Vegetables and Melons Outlook/VGS-334/August 27, 2009
Economic Research Service, USDA
percent), green peas (up 14 percent), and sweet corn (up 4 percent). Canada (30 percent of export value), Japan (25 percent), and Hong Kong (11 percent) remain the top three markets. The value of dried and dehydrated vegetable and herb exports (excluding potatoes and mushrooms) rose 18 percent from a year earlier during the first 6 months of 2009. Much of the gain was due to a sharp increase in exports to Taiwan, which increased imports of unspecified dried leguminous vegetables to $15 million from less than $1 million a year earlier. Table 11--Value of processed vegetable trade 1/
2008 January - June Change Item Annual 2007 2008 2009 2008-09
------------------------- Million dollars ------------------- Percent Imports: Canned 988 441 475 485 2 Tomato products 182 101 88 95 8 Frozen 748 298 377 371 -2 Broccoli 252 97 131 125 -5 Dehydrated 2/ 466 207 222 219 -1 Paprika 63 19 28 29 3Exports: Canned 811 269 378 396 5 Tomato products 518 139 235 246 5 Frozen 261 100 128 115 -11 Sweet corn 69 32 33 34 4 Dehydrated 2/ 170 76 82 97 18 Onion products 85 37 42 41 -2
1/ Excludes potatoes and mushrooms. 2/ Also includes miscellaneous dried leguminous vegetables.
Source: Derived by ERS from data of the U.S. Department of Commerce, U.S. Census Bureau.
Table 12--Value of processed vegetable exports by selected country 1/2008 January - June Change
Item Annual 2007 2008 2009 2008-09------------------------- Million dollars ------------------- Percent
Canned 811 269 378 396 5 Canada 307 130 142 159 12 Italy 74 0 39 32 -20 Mexico 71 26 27 36 32 Japan 62 28 31 30 -3 Others 297 86 139 139 0
Frozen 261 100 128 115 -11 Canada 67 28 31 37 17 Japan 59 28 29 31 5 Hong Kong 46 6 24 11 -53 Mexico 19 8 9 10 18 Others 69 30 35 26 -27 Dehydrated 2/ 170 76 82 97 18 Canada 42 23 21 22 5 Japan 21 8 10 10 3 United Kingdom 10 5 5 5 -5 Taiwan 2 0 0 15 8455 Others 107 45 51 65 27
1/ Excludes potatoes and mushrooms. 2/ Also includes miscellaneous dried leguminous vegetables. Source: Derived by ERS from data of the U.S. Department of Commerce, U.S. Census Bureau.

Potatoes
15 Vegetables and Melons Outlook/VGS-334/August 27, 2009
Economic Research Service, USDA
Fall Area Up Slightly, Summer Yields Strong Fall-season potato growers planted 932,900 acres in 2009, up less than 1 percent from a year earlier. The fall crop accounted for 91 percent of annual potato output in 2008. Despite hot spells in the Pacific Northwest, hail in Nebraska and Colorado, and cool, wet weather (and reports of late blight) in the Northeast, fall potato yields are currently projected to average just below the strong levels of 2008 in many areas. In late August, 93 percent of the Idaho potato crop was reported to be in mostly good condition, with hail and flood damaged area pushing the remaining 7 percent into the fair or poor condition category. In Washington, second only to Idaho in production, crop reporters placed just 42 percent of the crop into the good or excellent categories, with most of the remainder in fair condition. This likely reflected the portion of the crop which experienced excessive heat (more than a week of at least 100 degrees) which hit parts of the Columbia Basin in late July and into August. In North Dakota, 13 percent of the state’s 82,000 acres was reported to be in poor or very poor condition due mostly to severe June flooding. This will either result in increased acreage abandonment or some reduction in North Dakota’s average yield from the 280 cwt reported a year ago. Since national acreage abandonment is currently expected to be slightly greater than a year ago (due to excessive rain in places such as North Dakota and New York) the 2009 fall potato crop is expected to remain near the 376 million hundredweight (cwt) of a year earlier. The first official USDA estimate of fall potato production will be released in the November 10 Crop Production report. Table 13--Potatoes by season and selected State: Area, yield, and production
AreaSeason & Planted Harvested Yield Production State 2008 2009 2008 2009 2008 2009 2008 2009
---1,000 acres--- ---Cwt--- ---1,000 Cwt---Summer
TX 8.0 6.2 7.4 5.7 395 420 2,923 2,394MO 7.2 7.0 6.5 6.7 190 320 1,235 2,144IL 5.5 5.5 5.3 5.3 395 386 2,094 2,046VA 5.8 6.4 5.7 6.3 220 280 1,254 1,764CO 4.4 4.0 4.1 3.8 370 380 1,440 1,440CA 3.6 3.8 3.6 3.8 360 375 1,296 1,425U.S 47.0 44.0 44.8 42.5 306 341 13,694 14,506
FallID 305.0 320.0 304.0 319.0 378 114,805WA 155.0 145.0 155.0 145.0 600 93,000WI 63.5 63.5 62.0 63.0 415 25,730ND 82.0 80.0 81.0 77.0 280 22,680CO 57.0 56.0 56.9 55.8 375 21,338MN 50.0 47.0 48.0 45.0 425 20,400OR 35.3 36.0 35.3 36.0 529 18,676MI 43.0 45.0 42.5 44.5 350 14,875ME 56.0 56.0 54.7 55.0 270 14,769
U.S 930.5 932.9 921.1 922.7 409 376,386
Source: USDA National Agricultural Statistics Service, Crop Production .

16 Vegetables and Melons Outlook/VGS-334/August 27, 2009
Economic Research Service, USDA
700
750
800
850
900
950
1,000
1,050
Jan Feb Mar Apr May June July Aug Sep Oct Nov Dec
2007 2008 2009
Figure 5U.S. potatoes: Monthly fresh-market shipment volume, 2007-09Mil. lbs
Source: USDA, AMS, Market News Service.
The summer potato crop accounts for about 3 percent of annual U.S. potato output. Like the spring season crop, the summer season potato crop increased 6 percent from a year earlier. Harvested area was down 5 percent this summer but was more than offset by an 11-percent gain in estimated yield to 341 cwt. If realized, this would tie the record-high yield set in 2005. With the exception of Illinois, summer yields were estimated to be equal to or above a year earlier in each of the major producing States, with record highs expected in 3 States (VA, MD, CO). Prices Likely To Average Lower in 2009/10 Although supplies will likely tighten going into next year, prices received by U.S. potato growers are expected to average below a year earlier during the 2009/10 season. In 2008/09, the preliminary marketing year average price for all potatoes was $9.46 per cwt—up 26 percent from the prior year. However, prices are expected to come down from those unusual highs assuming continued weakness in domestic and export demand. Although potato supplies will remain relatively tight, domestic demand (especially in foodservice) will likely remain slow until employment levels begin to improve sometime in 2010. However, if blight leads to increasing storage losses and export and/or domestic demand for fresh and processed products proves more resilient than expected, potato prices could move closer to the nominal dollar record highs experienced in 2008. Through the first 11 months of the crop year (Sep-July), prices received by potato growers for all uses averaged $9.18 per cwt, 14 percent above a year earlier. Until recently, potato prices had not varied much when compared with the wild ride of a year earlier. For example, average prices in July 2009 were just 11 percent above those at the start of the crop year in September 2008. In comparison, the July 2008 price was more than double the relatively low September 2007 price. Toward the end of the last crop year, available tablestock supplies were extremely tight as reflected by fresh market prices shooting up to $24.93/cwt last August. This year, better than expected summer production (due to strong yields) and sluggish foodservice demand has left the market with greater supplies and more stable

17 Vegetables and Melons Outlook/VGS-334/August 27, 2009
Economic Research Service, USDA
Table 14--U.S. potatoes: Monthly grower and retail prices, 2008-09 Crop year & Grower prices Retail prices
month All uses Fresh Processing Fresh Chips----------------------------------- Dollars/pound --------------------------------
2008 July 0.123 0.194 0.066 0.672 4.159 August 0.113 0.249 0.056 0.724 4.120 September 0.088 0.192 0.057 0.783 4.123 October 0.074 0.166 0.056 0.730 4.196 November 0.089 0.154 0.059 0.699 4.330 December 0.096 0.147 0.065 0.678 4.482
2009 January 0.094 0.137 0.067 0.676 4.534 February 0.089 0.124 0.068 0.660 4.611 March 0.093 0.119 0.070 0.652 4.550 April 0.098 0.120 0.076 0.620 4.683 May 0.096 0.127 0.078 0.616 4.438 June 0.095 0.130 0.074 0.634 4.557 July 1/ 0.098 -- -- 0.641 4.566
Percent changeyear ago July -20.5 -- -- -4.6 9.8
-- = not available. 1/ Prices for July 2009 are mid-month averages.
Source: USDA, National Agricultural Statistics Service, Agricultural Prices and U.S. Dept. of Labor, Bureau of Labor Statistics (retail). prices than a year earlier. Improved tablestock supplies were reflected in a 7-percent increase in fresh market potato shipments from a year earlier (after rising 2 percent in June) and lower fresh market prices. Although fresh prices have been less variable this year (while also averaging lower than the extreme highs of a year earlier), they remain about one-third above the 2003-07 average. Retail prices are also expected to ease in the coming year, reflecting prospects for slightly easier tablestock supplies (especially from Idaho). Through July of this year, the CPI for fresh potatoes averaged 13 percent above a year earlier but is not expected to repeat the same late summer/early fall surge experienced a year ago since tablestock availability and shipment volume is improved and grower prices are lower. This was reinforced by the July CPI which, although up slightly from the prior month, averaged 5-percent below a year earlier. Retail prices for potato chips remain elevated this summer, reflecting higher potato and vegetable oil prices over the past 2 years and the continued influence of the more costly fabricated (and flavored) chips (made from dehydrated potato flakes). During the second quarter, retail prices for chips averaged $4.56 per pound—up 16 percent from a year earlier but largely unchanged from the first quarter of this year. It was the first time in 2 years that quarterly chip prices did not increase. In the year ahead, the impact of lower vegetable oil prices on the retail price of potato chips may be partially offset by this season’s higher contract prices for chipping potatoes. For reasons similar to the chip market, the wholesale price of frozen french fries averaged 21-percent above those of a year earlier during January-July. However, over the past 2 years, price increases for raw processing potatoes appear relatively modest compared with the wholesale price gains for most vegetable oils used by chippers and fryers. Increases for sunflowerseed and other vegetable oils of more

18 Vegetables and Melons Outlook/VGS-334/August 27, 2009
Economic Research Service, USDA
than 50 percent were recorded from 2006/07 to 2007/08 (doubling the 2005/06 price) before commodity prices eased in 2008/09. Exports Up 5 Percent During the September-June period, U.S. exports of all potatoes and potato products (including starch and dextrins) totaled $991 million—5 percent above a year earlier. With volume relatively flat, most of the gains have originated from higher prices. Japan remained the top foreign market with 28 percent of the total, led by movement of frozen french fries, potato chips, and other frozen products. Japan was followed by Canada (22 percent of export value), Mexico (12 percent), Hong Kong (5 percent), and South Korea (4 percent). Most of the gain in potato export value this year has been the result of higher prices. For example, although the volume of fresh-market potato exports was down less than 1 percent from a year earlier through June, a 9-percent increase in the average value per pound pushed export value up 9 percent. Unit values were larger for most potato products as well, including french fries (up 6 percent), flakes (up 5 percent), and chips (up 4 percent). During the September-June period, U.S. imports of all potatoes and potato products totaled $863 million—8 percent above a year earlier. Canada remained the top foreign supplier with 87 percent of the total, followed distantly by Mexico (4 percent), Germany (3 percent), and the Netherlands (2 percent). While Mexico largely supplies prepared/preserved (canned) products and some chips, starches and other dehydrated products account for the bulk of imports from Germany and the Netherlands. Since peaking in 2003/04 at 1.76 billion pounds, import volume of frozen french fries from Canada has annually totaled 1.6 billion pounds or less, reflecting weakening U.S. demand and the depreciation of the U.S. dollar. Table 15--U.S. potatoes: Crop year trade volume to-date, 2006/07-08/09 1/
Crop year September - June Change Item 2007/08 2006/07 2007/08 2008/09 2007-08
------------------------------- 1,000 cwt --------------------------- Percent
Exports Fresh-market 6,237.8 4,019.3 4,822.3 4,803.0 0 Seed 245.0 224.9 232.2 356.7 54 Frozen fries 16,214.2 11,880.8 13,167.0 13,190.6 0 Other frozen 1,196.5 592.9 980.2 1,017.6 4 Chips 1,423.4 1,057.7 1,138.1 1,091.8 -4 Flakes/granules 1,206.3 1,296.7 1,019.8 873.6 -14 Canned/prep 441.6 393.0 348.2 411.2 18 Flour, meal, dried 293.0 191.8 249.1 247.8 -1 Starch & dextrins 346.0 317.4 290.7 304.8 5
Imports Fresh-market 10,389.8 8,344.9 9,256.3 7,996.6 -14 Seed 1,039.1 1,851.9 1,038.3 1,419.3 37 Frozen fries 15,623.0 13,307.3 12,959.4 13,225.5 2 Other frozen 1,249.7 1,083.5 1,008.6 1,066.5 6 Chips 260.6 476.4 219.6 242.2 10 Flakes/granules 231.7 108.9 174.5 355.0 104 Canned/prep 245.2 8.6 19.1 34.9 83 Flour, meal, dried 103.1 30.5 83.8 38.0 -55 Starch & dextrins 2,156.3 1,949.0 1,806.6 1,725.8 -4
1/ Crop year runs September through August. All data are product w eight as reported by Census. Source: Prepared by ERS using data from U.S. Department of Commerce, U.S. Census Bureau.

Dry Edible Beans
19 Vegetables and Melons Outlook/VGS-334/August 29, 2009
Economic Research Service, USDA
Smaller Crop Expected The first estimate of 2009 U.S. dry edible bean production was released in August and indicated a reduction of 5 percent, to 24.4 million cwt (table 16). This was about a million cwt above industry expectations because of the more optimistic USDA yield estimates. The August USDA estimate indicated a 1-percent reduction in per-acre yield from last year’s record 17.68 cwt. Despite relatively favorable dry bean prices, growers ultimately reduced dry bean plantings 1 percent due to attractive prices for other crops and the cool, persistently wet spring which prevented planting or delayed it until very late in the season. With several thousand acres already lost to flooding this year (some early losses were replanted) and hail, the estimated area available for harvest is forecast to decline 4 percent to 1.39 million acres. Not surprisingly, given delayed planting and cool weather, observers Table 16--U.S. dry beans: Production, 2006-2009
Percent Item 2006 2007 2008 2009 f change
--1,000 cwt-- PercentNorth Dakota 7,680 10,773 10,048 7,975 -20.6Michigan 4,085 3,120 3,607 3,515 -2.6Nebraska 2,728 2,418 2,885 2,703 -6.3Minnesota 2,228 2,610 2,828 2,375 -16.0Idaho 1,906 1,602 1,462 1,782 21.9California 1,209 1,212 960 1,428 48.8Colorado 1,026 736 660 858 30.0Washington 968 1,020 885 956 8.0Wyoming 590 555 705 833 18.2Others 1,735 1,540 1,518 1,934 27.4United States 24,155 25,586 25,558 24,359 -4.7f = NASS August forecast. Source: USDA, National Agricultural Statistics Service, Crop Production.
10
11
12
13
14
15
16
17
18
19
1960 1964 1968 1972 1976 1980 1984 1988 1992 1996 2000 2004 2008
Figure 6U.S. dry beans, all: Average yield per acre, 1960-2009 1/Cwt/acre 1/
1/ Cwt = 100 pound units.Source: USDA, National Agricultural Statistics Service,Crop Production.
Trend

20 Vegetables and Melons Outlook/VGS-334/August 29, 2009
Economic Research Service, USDA
in several areas report that crop maturity is as much as two weeks behind average. This means that a frost free September could be critical to production, especially in the cool northern areas where crops are running late. Planted area was down in just 5 of the 18 reporting States but included 4 of the top 5 dry bean States. North Dakota, which accounted for 41 percent of U.S. dry bean seeded area this year (down from 44 percent a year ago and 45 percent 2 years ago), expects to harvest 14-percent fewer acres than a year ago. Area was also lower in Michigan, the second-leading State with 13 percent of acreage. Like North Dakota, Michigan has experienced a cooler-than-normal summer punctuated by early heavy rain (drowning out some acres and forcing replanting) and periods of excessive dryness. Reported growing degree days this season are below normal in most major dry bean States, with the exception of those in the Pacific Northwest. Dry bean production in 2009 is expected to be higher in 11 of the 18 surveyed States. However, most of the reduction is expected to be concentrated in the 4 top producing States. Lower acreage is the primary reason for reduced production in North Dakota, Minnesota, Nebraska, and Michigan. The most notable reduction in output is expected in North Dakota, which has experienced erratic weather this year. While North Dakota could see a 21-percent reduction in dry bean production, estimates also point to a 16-percent decline in neighboring Minnesota for reasons similar to those in North Dakota. The first estimate of planted area by bean class was also released in August (table 17). Double digit acreage reductions were indicated for 5 bean classes including Great Northern and navy beans. With good export demand, dwindling stocks, and attractive prices, increased area was indicated for baby lima, pinto, and black beans. Although it is likely that production will decline for cranberry, navy, and Great Northern beans and rise for baby limas and blackeyes, yield will be the primary determinant in the directional change for most of the remaining classes in 2009. USDA will release the first official estimate of production by class in the December 10 Crop Production report. Table 17--U.S. dry beans: Area planted by class, 2006-09
Percent Item 2006 2007 2008 p 2009 p change
--1,000 acres -- PercentPinto 684.9 694.2 629.3 656.3 4.3Navy 280.7 221.9 250.6 196.0 -21.8Black 167.4 175.7 171.9 179.4 4.4Large chickpeas 1/ 119.4 114.1 71.8 75.1 4.6Light red kidney 44.4 47.4 56.3 56.0 -0.5Great Northern 69.7 59.5 76.1 56.7 -25.5Dark red kidney 48.8 40.2 50.8 46.4 -8.7Small red 35.5 30.6 42.3 36.5 -13.7Pink 45.3 30.8 30.6 25.5 -16.7Blackeye 31.4 27.8 29.3 40.5 38.2Baby lima 13.5 16.0 11.7 14.6 24.8Large lima 12.9 13.9 15.5 14.3 -7.7Cranberry 9.8 8.6 9.1 6.5 -28.6Others 2/ 59.1 46.7 49.7 77.3 55.5United States 1,622.8 1,527.4 1,495.0 1,481.1 -0.9p = NASS preliminary August estimate. 1/ Excludes small chickpeas. 2/ Includes small chickpeas, small w hite, and other miscellanous classes.Source: USDA, National Agricultural Statistics Service, Crop Production.

21 Vegetables and Melons Outlook/VGS-334/August 29, 2009
Economic Research Service, USDA
1215182124273033363942
Sep06 Mar07 Sep07 Mar08 Sep08 Mar09Month and year
Figure 7U.S. dry beans, all: Average monthly grower prices, 2006/07-08/09$/100-lb bag
Source: USDA, NASS, Agricultural Prices . Prices Decline But Will Remain Above Average in 2009/10 Despite prospects for reduced supplies in the year ahead, continued sluggish foodservice demand, potentially slower export movement, and a general easing of field crop prices will likely place downward pressure on dry bean prices in 2010. As a result, prices for most classes of dry beans are expected to average below the very strong levels of 2008/09. Although below the preliminary $37.70/cwt of 2008/09, the U.S. season-average dry bean price across all classes is likely to range between the average of the past five years ($26.50/cwt) and the historically strong 2007/08 average of $28.80/cwt. During the first 11 months of 2008/09, unweighted grower prices across all classes of dry beans averaged $33.35—9 percent above a year ago. With the exception of Michigan, grower prices averaged above a year earlier in every major dry bean State. In North Dakota, prices averaged just 4 percent above the strong levels of a year earlier. North Dakota dry bean prices peaked in September at the start of the marketing year and reached a low point in May of 2009 before turning up again with reports of weather-related planting difficulties. Preliminary data indicate the largest year-over-year price rise among major states in 2008/09 was in California, which realized a 36-percent gain in grower prices over the previous season. During July, the preliminary estimate of the Producer Price Index for canned dry beans averaged 6 percent above a year earlier. This compares with a 6-percent gain a year ago and no change 2 years ago. However, retail prices for dry packaged beans have behaved much differently over the past few years. Reflecting higher dealer prices this season, the July U.S. retail price for dry packaged beans averaged $1.42 per pound—down slightly from June but up 16 percent from a year earlier, 46 percent above 2 years ago, and 70 percent above 3 years earlier. Export Volume Up 14 Percent Given relatively high dry bean prices, dwindling supplies, and strong food aid demand through the first 10 months of 2008/09 (September-June), the volume of dry bean exports increased 14 percent from a year earlier. Through June, U.S. dry

22 Vegetables and Melons Outlook/VGS-334/August 29, 2009
Economic Research Service, USDA
bean exports to Japan remained weak as the volume of baby limas, the top export to that country, was down 40 percent from the previous year and 49 percent below 2 years ago. Competition with other exporters, high U.S. prices, the weak Japanese economy, and limited U.S. stocks reduced exports of U.S. baby limas to Japan to near the 20-year low reached in 2004/05. The U.S. average baby lima export unit value on volume sent to Japan was 41 cents per pound—up 7 percent from a year earlier and the highest of the past 20 years. Sales volume to Mexico doubled to 2.9 million cwt—the largest since 1990/91. If exports to Mexico (which has been experiencing drought this year) during July and August exceed 22 million pounds, the 2008/09 seasonal total shipped to Mexico will top the 3.12 million shipped in 1997/98. It would also be the largest volume exported to that country since the record 9.82 million cwt shipped in 1981/82. Black beans (54 percent of the total) and pinto beans (32 percent) continue to be the primary classes shipped to Mexico, with each continuing to post their largest export volumes in many years. Meanwhile, among the other top 3 export markets, navy bean shipments were the driving force behind increased exports to both Canada and the United Kingdom (U.K.). Navy beans accounted for 62 percent of all the dry beans shipped to Canada and 90 percent of the exports to the U.K. During 2010, the pace of U.S. exports is expected to slow with the more limited supplies of several classes being directed toward short domestic markets. As a result, the export share of supply is expected to decline. Table 18--U.S. dry beans: Crop year export volume to date
Crop year September - June Change Item 2007/08 2006/07 2007/08 2008/09 2007-08
---------------------------- 1,000 cwt -------------------------- Percent Pinto 2,204 1,602 1,734 2,566 48 Navy 1,532 1,065 1,348 1,427 6 Black 980 909 782 1,886 141 Garbanzo 515 391 471 285 -39 Great Northern 766 341 719 420 -42 Baby lima 248 235 209 129 -38 Light red kidney 185 169 161 141 -13 Dark red kidney 267 124 255 105 -59 Cranberry 97 93 80 52 -34 Large lima 74 96 72 88 22 Small red 73 78 70 76 8 Mung & urd 27 26 19 39 106 Blackeye 22 15 20 19 -4 Pink 56 15 55 21 -63 Other 1,146 548 951 686 -28 Total 8,191 5,707 6,946 7,940 14
Source: Compiled by ERS from data of the U.S. Department of Commerce, U.S. Census Bureau.
Table 19--U.S. dry beans: Crop year import volume to dateCrop year September - June Change
Item 2007/08 2006/07 2007/08 2008/09 2007-08 ---------------------------- 1,000 cwt -------------------------- Percent
Garbanzo, all 363 240 305 358 18 Mung & urd 343 293 294 312 6 Black 473 410 392 220 -44 Pinto 305 75 239 184 -23 Other 1,736 1,308 1,425 1,295 -9
Total 3,220 2,326 2,654 2,370 -11
Source: Compiled by ERS from data of the U.S. Department of Commerce, U.S. Census Bureau.

Dry Peas and Lentils
23 Vegetables and Melons Outlook/VGS-334/August 27, 2009
Economic Research Service, USDA
Area and Production Expected To Rise U.S. dry pea and lentil harvested acreage is forecast to increase 13 percent from a year earlier to 1.27 million acres (table 20). The greatest increase is expected to occur in small chickpeas (up 132 percent) and lentils (up 52 percent) in part because lentil stocks were lower and prices for both crops were strong relative to competing crops this past spring. July dry pea and lentil grower prices averaged below those of a year earlier with dry peas running 31 percent below the strong 2008 levels. For all lentils, grower prices are expected to decline in the coming year given larger world supplies, including greater U.S. and Canadian output. Mirroring Canadian and world lentil supplies, June 1 stocks were down 18 percent from a year earlier and were low relative to those of the past 4 years. With limited availability of old crop lentils, prices through July had not dipped much below the unusually strong 2008 levels. However, with increasing availability of the new crop, grower bids for number one Brewer lentils in the Pacific Northwest began to reflect the larger supply, dipping $6 per cwt to $25.50 by mid-August. With acreage up and average or better yields expected (compared with the below-average yields of last year), U.S. lentil production is expected to rise at least 70 percent from the Table 20--Dry peas and lentils: Harvested area 1/
Change Item 2006 2007 2008 2009 f 2008-09 2/
-------------------- 1,000 acres ------------------- Percent
Dry peas 884.1 811.3 847.3 840.9 -1Austrian winter peas 22.5 11.0 8.0 9.7 21Lentils, all 407.0 295.0 263.0 399.0 52Small chickpeas 1/ 16.3 10.8 9.3 21.6 132Large chickpeas 1/ 116.6 110.5 71.2 72.8 2
Total 1,329.9 1,128.1 1,127.6 1,271.2 13
f = NASS forecast. 1/ ERS forecast for 2009 based on NASS area planted.
Source: USDA, National Agricultural Statistics Service, Crop Production .
0
1
2
3
4
5
6
1990 92 94 96 98 2000 02 04 06 080
10
20
30
40 Production Average farm price
Figure 8U.S. lentils: Production & average farm price, 1990-2009Million cwt Cents per pound
Sources: USDA, NASS, Crop Production and Crop Values. ERS forecast for 2009.

24 Vegetables and Melons Outlook/VGS-334/August 27, 2009
Economic Research Service, USDA
small 2008 crop of 2.41 million cwt. Barring harvest problems in North Dakota or Canada in the coming weeks, higher Canadian and world supplies are expected to keep lentil prices below the highs of the previous marketing year. The first U.S. production estimate for 2009 dry peas and lentils will be released in the November 10 Crop Production report. Export Volume Down, Value Record High During the 2008/09 marketing year (July-June), U.S. export volume for dry peas and lentils (including planting seed) declined 19 percent to 12.5 million cwt. But because of higher prices, export value hit a record $295 million. With the exception of split peas and planting seed, volume was lower for every product class. For the fourth consecutive year, India purchased a substantial volume of dry peas (largely green and yellow peas) from the United States. India accounted for 17 percent of 2008/09 U.S. dry pea and lentil export volume—down from 28 percent a year earlier. Rounding out the top three foreign destinations in 2008/09 were Spain (8 percent of the total) and Saudi Arabia (7 percent). Table 21--U.S. dry peas and lentils: Monthly grower prices by class Crop year & 2008 2009
month May June July May June July------------------------------------- Cents/pound ---------------------------------
Dry peas 16.70 17.20 15.90 12.10 11.00 10.90 Lentils 30.20 30.00 33.60 30.10 31.40 30.50
-- = not available. 1/ Prices for July 2009 are mid-month averages. Source: USDA, National Agricultural Statistics Service, Agricultural Prices. Table 22--U.S. dry peas & lentils: Foreign trade volume by class
July-June Change Item 2005/06 2006/07 2007/08 2008/09 2007-08
----------------------------- 1,000 cwt --------------------------- PercentExports: Green peas 3,277.2 3,711.3 4,171.1 3,456.1 -17 Yellow peas 2,626.7 3,547.2 4,497.7 3,491.1 -22 Split peas 195.5 380.7 707.4 803.8 14 Austrian winter pea 30.5 49.8 33.0 10.2 -69 Misc. dry peas 2,588.5 1,126.1 2,031.8 884.8 -56 Chickpeas, all 391.1 413.3 535.1 329.5 -38 Lentils, all 3,495.4 2,332.8 2,751.2 2,710.5 -1 Planting seed, all 881.7 918.9 697.1 768.3 10 Total 1/ 13,486.7 12,480.1 15,424.3 12,454.1 -19Imports: Green peas 209.2 214.2 209.9 204.5 -3 Yellow peas 87.4 87.3 79.8 78.8 -1 Split peas 264.8 344.1 320.5 314.2 -2 Austrian winter 3.2 5.0 1.6 0.3 -84 Misc. dry peas 151.0 170.5 92.3 112.6 22 Chickpeas, all 236.4 292.6 360.0 416.9 16 Lentils, all 260.0 294.7 227.6 359.9 58 Planting seed, all 674.0 438.8 446.5 691.6 55 Total 1/ 1,885.9 1,847.3 1,738.1 2,178.8 25 1/ Includes planting seed.
Source: Compiled by ERS using data from the U.S. Dept. of Commerce, U.S. Census Bureau.

Mushrooms
25 Vegetables and Melons Outlook/VGS-334/August 27, 2009
Economic Research Service, USDA
Sales Volume Up, Value Down The farm value of all mushroom (Agaricus and others) sales during the 2008/09 crop year (July-June), totaled $957 million, down 1 percent from a year earlier. Although total U.S. mushroom sales volume rose 1 percent from a year earlier to 817 million pounds, the volume sold was 6 percent below the 1999/2000 record high. A 1-percent decrease in total area filled with Agaricus mushrooms was more than offset by a 2-percent increase in yield per square foot. In the two top-producing States, Agaricus yield rose 2 percent in Pennsylvania (6.49 pounds per square foot), but jumped 10 percent to 6.03 pounds in California—the highest since the 1994 record (6.16 lbs). Sales volume of fresh-market Agaricus mushrooms declined less than 1 percent to 679 million pounds. This was the third consecutive annual reduction in fresh market volume since reaching a record 705 million pounds in 2005/06. Fresh-market volume accounts for nearly 85 percent of all Agaricus sales. On the processing side, Agaricus volume rose 4 percent from a year earlier to 123 million pounds. Despite the increase, this was the fourth lowest processing output since records began in 1965. Despite sharply reduced imports, the unit value of mushrooms available for processing fell 13 percent to 56.2 cents per pound from the relatively strong levels experienced the past 2 years. Although demand for fresh-market mushrooms remains in the doldrums (as it does for fresh-market vegetables in general), average prices remained steady at last year’s nominal dollar record $1.24 per pound. However, adjusting for inflation, fresh mushroom prices were the second-lowest on record. This is not unusual in the Table 23--U.S. agaricus mushrooms: Sales, price, and value, selected States
Volume of sales Price Value of sales State 2007/08 2008/09 2007/08 2008/09 2007/08 2008/09
1,000 pounds Dollars per pound 1,000 dollars
Pennsylvania 496,721 524,587 0.912 0.881 453,013 461,936California 118,811 123,919 1.596 1.635 189,615 202,599Other States 181,816 153,017 1.512 1.598 274,979 244,543
United States 797,348 801,523 1.151 1.134 917,607 909,078 Source: USDA, National Agricultural Statistics Service, Mushrooms.
Table 24--U.S. brown agaricus & specialty mushrooms: Sales, price, and valueVolume of sales Price Value of sales
State 2007/08 2008/09 2007/08 2008/09 2007/08 2008/091,000 pounds Dollars per pound 1,000 dollars
Brown 1/ 105,246 110,957 1.37 1.40 144,258 155,128
All specialty 15,256 15,451 2.96 3.10 45,149 47,950 Shiitake 9,673 9,416 2.69 3.19 26,049 30,038 Oyster 4,253 5,056 2.88 2.46 12,232 12,442 Other 1,330 979 5.16 5.59 6,868 5,470
Total 120,502 126,408 1.57 1.61 189,407 203,078 1/ Includes Portobello and Crimini.
Source: USDA, National Agricultural Statistics Service, Mushrooms.

26 Vegetables and Melons Outlook/VGS-334/August 27, 2009
Economic Research Service, USDA
100
200
300
400
500
600
700
1980 82 84 86 88 90 92 94 96 98 2000 02 04 06 08 10Crop year 1/
0.400.500.600.700.800.901.001.101.201.30
Production Price
Figure 9U.S. fresh-market Agaricus mushrooms: Sales volume & producer price
Million lb $/pound
1/ Crop year ends with year listed (e.g., 1980 = 1979/80).Source: USDA, National Agricultural Statistics Service, Mushrooms. ERS forecast for 2010.
highly competitive agricultural sector. Continuous efficiency gains have allowed growers to annually produce more on every acre (or square foot), spread rising costs among more units, and keep product prices down. However, compared with average yields in the 1990s (up 29 percent from the average of the 1980s) mushroom yields have not changed greatly this decade (up 5 percent from the 1990s)—averaging just under 6 lbs/sq ft. Over the past 20 years, the average grower price for fresh-market Agaricus mushrooms has risen just 24 percent. If yields do not resume their upward trend and costs continue to rise, it is likely that mushroom prices could increase over the next decade at a greater rate than seen over the past 20 years. Intended Agaricus bed and tray production area (total fillings)for the 2009/10 season is expected to rise less than 1 percent to 135 million square feet. Assuming yields over the next year average around 6 pounds per square foot and the economy begins to turn around, production of all Agaricus mushrooms could increase just under 1 percent to 808 million pounds in 2009/10. Brown Mushroom Volume Up The sales volume of brown Agaricus mushrooms (including Portabello and Crimini) increased in 2008/09 for the second consecutive year, rising 5 percent to 111 million pounds. This was second only to the 2005 record high. These varieties now account for 14 percent of Agaricus sales volume, up from 13 percent a year earlier. The value of brown mushroom sales reached a record high $155 million—up 8 percent from a year earlier. The 26 growers in the East (the same as in the previous 2 years) produced 74 percent of the brown Agaricus mushrooms in 2008/09. The sales volume of specialty mushrooms (excluding brown Agaricus), most of which are sold in the fresh market, rose 1 percent to 15.5 million pounds, with all the gain in Oyster mushrooms (up 19 percent). Volume of Shiitake (the category leader) mushrooms dropped 3 percent to 9.4 million pounds. The sales value of specialty mushrooms rose 6 percent to $48 million. Reflecting the weak economy, the volume of mushrooms sold as certified organic declined 9 percent to 12 million pounds in 2008/09. Only 29 percent of all the

27 Vegetables and Melons Outlook/VGS-334/August 27, 2009
Economic Research Service, USDA
mushrooms certified organic, were actually sold as organic mushrooms. Most were sold without the certified organic label. Specialty (non-Agaricus) mushrooms accounted for 11 percent of certified organic sales, with the remainder Agaricus. The share of mushroom sales volume consisting of certified organic products increased to 1 percent in 2008/09. Per Capita Use Declines In line with flat production and recession-strapped consumers, per capita disappearance (use) of all mushrooms decreased 7 percent to 3.61 pounds in 2008/09. This was down 11 percent from a decade earlier and the smallest per capita domestic disappearance since 1989. In a similar fashion, 2008 per capita mushroom consumption in Canada was 17 percent lower than a decade earlier, with processed use down 20 percent and fresh use 15 percent lower. In the United States, fresh-market per capita disappearance slipped 1 percent from a year earlier to 2.43 pounds (fig. 10), while processing disappearance plummeted 17 percent to 1.18 pounds—the lowest since 1971. According to data provided by the U.S. Census Bureau, imports of processed mushrooms dropped 24 percent to a fresh-weight equivalent of 254 million pounds in 2008/09. Since domestic mushrooms used for processing only rose 4 percent, processors likely drew down inventories. However, since changes in stocks held by the industry are not available, indicated domestic use fell 17 percent to a fresh-equivalent 361 million pounds—the lowest total domestic use since 1982. In the year ahead, assuming continued minor changes in trade volume, a modest increase in specialty mushroom volume, and marginal improvements in the general economy, per capita use of all mushrooms is expected to rise to around 3.7 pounds. Per capita net domestic disappearance of fresh-market mushrooms is expected to remain steady, while disappearance of processing mushrooms recovers from the lows of the previous season.
0.0
0.5
1.0
1.5
2.0
2.5
3.0
1970 73 76 79 82 85 88 91 94 97 2000 03 06 09
Fresh-market Processing
Figure 10U.S. mushrooms: Per capita net domestic disappearance, 1970-2010Lbs/person
Source: Calculated by USDA, ERS.

Herbs and Spices
28 Vegetables and Melons Outlook/VGS-334/August 27, 2009
Economic Research Service, USDA
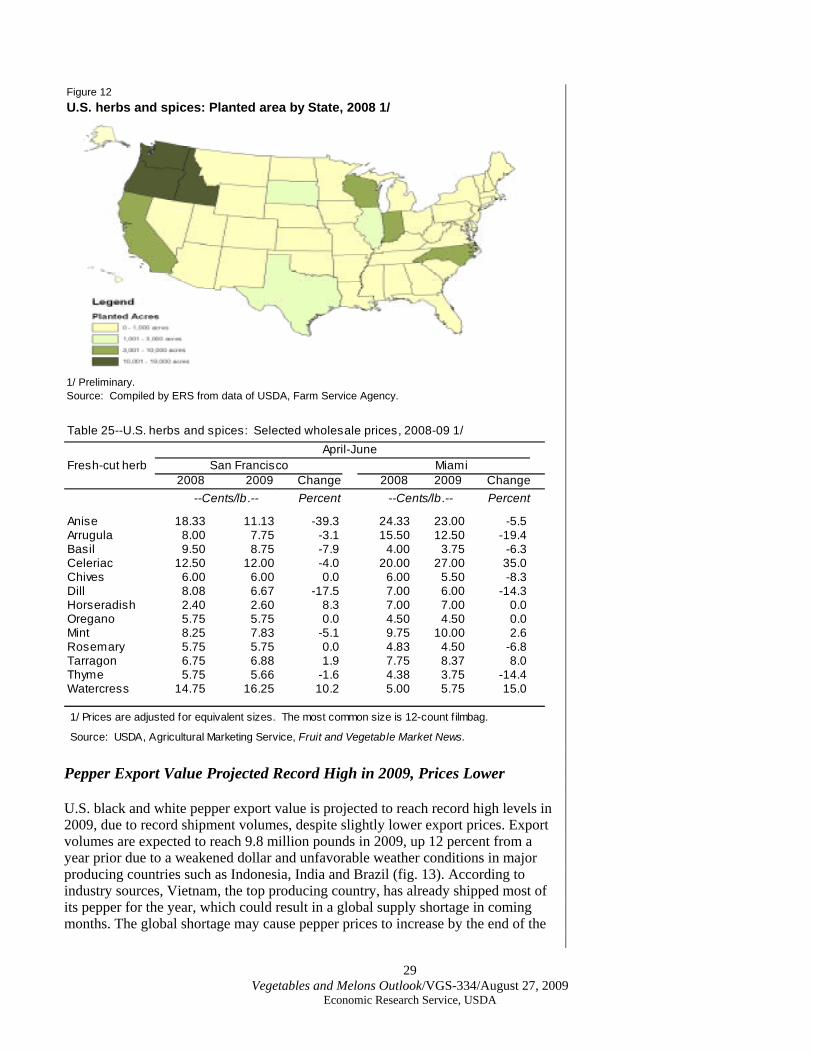
Lower Expected Acreage in 2008 The weak economy, sluggish foodservice demand, and overall lower discretionary spending has led to reduced consumption and declining harvested acreage and stocks of fresh and dried herbs and spices. According to USDA, Farm Service Agency (FSA), 111,000 acres of herbs and spices were grown in 2007, a 10 percent decline from 2006 (fig. 11). Economic Research Service estimates 80,000 acres of herbs and spices will be grown in 2008, a 27-percent decline from the previous year. According to FSA, Oregon (24 percent), Idaho (17 percent) and Washington (17 percent) were the top herb and spice producers in 2008, comprising over half of domestic planted acres (fig. 12). The decline in herb and spice acreage is due mainly to declines of spearmint and peppermint harvested acres in the major producing States. According to the National Agricultural Statistical Service, peppermint, the largest domestically-harvested herb, declined to 60,000 harvested acres in 2008, down 6 percent from the previous year and the lowest since 1974. Wholesale Prices Down in 2009 Through June 2009, wholesale prices for selected herbs and spices were 3 percent lower than a year earlier (table 25). Price movement varied by herb-type and was more extensive in San Francisco, where herbs are increasingly sourced from within California for the fresh market. In the Miami market, herbs and spices are increasingly drawn from imports. In the San Francisco terminal market, lower arugula, basil, and dill prices originated from a decline in consumer demand for luxury food items, such as fresh culinary herbs during the first half of 2009. In Miami, thyme, rosemary, basil, dill, and chive prices have declined due to increased imports from Columbia. Alternatively, watercress prices have exhibited price gains this year due to high quality and new hydroponic greenhouse varieties. In all, further wholesale price declines are expected throughout 2009, due to the impact of a weak economy on specialty food demand and declining demand for herbs used in manufacturing.
0
20
40
60
80
100
120
2001 2002 2003 2004 2005 2006 2007 2008
Spearmint Peppermint Other
Figure 11U.S. herbs and spices: Planted area by type, 2001-08 1/1,000 acres
1/ Data for 2008 are preliminary.Source: Compiled by ERS from data of USDA, Farm Service Agency.
29 Vegetables and Melons Outlook/VGS-334/August 27, 2009
Economic Research Service, USDA
Figure 12U.S. herbs and spices: Planted area by State, 2008 1/
1/ Preliminary.Source: Compiled by ERS from data of USDA, Farm Service Agency.
Table 25--U.S. herbs and spices: Selected wholesale prices, 2008-09 1/
April-JuneFresh-cut herb San Francisco Miami
2008 2009 Change 2008 2009 Change --Cents/lb .-- Percent --Cents/lb .-- Percent
Anise 18.33 11.13 -39.3 24.33 23.00 -5.5Arrugula 8.00 7.75 -3.1 15.50 12.50 -19.4Basil 9.50 8.75 -7.9 4.00 3.75 -6.3Celeriac 12.50 12.00 -4.0 20.00 27.00 35.0Chives 6.00 6.00 0.0 6.00 5.50 -8.3Dill 8.08 6.67 -17.5 7.00 6.00 -14.3Horseradish 2.40 2.60 8.3 7.00 7.00 0.0Oregano 5.75 5.75 0.0 4.50 4.50 0.0Mint 8.25 7.83 -5.1 9.75 10.00 2.6Rosemary 5.75 5.75 0.0 4.83 4.50 -6.8Tarragon 6.75 6.88 1.9 7.75 8.37 8.0Thyme 5.75 5.66 -1.6 4.38 3.75 -14.4Watercress 14.75 16.25 10.2 5.00 5.75 15.0
1/ Prices are adjusted for equivalent sizes. The most common size is 12-count f ilmbag.
Source: USDA, Agricultural Marketing Service, Fruit and Vegetable Market News. Pepper Export Value Projected Record High in 2009, Prices Lower U.S. black and white pepper export value is projected to reach record high levels in 2009, due to record shipment volumes, despite slightly lower export prices. Export volumes are expected to reach 9.8 million pounds in 2009, up 12 percent from a year prior due to a weakened dollar and unfavorable weather conditions in major producing countries such as Indonesia, India and Brazil (fig. 13). According to industry sources, Vietnam, the top producing country, has already shipped most of its pepper for the year, which could result in a global supply shortage in coming months. The global shortage may cause pepper prices to increase by the end of the

30 Vegetables and Melons Outlook/VGS-334/August 27, 2009
Economic Research Service, USDA
0
2
4
6
8
10
1999 2001 2003 2005 2007 20090.00
0.50
1.00
1.50
2.00
2.50Volume Export unit value
Figure 13White and black pepper: U.S. export volume and unit value, 1999-2009Million lbs $/lb
1/ Data for 2009 are prelminary.Sources: Compiled by ERS from data of U.S. Dept. of Commerce, U.S. Census Bureau.
year, pushing U.S. export prices and values higher. Canada is the leading foreign source for U.S. pepper, accounting for 62 percent of volume shipped in January-June 2009. Spice Trade Volume Slightly Lower in 2009 Due to reduced production, total exports of herbs and spices are expected to decrease in coming months, while shipment of certain spices is expected to increase. During the first six months of 2009 (January-June), total herb and spice export volume was running just 1-percent behind the previous year (table 26). Export volume was reduced for commodities such as vanilla beans, fennel, coriander seeds, and caraway seeds. Some spices such as capsicum and cinnamon were up over 10 percent from a year earlier, while others like ginger, pepper, thyme, and bay leaves were up more than 30 percent from the previous year. During January-June, total export volume to Canada and Mexico was up 6 and 83 percent, respectively, but is expected to drop in coming months due to tight domestic supplies. Because of slightly higher prices, the value of herb and spice exports during the first half of the year was up 6 percent from a year ago and is expected to remain above the previous year. During January-June, total herb and spice import volume was down 3 percent from a year earlier, while lower prices caused import value to fall 11 percent. Most of the loss in import value was due to decreased shipments from Indonesia, the leading supplier of herbs and spices in value terms in 2008. Increases in volume for mint leaves, capsicum peppers, and cinnamon were outweighed by decreased volume for spices such as black and white pepper, originum, curry, thyme, and bay leaves. In terms of value, the leading foreign suppliers of herbs and spices during January-June 2009 included Southeast Asia (20 percent), India (15 percent), and China (11 percent). By volume, the leading suppliers included China (22 percent), Southeast Asia (21 percent) and Mexico (13 percent) (fig. 14). The volume of imports from

31 Vegetables and Melons Outlook/VGS-334/August 27, 2009
Economic Research Service, USDA
three of the top five foreign suppliers (China, Mexico, Peru) increased, while volume from India and Indonesia declined from the first half of 2008. Table 26--Herbs and spices: Selected U.S. trade volume for January-June, 2007-09
2008 January - June Change Item annual 2007 2008 2009 2008-09
-------------------------- 1,000 pounds ------------------------ PercentImportsGinger 1/ 93,575 40,144 44,646 45,192 1Black and white pepper 2/ 142,834 67,373 70,932 64,852 -9Capsicum 3/ 226,168 95,853 102,784 110,994 8Cinnamon 4/ 48,476 26,677 23,643 25,277 7Basil, fresh or dried 5/ 15,900 9,705 7,949 8,007 1Thyme and bay leaves, fresh 6/ 8,184 4,080 5,030 2,992 -41Others 7/ 124,863 57,929 64,865 53,474 -18Total herbs and spices 660,000 301,761 319,849 310,788 -3
ExportsGinger 1/ 963 625 384 546 42Black and white pepper 2/ 8,729 4,122 4,273 5,737 34Capsicum 3/ 3,590 2,527 1,984 2,207 11Cinnamon 4/ 2,207 1,030 892 1,072 20Thyme and bay leaves, fresh 6/ 507 244 111 307 177Others 7/ 90,572 40,671 48,575 45,561 -6
Total herbs and spices 106,568 49,219 56,219 55,430 -1
3/ Includes paprika, bell and jalapeno peppers 4/ Includes crushed and w hole f low ers. 5/ Includescrushed or pow dered. 6/ Includes crude fennel, majoram, savory & tarragon. 7/ Includes seedsof anise, carraw ay, and corriander, plus cardamons, ginseng, and misc. spices and herbs.
Source: Prepared by ERS from data of the U.S. Department of Commerce, U.S. Census Bureau.
1/ Includes ginger ground and not ground 2/ Includes w hole, crushed, and ground pepper
South America South America
Mexico Mexico
Southeast Asia Southeast Asia
India India
China China
Rest of World Rest of World
0%
20%
40%
60%
80%
100%
Value Volume
Figure 14Herbs & spices: U.S. import shares by supplier, Jan.-June 2009 Share
EU-27
Source: Compiled by ERS using data of U.S. Dept. of Commerce, U.S. Census Bureau.
Africa

Contacts and Links
32 Vegetables and Melons Outlook/VGS-334/August 27, 2009
Economic Research Service, USDA
Articles The following are links to articles released on subjects directly related to the vegetable and melon industry. These articles are in Adobe Acrobat (.pdf) format: 1. Younger Consumers Exhibit Less Demand for Fresh Vegetables http://www.ers.usda.gov/Publications/vgs/2009/08Aug/vgs33301/ This report identifies how a household’s spending on fresh vegetables for at-home consumption may depend on the head of household’s birth cohort, with younger consumers exhibiting less demand for fresh vegetables than older consumers. 2. Supermarket Loss Estimates for Fresh Fruit, Vegetables, Meat, Poultry, and Seafood and Their Use in the ERS Loss-Adjusted Food Availability Data http://www.ers.usda.gov/Publications/EIB44/ Analyzes updated food loss estimates. The new data for fresh vegetables would increase annual per capita estimates at the retail level by 4.2 pounds (2.7 percent). 3. Emerging Issues in the U.S. Organic Industry http://www.ers.usda.gov/Publications/EIB55/ This report examines recent economic research on the adoption of organic farming systems, organic production costs and returns, and market conditions to gain a better understanding of the organic supply squeeze and other emerging issues in this rapidly changing industry. 4. Production Expenses of Specialized Vegetable and Melon Farms http://www.ers.usda.gov/publications/vgs/2008/09Sep/vgs32801/ Using data from USDA’s Agricultural Resource Management Survey (ARMS), this article presents and explores the major expense components of specialized U.S. and regional vegetable and melon farms during 1998-2006. Labor accounted for 30 percent of cash expenses, followed by fertilizer and chemicals at 18 percent.
Contact Information Gary Lucier Tel: (202) 694-5253 Fax: (202) 694-5820 Email: [email protected] Michelle Da Pra Tel: (202) 694-5262 Fax: (202) 694-5820 Email: [email protected] Covers fresh & dried herbs, spices, organics, and direct marketing. Subscription Information Subscribe to ERS’ e-mail notification service http://www.ers.usda.gov/updates/ to receive timely notification of newsletter availability. Printed copies may be purchased from the USDA Order Desk by calling 1-800-999-6779 (specify the issue number or series SUB-VGS-4039).
E-mail Notification Readers of ERS outlook reports have two ways they can receive an e-mail notice about release of reports and associated data. • Receive timely notification (soon after the report is posted on the web) via USDA’s Economics, Statistics and Market Information System (which is housed at Cornell University’s Mann Library). Go to http://usda.mannlib.cornell.edu/ MannUsda/aboutEmailService.do and follow the instructions to receive e-mail notices about ERS, Agricultural Marketing Service, National Agricultural Statistics Service, and World Agricultural Outlook Board products. • Receive weekly notification (on Friday afternoon) via the ERS website. Go to http://www.ers.usda.gov/Updates/ and follow the instructions to receive notices about ERS outlook reports, Amber Waves magazine, and other reports and data products on specific topics. ERS also offers RSS (really simple syndication) feeds for all ERS products. Go to http://www.ers.usda.gov/rss/ to get started.
33 Vegetables and Melons Outlook/VGS-334/August 27, 2009
Economic Research Service, USDA
5. Canned Fruit and Vegetable Consumption in the United States http://www.ers.usda.gov/publications/ap/ap032/DBGen.htm Examines consumer perceptions and consumption of canned fruits and vegetables. If current trends prevail, total fruit and vegetable availability will continue to rise, but canned fruits and vegetables will account for a declining share of that total. Data Tables The following links provide the most recent data on vegetables and melons. You may choose links for Adobe Acrobat (.pdf) table compilations or the original Excel workbook (spreadsheet) tables: 1. Per capita availability (a.k.a. domestic use or consumption) PDF file: http://www.ers.usda.gov/publications/vgs/tables/percap.pdf Excel file: http://www.ers.usda.gov/publications/vgs/tables/percap.xls 2. Vegetable prices PDF file: http://www.ers.usda.gov/publications/vgs/tables/price.pdf Excel file: http://www.ers.usda.gov/publications/vgs/tables/price.xls 3. Fresh vegetables and melons PDF file: http://www.ers.usda.gov/publications/vgs/tables/fresh.pdf Excel file: http://www.ers.usda.gov/publications/vgs/tables/fresh.xls 4. Processing vegetables PDF file: http://www.ers.usda.gov/publications/vgs/tables/proc.pdf Excel file: http://www.ers.usda.gov/publications/vgs/tables/proc.xls 5. Potatoes PDF file: http://www.ers.usda.gov/publications/vgs/tables/potat.pdf Excel file: http://www.ers.usda.gov/publications/vgs/tables/potat.xls 6. Sweet potatoes PDF file: http://www.ers.usda.gov/publications/vgs/tables/swpot.pdf Excel file: http://www.ers.usda.gov/publications/vgs/tables/swpot.xls 7. Dry edible beans PDF file: http://www.ers.usda.gov/publications/vgs/tables/drybn.pdf Excel file: http://www.ers.usda.gov/publications/vgs/tables/drybn.xls 8. Mushrooms PDF file: http://www.ers.usda.gov/publications/vgs/tables/mush.pdf Excel file: http://www.ers.usda.gov/publications/vgs/tables/mush.xls 9. Vegetable and melon trade PDF file: http://www.ers.usda.gov/publications/vgs/tables/trade.pdf Excel file: http://www.ers.usda.gov/publications/vgs/tables/trade.xls 10. Dry peas and lentils PDF file: http://www.ers.usda.gov/publications/vgs/tables/drypea.pdf Excel file: http://www.ers.usda.gov/publications/vgs/tables/drypea.xls 11. World vegetable production and harvested area PDF file: http://www.ers.usda.gov/publications/vgs/tables/world.pdf Excel file: http://www.ers.usda.gov/publications/vgs/tables/world.xls

34 Vegetables and Melons Outlook/VGS-334/August 27, 2009
Economic Research Service, USDA
12. Mexican and Canadian vegetable production PDF file: http://www.ers.usda.gov/publications/vgs/tables/Mexcan.pdf Excel file: http://www.ers.usda.gov/publications/vgs/tables/Mexcan.xls 13. U.S. farm cash receipts and cost indicators PDF file: http://www.ers.usda.gov/publications/vgs/tables/Receipt.pdf Excel file: http://www.ers.usda.gov/publications/vgs/tables/Receipt.xls Web Sites A. U.S. Trade Data—FASonline: This relatively simple, yet powerful online application allows the user to freely access and download detailed U.S. export and import data. http://www.fas.usda.gov/ustrade/ B. Vegetables and Melons: ERS’ Vegetables and Melons Briefing Room contains special articles, data sets, and links (the tomato background page is found here). http://www.ers.usda.gov/briefing/vegetables/ C. Potatoes: ERS’ Potato Briefing Room contains special articles, data, and links. http://www.ers.usda.gov/briefing/potatoes/ D. Dry Beans, Peas, and Lentils: ERS’ Dry Bean Briefing Room contains special articles, data, and links. http://www.ers.usda.gov/briefing/drybeans/ E. USDA Market News: Agricultural Marketing Service’s web site containing fresh shipments, f.o.b. and terminal market prices, weekly truck rates, annual reports, and more. http://www.marketnews.usda.gov/portal/fv F. NASS Vegetables: Links to USDA, National Agricultural Statistics Service’s annual and quarterly reports on vegetables & melons. http://usda.mannlib.cornell.edu/MannUsda/viewDocumentInfo.do?documentID=1177 G. Refrigerated Truck Quarterly: USDA, Agricultural Marketing Service’s quarterly newsletter detailing refrigerated truck movement, rates, and issues. http://www.ams.usda.gov/AMSv1.0/getfile?dDocName=STELPRDC5069457&acct=atgeninfo I. Organic Farming and Marketing: USDA, ERS Briefing Room contains articles, data, graphics, and links. http://www.ers.usda.gov/Briefing/Organic/ J. FAS Fruit and Vegetable Page: USDA, Foreign Agricultural Services page with special articles, country horticultural reports, presentation and charts, data, and links. http://www.fas.usda.gov/htp/fruit_veg.asp
The U.S. Department of Agriculture (USDA) prohibits discrimination in all its programs and activities on the basis of race, color, national origin, age, disability, and, where applicable, sex, marital status, familial status, parental status, religion, sexual orientation, genetic information, political beliefs, reprisal, or because all or a part of an individual’s income is derived from any public assistance program. (Not all prohibited bases apply to all programs.) Persons with disabilities who require alternative means for communication of program information (Braille, large print, audiotape, etc.) should contact USDA’s TARGET Center at (202) 720-2600 (voice and TDD). To file a complaint of discrimination write to USDA, Director, Office of Civil Rights, 1400 Independence Avenue, S.W., Washington, D.C. 20250-9410 or call (800) 795-3272 (voice) or (202) 720-6382 (TDD). USDA is an equal opportunity provider and employer.

Price table 1—Commercial vegetables and potatoes: Indexes of prices received by U.S. growers, by month, 1997-2009 1/ Item Year Jan. Feb. Mar. Apr. May June July Aug. Sep. Oct. Nov. Dec. Annual
----------------------------------------------------------- 1910-14=100 --------------------------------------------------------------
Commercial 1997 740 700 789 754 710 751 747 817 794 971 817 911 792 vegetables 2/ 1998 816 775 837 1,042 859 736 806 764 760 886 756 779 818
1999 702 749 806 870 786 732 696 709 700 650 654 776 7362000 656 572 719 907 874 785 795 862 958 835 964 768 8082001 810 980 923 916 964 805 837 968 894 688 731 1,144 8882002 1,054 1,283 1,816 803 770 731 771 807 795 704 735 743 9182003 786 797 880 924 988 1,084 852 983 1,030 1,025 1,283 1,132 9802004 911 1,000 792 906 771 761 713 910 924 1,109 1,128 847 8982005 663 839 1,176 1,296 962 987 801 843 908 808 811 1,088 9322006 914 822 951 1,077 1,111 937 849 1,088 1,140 882 848 1,071 9742007 1,268 1,179 1,375 1,294 1,030 948 897 1,047 1,111 1,403 994 988 1,1282008 983 846 958 1,155 1,099 1,091 1,030 1,025 1,245 1,274 1,098 1,107 1,0762009 1,237 972 1,085 1,265 1,038 1,165 1,056
Potatoes 3/ 1997 426 431 433 433 477 431 499 544 440 433 457 477 4571998 491 524 554 546 559 539 517 481 449 415 450 475 5001999 489 497 520 546 532 557 610 517 451 429 474 463 5072000 475 496 519 545 529 511 559 464 406 384 383 395 4722001 409 450 437 466 453 486 532 632 516 461 538 578 4972002 620 645 715 699 748 806 884 651 520 466 524 547 6522003 534 555 568 593 591 560 571 484 458 443 479 494 5282004 488 504 531 569 559 559 552 496 486 444 477 507 5142005 535 536 578 567 577 573 623 575 492 473 540 579 5542006 597 572 706 700 662 703 809 653 527 500 579 601 6342007 620 649 689 746 685 666 741 601 533 525 596 630 6402008 655 680 744 756 815 932 1,057 989 805 709 801 851 8162009 843 776 814 853 837 822 843
1990-92=100
Commercial 1997 111 105 118 113 106 112 112 122 119 145 122 136 118 vegetables 2/ 1998 122 116 125 156 129 110 121 114 114 133 113 117 123
1999 105 112 121 130 118 110 104 106 105 97 98 116 1102000 98 86 108 136 131 117 119 129 143 125 144 115 1212001 121 147 138 137 144 120 125 145 134 103 109 171 1332002 158 192 272 120 115 109 115 121 119 105 110 104 1372003 110 112 123 129 138 152 119 138 144 143 180 158 1372004 127 140 111 127 108 107 100 127 129 155 158 119 1262005 93 117 165 181 135 138 112 118 127 113 113 152 1302006 128 115 133 151 156 131 119 152 160 123 119 150 1362007 177 165 192 181 144 133 126 147 155 196 139 138 1582008 138 118 134 162 154 153 144 143 174 178 154 155 1512009 173 136 152 177 145 163 148
Potatoes 3/ 1997 84 85 86 85 94 85 99 107 87 85 90 94 901998 97 104 109 108 111 106 102 95 89 82 89 94 991999 97 98 103 108 105 110 121 102 89 85 94 91 1002000 94 98 103 108 105 101 110 92 80 76 76 78 932001 81 89 86 92 90 96 105 125 102 91 106 114 982002 123 127 141 138 148 159 175 129 103 92 104 108 1292003 105 110 112 117 117 110 113 96 90 87 95 97 1042004 96 100 105 112 110 110 109 98 96 88 94 100 1022005 106 106 114 112 114 113 123 113 97 93 106 114 1092006 118 113 139 138 131 139 160 129 104 99 114 119 1252007 122 128 136 147 135 131 146 119 105 104 118 124 1262008 129 134 147 149 161 184 209 195 159 140 158 168 1612009 166 153 161 168 165 162 166
1/ Prices for 2009 are preliminary. 2/ Includes fresh and processing vegetables. 3/ Includes fresh potatoes and dry edible beans. For longer historical price series, see the Vegetables and Melons Situation and Outlook Yearbook data productat: http://usda.mannlib.cornell.edu/MannUsda/viewDocumentInfo.do?documentID=1212
Source: USDA, National Agricultural Statistics Service, Agricultural Prices.
35Vegetables and Melons Outlook /VGS-334/August 27, 2009
Economic Research Service, USDA

Price table 2--Fresh vegetables: U.S. monthly and season-average f.o.b. shipping-point prices, 2005-09 1/Season Prcnt change Prcnt change
Commodity Year Jan. Feb. Mar. Apr. May June July Aug. Sep. Oct. Nov. Dec. average July-July 2nd quarter ----------------------------------------------------------------- Dollars per cwt ------------------------------------------------------------------- Percent Percent
Asparagus 2005 -- -- 88.60 103.00 68.70 73.50 143.00 150.00 162.00 162.00 -- -- 87.40 -- --2006 -- 122.00 133.00 110.00 72.70 94.10 105.00 162.00 122.00 127.00 -- -- 88.90 -26.6 12.92007 -- -- 107.00 106.00 91.90 87.70 -- -- -- -- -- -- 98.90 -- 3.22008 -- -- 107.00 125.00 84.30 81.50 -- -- -- -- -- -- 103.00 -- 1.82009 -- 78.10 81.50 149.00 119.00 87.30 104.00 -- 22.2
Broccoli 2005 22.60 33.30 42.60 39.80 22.40 39.70 22.40 30.50 27.70 22.40 20.40 34.10 28.50 -- --2006 32.50 23.80 27.60 32.40 29.00 51.10 26.20 56.90 39.40 24.60 27.40 52.80 33.70 17.0 10.42007 69.80 25.40 27.60 36.90 26.70 24.80 28.80 38.20 41.80 61.00 38.10 40.70 36.70 9.9 -21.42008 47.90 24.40 30.80 52.10 25.20 29.60 26.70 26.60 41.10 57.50 41.20 33.70 36.10 -7.3 20.92009 44.80 29.50 46.50 42.00 32.80 31.00 25.70 -3.7 -1.0
Cantaloups 2005 -- -- -- -- 22.60 18.10 13.80 10.70 14.90 14.40 15.60 -- 15.90 -- --2006 -- -- -- -- 29.20 18.40 16.00 20.70 10.40 16.10 28.20 -- 17.20 15.9 17.02007 -- -- -- -- 28.20 12.60 12.00 13.30 13.10 30.50 38.50 -- 14.80 -25.0 -14.32008 -- -- -- -- 27.00 16.40 16.10 8.30 17.80 22.60 32.20 -- 19.20 34.2 6.42009 -- -- -- -- 14.80 19.90 13.20 -18.0 -20.0
Carrots 2005 20.30 21.00 21.00 21.10 21.20 21.30 21.80 21.20 21.00 21.10 23.10 22.00 20.90 -- --2006 21.70 21.50 21.50 21.50 20.80 21.40 21.50 22.40 19.30 19.80 20.20 19.10 20.60 -1.4 0.22007 21.00 28.10 28.30 29.60 32.00 25.90 19.70 17.10 16.10 15.80 15.80 16.20 22.10 -8.4 37.42008 16.20 25.90 25.90 25.50 32.00 25.60 25.60 25.60 25.30 25.20 24.70 25.20 24.40 29.9 -5.02009 25.20 25.20 25.20 25.20 25.50 25.80 25.60 0.0 -7.9
Cauliflower 2005 27.60 38.00 50.60 36.70 29.70 38.10 25.60 31.50 28.50 19.70 23.60 44.30 30.30 -- --2006 33.10 24.90 35.60 44.40 27.10 27.90 24.00 28.40 47.10 20.90 34.50 41.70 32.30 -6.3 -4.92007 45.70 29.40 51.40 51.60 24.90 30.00 22.30 27.90 27.20 46.20 26.60 52.40 34.30 -7.1 7.12008 51.80 30.00 41.70 63.80 24.90 53.90 38.20 43.20 29.50 48.50 29.50 43.90 40.30 71.3 33.92009 66.90 30.20 51.30 41.90 46.60 43.50 34.90 -8.6 -7.4
Celery 2005 12.90 22.90 28.40 20.80 15.50 9.62 9.69 9.82 12.00 11.70 13.10 10.70 13.90 -- --2006 9.64 10.80 14.90 16.60 12.70 17.80 21.00 23.20 27.70 27.00 22.00 20.20 18.20 116.7 2.62007 33.90 58.90 31.90 18.80 18.30 11.60 11.60 9.64 13.80 13.30 18.60 13.50 20.40 -44.8 3.42008 16.20 13.20 13.40 14.00 37.40 30.10 22.10 12.40 11.90 17.10 20.20 20.30 16.90 90.5 67.42009 35.10 29.70 15.00 17.40 17.40 11.70 11.70 -47.1 -42.9
Corn, sweet 2005 21.30 28.60 26.10 21.50 18.00 22.50 22.30 20.40 24.70 25.50 25.70 22.40 22.10 -- --2006 35.00 35.00 34.00 27.10 15.40 21.50 21.00 21.70 25.10 21.10 20.70 20.80 23.00 -5.8 3.22007 27.40 23.60 30.20 25.60 21.40 17.30 22.20 22.80 23.20 21.40 20.60 34.10 22.70 5.7 0.52008 30.80 23.00 28.60 20.50 21.90 19.90 28.50 27.20 27.10 23.70 30.80 22.20 25.90 28.4 -3.12009 24.90 46.40 59.30 32.20 22.70 27.10 33.00 15.8 31.6
Cucumbers 2005 20.20 17.20 32.60 29.30 30.70 28.70 15.70 21.10 20.10 23.10 32.60 53.10 23.00 -- --2006 23.90 27.70 40.70 29.40 21.30 24.30 26.80 27.20 22.50 18.50 29.60 27.00 25.30 70.7 -15.42007 30.80 35.30 33.60 21.40 28.50 23.20 18.90 24.60 29.10 25.00 22.00 18.50 24.60 -29.5 -2.52008 38.40 34.70 20.50 24.40 21.90 36.10 19.30 23.70 34.30 28.60 42.40 41.30 24.50 2.1 12.72009 39.10 -- -- 28.60 19.90 23.40 29.80 54.4 -12.7
Head lettuce 2005 11.50 11.70 27.80 30.10 13.90 17.30 11.00 13.50 12.70 12.40 9.81 16.10 15.50 -- --2006 10.60 12.10 19.10 22.40 33.70 11.80 12.20 20.70 16.30 11.80 12.50 22.20 16.90 10.9 10.82007 20.80 15.50 29.70 17.80 13.60 17.80 17.30 23.10 29.20 44.40 17.40 16.00 21.70 41.8 -27.52008 17.60 13.40 14.70 21.60 15.50 17.70 17.30 17.20 31.90 32.90 18.80 23.50 20.00 0.0 11.42009 28.80 17.20 19.60 27.80 18.20 18.90 16.30 -5.8 18.4
Onions, 2005 5.10 4.23 4.44 17.70 19.50 17.80 16.80 11.20 10.50 12.80 11.60 9.45 12.40 -- -- dry bulb 2006 8.53 8.19 7.60 15.20 16.30 17.80 14.90 13.30 12.40 10.40 11.40 16.60 16.10 -11.3 -10.4
2007 22.10 26.20 35.00 55.20 24.20 24.60 15.40 10.80 5.57 4.47 4.70 4.39 11.10 3.4 111.02008 4.13 3.15 2.53 10.60 23.90 17.60 12.20 8.52 10.50 10.80 11.10 13.40 12.70 -20.8 -49.92009 9.05 6.80 6.49 16.40 21.50 22.00 21.40 75.4 15.0
Snap beans 2005 71.40 77.80 85.30 60.70 55.20 38.40 58.90 72.70 65.30 40.80 89.10 82.00 54.20 -- --2006 44.00 56.00 44.90 44.30 34.50 33.40 61.10 77.00 74.60 58.60 48.30 65.50 50.00 3.7 -27.32007 64.90 82.30 102.00 63.50 38.80 35.10 65.10 81.10 78.90 67.40 89.30 43.00 61.20 6.5 22.52008 68.80 98.30 37.70 57.50 37.30 51.20 73.90 70.00 74.80 49.40 47.60 69.20 53.30 13.5 6.32009 37.40 86.20 68.80 39.30 52.70 53.00 72.10 -2.4 -0.7
Tomatoes 2005 15.40 40.90 40.70 65.10 49.40 40.20 28.20 26.20 46.40 36.40 32.80 76.80 41.80 -- --2006 82.70 46.50 24.80 34.40 23.30 30.90 28.20 34.70 82.10 55.30 28.00 21.20 43.70 0.0 -42.72007 35.60 31.20 26.30 52.60 35.60 29.60 26.70 28.60 33.10 41.60 58.70 81.20 34.80 -5.3 33.02008 58.20 45.50 66.10 47.40 48.20 56.80 40.90 29.40 25.60 33.80 64.90 37.90 45.40 53.2 29.42009 29.30 32.70 41.50 45.40 33.20 71.20 34.70 -15.2 -1.7
-- = Not available. 1/ 2009 prices are preliminary. One hundredweight (cwt) is equal to 100 pounds. The prices in this table can also be read as cents per pound.Prices beginning in 2006 are measured at the point of first sale. They are f.o.b. (free on board) shipping point prices in prior years
Source: USDA, National Agricultural Statistics Service, Agricultural Prices.
36Vegetables and Melons Outlook /VGS-334/August 27, 2009
Economic Research Service, USDA

Price table 3—Vegetables: Producer Price Indexes, by month, 1999-2009 1/ Change
Item Year Jan. Feb. Mar. Apr. May June July Aug. Sep. Oct. Nov. Dec. Annual July- July ----------------------------------------------------------------------1982=100 ----------------------------------------------------------------- Percent
Fresh 2/ 1999 131.9 93.1 117.4 144.4 111.3 125.8 103.4 113.7 117.5 101.6 100.9 151.6 117.7 --2000 111.3 100.5 122.3 126.8 152.0 128.1 127.2 136.7 155.9 165.0 173.9 120.3 135.0 23.02001 147.0 168.6 178.7 145.6 144.9 129.4 109.7 127.2 132.3 112.3 105.9 121.0 135.2 -13.82002 146.1 188.7 242.5 101.7 107.2 123.2 127.1 125.4 116.7 126.9 127.4 119.0 137.7 15.92003 147.8 127.5 153.0 167.7 165.0 138.8 133.3 136.6 164.7 156.9 148.4 184.7 152.0 4.92004 143.8 125.9 140.3 133.1 132.9 101.0 102.8 128.3 141.9 200.0 211.1 143.7 142.1 -22.92005 122.0 152.8 168.5 174.7 144.2 160.0 126.8 132.3 153.3 144.0 163.1 200.8 153.5 23.32006 207.6 138.8 137.6 174.4 147.9 128.7 134.1 179.5 193.1 167.7 138.3 178.4 160.5 5.82007 175.3 190.3 222.4 222.5 142.1 145.4 146.0 137.8 162.7 218.3 177.4 204.5 178.7 8.92008 200.2 158.3 194.1 179.3 170.7 191.7 168.3 146.1 158.7 185.1 200.3 155.9 175.7 15.32009 179.8 163.6 167.4 182.3 134.1 182.5 149.8 -11.0
Melons 1999 -- -- -- -- 86.6 62.8 42.4 62.1 -- 63.4 59.1 -- 62.7 --2000 -- -- -- -- 68.0 64.3 56.4 43.8 48.7 93.6 124.2 -- 71.3 33.02001 -- -- -- -- 118.6 53.4 53.3 76.1 57.1 60.0 114.9 -- 76.2 -5.52002 -- -- -- -- -- 74.7 80.5 58.7 60.1 66.2 55.3 -- 65.9 51.02003 -- -- -- -- 120.5 60.6 60.1 35.8 49.0 64.9 106.8 -- 71.1 -25.32004 106.8 141.3 157.3 90.2 95.4 75.1 56.1 66.6 76.6 108.8 114.4 150.6 103.3 -6.72005 156.1 75.4 96.5 162.2 114.8 99.9 83.8 62.3 80.7 67.3 -- -- 99.9 49.42006 -- -- 99.8 99.8 95.6 93.8 70.3 80.2 75.0 76.2 105.1 154.7 95.1 -16.12007 126.2 102.9 96.9 127.6 153.5 74.6 60.0 71.0 87.4 122.9 175.2 165.6 113.7 -14.72008 141.1 140.1 85.8 167.1 140.5 92.6 82.3 78.9 71.3 131.0 121.3 113.8 113.8 37.22009 98.9 101.0 96.2 100.6 121.5 108.0 71.3 -13.4
Canned 3/ 1999 120.6 120.6 120.9 120.9 121.0 121.0 120.8 120.9 120.7 120.7 121.3 121.3 120.9 --2000 121.3 120.8 121.2 120.9 121.2 121.5 121.1 120.9 121.1 121.6 121.7 121.3 121.2 0.22001 121.4 121.4 121.3 121.3 121.4 121.9 124.1 124.9 125.3 126.5 128.0 128.1 123.8 2.52002 128.3 128.2 128.0 128.2 128.3 128.0 127.7 129.4 128.7 129.5 129.1 129.1 128.5 2.92003 128.8 129.0 128.9 129.3 129.4 129.3 129.4 129.1 130.0 130.7 131.1 131.3 129.7 1.32004 131.5 131.7 131.9 131.9 131.7 132.8 133.0 133.3 133.4 134.6 135.4 135.5 133.1 2.82005 135.7 135.9 136.1 136.3 137.6 137.6 137.7 137.7 137.5 137.7 137.6 138.0 137.1 3.52006 138.0 136.8 137.1 137.3 138.8 140.2 140.0 140.5 141.4 141.5 142.2 142.2 139.7 1.72007 142.8 142.9 143.1 143.3 143.5 143.6 143.1 143.1 144.0 143.9 144.2 144.6 143.5 2.22008 147.8 148.4 149.6 151.2 150.2 151.3 153.3 158.6 162.5 163.0 164.2 167.8 156.1 7.12009 168.9 169.0 170.5 170.5 171.2 171.3 171.3 11.7
Frozen 1999 125.8 126.6 125.6 126.7 125.9 126.0 126.8 126.1 126.0 126.4 125.5 125.3 126.1 --2000 125.4 126.2 125.7 126.3 126.3 124.9 125.9 126.4 126.2 126.9 126.1 126.2 126.0 -0.72001 127.6 128.5 127.7 128.7 128.4 127.7 128.9 128.8 128.8 130.0 129.2 129.1 128.6 2.42002 130.0 131.1 130.1 131.2 130.7 129.7 131.4 131.3 131.5 132.2 131.9 132.6 131.1 1.92003 133.4 134.1 133.3 134.0 134.1 133.9 134.9 134.2 134.2 135.2 135.1 135.0 134.3 2.72004 135.1 136.0 135.3 135.3 134.3 134.7 135.4 135.8 136.8 138.1 137.2 137.0 135.9 0.42005 137.3 137.3 137.4 137.5 137.5 137.4 137.2 136.8 136.6 136.7 136.1 136.4 137.0 1.32006 137.3 137.7 138.7 138.6 138.8 139.5 139.4 139.3 139.9 142.0 142.7 142.6 139.7 1.62007 144.0 144.0 144.0 145.2 145.9 146.7 148.2 149.3 149.9 151.5 152.5 153.2 147.9 6.32008 153.3 153.8 155.6 156.5 156.7 157.1 158.8 161.1 163.9 170.6 172.7 177.9 161.5 7.22009 176.5 178.1 178.5 178.2 178.1 178.6 177.4 11.7
Dehydrated 1999 148.0 148.0 148.4 147.7 146.1 146.1 146.0 146.5 147.1 146.7 147.4 151.1 147.4 -- 4/ 2000 148.9 149.8 149.9 149.5 149.3 149.0 148.6 144.9 144.0 144.9 143.4 140.8 146.9 1.8
2001 139.1 135.6 136.2 136.9 139.9 140.6 140.4 140.9 142.4 142.7 144.6 145.9 140.4 -5.52002 148.2 149.3 150.3 151.0 150.1 151.2 152.6 152.3 151.2 151.1 150.2 151.1 150.7 8.72003 150.6 150.2 149.8 147.8 147.5 147.3 146.5 145.2 144.2 143.3 143.5 146.1 146.8 -4.02004 145.4 145.1 144.5 144.4 144.2 144.2 144.3 144.1 145.7 144.8 143.9 144.5 144.6 -1.52005 145.6 145.9 145.2 145.7 146.8 146.0 145.3 145.9 150.4 150.6 152.3 154.3 147.8 0.72006 154.7 156.4 158.1 159.3 163.0 165.0 165.1 165.5 168.1 168.5 169.8 171.9 163.8 13.62007 175.7 176.2 175.0 176.4 180.2 179.3 179.8 179.5 179.6 180.1 184.1 184.0 179.2 8.92008 185.3 185.7 188.1 189.5 189.7 190.9 195.0 194.0 194.2 195.5 195.9 193.9 191.5 8.52009 196.7 197.7 197.7 196.0 196.2 196.4 196.5 0.8
-- = not available. 1/ Indexes for 2009 are preliminary. 2/ Excludes potatoes. 3/ Includes vegetable juices. 4/ Includes both fruits and vegetables.
Source: U.S. Department of Labor, Bureau of Labor Statistics, http://www.bls.gov/data/home.htm.
37Vegetables and Melons Outlook /VGS-334/August 27, 2009
Economic Research Service, USDA

Price table 4—Vegetables: Consumer Price Indexes, by month, 2005-09 1/ Item Year Jan. Feb. Mar. Apr. May June July Aug. Sep. Oct. Nov. Dec. Annual
----------------------------------------------------------------- 1982-84=100 -----------------------------------------------------------------------
Fresh 2005 271.0 263.2 267.0 280.1 280.6 266.9 268.5 261.0 265.6 274.1 274.6 288.3 271.7 vegetables 2/ 2006 300.6 289.7 279.7 276.8 275.6 272.9 271.5 274.4 294.2 301.8 288.6 286.1 284.3
2007 298.3 308.6 302.4 299.3 293.3 283.5 280.1 274.4 282.3 292.7 300.4 306.1 293.52008 317.5 305.0 301.5 299.8 298.5 307.2 313.8 313.4 311.3 314.5 319.3 315.8 309.82009 320.2 311.8 305.7 304.5 296.6 296.9 294.6
Potatoes, 2005 237.5 235.8 228.3 235.0 239.1 246.7 256.7 263.8 258.6 265.8 253.5 251.7 247.7 fresh 2006 261.1 264.7 264.6 261.5 270.4 276.0 282.5 293.6 290.4 278.2 267.8 266.8 273.1
2007 272.4 269.9 276.0 277.6 284.7 291.6 294.5 283.4 283.0 278.8 278.7 274.7 280.42008 282.9 286.3 285.4 293.1 294.6 311.3 347.0 366.8 376.3 365.4 351.1 335.3 324.62009 349.2 338.7 336.2 316.4 321.6 322.0 326.2
Lettuce, 2005 258.3 237.9 253.5 287.5 271.6 257.6 247.7 247.4 249.4 258.4 258.7 260.0 257.3 fresh 2006 260.8 258.0 254.2 267.2 285.5 264.0 246.9 265.8 274.2 269.7 265.1 281.9 266.1
2007 292.2 294.7 287.6 283.3 265.6 261.6 254.7 260.6 273.3 298.2 295.7 295.3 280.22008 292.9 282.6 278.3 277.0 268.3 269.6 276.6 286.0 297.4 306.3 303.2 300.0 286.52009 302.3 292.9 288.2 290.8 280.9 277.0 269.7
Tomatoes, 2005 309.6 274.8 297.1 310.6 333.6 293.0 287.3 267.6 273.5 297.2 299.0 342.3 298.8 fresh 2006 393.1 354.7 311.5 297.9 293.9 276.1 271.8 271.8 336.5 405.5 347.8 318.5 323.3
2007 307.2 317.2 291.9 309.8 309.7 283.5 278.7 273.8 280.8 304.7 341.3 378.7 306.52008 385.2 329.6 345.1 334.9 322.1 346.3 330.7 317.7 303.0 304.3 334.6 337.8 332.62009 322.5 296.9 295.9 310.8 299.2 304.0 301.4
Other, fresh 2005 277.9 280.8 279.4 289.9 284.8 272.2 276.0 265.2 274.0 277.4 282.7 295.2 279.62006 298.2 289.6 285.8 282.4 273.5 278.2 279.1 276.1 291.5 288.1 286.8 288.0 284.82007 311.5 328.6 324.9 313.0 303.4 291.9 287.7 280.4 290.3 297.3 300.6 300.4 302.52008 318.2 313.8 303.3 301.2 304.8 307.9 312.0 306.3 300.9 307.9 312.8 311.2 308.42009 319.5 317.5 308.2 306.7 296.0 296.0 293.1
Frozen 2005 177.0 176.3 174.7 177.2 178.6 176.5 180.2 177.7 181.5 179.1 176.8 177.5 177.8 vegetables 2006 179.4 182.9 179.7 179.7 178.1 175.7 178.8 181.3 179.6 177.7 178.1 178.7 179.1
2007 179.0 182.1 180.4 178.2 181.2 178.6 182.6 182.5 183.4 181.1 180.2 179.8 180.82008 184.1 184.0 184.0 187.2 190.4 192.6 193.1 192.7 193.6 195.4 195.0 195.6 190.62009 201.3 198.1 198.9 199.7 196.7 199.5 201.0
December 1997=100
Processed 2005 117.9 117.1 116.3 118.8 119.3 119.7 121.3 120.6 121.2 120.6 118.8 120.3 119.3 fruits and 2006 121.8 122.5 122.4 121.3 122.6 122.8 123.8 124.1 123.3 122.8 122.7 123.5 122.8 vegetables 2007 124.9 125.5 125.4 124.9 126.2 127.7 129.0 129.2 129.6 129.3 126.7 128.5 127.2
2008 130.8 132.9 131.5 134.7 136.8 138.7 140.5 142.8 145.2 146.6 145.6 145.9 139.32009 148.4 148.5 149.0 148.7 150.4 150.9 150.3
Canned 2005 119.3 117.5 117.9 120.5 121.0 121.0 125.6 125.5 124.8 126.0 121.9 124.4 122.1 vegetables 2006 124.8 125.0 126.6 124.1 126.0 126.5 128.1 127.9 125.3 124.7 125.5 125.9 125.9
2007 127.1 127.0 127.6 126.2 126.7 130.5 131.2 131.7 133.2 132.8 128.4 131.9 129.52008 133.1 136.9 134.9 141.2 142.1 144.5 148.1 153.7 157.3 159.2 156.2 157.0 147.02009 159.1 162.3 162.5 162.8 164.6 165.5 165.9
Dried beans, 2005 115.2 116.0 116.4 118.4 117.5 118.3 118.3 118.1 118.3 118.7 118.9 116.6 117.6 peas, lentils 2006 117.2 117.3 117.1 119.4 118.7 119.3 120.7 121.3 120.8 120.5 121.0 123.6 119.7
2007 126.1 124.5 126.8 129.3 131.6 133.0 134.6 135.3 136.3 136.3 136.9 139.0 132.52008 141.3 145.5 141.1 147.2 151.8 160.0 162.6 165.0 168.0 172.2 177.0 176.3 159.02009 176.6 173.1 174.0 175.2 176.5 179.0 178.7
Olives, pickles 2005 110.0 107.5 115.2 112.0 101.1 98.4 100.4 108.8 106.7 119.5 109.1 110.2 108.2 and relishes 2006 115.7 110.7 111.0 110.9 108.6 110.9 110.3 117.6 117.5 118.6 112.2 112.6 113.1
2007 118.4 120.8 118.1 117.7 121.2 120.9 121.2 115.8 129.9 125.8 123.1 117.2 120.82008 123.8 125.9 123.1 121.9 127.1 124.7 126.0 128.5 129.5 132.4 129.6 132.5 127.12009 133.8 133.8 135.4 135.5 135.0 135.1 134.3
1/ Not seasonally adjusted. 2/ Includes potatoes.
Source: U.S. Department of Labor, Bureau of Labor Statistics, http://www.bls.gov/data/home.htm.
38Vegetables and Melons Outlook /VGS-334/August 27, 2009
Economic Research Service, USDA
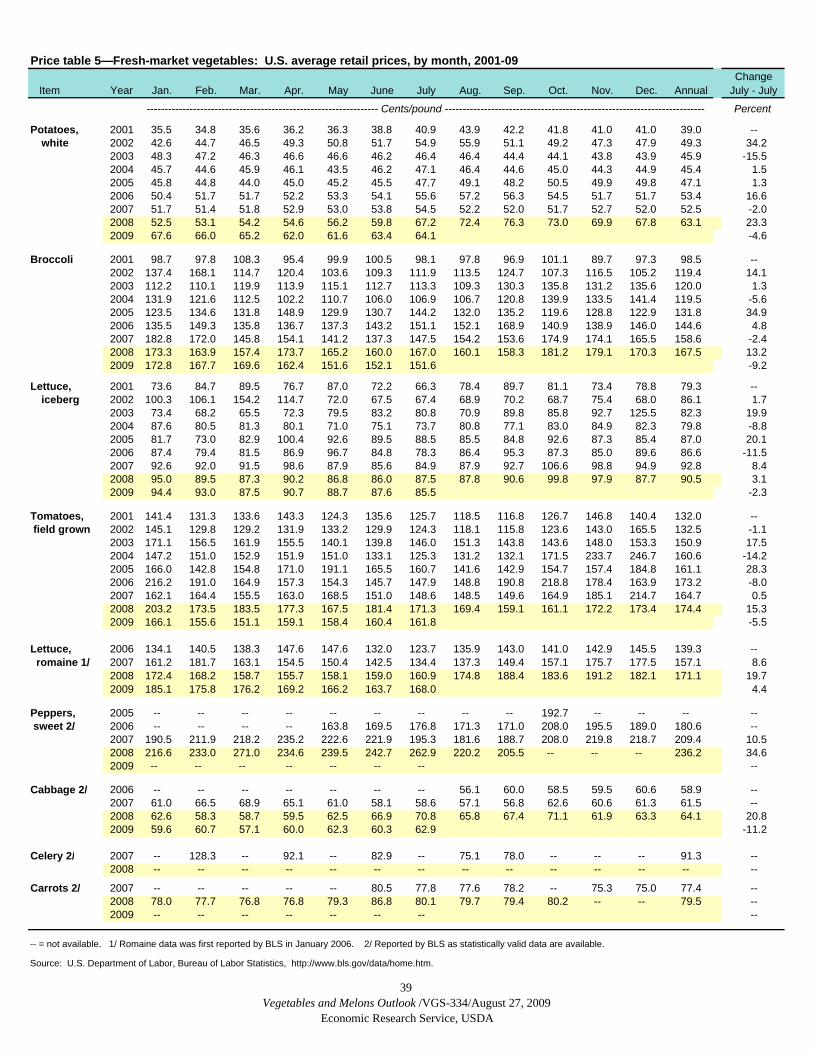
Price table 5—Fresh-market vegetables: U.S. average retail prices, by month, 2001-09 Change
Item Year Jan. Feb. Mar. Apr. May June July Aug. Sep. Oct. Nov. Dec. Annual July - July
----------------------------------------------------------------- Cents/pound ------------------------------------------------------------------------- Percent
Potatoes, 2001 35.5 34.8 35.6 36.2 36.3 38.8 40.9 43.9 42.2 41.8 41.0 41.0 39.0 --white 2002 42.6 44.7 46.5 49.3 50.8 51.7 54.9 55.9 51.1 49.2 47.3 47.9 49.3 34.2
2003 48.3 47.2 46.3 46.6 46.6 46.2 46.4 46.4 44.4 44.1 43.8 43.9 45.9 -15.52004 45.7 44.6 45.9 46.1 43.5 46.2 47.1 46.4 44.6 45.0 44.3 44.9 45.4 1.52005 45.8 44.8 44.0 45.0 45.2 45.5 47.7 49.1 48.2 50.5 49.9 49.8 47.1 1.32006 50.4 51.7 51.7 52.2 53.3 54.1 55.6 57.2 56.3 54.5 51.7 51.7 53.4 16.62007 51.7 51.4 51.8 52.9 53.0 53.8 54.5 52.2 52.0 51.7 52.7 52.0 52.5 -2.02008 52.5 53.1 54.2 54.6 56.2 59.8 67.2 72.4 76.3 73.0 69.9 67.8 63.1 23.32009 67.6 66.0 65.2 62.0 61.6 63.4 64.1 -4.6
Broccoli 2001 98.7 97.8 108.3 95.4 99.9 100.5 98.1 97.8 96.9 101.1 89.7 97.3 98.5 --2002 137.4 168.1 114.7 120.4 103.6 109.3 111.9 113.5 124.7 107.3 116.5 105.2 119.4 14.12003 112.2 110.1 119.9 113.9 115.1 112.7 113.3 109.3 130.3 135.8 131.2 135.6 120.0 1.32004 131.9 121.6 112.5 102.2 110.7 106.0 106.9 106.7 120.8 139.9 133.5 141.4 119.5 -5.62005 123.5 134.6 131.8 148.9 129.9 130.7 144.2 132.0 135.2 119.6 128.8 122.9 131.8 34.92006 135.5 149.3 135.8 136.7 137.3 143.2 151.1 152.1 168.9 140.9 138.9 146.0 144.6 4.82007 182.8 172.0 145.8 154.1 141.2 137.3 147.5 154.2 153.6 174.9 174.1 165.5 158.6 -2.42008 173.3 163.9 157.4 173.7 165.2 160.0 167.0 160.1 158.3 181.2 179.1 170.3 167.5 13.22009 172.8 167.7 169.6 162.4 151.6 152.1 151.6 -9.2
Lettuce, 2001 73.6 84.7 89.5 76.7 87.0 72.2 66.3 78.4 89.7 81.1 73.4 78.8 79.3 --iceberg 2002 100.3 106.1 154.2 114.7 72.0 67.5 67.4 68.9 70.2 68.7 75.4 68.0 86.1 1.7
2003 73.4 68.2 65.5 72.3 79.5 83.2 80.8 70.9 89.8 85.8 92.7 125.5 82.3 19.92004 87.6 80.5 81.3 80.1 71.0 75.1 73.7 80.8 77.1 83.0 84.9 82.3 79.8 -8.82005 81.7 73.0 82.9 100.4 92.6 89.5 88.5 85.5 84.8 92.6 87.3 85.4 87.0 20.12006 87.4 79.4 81.5 86.9 96.7 84.8 78.3 86.4 95.3 87.3 85.0 89.6 86.6 -11.52007 92.6 92.0 91.5 98.6 87.9 85.6 84.9 87.9 92.7 106.6 98.8 94.9 92.8 8.42008 95.0 89.5 87.3 90.2 86.8 86.0 87.5 87.8 90.6 99.8 97.9 87.7 90.5 3.12009 94.4 93.0 87.5 90.7 88.7 87.6 85.5 -2.3
Tomatoes, 2001 141.4 131.3 133.6 143.3 124.3 135.6 125.7 118.5 116.8 126.7 146.8 140.4 132.0 -- field grown 2002 145.1 129.8 129.2 131.9 133.2 129.9 124.3 118.1 115.8 123.6 143.0 165.5 132.5 -1.1
2003 171.1 156.5 161.9 155.5 140.1 139.8 146.0 151.3 143.8 143.6 148.0 153.3 150.9 17.52004 147.2 151.0 152.9 151.9 151.0 133.1 125.3 131.2 132.1 171.5 233.7 246.7 160.6 -14.22005 166.0 142.8 154.8 171.0 191.1 165.5 160.7 141.6 142.9 154.7 157.4 184.8 161.1 28.32006 216.2 191.0 164.9 157.3 154.3 145.7 147.9 148.8 190.8 218.8 178.4 163.9 173.2 -8.02007 162.1 164.4 155.5 163.0 168.5 151.0 148.6 148.5 149.6 164.9 185.1 214.7 164.7 0.52008 203.2 173.5 183.5 177.3 167.5 181.4 171.3 169.4 159.1 161.1 172.2 173.4 174.4 15.32009 166.1 155.6 151.1 159.1 158.4 160.4 161.8 -5.5
Lettuce, 2006 134.1 140.5 138.3 147.6 147.6 132.0 123.7 135.9 143.0 141.0 142.9 145.5 139.3 -- romaine 1/ 2007 161.2 181.7 163.1 154.5 150.4 142.5 134.4 137.3 149.4 157.1 175.7 177.5 157.1 8.6
2008 172.4 168.2 158.7 155.7 158.1 159.0 160.9 174.8 188.4 183.6 191.2 182.1 171.1 19.72009 185.1 175.8 176.2 169.2 166.2 163.7 168.0 4.4
Peppers, 2005 -- -- -- -- -- -- -- -- -- 192.7 -- -- -- -- sweet 2/ 2006 -- -- -- -- 163.8 169.5 176.8 171.3 171.0 208.0 195.5 189.0 180.6 --
2007 190.5 211.9 218.2 235.2 222.6 221.9 195.3 181.6 188.7 208.0 219.8 218.7 209.4 10.52008 216.6 233.0 271.0 234.6 239.5 242.7 262.9 220.2 205.5 -- -- -- 236.2 34.62009 -- -- -- -- -- -- -- --
Cabbage 2/ 2006 -- -- -- -- -- -- -- 56.1 60.0 58.5 59.5 60.6 58.9 --2007 61.0 66.5 68.9 65.1 61.0 58.1 58.6 57.1 56.8 62.6 60.6 61.3 61.5 --2008 62.6 58.3 58.7 59.5 62.5 66.9 70.8 65.8 67.4 71.1 61.9 63.3 64.1 20.82009 59.6 60.7 57.1 60.0 62.3 60.3 62.9 -11.2
Celery 2/ 2007 -- 128.3 -- 92.1 -- 82.9 -- 75.1 78.0 -- -- -- 91.3 --2008 -- -- -- -- -- -- -- -- -- -- -- -- -- --
Carrots 2/ 2007 -- -- -- -- -- 80.5 77.8 77.6 78.2 -- 75.3 75.0 77.4 --2008 78.0 77.7 76.8 76.8 79.3 86.8 80.1 79.7 79.4 80.2 -- -- 79.5 --2009 -- -- -- -- -- -- -- --
-- = not available. 1/ Romaine data was first reported by BLS in January 2006. 2/ Reported by BLS as statistically valid data are available.
Source: U.S. Department of Labor, Bureau of Labor Statistics, http://www.bls.gov/data/home.htm.
39Vegetables and Melons Outlook /VGS-334/August 27, 2009
Economic Research Service, USDA

Price table 6—Fresh-market vegetables: U.S. average monthly advertised retail prices, 2008-09Change
Item Units Year Jan. Feb. Mar. Apr. May June July Aug. * Sep. Oct. Nov. Dec. July - July-- Dollars per unit -- Percent
Asparagus Pound 2008 2.97 2.41 2.23 2.46 2.68 2.55 2.61 2.92 2.76 2.68 2.68 3.00 --2009 2.71 2.31 2.25 2.24 2.38 2.54 2.56 2.49 -1.9
Beans, Pound 2008 1.46 1.65 1.42 1.27 1.35 1.33 1.36 1.22 1.28 1.46 1.41 1.52 -- round green 2009 1.52 1.48 1.68 1.29 1.26 1.26 1.32 1.18 -2.9
Broccoli Bunch 2008 1.67 1.51 1.56 1.46 1.66 1.59 1.68 1.60 1.57 1.75 1.88 1.68 --2009 1.64 1.58 1.66 1.55 1.51 1.53 1.62 1.31 -3.6
Broccoli, Bunch 2008 2.23 2.18 2.03 2.26 2.36 1.97 2.34 1.99 1.93 2.68 2.54 2.49 -- Organic 2009 2.54 2.33 2.24 2.31 2.34 2.47 2.19 1.52 -6.4
Cabbage Pound 2008 0.43 0.42 0.33 0.43 0.41 0.43 0.47 0.47 0.46 0.47 0.44 0.45 --2009 0.46 0.46 0.40 0.44 0.44 0.47 0.48 0.49 2.1
Carrots, baby Pound 2008 1.40 1.41 1.41 1.41 1.42 1.44 1.45 1.43 1.36 1.40 1.41 1.31 --2009 1.34 1.30 1.40 1.33 1.34 1.33 1.33 1.35 -8.3
Carrots, Pound 2008 1.69 1.73 1.61 1.66 1.74 1.73 1.76 1.84 1.74 1.82 1.80 1.72 -- baby organic 2009 1.71 1.70 1.64 1.64 1.72 1.79 1.75 1.70 -0.6
Celery Each 2008 1.20 1.15 1.16 1.13 1.04 1.10 1.38 1.19 1.17 1.22 1.22 1.32 --2009 1.35 1.18 1.25 1.20 1.21 1.19 1.11 1.10 -19.6
Sweet corn Ear 2008 0.39 0.54 0.37 0.41 0.37 0.37 0.37 0.37 0.47 0.45 0.40 0.31 --2009 0.54 0.46 0.48 0.43 0.35 0.34 0.33 0.35 -10.8
Cucumbers Each 2008 0.67 0.60 0.62 0.60 0.57 0.60 0.62 0.62 0.62 0.65 0.64 0.71 --2009 0.66 0.78 0.69 0.75 0.61 0.61 0.60 0.57 -3.2
Lettuce, Head 2008 0.98 0.96 0.91 0.99 0.93 1.00 0.98 0.99 1.03 0.96 0.92 0.98 -- iceberg 2009 1.10 0.99 0.97 0.99 0.98 0.96 0.93 0.91 -5.1
Lettuce, Each 2008 1.11 1.13 1.32 1.05 1.04 1.07 1.12 1.15 1.29 1.14 1.06 1.32 -- romaine 2009 1.06 1.05 1.09 1.19 1.10 1.01 1.09 1.24 -2.7
Mushrooms, 8-oz pkg 2008 1.66 1.69 1.71 1.66 1.80 1.77 1.71 1.77 1.71 1.71 1.76 1.63 -- white 2009 1.70 1.68 1.71 1.69 1.71 1.74 1.73 1.76 1.2
Onions, 3-lb bag 2008 1.70 1.59 1.64 1.56 1.71 1.75 1.83 1.86 1.87 1.89 1.79 1.91 -- yellow 2009 1.83 1.79 1.87 1.84 1.87 1.85 1.96 1.40 7.1
Onions, sweet Pound 2008 1.13 1.18 1.11 0.95 0.93 0.97 1.07 1.09 1.09 1.18 1.26 1.09 -- yellow 2009 1.22 1.18 1.06 0.92 0.88 0.88 1.01 0.97 -5.6
Peppers, Pound 2008 1.43 1.44 1.47 1.37 1.39 1.47 1.59 1.39 1.49 1.49 1.44 1.51 -- bell green 2009 1.54 1.49 1.58 1.36 1.44 1.46 1.38 1.41 -13.2
Peppers, Pound 2008 2.54 2.37 2.93 2.45 2.57 2.45 2.58 2.49 2.18 2.48 2.53 2.65 -- bell red 2009 2.48 2.27 2.04 2.41 2.27 2.14 2.29 2.33 -11.2
Squash, Pound 2008 1.23 1.20 1.16 1.20 1.24 1.19 1.20 1.17 1.15 1.22 1.31 1.46 -- zucchini 2009 1.24 1.26 1.19 1.24 1.20 1.14 1.11 1.08 -7.5
Sweet Pound 2008 0.86 0.85 0.76 0.86 0.87 0.84 0.78 0.80 0.87 0.87 0.73 0.83 -- potatoes 2009 0.89 0.85 0.88 0.78 0.84 0.85 0.92 0.89 17.9
Tomatoes Pound 2008 2.15 1.66 1.89 1.65 1.46 1.57 1.48 1.46 1.33 1.47 1.67 1.65 --2009 1.29 1.34 1.29 1.37 1.35 1.40 1.34 1.36 -9.5
Tomatoes, Pound 2008 2.99 1.80 2.82 2.69 2.90 3.23 2.55 2.95 2.83 1.84 2.99 2.92 -- organic 2009 2.32 1.98 2.18 2.49 2.65 2.40 1.91 2.41 --
Tomatoes, Pound 2008 2.53 2.60 2.39 2.12 1.97 2.03 2.13 1.95 1.94 2.03 2.16 2.42 -- on the vine 2009 2.14 2.35 2.27 2.04 1.90 1.92 1.90 1.58 -10.8
Tomatoes, Pint 2008 2.41 2.40 2.39 2.43 2.23 2.25 2.41 2.25 2.42 2.34 2.44 2.37 -- grape 2009 2.27 2.32 2.17 2.28 2.26 2.17 2.31 2.30 -4.1
Artichokes Each 2008 -- -- 1.48 1.98 1.82 2.00 2.11 -- -- -- -- -- --2009 -- -- -- -- -- -- -- -- -- -- -- -- --
Cantaloup Each 2008 2.43 2.45 2.23 2.15 2.40 2.25 2.19 2.16 2.15 2.37 2.57 2.57 --2009 2.24 2.41 1.80 2.06 2.18 1.88 2.00 1.97 -8.7
Watermelon, Each 2008 3.49 -- 4.67 5.27 4.83 4.58 4.31 4.16 3.40 2.00 1.50 3.36 -- seedless 2009 3.04 3.20 4.01 5.49 4.86 4.51 4.36 4.19 1.2
-- = not available. * = partial month average for August 2009. Compiled from weekly data first reported in October of 2007.Source: Compiled by ERS from data of U.S. Department of Agriculture, Agricultural Marketing Service, Fruit and Vegetable Market News Service, Retail Price Report.
40Vegetables and Melons Outlook /VGS-334/August 27, 2009
Economic Research Service, USDA

Price table 7—Representative wholesale prices for selected fresh-market vegetables and melons in Chicago, 2008-09 Shipping Shipping 2008 : 2009
Commodity point 1/ container July 1 Aug 1 Sep 2 Oct 1 Nov 3 Dec 1 : Jan 2 Feb 2 Mar 1 Apr 1 May 1 June 1 July 1 Aug 3
Artichokes CA Carton, 24s 35.50 22.00 25.00 25.00 16.50 20.00 34.50 32.00 31.00 30.00 25.00 18.50 19.00 23.00Beans, round green, machine-pick FL, GA, MI Bushel cartons 44.00 49.85 15.00 27.00 20.50 22.50 19.00 23.00 37.00 19.50 16.25 28.00 17.00 14.50Beets, medium TX, IL, CA 25-lb sacks/filmbags 9.50 11.50 9.50 9.75 9.75 10.00 8.75 7.50 7.50 7.00 7.00 7.00 7.00 10.50Bok choy, baby CA, FL 30-lb cartons 18.00 19.00 12.50 13.00 16.00 16.00 15.00 17.50 17.00 14.00 14.50 12.50 12.00 12.50Brussels sprouts CA, MX 25-lb cartons 27.50 21.50 15.00 23.00 17.00 17.00 33.00 19.00 17.00 17.50 37.00 32.00 32.50 47.00Cabbage, round-green, medium NY, GA 50-lb cartons 17.00 15.00 11.00 10.00 9.50 9.50 10.75 10.25 8.00 11.25 13.00 13.50 14.00 11.50Chinese cabbage (Napa) CA 30-lb cartons 15.00 18.00 12.00 15.00 16.00 18.50 15.00 13.50 14.00 12.50 14.50 15.00 15.00 13.00Carrots, baby peeled CA Carton, 24 (1-lb) filmbags 18.00 18.00 18.00 19.00 19.00 19.00 19.00 19.00 18.00 18.00 18.00 18.00 18.00 18.00Eggplant, medium FL, GA, MX 1 (1/9-bushel) cartons 12.25 12.00 15.50 14.50 18.00 13.00 12.50 15.00 15.50 36.00 15.50 11.00 11.00 15.50Garlic, white colossal CA, MX 30 lb cartons 41.50 41.50 41.50 46.00 46.00 43.00 43.00 46.00 46.00 47.00 47.00 47.00 47.00 47.00Greens, kale CA Carton, 24s 15.00 13.50 13.50 13.50 13.50 13.50 13.00 13.00 13.00 13.00 12.50 12.00 12.00 12.50Greens, kohlrabi CA, TX, IL Carton, 12s/24s 24.00 27.00 27.00 25.00 25.00 25.00 24.50 20.00 21.00 21.00 21.00 24.00 -- 14.50Greens, turnip tops GA, IL Carton, 24s 11.50 11.50 10.75 10.75 11.00 11.00 11.00 11.00 11.00 11.50 11.50 12.00 11.75 11.75Greens, mustard CA Carton, 24s 11.50 11.50 10.75 10.75 11.00 11.00 11.00 11.00 11.25 11.50 11.50 12.00 11.75 11.75Greens, collards GA, CA Carton, 24s 11.50 11.50 10.75 10.75 11.00 11.00 11.00 11.00 11.00 11.50 11.50 12.00 11.75 11.75Leeks CA, IL, MX Carton, bunched 12s 20.00 19.50 19.00 15.50 23.00 23.50 19.00 15.50 15.50 14.00 12.25 15.00 24.00 15.50Lettuce, Boston CA Carton, 24s 14.00 14.00 14.50 19.00 14.00 14.00 13.00 11.00 11.50 13.00 26.00 14.00 14.00 13.50Lettuce, Romaine CA Carton, 24s 16.00 15.00 22.50 23.50 18.50 17.50 15.50 12.00 18.00 13.00 15.00 14.00 17.00 14.00Mushrooms, button, large PA 10-lb carton 15.00 15.00 15.00 15.00 15.00 15.00 15.00 15.00 15.00 15.00 15.00 15.00 15.00 15.00Mushrooms, shiitake PA 5-lb carton 21.00 21.00 21.00 21.00 21.00 21.00 21.00 21.00 21.00 21.00 21.00 21.00 21.00 21.00Mushrooms, oyster PA 5-lb carton 15.50 15.50 15.50 15.50 15.50 15.50 15.50 15.50 15.50 15.50 15.50 15.50 15.50 15.50Mushrooms, cremini, medium PA 10-lb carton 12.50 12.50 12.50 12.50 12.50 12.50 12.50 12.50 12.50 12.50 12.50 12.50 12.50 12.50Mushrooms, portobellas, lrg PA 5-lb carton 10.00 10.00 10.00 10.00 10.00 10.00 10.00 10.00 10.00 10.00 10.00 10.00 10.00 10.00Okra, small-medium FL, MX, TN 1/2-bushel carton 22.00 22.00 20.00 20.00 29.00 30.00 31.00 27.00 25.00 31.00 19.50 -- -- --Onions, green, medium CA, MX Carton, bunched 48s 16.00 27.05 17.00 17.00 13.00 17.00 16.25 9.00 10.00 9.50 15.50 8.75 9.50 8.50Parsley, curly CA Cartons, bunched 60s 24.00 19.00 19.00 16.50 18.00 19.00 19.00 14.50 13.50 14.00 13.00 17.00 15.50 16.50Peas, snow GU, CA 10-lb carton 28.00 22.50 16.00 22.00 25.00 24.00 11.00 13.00 13.00 15.00 11.00 11.00 13.00 16.50Peas, sugar snap GU, CA 10-lb carton 30.00 33.00 30.00 25.50 25.00 22.00 26.00 12.00 10.00 14.50 12.00 16.50 23.00 21.00Peppers, green bell, large/x-lrg FL, CA 1 (1/9-bushel) cartons 21.00 34.50 18.50 13.00 21.50 15.50 10.50 18.00 17.00 13.00 11.00 12.00 22.00 15.00Peppers, jalapeno, medium FL, GA, MI 1/2- & 5/9-bushel crates 13.00 18.50 17.00 10.50 9.50 31.00 26.00 15.00 14.50 11.00 11.00 11.50 12.00 12.00Radishes FL, MI Carton, 30 (6-oz) filmbags 9.00 11.00 9.50 10.00 12.00 10.00 9.00 9.00 10.00 9.50 8.00 9.00 9.00 9.00Spinach, flat CA Carton, bunched 24s 13.50 19.00 18.50 15.00 23.00 16.50 18.00 15.00 16.50 20.50 21.00 13.50 16.00 16.00Squash, zucchini, medium FL, NJ, MI 1/2- & 5/9-bushel crates 9.50 12.00 8.25 17.50 7.00 20.00 7.50 10.00 13.00 8.00 10.50 10.00 9.00 7.00Squash, yellow straightneck, med. FL, NJ, MI 1/2- & 5/9-bushel crates 9.50 15.00 10.00 22.00 12.00 26.00 10.00 13.50 26.00 14.00 26.00 10.00 14.00 9.50Sweet potatoes, US #1, Beauregrd LA 40-lb carton 20.00 20.00 20.50 20.50 20.50 20.50 20.50 20.50 20.50 20.50 20.50 20.50 20.50 20.50Tomatoes, mature green, lrg, 6x6 FL, CA, MX 25-lb carton 13.00 12.50 9.00 11.00 21.00 14.00 11.50 9.00 7.00 11.50 15.00 14.50 16.00 9.50Tomatoes, vine ripe, md/lrg MX, CA, FL 25-lb carton 12.00 16.00 10.25 11.50 21.00 10.50 11.00 9.50 12.00 14.00 17.50 8.00 21.00 13.00Tomatoes, greenhse, v. ripe, md/lrg MX, CD, AZ 5-kg carton (on vine) 15.00 13.00 8.75 8.50 6.00 12.00 13.00 15.00 11.00 11.50 7.00 7.50 7.00 7.00Tomatoes, cherry FL, CA, MX Flats, 12 (1-pint) buckets 20.50 11.00 9.00 6.00 15.00 11.50 8.50 14.00 11.00 7.00 11.50 16.00 17.00 8.75Tomatoes, plum-type, med/lrg FL, CA, MX 25-lb carton 20.50 16.50 10.00 12.50 15.00 17.50 14.50 9.00 9.25 22.50 14.00 12.50 12.25 12.00Turnips, purple top, medium-large CA, IL 25-lb filmbags 10.00 10.00 10.00 10.00 11.50 11.50 11.50 11.50 10.00 11.00 11.50 8.00 10.50 8.50Cantaloups CA, CR, MX 1/2-2/3 carton 12s 12.00 11.50 9.50 16.50 12.50 18.50 13.00 21.50 9.50 14.50 11.00 10.50 12.50 11.25Honeydews CA, HD, CR 2/3 carton 6s 14.00 11.00 7.00 10.25 7.25 8.25 13.00 21.50 10.50 11.00 10.00 9.00 13.25 10.50Watermelon, various red (85 lb ctn) CA, TX, MX Carton 3s or 4s, per lb 0.27 0.25 0.22 0.21 0.28 0.29 -- -- 0.30 0.35 0.34 0.21 0.28 0.19Watermelon, red seedless CA, MX Carton 4s or 5s, per lb 0.28 0.25 0.25 0.25 0.36 0.35 0.43 0.38 0.30 0.41 0.36 0.21 0.29 0.18 -- = Not available. 1/ Major shipping points by commodity into the Chicago Wholesale Market. CA=California, FL=Florida, TX=Texas, MI=Michigan, IL=Illinois, NY=New York, NJ= New Jersey, GA=Georgia, PA=Pennsylvania, LA = Louisiana, MX=Mexico, CR=Costa Rica, HD=Honduras, GU=Guatemala, CD=Canada, NL-Netherlands.
Source: USDA, Agricultural Marketing Service, Fruit & Vegetable Market News, FV Market News Portal, http://marketnews.usda.gov/portal/fv
41Vegetables and Melons Outlook /VGS-334/August 27, 2009
Economic Research Service, USDA

Price table 8—Canned vegetables: Quarterly wholesale price trends, 2000-09 1/ Year & Sweet corn 2/ Snap beans 3/ Green peas 4/ Carrots 5/ Beets 6/ Tomato paste 7/
quarter 24/300 6/10 24/300 6/10 24/300 6/10 24/300 6/10 24/300 6/10 55-drum 6/10 -------------------------------------------------------------- Dollars/case ---------------------------------------------------------- $/lb $/case
2000 I 7.75 13.84 7.50 11.67 8.75 14.79 7.88 10.88 8.21 11.75 0.34 19.63 II 7.84 15.00 7.50 11.92 8.84 16.33 7.88 10.88 8.38 11.38 0.34 20.04 III 7.71 15.00 7.25 12.00 8.79 16.00 7.96 11.13 8.46 11.38 0.32 19.50 IV 7.63 15.09 7.38 11.17 8.75 16.13 7.75 11.01 8.50 11.75 0.32 19.00
Average 7.73 14.73 7.41 11.69 8.78 15.81 7.87 10.97 8.39 11.57 0.33 19.54
2001 I 7.25 14.75 7.25 10.25 8.63 15.46 7.75 10.88 7.75 11.75 0.31 17.88 II 7.25 14.75 7.25 10.25 8.63 15.25 7.75 10.88 7.75 11.75 0.31 17.88 III 7.67 14.92 7.67 10.42 8.96 15.42 7.92 11.05 7.92 11.75 0.32 17.88 IV 8.25 15.25 8.25 12.55 9.00 15.42 8.33 11.25 8.42 11.83 0.32 17.88
Average 7.61 14.92 7.61 10.87 8.81 15.39 7.94 11.02 7.96 11.77 0.32 17.88
2002 I 9.00 15.75 9.00 14.59 9.00 15.25 9.00 12.00 9.00 12.00 0.32 17.63 II 8.33 15.08 8.33 12.05 8.75 15.08 9.00 12.00 9.00 12.00 0.31 17.80 III 8.00 14.75 8.00 10.88 8.63 15.00 9.00 11.50 9.00 12.00 0.31 18.50 IV 8.00 14.67 8.00 11.05 8.88 15.09 8.75 11.50 9.00 12.00 0.31 20.38
Average 8.33 15.06 8.33 12.14 8.82 15.11 8.94 11.75 9.00 12.00 0.31 18.58
2003 I 8.00 14.00 8.00 11.13 9.00 15.42 8.63 11.50 9.00 12.00 0.32 18.46 II 8.00 14.00 8.00 11.38 9.00 15.50 8.71 11.50 9.00 12.00 0.30 19.46 III 8.00 14.00 8.00 11.75 9.00 16.00 8.63 11.50 9.00 12.00 0.29 17.63 IV 8.00 14.13 8.00 12.38 9.00 16.00 8.63 11.50 9.00 12.00 0.29 17.63
Average 8.00 14.03 8.00 11.66 9.00 15.73 8.65 11.50 9.00 12.00 0.30 18.30
2004 I 8.17 14.80 8.17 14.38 9.17 16.00 8.63 11.50 9.00 12.00 0.29 18.67 II 8.42 15.46 8.33 15.92 9.13 15.75 8.75 11.50 9.00 13.00 0.30 20.25 III 8.50 15.63 8.33 16.17 9.00 15.59 9.00 11.50 9.00 14.00 0.30 20.25 IV 8.42 15.29 8.46 15.84 8.92 15.54 9.00 11.75 8.50 15.00 0.30 20.25
Average 8.38 15.30 8.32 15.58 9.06 15.72 8.85 11.56 8.88 13.50 0.30 19.86
2005 I 8.58 14.08 8.54 13.54 8.96 15.67 9.00 11.75 8.83 14.58 0.30 20.25 II 8.75 13.42 8.67 13.25 9.13 15.33 9.00 11.75 9.00 14.00 0.30 20.25 III 8.67 13.58 8.71 12.83 9.13 15.42 9.00 12.00 9.00 13.63 0.31 20.54 IV 8.71 12.25 8.88 12.50 9.13 15.25 9.00 12.00 8.96 13.38 0.33 21.13
Average 8.68 13.33 8.70 13.03 9.09 15.42 9.00 11.88 8.95 13.90 0.31 20.54
2006 I 8.63 12.25 8.88 12.13 9.25 15.46 9.00 12.00 9.05 12.80 0.36 21.46 II 8.63 12.25 8.75 12.13 9.17 15.50 9.00 12.00 9.03 12.25 0.37 22.58 III 8.38 11.75 8.45 12.00 8.71 15.50 9.00 12.00 8.50 11.88 0.40 23.25 IV 8.38 11.75 8.57 12.00 8.63 15.50 9.00 12.00 8.50 11.88 0.44 23.25
Average 8.51 12.00 8.66 12.07 8.94 15.49 9.00 12.00 8.77 12.20 0.39 22.64
2007 I 8.38 12.50 8.63 12.38 9.25 15.50 8.88 12.00 8.43 13.10 0.46 23.25 II 8.60 13.00 8.73 13.13 9.17 16.00 8.88 12.00 8.71 11.90 0.46 23.25 III 9.16 13.33 8.95 13.30 8.71 16.00 8.88 12.00 8.85 11.97 0.43 23.25 IV 9.38 13.83 9.00 13.92 9.38 16.00 8.88 12.00 8.85 12.67 0.41 23.41Average 8.88 13.17 8.83 13.18 9.13 15.88 8.88 12.00 8.71 12.41 0.44 23.29
2008 I 9.00 15.05 9.10 14.55 9.28 16.00 11.53 12.00 9.23 14.03 0.43 23.78 II 9.64 17.10 9.71 16.22 9.98 16.50 11.53 15.55 9.80 15.03 0.46 27.50 III 10.93 18.22 10.93 17.70 11.18 18.18 11.53 15.55 10.95 16.74 0.56 27.50 IV 10.93 18.28 10.93 17.78 11.18 18.25 11.53 15.55 10.95 17.10 0.63 27.50
Average 10.12 17.16 10.17 16.56 10.40 17.23 11.53 14.66 10.23 15.72 0.52 26.57
2009 I p 11.63 18.28 11.63 17.78 12.00 19.23 11.53 15.65 11.63 17.18 0.63 29.73 II p 11.63 18.24 11.63 17.78 12.00 19.23 11.53 15.65 11.63 17.18 0.61 29.73 III f 11.63 18.15 11.63 17.78 12.00 19.23 11.53 15.65 11.63 17.18 0.55 29.73 IV f 11.29 17.39 11.39 17.51 11.29 19.23 11.53 15.65 10.95 16.66 0.53 29.73
Average 11.55 18.02 11.57 17.71 11.82 19.23 11.53 15.65 11.46 17.05 0.58 29.73
p = Preliminary. f = ERS forecast. -- = not available. 1/ Some prices calculated as averages of quoted ranges. 2/ Whole kernel corn, Midwest. 3/ 4-sieve cut, Midwest. 4/ 4-sieve, Midwest. 5/ Medium sliced, Midwest. 6/ Medium sliced, Midwest. 7/ 26-percent solids for 6/10 and 31 percent for 55-gallon drum, California.
Source: American Institute of Food Distribution, Price Trends.
42Vegetables and Melons Outlook /VGS-334/August 27, 2009
Economic Research Service, USDA

Price table 9—Frozen vegetables: Quarterly wholesale price trends, 2000-09 1/ Year and Sweet corn 2/ Snap beans 3/ Green peas 4/ Cauliflower 4/ Broccoli 6/ Spinach 7/ Okra 8/quarter 12/16 12/2.5 12/16 12/2 12/16 12/2.5 12/16 12/2 24/10 12/2 24/10 12/3 12/2
--------------------------------------------------------------------------- Dollars/case -------------------------------------------------------------------------------------
2000 I 6.83 0.48 6.83 0.47 6.93 0.54 9.47 0.70 10.15 0.72 8.30 0.43 0.63 II 6.83 0.48 6.83 0.47 6.93 0.54 9.47 0.70 10.15 0.72 8.30 0.43 0.63 III 6.83 0.47 6.83 0.47 6.93 0.54 9.47 0.70 10.15 0.72 8.30 0.43 0.63 IV 6.83 0.47 6.83 0.47 6.93 0.54 9.47 0.70 10.15 0.72 8.30 0.43 0.63
Average 6.83 0.47 6.83 0.47 6.93 0.54 9.47 0.70 10.15 0.72 8.30 0.43 0.63
2001 I 6.83 0.46 6.83 0.47 6.93 0.53 9.47 0.70 10.15 0.72 8.30 0.43 0.64 II 6.83 0.46 6.84 0.47 6.88 0.53 9.47 0.70 10.15 0.72 8.30 0.43 0.64 III 6.88 0.49 6.85 0.47 6.88 0.55 9.50 0.72 10.15 0.72 8.30 0.45 0.64 IV 6.88 0.49 6.85 0.49 6.88 0.55 9.50 0.72 10.15 0.72 8.30 0.45 0.65Average 6.86 0.47 6.84 0.48 6.89 0.54 9.49 0.71 10.15 0.72 8.30 0.44 0.64
2002 I 6.88 0.49 6.93 0.49 6.88 0.55 9.50 0.72 10.15 0.72 8.30 0.48 0.64 II 7.10 0.50 7.10 0.50 7.05 0.55 9.49 0.72 10.15 0.72 8.30 0.48 0.64 III 7.10 0.50 7.10 0.51 7.07 0.55 9.47 0.72 10.15 0.72 8.30 0.48 0.64 IV 7.10 0.51 7.10 0.54 7.10 0.55 9.47 0.72 10.15 0.72 8.30 0.48 0.64
Average 7.05 0.50 7.06 0.51 7.02 0.55 9.48 0.72 10.15 0.72 8.30 0.48 0.64
2003 I 7.10 0.55 7.10 0.54 7.10 0.55 9.47 0.72 10.15 0.72 8.30 0.48 0.64 II 7.10 0.55 7.10 0.54 7.10 0.55 9.47 0.72 10.15 0.72 8.30 0.48 0.64 III 7.10 0.55 7.10 0.54 7.10 0.55 9.47 0.72 10.15 0.72 8.30 0.48 0.66 IV 7.10 0.55 7.10 0.54 7.10 0.55 9.47 0.72 10.15 0.72 8.30 0.48 0.69Average 7.10 0.55 7.10 0.54 7.10 0.55 9.47 0.72 10.15 0.72 8.30 0.48 0.66
2004 I 7.10 0.55 7.10 0.54 7.10 0.55 9.50 0.72 10.15 0.72 8.30 0.48 0.69 II 7.10 0.55 7.10 0.54 7.38 0.55 9.50 0.72 10.15 0.72 8.30 0.48 0.69 III 7.38 0.56 7.38 0.58 7.38 0.58 9.50 0.72 10.15 0.72 8.30 0.50 0.69 IV 7.30 0.54 7.33 0.58 7.28 0.57 9.50 0.72 10.15 0.72 8.30 0.50 0.69
Average 7.22 0.55 7.23 0.56 7.29 0.56 9.50 0.72 10.15 0.72 8.30 0.49 0.69
2005 I 7.00 0.48 7.33 0.57 7.28 0.52 9.47 0.72 10.15 0.72 8.30 0.52 0.69 II 7.04 0.47 7.33 0.56 7.28 0.52 9.47 0.72 10.15 0.72 8.30 0.52 0.69 III 7.12 0.48 7.33 0.56 7.28 0.52 9.47 0.72 10.15 0.72 8.30 0.53 0.69 IV 7.10 0.48 -- 0.56 7.28 0.52 9.47 0.72 10.15 0.72 8.30 0.52 0.69
Average 7.07 0.48 7.33 0.56 7.28 0.52 9.47 0.72 10.15 0.72 8.30 0.52 0.69
2006 I 7.10 0.50 7.25 0.56 7.28 0.52 9.47 0.72 10.15 0.72 8.32 0.52 0.69 II 7.35 0.50 7.63 0.56 7.63 0.55 9.47 0.72 10.30 0.72 8.81 0.49 0.69 III 7.58 0.50 7.63 0.56 7.34 0.54 9.47 0.72 10.38 0.73 8.88 0.50 0.69 IV 7.58 0.50 7.63 0.56 7.20 0.54 9.47 0.72 10.38 0.73 8.88 0.50 0.69Average 7.40 0.50 7.53 0.56 7.36 0.54 9.47 0.72 10.30 0.72 8.72 0.50 0.69
2007 I 7.58 0.44 7.63 0.56 7.20 0.54 9.47 0.72 10.38 0.73 8.38 0.52 0.74 II 7.50 0.48 7.61 0.57 7.49 0.55 9.47 0.72 10.38 0.73 8.81 0.49 0.75 III 7.58 0.44 7.95 0.59 7.34 0.54 9.47 0.72 10.38 0.73 8.88 0.48 0.75 IV 7.84 0.44 7.75 0.59 7.60 0.54 9.47 0.72 10.42 0.79 8.71 0.50 0.73
Average 7.63 0.45 7.74 0.58 7.41 0.54 9.47 0.72 10.39 0.74 8.70 0.50 0.74
2008 I 10.68 0.53 10.67 -- 7.43 0.60 13.32 0.89 10.70 0.85 7.05 0.52 0.74 II 11.05 0.58 11.04 0.71 8.87 0.64 14.04 0.92 10.70 0.86 7.50 0.58 0.77 III 11.78 0.77 11.75 0.71 11.76 0.73 14.04 0.98 11.75 0.89 7.50 0.70 0.83 IV 11.78 0.82 11.75 0.71 11.78 0.82 14.04 0.98 11.75 0.89 7.67 0.73 0.83
Average 11.32 0.67 11.30 0.71 9.96 0.70 13.86 0.94 10.70 0.87 8.88 0.63 0.79
2009 I p 11.78 0.82 11.75 0.71 11.78 0.82 14.04 0.95 11.75 0.92 8.00 0.73 0.83 II p 11.75 0.81 11.75 0.71 11.78 0.81 14.04 0.95 11.75 0.92 8.00 0.78 0.83 III f 11.74 0.81 11.75 0.71 11.78 0.81 14.04 0.96 11.75 0.92 8.00 0.78 0.84 IV f 11.73 0.81 11.75 0.71 11.78 0.81 14.04 0.96 11.83 0.92 8.00 0.78 0.84
Average 11.75 0.81 11.75 0.71 11.78 0.81 14.04 0.96 11.77 0.92 8.00 0.77 0.84
-- = not available. p = Preliminary. f = ERS forecast. 1/ Some prices calculated as averages of quoted ranges. 2/ Whole kernel (cut) corn, f.o.b. West Coast basis. 3/ Regular cut. 4/ Poly bags. 5/ Sliced, poly bags. 6/ Spears/chopped, f.o.b. Northwest. 7/ Chopped. f.o.b. West Coast. 8/ Cut, Individually Quick Frozen (IQF) poly bag, f.o.b. Northwest.
Source: American Institute of Food Distribution, Price Trends.
43Vegetables and Melons Outlook /VGS-334/August 27, 2009
Economic Research Service, USDA

Price table 10—Potatoes and pulses: Prices received by U.S. growers, by month, 2002-09 1/ Season
Item Year Jan. Feb. Mar. Apr. May June July Aug. Sep. Oct. Nov. Dec. average ------------------------------------------------------ Dollars/cwt ----------------------------------------------------------------
Potatoes, 2002 7.34 7.33 8.24 8.01 8.59 9.38 10.59 7.39 6.29 5.53 6.24 6.62 6.67 all uses 2003 6.44 6.47 6.79 6.98 6.93 6.69 6.82 5.78 5.16 4.85 5.21 5.56 5.88
2004 5.70 5.93 6.11 6.62 6.37 6.44 6.14 5.57 5.16 4.61 4.89 5.28 5.652005 5.64 5.83 6.44 6.19 6.06 6.31 7.10 6.48 5.64 5.38 6.35 6.87 7.042006 7.09 6.80 8.48 8.36 7.73 8.46 9.32 7.55 6.12 5.68 6.68 6.92 7.312007 7.15 7.38 7.92 8.69 7.94 7.74 7.96 6.70 5.79 5.67 6.47 7.02 7.512008 7.33 7.51 8.37 8.45 9.16 10.78 12.33 11.33 8.79 7.38 8.91 9.62 9.462009 9.40 8.87 9.27 9.81 9.62 9.48 9.80
Potatoes, 2002 10.49 11.63 13.19 12.17 14.69 16.28 16.70 15.31 11.52 8.34 8.62 8.60 9.59 table stock 2003 8.05 8.51 8.57 8.35 9.09 9.20 8.95 8.48 6.87 6.21 6.19 6.13 7.34
2004 6.28 6.79 7.38 7.84 7.65 9.01 7.99 7.76 6.75 5.07 4.89 5.57 6.702005 6.15 6.64 8.06 7.24 7.36 8.29 10.05 11.00 9.61 8.80 9.04 9.18 10.312006 9.58 9.14 13.82 12.39 10.56 12.02 12.70 13.97 9.81 8.67 8.63 8.70 10.252007 9.05 10.05 11.04 13.09 10.37 10.36 9.74 10.53 7.85 7.68 8.11 8.52 10.842008 9.26 9.86 11.42 11.66 14.30 18.61 19.40 24.93 19.15 16.57 15.37 14.69 --2009 13.70 12.36 11.89 11.98 12.70 13.00
Potatoes, 2002 5.37 5.27 5.34 5.66 6.02 5.83 6.09 4.67 4.62 4.79 5.14 5.35 5.16 processing 2003 5.29 5.27 5.28 5.49 5.59 5.59 5.38 4.88 4.62 4.46 4.77 5.19 5.11
2004 5.30 5.40 5.24 5.56 5.62 5.53 5.15 4.76 4.59 4.46 4.87 5.10 5.062005 5.29 5.28 5.37 5.45 5.69 5.51 5.52 4.91 4.65 4.66 4.89 5.51 5.392006 5.65 5.58 5.73 6.04 6.30 6.46 6.40 5.43 5.20 5.11 5.68 5.94 5.902007 6.14 6.03 6.36 6.55 6.74 6.65 6.51 5.55 5.34 5.29 5.62 6.14 6.012008 6.17 6.25 6.15 6.50 6.71 6.54 6.55 5.56 5.71 5.57 5.92 6.51 --2009 6.68 6.84 7.02 7.61 7.82 7.42
Dry edible 2002 21.50 26.10 27.10 27.50 27.80 27.40 24.50 23.20 17.90 16.60 15.90 16.10 17.10 beans 2003 16.40 19.20 15.90 18.70 19.10 16.60 17.20 18.00 17.60 17.60 19.10 17.40 18.40
2004 17.20 17.50 20.20 19.60 19.90 20.00 19.20 20.90 22.80 24.50 25.90 27.00 25.702005 27.20 27.80 26.60 28.70 31.10 27.70 25.40 21.40 18.00 18.80 18.00 18.10 18.502006 19.20 17.40 17.10 18.90 19.30 19.00 21.70 19.50 18.80 19.50 21.80 21.80 22.102007 22.70 25.40 25.70 24.50 24.40 24.40 28.50 25.70 24.60 26.00 28.10 27.30 28.802008 27.40 32.00 32.20 34.30 35.60 33.50 36.30 38.00 36.80 40.00 34.50 34.50 37.702009 35.50 30.10 32.50 31.70 31.40 30.10 29.80
Green peas, 2002 7.04 7.06 7.13 7.40 7.25 7.25 7.25 7.13 7.38 7.68 7.91 8.33 8.89 whole-dry 2003 9.08 9.81 10.88 10.60 10.44 9.92 9.30 7.56 7.63 8.09 8.84 9.08 9.26 2/ 2004 9.56 9.94 10.50 10.56 10.88 8.43 7.38 6.45 6.41 6.66 6.93 6.69 6.36
2005 6.63 6.56 6.03 5.69 5.47 5.38 5.31 5.15 4.84 4.81 4.80 4.75 5.262006 4.97 5.31 5.50 5.78 6.00 5.91 5.84 5.93 6.44 6.70 7.19 7.58 8.072007 7.81 8.69 9.50 10.19 10.33 10.63 10.63 10.72 11.78 13.00 13.50 14.08 15.192008 15.56 17.31 18.44 18.90 18.75 18.75 18.70 18.33 17.25 14.75 14.75 13.50 14.752009 13.63 13.81 14.45 15.25 15.44 16.20 14.92 10.75
Yellow peas, 2002 7.04 7.25 7.31 7.68 7.66 7.59 7.38 6.50 6.72 7.10 7.34 7.58 7.66 whole-dry 2003 7.42 7.94 8.03 8.50 8.75 8.67 8.44 6.63 6.43 6.75 7.53 7.75 7.97 2/ 2004 7.91 8.72 9.03 9.25 9.42 7.73 7.13 6.08 5.97 6.25 6.43 6.25 6.05
2005 6.00 6.00 5.73 5.56 5.59 5.55 5.25 5.15 4.66 4.63 4.63 4.63 4.992006 4.75 4.97 5.00 5.25 5.50 5.50 5.53 5.35 5.78 6.10 6.66 7.04 7.302007 7.13 7.94 8.63 8.75 9.20 9.50 9.60 9.75 10.69 11.80 13.00 13.33 14.112008 14.81 16.06 17.44 17.90 17.50 -- 17.63 14.75 13.15 11.63 11.75 10.75 12.002009 10.75 10.75 10.75 -- 9.75 9.80 9.25 9.50
Lentils, 2002 9.44 9.06 9.03 9.75 9.59 9.44 9.40 9.50 10.75 12.85 13.81 14.25 14.84 regular 2003 15.42 17.63 18.63 18.70 18.63 18.56 15.20 14.50 14.85 16.50 16.88 16.50 17.41 (Brewer) 2004 17.13 19.00 20.90 21.25 20.38 15.80 14.19 13.25 14.38 15.56 15.95 15.38 13.93 2/ 2005 14.69 14.19 13.45 12.56 12.19 11.40 11.25 11.25 11.34 11.25 10.78 10.08 10.77
2006 10.38 10.31 10.25 10.69 10.75 10.94 10.94 12.25 13.06 14.15 14.25 14.50 14.052007 14.59 14.81 14.75 14.94 15.05 15.25 15.25 18.00 20.38 24.40 28.00 30.00 27.592008 30.38 30.13 32.38 34.38 33.88 34.00 34.20 34.50 36.38 38.00 -- -- 28.502009 27.75 28.75 29.00 31.50 32.38 32.20 30.00 25.75
-- = not available. 1/ Prices for 2009 are preliminary. 2/ Grower bids for U.S. no. 1 grade reported by the Bean Market News for Idaho & Washington. The season averages for peas and lentils presented here are calculated by ERS based on a July-June marketing year.
Sources: USDA, National Agricultural Statistics Service, Agricultural Prices, and USDA, Agricultural Marketing Service, Bean Market News.
44Vegetables and Melons Outlook /VGS-334/August 27, 2009
Economic Research Service, USDA

Price table 11—U.S. fresh-market herbs: Selected monthly wholesale prices in San Francisco, CA, 2007-08 Change from prev. year
Herb Unit April May June April May June April May June
--------------------------------- Dollars/unit -------------------------------------- ------------ Percent -------------
Anise 24-ct crtn 18.00 18.00 18.50 14.50 14.00 16.00 - 19.4 - 22.2 - 13.5Arrugula 12-ct flmbag 8.00 8.00 8.00 7.75 7.75 7.75 - 3.1 - 3.1 - 3.1Basil 12-ct flmbag 9.50 9.50 9.50 9.25 8.50 8.50 - 2.6 - 10.5 - 10.5Celeriac 12-ct ctns 12.50 12.50 12.50 12.00 12.00 12.00 - 4.0 - 4.0 - 4.0Chervil 12-ct flmbag 6.25 6.25 6.25 6.88 6.88 6.88 10.0 10.0 10.0Chives 12-ct flmbag 6.00 6.00 6.00 6.00 6.00 6.00 .0 .0 .0Cilantro 60-ct ctns 12.75 13.50 10.75 11.00 12.00 12.50 - 13.7 - 11.1 16.3Cipolinos 10-lb ctns 18.00 18.00 18.00 18.00 18.00 18.00 .0 .0 .0Dill 12-ct ctns 7.75 7.75 7.75 6.88 6.50 6.63 - 11.2 - 16.1 - 14.5Dry Eschallot 5-lb sack 5.88 5.78 5.88 5.50 5.50 5.50 - 6.5 1/ - 6.4Horseradish Per lb-bg 2.40 2.40 2.40 2.60 2.60 2.60 8.3 8.3 8.3Lemon grass Per lb-ctns 0.80 0.80 0.80 0.70 0.70 0.75 - 12.5 - 12.5 - 6.3Marjoram 12-ct flmbag 5.75 5.75 5.75 5.75 5.75 5.75 .0 .0 .0Oregano 12-ct flmbag 5.75 5.75 5.75 5.75 5.75 5.75 .0 .0 .0Rosemary 12-ct flmbag 5.75 5.75 5.75 5.75 5.75 5.75 .0 .0 .0Mint 12-ct ctns 8.00 8.00 8.00 8.50 7.50 7.50 6.3 - 6.3 - 6.3Sage 12-ct flmbag 5.75 5.75 5.75 5.66 5.66 5.66 1.6 1.6 1.6Salsify 5-1kg flmbg 30.00 30.00 30.00 34.00 34.00 34.00 13.3 13.3 13.3Savory 24-ct flmbag 5.75 5.75 5.75 5.75 5.66 5.66 .0 - 1.6 - 1.6Sorrel 12-ct flmbag 5.75 5.75 5.75 5.66 5.66 5.66 - 1.6 - 1.6 - 1.6Tarragon 12-ct flmbag 6.63 6.63 6.63 6.88 6.88 6.88 3.7 3.7 3.7Thyme 12-ct flmbag 5.75 5.75 5.75 5.66 5.66 5.66 - 1.6 - 1.6 - 1.6Verdolaga 36-ct crts 7.00 7.00 7.00 11.00 10.00 10.00 57.1 42.9 42.9Watercress 12-ct ctns 15.00 14.88 15.00 16.50 15.75 16.50 10.0 5.8 10.0
1/ Data not availableSource: Derived from data provided by USDA, Agricultural Marketing Service, FV Data Portal, http://marketnews.usda.gov/portal/fv
2008 2009
45Vegetables and Melons Outlook /VGS-334/August 27, 2009
Economic Research Service, USDA

Price table 12—U.S. fresh-market herbs: April-June average wholesale prices in Miami, FL, 2007-08
Herb Unit 2008 2009 Change--------------- Dollars/unit -------------- Percent
Anise 24-ct crtn 24.83 23.00 - 7.4Arrugula 30-ct-ctns 15.50 12.50 - 19.4Basil 12-ct ctns 4.00 3.75 - 6.3Celeriac 20-lb ct ctns 20.00 27.00 35.0Chervil 12-ct flmbag 12.50 7.25 - 42.0Chives 12-ct flmbag 6.00 5.50 - 8.3Cilantro 60-ct ctns 17.00 16.50 - 2.9Cipolinos 10-lb ctns 20.00 20.00 .0Dill 12-ct flmbag 7.00 6.00 - 14.3Dry Eschallot 5-lb sack 6.75 6.25 - 7.4Horseradish 5-lb bag 7.00 7.00 .0Lemon grass 12-ct flmbag 5.50 5.50 .0Marjoram 12-ct flmbag 5.00 5.00 .0Mint 12-ct flmbag 4.00 4.25 6.3Oregano 12-ct flmbag 4.50 4.50 .0Rosemary 12-ct flmbag 4.00 4.50 12.5Sage 12-ct flmbag 6.50 6.50 .0Savory 12-ct flmbag 5.75 6.00 4.3Sorrel 12-ct flmbag 8.00 8.00 .0Tarragon 12-ct flmbag 10.50 9.83 - 6.3Thyme 12-ct flmbag 4.17 3.75 - 10.0Watercress 12-ct ctns 5.08 5.75 13.1
Source: Derived from data provided by USDA, Agricultural Marketing Service, FV Data Portal, http://marketnews.usda.gov/portal/fv
46Vegetables and Melons Outlook /VGS-334/August 27, 2009
Economic Research Service, USDA

Price table 13—Farm-retail price spreads, 2006-09Annual 2008 2009
Item 2006 2007 2008 Sept Oct Nov Dec Jan Feb Mar
Market basket Retail cost (1982-84=100) 201.8 211.0 225.1 230.5 231.1 230.4 229.6 230.1 228.4 226.2 Farm value (1982-84=100) 119.5 142.3 147.4 149.8 142.2 141.3 134.3 130.5 123.1 122.4 Farm-retail spread (1982-84=100) 246.2 248.1 267.0 273.9 279.0 278.3 281.0 283.7 285.1 282.2 Farm value-retail cost (percent) 20.7 23.6 22.9 22.8 21.6 21.5 20.5 19.9 18.9 19.0
Fresh fruit Retail cost (1982-84=100) 350.6 367.6 381.8 395.1 386.9 375.7 372.6 365.2 360.6 352.9 Farm value (1982-84=100) 195.8 193.4 191.0 201.6 172.9 160.6 162.8 157.7 151.6 127.0 Farm-retail spread (1982-84=100) 422.1 448.1 469.9 484.5 485.7 475.0 469.5 461.0 457.1 457.2 Farm value-retail cost (percent) 17.6 16.6 15.8 16.1 14.1 13.5 13.8 13.6 13.3 11.4
Fresh vegetables Retail cost (1982-84=100) 283.0 293.5 309.8 311.3 314.5 319.3 315.8 320.2 311.8 305.7 Farm value (1982-84=100) 156.7 169.0 170.8 170.4 180.4 187.8 166.4 165.6 158.9 165.2 Farm-retail spread (1982-84=100) 347.9 357.4 381.3 383.8 383.4 386.9 392.6 399.7 390.4 378.0 Farm value-retail cost (percent) 18.8 19.6 18.7 18.6 19.5 20.0 17.9 17.6 17.3 18.3
Processed fruits and vegetables Retail cost (1982-84=100) 201.2 208.7 228.5 238.1 240.4 238.7 239.2 243.3 243.5 244.4 Farm value (1982-84=100) 140.1 151.0 164.8 165.8 165.1 164.1 161.7 161.0 160.3 160.5 Farm-retail spread (1982-84=100) 220.3 226.7 248.3 260.7 263.9 262.0 263.4 269.0 269.5 270.5 Farm value-retail cost (percent) 16.6 17.2 17.1 16.6 16.3 16.4 16.1 15.7 15.6 15.6
Fats and oils Retail cost (1982-84=100) 167.8 172.9 196.8 206.3 208.3 205.8 206.7 206.9 205.4 204.8 Farm value (1982-84=100) 101.9 150.9 207.2 202.5 154.2 141.1 135.0 145.5 137.2 124.2 Farm-retail spread (1982-84=100) 192.1 181.1 192.9 207.7 228.2 229.6 233.1 229.5 230.4 234.4 Farm value-retail cost (percent) 16.3 23.5 28.3 26.4 19.9 18.4 17.6 18.9 18.0 16.3Meat products Retail cost (1982-84=100) 188.9 195.0 201.8 208.1 209.7 208.0 206.9 205.8 205.8 204.0 Farm value (1982-84=100) 116.7 124.7 124.3 130.8 122.5 125.0 119.0 115.6 113.0 114.8 Farm-retail spread (1982-84=100) 263.0 267.1 281.3 287.4 299.2 293.2 297.1 298.2 301.0 295.7 Farm value-retail cost (percent) 31.3 32.4 31.2 31.8 29.6 30.4 29.1 28.5 27.8 28.5
Dairy products Retail cost (1982-84=100) 181.2 194.8 210.4 213.5 212.7 213.1 210.8 209.6 204.5 199.7 Farm value (1982-84=100) 101.7 152.9 145.4 145.5 139.8 136.5 124.1 107.9 95.1 95.8 Farm-retail spread (1982-84=100) 254.5 233.3 270.3 276.2 279.9 283.7 290.7 303.5 305.5 295.4 Farm value-retail cost (percent) 26.9 37.7 33.2 32.7 31.5 30.7 28.2 24.7 22.3 23.0
Poultry Retail cost (1982-84=100) 182.0 191.4 200.9 205.1 204.4 205.6 205.2 204.9 204.5 205.2 Farm value (1982-84=100) 128.5 154.8 155.4 154.1 153.2 153.2 151.6 151.3 149.9 144.8 Farm-retail spread (1982-84=100) 243.7 233.4 253.3 263.8 263.4 266.0 266.9 266.6 267.4 274.7 Farm value-retail cost (percent) 37.8 43.3 41.4 40.2 40.1 39.9 39.5 39.5 39.2 37.8
Eggs Retail cost (1982-84=100) 150.6 195.3 222.7 219.5 213.3 214.0 212.8 215.3 207.8 197.7 Farm value (1982-84=100) 69.5 136.3 160.6 147.1 152.8 153.6 147.8 154.0 109.8 110.5 Farm-retail spread (1982-84=100) 296.2 301.3 334.4 349.5 322.0 322.0 329.6 325.4 383.8 354.2 Farm value-retail cost (percent) 29.7 44.8 46.3 43.1 46.0 46.1 44.6 46.0 34.0 35.9
Cereal and bakery products Retail cost (1982-84=100) 213.0 222.1 244.9 250.9 252.8 252.7 253.1 254.4 254.2 253.7 Farm value (1982-84=100) 111.1 149.5 191.2 184.0 167.3 163.0 155.6 160.5 146.9 148.0 Farm-retail spread (1982-84=100) 227.2 232.2 252.3 260.2 264.7 265.2 266.7 267.5 269.2 268.5 Farm value-retail cost (percent) 6.4 8.2 9.6 9.0 8.1 7.9 7.5 7.7 7.1 7.1
1/ Retail costs are based on CPI-U of retail prices for domestically produced farm foods, published monthly by the Bureau of Labor Statistics (BLS).Farm value is the payment for the quantity of farm equivalent to the retail unit, less allowance for byproduct. Farm values are based on pricesat first point of sale, and may include marketing charges such as grading and packing for some commodities. The farm-retail spread, the difference between the retail value and farm value, represents charges for assembling, processing, transporting, and distributing.
Source: USDA, Economic Research Service, http://www.ers.usda.gov/publications/agoutlook/aotables/2009/07Jul/aotab08.xls
47Vegetables and Melons Outlook /VGS-334/August 27, 2009
Economic Research Service, USDA